| EU Commission's Energy Strategy for Europe | The Oil Drum: Europe | UK Inflation: the only way is up, baby |
Oilwatch Monthly - June 2008
Posted by Rembrandt on June 17, 2008 - 9:55am in The Oil Drum: Europe
The June 2008 edition of Oilwatch Monthly can be downloaded at this weblink (PDF, 1.42 MB, 21 pp).
A summary and latest graphics below the fold.
Latest Developments:
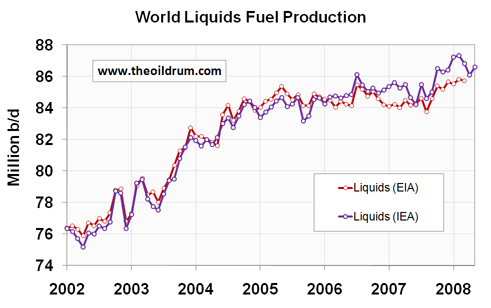
1) Total liquids - In May world production of total liquids increased by 490,000 barrels per day from April according to the latest figures of the International Energy Agency (IEA). Resulting in total world liquids production of 86.60 million b/d. Average global production in 2007 was 85.41 million b/d according to the IEA. In the first five months of 2008 an average of 86.82 million b/d was produced. The US Energy Information Administration (EIA) in their International Petroleum Monthly puts average global 2007 production at 84.55 million b/d and the first three months of 2008 at 85.70 million b/d.
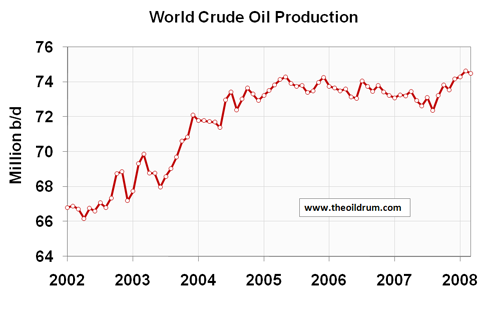
2) Conventional crude - Latest available figures from the Energy Information Administration (EIA) show that crude oil production including lease condensates decreased by 134,000 b/d from February to March. All time high crude oil production now stands at 74.63 million b/d in February 2008.
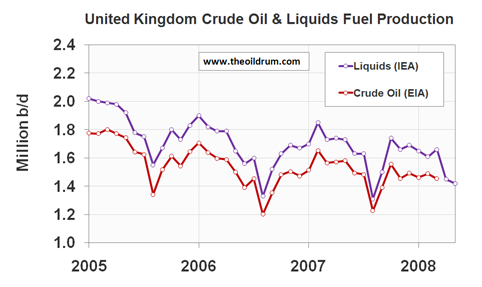
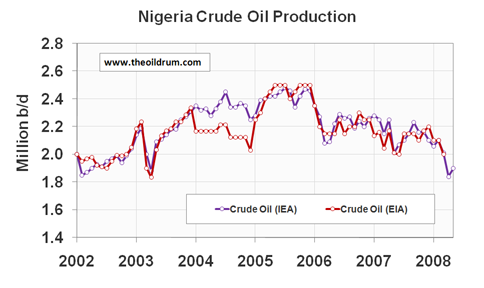
A selection of charts from this edition:


Personnel
Editors
Contributors
Peak Oil Primers
Archives
- November 2010 (3)
- October 2010 (6)
- September 2010 (4)
- August 2010 (7)
- July 2010 (6)
- June 2010 (7)
- May 2010 (2)
- April 2010 (8)
- March 2010 (4)
- February 2010 (6)
- January 2010 (3)
- December 2009 (5)
- November 2009 (8)
- October 2009 (12)
- September 2009 (6)
- August 2009 (5)
- July 2009 (11)
- June 2009 (8)
- May 2009 (16)
- April 2009 (10)
- March 2009 (7)
- February 2009 (10)
- January 2009 (15)
- December 2008 (9)
- November 2008 (9)
- October 2008 (9)
- September 2008 (13)
- August 2008 (10)
- July 2008 (14)
- June 2008 (23)
- May 2008 (16)
- April 2008 (12)
- March 2008 (16)
- February 2008 (9)
- January 2008 (13)
- December 2007 (13)
- November 2007 (16)
- October 2007 (22)
- September 2007 (8)
- August 2007 (9)
- July 2007 (16)
- June 2007 (8)
- May 2007 (7)
- April 2007 (7)
- March 2007 (10)
- February 2007 (10)
- January 2007 (12)
- December 2006 (9)
- November 2006 (15)
- October 2006 (4)
- September 2006 (5)
- August 2006 (5)
- July 2006 (9)
- June 2006 (5)
- May 2006 (10)
- April 2006 (9)
- March 2006 (13)
Vital Trivia
License

This work is licensed under a Creative Commons Attribution-Share Alike 3.0 United States License.
Good stuff, thanks. Anyone got any idea as to how much of the liquids is really double counting of stuff, like ethanol production which uses up a lot of oil, natural gas, and coal, and I calculate that it uses up more that most figure:
A review of studies by the National Resources Defense Council and Argonne National Laboratory regarding the net energy gain from the production of corn ethanol, reveals that some studies indicating some gain and one study indicates a net loss of energy. None of these studies, however, considers all of the energy inputs in all of the processes required to produce ethanol (mining and transport of ores, parts, equipment, heating of factories, all employees’ transportation and salaries (oil consumed in spending salaries), and maintenance, etc.). More at pages 21 and 31 of peak oil associates report --- I can't link my report as the editors will delete my post. Is it that they don't like me, or is it what I have to say :( ?
So, if you took corn ethanol out, what would liquids look like???
It's not just biofuels that require large energy inputs. In fact one of the central tenants of Peak Oil is that the second half of the worlds oil will require exponentially increasing energy inputs to extract, and still yield declining flow rates. And I don't just mean natural gas, coal, blah. It'll require more raw materials (steel, etc.) in the form of extraction/transport infrastructure like deep sea rigs or roads/pipelines for ever more distant wells.
So it's not just the Biofuel part of the liquids production estimates that are meaningless. It's everything in general, the conventional crude production statistics too. None of these even try to estimate on even a global basis what the the energy overhead for energy production is (the energy the energy sector gobbles up), and thus what the net liquids is (production available for other sectors of the global economy). I hear ERoEI figures of 5:1 for Tar Sands and 10:1 for Conventional crude thrown around but I don't know how accurate these may be. I suppose they give you some idea. But it'd be nice if ERoEI was taken seriously by the EIA and IEA. Although I realise how even the estimates for each nations' consumption are difficult to come to, let alone the consumption figures for each nation's energy sector, let alone complicated things like taking emergy into account in the ERoEI (such as the steel used in a rig for example).
So I think the question "if you took corn ethanol out, what would liquids look like???" is the wrong one. The question should be: "If you deducted the energy+emergy overhead for energy production from gross liquids, what net would you be left with?"
I'd say if you did that we'd have been on a decline in "net liquids' energy" since perhaps 2004. Although I'm no expert. Perhaps someone else could hazard a guess what net liquids' energy graphed from 1850 to 2008 would look like.
Thanks Rembrandt,
The most telling figure is that the non-opec ( presumably more market driven) production has not changed from 2004, with 300% increase in price!
The good news is that overall demand has also flattened with ONLY a 300% increase in price, even with China's economy growing at 10-11%.If you look at copper, nickel, iron ore, coking coal price increases have been much higher. I think this means that oil use is more elastic than some of those other commodities, and that substitutions (thermal coal, LNG, even wind) are occurring.
I think the reason for the price increases of other resources is that oil is used in the extraction and transportation of those resources. The energy needed to produce those resources has gone up and therefore the price of the resource has gone up even more.
While worldwide biofuels production may have reached something close to 1.5 miilion barrels per day, it might not be sustainable not only in terms of energy inputs, but also in terms of fertilizer. The phosphate and potassium deposits are finite and non-renewable. Todays high crop yields are not possible without these nutrients.
Sorry, thought I should check that 1.5 million barrel a day biofuels figure. Have picked up too many bad rumors on the internet. Once I read that ethanol had lowered the price of gasoline 15 cents. Later I thought, "...the price of gasoline went up a dollar."
Worldwide ethanol production in 2007 was reported to be about 13 billion gallons.
That is 848,000 barrels of ethanol per day.
World biodisel production is elusive but is probably about a billion gallons per year with growth limited by lower oilseed stocks.
Less than a million barrels per day (approx.) liquids production may be attributed to biofuels.
A net energy curve is what we need for near peak and post peak history. This is what is supplying the world's energy and setting prices, and it morphs dramatically as you go through the peak time frame. Each EIA report I see forces me to try to see in my mind's eye what these curves really mean in supplying our energy.
Yes, many here have called for data on net production in order to realistically assess the true magnitude of the oil/liquids problem. While we are at it, EIA and IEA should show net exports as well in order to even more accurately portray the problem that the consumer countries face. Anyway, the price at the pump should give people a clue without all this data that the public could care less about anyway.
Net exports captures some of the energy used in production, in that energy consumed to produce the oil never makes it to the export market. However, it doesn't capture non-oil energy inputs (e.g. natural gas used synthesize oil from tar sands), and it doesn't capture oil that is indirectly imported and used to produce oil, as when Brazil leases a deep-water drilling rig (i.e. the country that built the rig most likely used imported oil to build it).
Net energy decline is a huge issue, and it is going to be very difficult to quantify. IMO, the somewhat bloated numbers coming from the IEA actually represent a net energy decline, even as production records were being set. Analysis based solely on gross production is faulty analysis. To paraphrase what Euan wrote yesterday, any analysis that doesn't talk about net energy can be dismissed out of hand.
"Net energy decline is a huge issue, and it is going to be very difficult to quantify."
Just for kicks & giggles wouldn't' t it be possible to plug in the rate of net energy decline from 100 - 1 to 10 - 1 (picking some arbitrary date of when the bulk of this decline began, say 1990?) into the standard production graph which would obviously turn the line south?
Sorry I am not much of a wiggly line guy or I would try it myself.
@Cjwirth
Thanks for raising the issue of biofuels. I intend to add a chart next month which seperates biofuel production from other liquids production. This is easier than it seems because the data for biofuels is not separately available from one source.
Would it really make any difference to the trend if it remained consistent? The absolute volume of liquids is really pretty meaningless at an individual or even country level, it is the trend that matters. At the point that ERoEI for biofuels hits 1:1 would this not cause the trend to flatten somewhat anyway?
I think that the removal of biofuels will change the curves significantly. If you look at the crude oil production levels you see that the trend is down for almost all. Yet world liquids production keeps rising.
Also world oil production is rising slightly or remaining level. Why is that so ? If the trend for most oil producing countries is down? Where is the oil coming from?
That's my question too. Just examining the charts by eye, you see about a 2 mpd increase in total liquids in 2007, and about a 1 mpd increase in crude oil production. Yet, the only producer in that period that raised it's crude oil production was the KSA which raised it about 0.6 or 0.7 mpd. We've still got 1.4 or 1.3 mpd of liquids to account for. My understanding is that a lot of the extra liquids is some froth that comes up with the gas caps on older reservoirs and condensate from those as well as natural gas wells. Well it must be, otherwise it would show up in the crude oil production curves, but we're still missing some of that too since the crude oil production is higher than just KSA's contribution.
Just a guess: Angola might be taking up some of the slack and providing some substantial portion of those "missing" barrels. Iraq as well seems to be calming down and outputting more oil these days.
Biofuels will account for 63 percent of oil supply growth from non OPEC countries this year, taking global production of crop-based fuel to more than 1.5 million barrels a day, the IEA said today.
http://www.worldwideag.net/index2.php?option=com_content&do_pdf=1&id=1267
Yes, you've certainly identified a significant flaw in the "total liquids" methodology. It is probably still an important metric to track. The thing that really angers me, though, is when people trumpet new record highs in total liquids as proof that PO is a non issue, etc., with no regard whatsoever for the net energy issue. It is intellictual dishonesty, to say the least, and highly obfuscatory and misleading.
I agree, it's irritating, but it's also a framing issue that peak oilers have brought on themselves by obsessing over the timing of the peak. In my opinion, we need to drop the phrase and concept of "peak oil" and start talking about eroei and flow rates (as many contributors to TOD have convinced me with their excellent analyses). You know, although this Rembrandt chap does an amazing job tracking oil output, maybe somebody else can conduct a monthly "sub-analysis". To really "sell" the problem, in this "sub-analysis" I would restrict my liquids output graphs to just one for the entire world, then I would plot the following graphs: 1. Amount of oil/liquids on the export market as a function of time (oil price in the background), 2. a graph of oil/liquids importers (# of countries and approximate volumes and a function of time), and 3. overall liquids combined eroei as a function of time (with oil price in the background). Graphs 1. and 2. capture the "real" issue: more and more countries bidding for a diminishing "pot" of market oil. Graph 3 captures the effects of Canadian tar sands and biofuels in the mix. Yes, liquids are going up, but eroei must surely be going to hell.
In my view the Export Land Model is the only relevant point of reference. As was suggested, falling energy return will be reflected somewhat in declining exports. But really, what matters most is the volume of oil and refined petroleum products available on the global market.
When people are really committed to their point of view (i.e. their foot is nailed to the floor), they will find any evidence to substantiate their point.
People not wanting to accept peak oil is not just an evidence thing, it's a psychology thing, too.
I suspect that no amount of slicing and dicing and framing would make a difference for some people.
For example, look at the overwhelming evidence for global warming and there are still people who grasp at the flimsiest, narrowist counter-evidence often because of their ego or they are confronted by something or they have come to identify themselves as their point of view and thus have no detachment from the topic.
It's the same human phenomenon seen when someone says, "I'm a miner, that's all I know how to do." ("Miner" is just an example; I don't mean to single them out.) The person who says that has no distance between the set of behaviors and thinking that constitute "a miner." "Knowing who you are," though completely fictitious beyond being a human, is very comfortable.
Stepping outside of that requires being uncomfortable, and many (most?) humans don't like that very much. Just look at how we react when we hear an opinion different than our own. We sometimes go ballistic. We aren't able to relate to different points of view as simply different points of view without identifying with them and then feeling threatened by others that are different from the ones we've adopted.
This is one of our greatest weaknesses — and one of our greatest strengths.
-André
www.postpeakliving.com
I see your point, I partially agree and I also disagree. I can give you a couple of examples of successful framing, and see what you think: Actually, I'll take one example. "Waterboarding," a totally new word introduced by Dershowitz (sp?) in 2004 to describe the act of torture involving controlled drowning of the victim. Those in power call it "simulated drowning," but in fact it is "simulated death." (I'm semi-quoting from a commondreams article written by a framing expert whose name I forget and am too lazy to go and look up.) How comfortable do you feel about waterboarding? Probably most people haven't given it too much thought and are reasonably comfortable with it as a "harsh interrogation technique". But these people would change their minds instantly if they experienced it themselves or saw a video of somebody being waterboarded (water tortured). With the right framing you can get people to believe and accept almost anything. Watch Derren Brown on you tube if you don't believe me.
I can't speak on the IEA numbers, but it seems that beginning in 2007, the EIA was not going to double count EtOH production from the standpoint of oil used in the production cycle.
In other words if it took 100,000 BOE to produce 150,000 BOE of EtOH, the EIA would not report it as 250,000 BOE production but rather only 50,000 BOE production. I remember seeing that in one of the EIA news releases or perhaps it was the Change Notes at the front of the IPM.
Oh ok. So I suppose they are sort of giving the net for conventional crude and condensates? That's good I suppose.
I find it fascinating that the totals for the EIA and IEA consistently follow similar patterns, however the IEA always estimate higher totals for every category. I'd love to take the two people at those agencies that put all the final numbers together, put them in the same room and not let them out until they reached a concensus figure.
Not withstanding any change that may or may not occur in that regard, it looks like if you discount other liquids based on a lower EROEI, then world production appears to have stagnated over the past 3-4 years, depending on whether 04 or 05 is picked at the initiation of peak plateau.
As supply lags behind demand, price angles ever higher. In that sense we can now claim a view from the Peak. Even if production can be kept in the current realm, increased demand will render concepts of Peak as irrelavent, as we scramble to source more energy from any source available.
It seems that before IEA data are lower than IEA, but after 2006 IEA reports higher amounts compared to EIA.
Was there any change in methodology? Also the reported totals for 2007 have a big difference between the two agencies, almost 1 MBD.
If you to choose between the lower firgure IEA or the EIA for the higher figure, goven the price increases we've seen recently I don't see how we can even tust the EIA.
Marco.
How about adding a graph for Net Exports, to illustrate the ELM?
@n0gw
It would be a good idea and there already is a graph with a net export proxy estimate in the Oilwatch Monthly. I am going to spend some time to make this data more detailed in the coming month since I have some more time available in the summer period.
So 2005 peak busted nonetheless?
Certainly on a monthly basis, but our historical analogues are based on annual data. The initial Lower 48 decline, after two years, was quite low, -0.8%/year. The world decline rate at the end of 2007, relative to 2005, was similar, -0.3%/year (EIA, C+C). We of course don't yet have the annual data for 2008. Also, the world data include unconventional production, which Deffeyes was not modeling. Subtracting out unconventional, it's a pretty good bet that conventional crude oil production peaked in 2005, even on a monthly basis.
But of course, as I have endlessly argued, what counts from the point of view of importers is net oil exports. To put the planned (hoped for) increase in Saudi production in perspective, their domestic consumption in 2008 will probably be up by about 500,000 bpd over their 2005 rate. And I estimate that their 2008 annual rate of production will be below their annual 2005 rate. If this is the case, they will have shown three straight years of lower production, relative to 2005, at about the same stage of depletion at which the prior swing producer, Texas, started declining (based on the logistic, or HL, models).
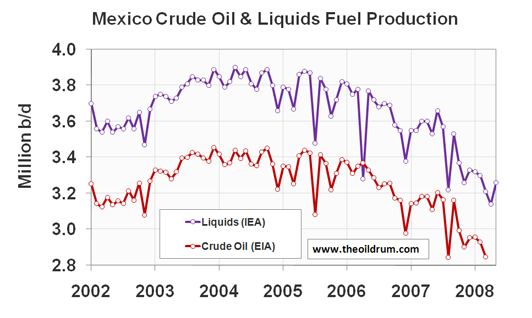
BTW, take a look at the production chart for Mexico. Venezuela & Mexico combined have shown, from 10/07 to 3/08 (last data available) an annualized decline rate of -32%/year in the volume of petroleum delivered to US shores. Venezuela has shown a long term 10 year decline in net oil exports. Mexico is on the express train to zero net oil exports.
And take a look at the Russian graph. Europe has its own problems with fast declines from Proximal Petroleum Producers. Our (Khebab/Brown) middle case is that Norway and Russia will approach zero net oil exports around 2025.
In a word: yes.
Westexas will like to tell you that it's year.on.year that counts, but that's completely arbitrarily and will only help him as long as 2008 won't end.
But, more surprisingly, if you only count year on year average, you'll see that 2005 wasn't the best of years just by looking at the graphs itself. In fact, from the IEA itself, what do we see?
Hmmm, I am unable to understand where the "2005 peak" lies...
But I'm sure that IEA is unreliable and should not be trusted. Just trust westexas instead.
Several points.
Matt Simmons is of the opinion that the boost in Total Liquids production is heavily influenced by operators blowing down gas caps in oil fields that are in the terminal stages of depletion, and Euan has provided some North Sea examples.
We do have some degree of difference between the EIA and IEA Total Liquds data bases, with the EIA showing three straight years flat at about 85 mbpd, and we of course don't have the annual 2008 data yet.
Regarding crude + condensate, is is a pretty important metric for refiners, since about 98% of the input input refineries is crude oil, and the index price used worldwide is for crude oil, not propane.
Regarding the average annual data, if a country produces 10 mbd in January, and then 5 mbpd for the rest of the year, are you arguing that the key number is the 10 mbpd rate? I would argue that the average rate of 5.4 mbpd is more indicative of what happened.
My key point is as follows: "But of course, as I have endlessly argued, what counts from the point of view of importers is net oil exports."
Precisely what point are you trying to make? That we should rush out and buy SUV's before the price goes back up?
Many of the North Sea fields developed in the 1970s are now blowing the gas cap. One example is Statfjord, which started to blow the gas cap this late 2007. This field had an exceptionaly high recovery factor, but now it is near empty. This is the case or will soon be the case for the majority of North sea giant fields.
Westexas:
So, why do you argue that month "x" in 2005 is the all-time peak?
Why do you take the arbitrary number "12" as a more indicative number of what's going on, instead of, perhaps "30", which is the number of days in most months?
Why should we take a "year" as an indicative? I've the answer to that one: because 2008 is still in its 2nd quarter, so you have given yourself 2 quarters of "I'ven't been wronged yet" talk. I hope you have, but time will tell.
Which is fair game to mention, but it implies that the real reason for high oil prices is the lack of adapted refineries and not the lack of energy resources.
Globalization means that we are all in this together. If anything, this means that our main problem is in our surging demand side, not on supply side.
That oil watch monthly just spreads the bad news because theoildrum.com seems focused on creeping out of its readers, rather than informing them. Why only show the declining graphs, if that's not the case? That you don't ackowledge your own mistakes. That whoever comes here and shouts "doom! doom!" is respectfully treated, but whoever says "come on now, that's not that bad" is treated as a troll or as an ignorant.
And before you treat me as an obnoxious snobbist SUV driver, I must tell you that I'm paying 8.5 dollars a gallon for my gas, earning little less than 1000$ a month, and I survive quite well with my Opel Corsa and soon-to-be GPL driven, thank you very much.
Luis, the attacks of late have been histrionic, non-productive and, frankly, pointless. Unfortunately, your post is more of the same. This isn't what I've come to expect from your posts. I sense a sort of division building here that the cornucopians, for lack of a better word, seem to be fostering here recently.
You make several errant comments, imho. One, you are nitpicking this issue of claims of peak. I'm sorry, but I don't see claims, I see statements of fact, at least as far as the "facts" take us. We all know the data is fuzzy. Since we all DO know that, I don't understand beating each other up over them. I've read a hell of a lot of WT's posts, and have never had the feeling of absolute certitude you seem to think he has stated. He always does a fair and reasonable hedging wrt future conditions. Does he trust his data? Sure. Why not? It's proving accurate so far. I trust it, too. Not because it's WT, just because the model makes sense and the numbers seem to be supporting it.
Second, you say the problem is mainly on the demand side. This is a false statement. As long as population continues to rise, flow rates will matter. hell, even if they just stay steady, they will STILL matter because there is only so much of the stuff. It is important to look further into the future than the next few years. Decades is too little, imo. We need to think of what the world will need in terms of energy hundreds of years from now. Imagine, if we use up all the relatively cheap and accessible oil without finding adequate replacements, future generations may not have the means to deal with future challenges.
Also, the exporters almost certainly WILL act selfishly. This is survival, friend. People share when it means surviving... but they also hoard for the same reason. We do not know which way it will go. You are making a big assumption, and one that is highly idealistic.
Also, to say it's all only bad news is not, imo, intentional. It simply reflects the reality.
Chill out. You say we are all in this together. Act like it.
Cheers
One can get more detail on this for the US at the EIA's page on refinery and blender inputs.
Total inputs in 2007 were 16,957kb/d. NGLs were 497kb/d, or 2.9%, and ethanol was 370kb/d, or 2.2%. So crude oil was at most 94.9% of refinery and blender inputs on a volumetric basis, or ~97% on an energetic basis. The proportion of non-crude blender and refinery inputs has been rising since the late 90s, from a low of 2.6% in 1999 to a high of 5.1% last year.
Of course, mostly this just tells us that most of the NGLs consumed don't need to be treated at a refinery before being used by a customer. If 9% of world oil supply makes up only 3% of refinery inputs, the obvious conclusion is that the rest of it can be used without having to go through those refineries. That doesn't make it less useful; indeed, probably the reverse.
Reposting from downthread
The all time peak for conventional oil (black goo that comes out of a hole in the ground) remains May, 2005. The stats for crude oil include tar sands, which is unconventional oil.
All liquids includes ethanol and NGL which are lower energy/volume and are only partial and imperfect substitutes for crude oil.
I have gone from agnostic between Early & Late Peak to "probably Early Peak'. Every month that goes by confirms May, 2005 (although a couple of later months got to within statistical noise of May, 2005 and a spike for a quarter or two is still possible due to above ground factors (peace in Iraq & Nigeria, Saudis release oil from storage for political reasons and call it production).
Alan
Oil sands production increased from 175,000m^3 in 2005 to 184,000m^3 in 2007, for an increase of 0.06Mb/d.
The increase in oil sands production is not responsible for the increase in C+C production since 2005. If you want to keep claiming it, find some evidence to back up your belief.
Every month this year has been higher than May 2005, both for oil supply and for C+C, regardless of whether you look at EIA or IEA data.
It does nobody any favours to continue pretending that May 2005 was in any way special. In fact, it never did.
May 2005 was the conventional oil peak per last month's discussion.
http://europe.theoildrum.com/node/4018#comment-349101
By reputation economics, I will take Khebab's analysis (although the delta is in the statistical noise range).
Your links appear to be bad (I was lead to a blank screen) and I do not have the time or inclination to research it further.
So May 2005 is an "unsurpassed" month for conventional oil production AFAIK.
Alan
Then last month's discussion was wrong.
No data was offered, other than eyeballing of a chart. As compared to verifiable production data showing an increase of 0.06Mb/d from 2005 to 2007, "eyeballing a chart" is less than authoritative.
Oil sands production has gone up 0.06Mb/d since 2005. C+C has gone up 0.67Mb/d since 2005, and 0.17Mb/d since May 2005, meaning oil sands represents a third of that change.
Think I'm wrong? Dig up the monthly oil sands production data and prove it. Considering Canada's C+C production for May 2005 showed no particular spike up, and was 0.2Mb/d lower than current production, it's pretty unlikely.
The first link is a PDF, which was probably your problem. You can tell what it will be by mousing over it and looking down at the status bar on your browser, which will display the URL.
I don't think Canada's National Energy Board has that document in HTML, though, so I can't offer an alternative link.
Closing your ears doesn't change reality.
Come on, you're better than that.
Crude production has gone from 72 to 74.63 in the last year. Where did it all come from? Saudi looks to be up about 500,000, but Russia, Mexico, UK, US, Nigeria, and the rest of non-OPEC is all down. Where did the additional 2 mil come from?
psssst!!! Don't say that Out Loud, man. The Word must spread out loud, and the Word is about impending doom and descent to olduvai. Don't stray. Don't deviate. Inconsistencies, if you find them, are only in your head, and nowhere else.
Now go and preach PO.
That's a good boy.
And as noted up the thread, on average (see my 10 mbpd & 5 mbpd analogy) refiners saw slight declines in crude oil supplies in 2006 and 2007. And we simply don't know what the annual 2008 data will show. Meanwhile, the available data do suggest an accelerating net oil export decline rate.
BTW, another way to express the crude oil shortfall is the cumulative difference between what the world would have produced at the 5/05 rate and what was actually produced. If memory serves, the cumulative shortfall is in excess of 700 mb, while oil prices have increased from $50 to over $130. We saw a slight decline in the shortfall in the first quarter, but we shall see what happens in all of 2008.
But the macro picture is the depletion effect. If we use a middle case of -6%/year from existing wells, from 2005 to 2017 the world will need about 37 mbpd of new crude oil production, just to keep production flat.
OPEC increased production and stated they were working on trying to build five million barrels per day of more capacity. Iraq alone might be capable of producing 2 million barrels per day more; five years from now. Some of the mega-oil-projects people admitted they were unable to forecast the cumulative affects of small projects. Angola, Sudan, Iraq, Azerbajain, Kazakhstan, UAE, Saudi Arabia, Iran, Libya, Brazil, Canada, Vietnam and China have all been increasing production, am sure there may be more that have added production on a YOY basis. One article by a Peak Oil author I saw recently indicated 60 of 98 countries were experiencing declining oil production. The United States is likely to show a YOY increase with Thunderhorse. The Thunderhorse discovery well was drilled in 1999 in deep waters. From discovery well to first production--about 9 years, the well was spudded on Jan. 1, 1999. The United States once produced more oil than Saudi Arabia is producing. Someone expected that if the Alaska ANWR were opened this year it might take ten years to get it permitted and producing. With double digit growth in the deep drilling rig fleet, more deep offshore projects are sure to come.
And I am developing several oil and gas fields in Texas, 36 years after we peaked. Alert the media. The crisis is over. However, Peak Oil does not mean that we stop finding oil. It means that we can't fully offset the declines of the old, large fields. If Ghawar is in decline, which I think that it is, every oil field that has ever produced one mbpd or more of crude oil is now in decline.
Regarding Thunderhorse, which will probably show a short period of peak production, and then a rapid decline, just the recent (not total) decline in exports from VenMex is probably about twice the peak production rate from Thunderhorse.
Interesting use of a non-existent quote to shore up your debating skills, WT. Some things never change: and putting words into peoples mouths seems to be your forte recently! Not only that but you have frequently moved the goal post ahead. What happens if 2008 shows a higher total average C+C production than 2005? Will we say its the 2 year moving average that matters? The 3 year moving average? 5? How far must you take this before you personally can admit that you were wrong this time 'though you will eventually be right I'm sure'.
I don't think anyone that frequents TOD has been saying that an increase in global oil, total liquids or otherwise, 'disproves' peak oil. More accurately, the self-critical person would interpreted such lines as 'We, the Peak Oil community, have once again jumped the gun too soon in calling for a peak in 2005.' No logical person believes that a finite resource can grow indefinitely. The only real debate should be on how to address peak in the best manner possible.
If this sounds vaguely familiar to some of you, I believe that Brandon may have been formerly known as "Hothgor."
Actually the world peak is Deffeyes' prediction (although I agree with him), and he put it between 2004 and 2008, most likely in 2005 (an erroneous observation does not count as a "prediction"). And my point is that we don't yet know what the annual EIA data will show for 2008. We do know that the EIA data show two years of slow annual declines (C+C), much like the initial Lower 48 decline.
My principal area of study has been on net oil exports, where we have seen two years of declines, and our available data suggest that the net export decline rate is, as we expected, accelerating.
Regarding the blockquote, I was of course quoting myself.
Absolutely, I am 'Hothgor' and I've been 'lurking' here for many many months. My name was a clever ruse to fool you all!!! Never mind the fact my name and location was known back then of course :P Your conversation with Dave was most enlightening!!!
Now that the un-pleasantries are out of the way, how do you reconcile your past statements that KSA was in permanent decline with the fact that next months production will eclipse their previous 'modern not historic' peak. I know you are in a difficult conundrum with reconciling these differences, but did I or did I not warn you that their HL was far to noisy to be making any production claims at the time?
I know you like to avoid answering questions directly, but let me ask you this:
What production level and for how long must KSA demonstrate that level before you admit that you were wrong AT THE TIME? One month? A 3 month average? A year? Does that year have to be January to December or can it be a running average such as March to February? Put the goal post down now, without conditions!!!
Apparently, you take considerable pride in that fact that your prior behavior was so obnoxious that you were banned. Congratulations.
What is necessary to reverse a decline, IMO, is to match the previous peak and then either show stable or increasing production from there. Most post-peak producing regions have shown, or will show, temporary production increases to levels below their production peaks, e.g., the Lower 48.
And in fact, I started discussing the probability of an increase in Saudi production in March, 2007. "Albeit to a level well below the 2005 rate" is I believe the way I put it. This was in response to a comment by Stuart that the Saudi decline was too steep for the HL model to be correct (resulting in my comment that we would probably see a steep decline, followed by a rebound, to a level below the 2005 peak).
Regarding the "goal post," calendar years, January to December, works for me.
So, what is the point of going over this again and again? Saudi Arabia will either show an annual rate of 9.6 mbpd or more (C+C) in 2008, or they won't. Mathematically, I think that it is highly unlikely, which would, if I am correct, mean three straight years of production below their 2005 rate, at about the same stage of depletion at which the prior swing producer, Texas, started declining.
No, Sir, that is not why he was banned.
He was banned because Leanan decided to do it. Leanan did it because you and your groupies pressured her.
Brandon was never obnoxious. Never. Never.
I defy you to present some evidence.
You are behind the bannings of
Brandon
Freddy Hutter
Oil CEO
and countless others
We all know the truth. You can get back to your quantitative analysis and theories.
Sorry, but I didn't pressure anyone.
Well just reading some of Brandonfromeasttexas' posts today gave me the distinct impression he was na troll because of his obnoxious posts. He's not going to convince anyone of anything with that attitude, and neither are you with yours.
westexas, I don't want to get into an argument over when exactly the peak was, because it's not that important. We all know that it's this decade or next sometime.
But.
You have to go with the data as it is presented. If you are getting monthly data, then the month with the highest production is the peak month. If you are getting daily data, then the day with the highest production is the peak day. Etc.
I think averaging the data over a fixed period like january to december is a faulty method. If you really have to average the data, a moving average will give you a more accurate peak date.
Ultimately, who is our audience? Each other? No. It is the decision-makers and the general public. In both cases, there are far too many who won't have an intuitive sense of what a moving average is. Yearly averages are far more easily communicated, so may be most useful in the long run. I see no reason why all the methods you mention can't be included in any given post.
E.g.
"The peak month is May '05.
The peak year is 2008.
The peak moving average is Sept. '08."
Cheers
That seems to be the problem. I would like to see some sort of unified way of expressing these things. With different analysts having diferent methods, producing different results, it makes us all look confused.
We need to come up with the equivalent of the IPCC report, probably through ASPO, which (nearly) all analysts agree on, about the causes, dates(vague), and effects, of Peak Oil.
Then it will be taken seriously.
Looking at daily or monthly figures is not appropriate both because it is more difficult to get accurate data as things like undocumented releases from reserves are difficult to track and because a temporary spike is not relly relevant to use or production.
Although theoretically a moving average can sound nice, in practise yearly totals work well. That is why company accounts are presented that way.
Errors average and a convenient overview is presented, although the exact dates are always to some extent arbitrary.
Demographics, for a start, uses annual data by year, and it would seem the easiest and most functional way of looking at petroleum production.
The quote's from his own post further up the thread.
The all time peak for conventional oil (black goo that comes out of a hole in the ground) remains May, 2005. The stats for crude oil include tar sands, which is unconventional oil.
I have gone from agnostic between Early & Late Peak to "probably Early Peak'. Every month that goes by confirms May, 2005 (although a couple of later months got to within statistical noise of May, 2005 and a spike for a quarter or two is still possible due to above ground factors (peace in Iraq & Nigeria, Saudis release oil from storage for political reasons and call it production).
Alan
I guess you're the resident goofball.
For the folks out there with two or more grey cells to rub together, has anyone a link to a graph showing the trend in total joules/btu's (liquids) over time?
Gee, thanks for your kind word.
Other than being nasty to WT - what exactly are you getting at? Are you stating that peak oil is false? are you stating it just hasn't happened yet? - if you believe that oil production (c&c - not all the other garbage that they like to count these days) hasn't peaked - what is YOUR view on the timing?
Should I ignore WT's idea of economizing, localizing and producing? Is this a good time to purchase a Humvee, a big exburban house and get into furniture sales because there's going to be a big glut of oil coming down the line and prices will collapse?
And do you think I should ignore the effects of increased consumption in China, India and the oil-producing countries like SA? Inquiring minds want to know - so be a "good boy" and help a guy out now that you have shown up WT in all your unpleasantness.
C&C is just as garbage coming out as anything else. Why should I care about C&C? Has it magical properties Harry Potter style that I'm unaware about? No. It's energy. It goes into liquids. Period. So why should I bother about C&C? Yeah, that's right, I shouldn't.
Man, you should do whatever pleases you. Really. I am all to economize. I'm not that fond of localize and produce unless it is a part of a grand plan of big scale production. "Cooperatives", we call it in our country. Sounds intelligent.
You're not an inquiry mind. You are a pissed-off scared man who has been informed that the planet is due to total collapse in less than two decades, and that you should conform to its consequences. Now, first one is, economize!
Seriously, all I see in this monthly review is that a lot of countries have passed its peak! How horrible! How mind blowing! We're fast forwarded into sheer declines! ... but... wait... the total figure is up! How can THAT be?
I don't understand the childishness. Are you of the opinion that all liquids are equal? There seems to be some confusion as to whether the "crude" in the numbers you cited are actually crude, or include such sources as tar sands. The two are not equal in terms of net energy, so are essentially different products.
Until the IEA, EIA, etc., start labeling their graphs and explaining their data in clear terms this debate will go on.
As for the snarky olduvai comment: collapse happens. Has happened all through history. Will happen again. To ignore this is either arrogance (man trumps all!) or stupidity (you just don't understand some very basic science/history).
What is it with the cannibalistic attacks lately?
BTW, Table 4.1d shows:
2005 Average 73.806
2006 Average 73.538
2007 Average 73.240
That's a decline of .004 a year. Peak is 2005... so far.
Cheers
Why aren't all liquids equal? Do you suffer from racism or something? Does it not end up being gasoline and everything else? Is it not composed of Hydrogen and Carbon, being hydrogen what really matters? Why should I freak out of something completely arbitrary that you call "C&C", if there are no major effects to it?
Other stuff is always happening everyday. So what? Life moves on. But to be a complete Cassandra all the time pretending you're some kind of obscure scientist who "has figured it out", won't ever be a good candidate to my friendship.
Who?
Mind blowing. Specially if you remember that WT is always talking about texas and its 0.8% decline and how it is similar to the world and saudi arabia. Forget the fact that 0.8 is 200 times greater than 0.004, and that SA is plumbing more 500.000 barrels this month. Forget many things in fact. Amnesia is good for the follower.
There are three main reasons I see at various times, only one of which is good.
The good reason is that natural gas liquids - the overwhelming majority of the "other liquids" category - has a lower energy density per barrel that crude does. It's something of an arbitrary distinction, as condensate also has a lower energy density per barrel than crude, although not as low as NGL. Condensates are usually reported together with crude ("C+C"), though, so there's not much that can be done about that.
Effectively, it's kind of a crude attempt to control for energy density. It misses a great deal, though, as NGLs directly substitute for C+C in a number of applications, such as gasoline (NGL contains "natural gasoline") and ethylene feedstocks (plastics). More NGL is, functionally, very similar to more crude.
The first bad reason is that "other liquids" like ethanol have a low EROEI. That is, unfortunately, largely irrelevant (since 80% of those liquids are NGLs which are produced much like crude, and have much the same EROEI), misinformed (the other big ethanol producer, Brazil, has quite high EROEI), and misleading (the primary energy input to US ethanol, natural-gas-derived fertilizer, is a gas, and so cannot reasonably be subtracted from liquid fuels).
The other bad reason is simply that oil supply (aka "all liquids") is going up, whereas the speaker wants something that's going down to avoid having to reexamine their beliefs, so they find the nearest set of numbers that's doing what they want and proclaim it the "real" data. I trust it's clear why that's not good.
***
Converting liquid fuels to an energy-normalized version is quite reasonable, in which case it would probably make sense to discuss liquid fuels production in tons, rather than barrels, as the energy densities are much closer in mass than volumetric terms. Accounting for internal consumption is also reasonable, provided data can be acquired to make a meaningful comparison (i.e., it's pointless to obsess over the 0.5% that comes from US ethanol if there's no data for the 80% that comes from C+C).
It's not, however, reasonable to subtract non-liquid energy sources from the quantity of liquid fuels. Saying "we need to include other energy sources, but only if they make the number smaller" is nothing more than cooking the books to come up with a number you like better.
"Oil supply" is a measure of available liquid fuels, not a measure of available energy. They're both useful, but they're not the same thing. The bizarre "we'll count other energy only if we can subtract it" measure is neither one of these, and is not useful at all.
I haven't called you a dumbass piece of shit, so would appreciate in kind behavior. The fact is that I have a six month-old son so I want an energy emergency like I want a hole in my head... so keep a respectful tongue and your bile to yourself.
I would be glad to see oil rising, but we don't. We see liquids rising. Despite your treatise above, you've given nothing but opinion. Break your claims down with verifiable numbers and you'll get my attention. You see, it is self-evident, as you say yourself, that all fuels are not created equally. Your primary mistake is not that you say we shouldn't worry about it as they are close enough, however. It is that you fail to mention the real problem: use. The energy contained can be dealt with fairly well, I think, by efficiency and conservation. What is harder to manage is matching the great utility of oil. There is nothing that replaces it 1 to 1. Nothing. Unanticipated problems wit this issue *will* pop up. This is a guarantee informed by the simple realities of complexity theory and chaos theory.
I will be the happiest guy on the planet if bacteria can shit 100,000,000 barrels of oil a day, believe you me, but am not willing to bet my son's life on it.
So, go misrepresent someone else's words.
Nice respect you show yourself just there, ccpo. I live in a country where I pay 8.5 dollars a gallon and I do have a 18 month year old son. I learnt about PO in the same week that I learnt about my son, go figure.
So remember that other people have lives to lose too. That doesn't work as a scapegoat for these issues. I understand the energy density issue, and I'll keep that in mind. It's a good issue. But I was referring to the obvious last one, which is why I usually turn off my brain when reading most of theoildrum posts...
I was talking neither to you nor about you, so your self-esteem issues are not my problem.
The IEA and EIA disagree with you. Both sets of data say 2008 has seen record oil supply, and record C+C. If you haven't seen oil rising, you haven't been looking.
Unsurprisingly, you're quite wrong. Some verifiable facts I've used above:
A few minutes on Google will let you confirm these facts for yourself; I know that because I've linked evidence for each and every one of them on this site.
Go look them up; I'll wait.
Done? Good. Now, let's look at the verifiable facts you have provided:
You have rather a poor platform from which to argue.
Your primary problem appears to be reading comprehension, as I have never said that.
In fact, I said the opposite, or did you fail to understand what "[c]onverting liquid fuels to an energy-normalized version is quite reasonable" meant?
So? Boilers didn't replace masts 1-to-1, but steamships still replaced sailing ships.
With the possible exceptions of air and sea travel, there's nothing oil does which we cannot already functionally replace. Electric cars, trolleys, and rail might not be as good as gasoline cars - or might be better, depending on your personal preferences - but they're functionally equivalent. Chemical feedstocks can come from coal or biomass, either via conversion to hydrocarbons (e.g., gasification + Fischer-Tropsch) or directly.
Replacing oil is not about finding something else to put in gas tanks.
Hi,
Surely we are not talking about significant differences here?
AFAIK there has been more or less a plateau of production from 2005-8, whilst potential demand has increased, hence the current rise in prices.
Is this fair comment from your POV?
There seems to be an awful lot of energy expended around here of late to identify the precise peak, when the overall situation seems clear.
Yes and no.
I agree with you that the differences in terms of oil production statistics aren't significant. Whether one takes EIA data, IEA data, oil supply, C+C, oil supply (tons), oil supply (energy adjusted), or something else reasonable, the basic story remains the same, namely that demand has risen quickly and supply has been sluggish. Whether "sluggish" means "very slow decline" or "modest increase" is more-or-less beside the point.
What I do think is significant is how one chooses one's data. Any of the above choices are defensible, although some (energy-adjusted) are better than others (C+C). What is not defensible, however, is choosing data based on whether it "sounds right" - confirmation bias is very important to watch out for, and does seem to be lurking in discussions here, at least occasionally.
So, yes, I think you're right that people who are looking critically at the data will be largely on the same page in terms of recent history. The differences, I think, come from interpreting that history and using it to project into the future.
Heaven knows why.
Fixating on a particular month was a useless thing to do when it was the highest production month, and it's a useless thing to do now that higher months have been recorded. And it would be a useless thing to do to pick a new month.
Demand is strong. Supply is weak. Both will be true in the near future. The rest is largely squabbling over details - those alone are enough to justify significant efforts in reducing oil dependency, at least in my opinion.
No such increase, and for the actual increase, no conundrum.
From the EIA May 2008 International Petroleum Monthly (Posted: June 9, 2008)
http://www.eia.doe.gov/ipm/supply.html
World Crude Oil Production (Including Lease Condensate), Tables 1.1a to 1.1d
Timeframe --- World - OPEC
2006 Average 73.539 32.610
2007 Average 73.240 32.174
2008 3mo Av. 74.472 33.470
3mo increase +1.232 +1.296
So the 1Q08 world increase came from OPEC, and the contributing OPEC countries were:
Timeframe - Angola - KSA - Iran - Iraq - Kuw - UAE
2007 Average 1.744 8.722 3.912 2.086 2.464 2.603
2008 3mo Av. 1.997 9.200 4.000 2.252 2.583 2.709
3mo increase 0.253 0.478 0.088 0.166 0.119 0.106
The 6 countries account for an increase of 1.210 Mbd.
There were also minor increases in Azerbaijan, Kazakhstan, Libya, Oman, Quatar, Malaysia.
Just a reminder, thanks in advance for clicking the "SHARE THIS" buttons (which are available on all our posts) and vote for our work on various sites like reddit and digg. Those link farms help us get a lot more eyes, which means more ad revenue to support the site--it's worth ten seconds to do it, I hope.
If 100 of the 25000 or so of you who come through today do this, we get at least another 5000 hits out of it. New eyes!
Give it a try, it's easy.
rainsong,
True about new production coming online. But it's the potential magnitude of decline for the major producing fields that's so difficult to offset. At 250,000 bopd Thunderhorse will add 0.3% to the world oil supply. Not insignificant but if you use a 5% decline rate for world oil production (just made up that number...no way to tell with any great certainty what it really is) then we'll need 16 Thunderhorses coming on every year just to stay even. And that doesn't take into account the fairly high decline rates of Deep Water fields like Thunderhorse. Right now the really big potential seems to be offshore Brazil and the Caspian Sea. But in those areas you're probably looking at 10 to 15 years for production to be ramped up significantly. As someone mentioned Thunderhorse took 9 years counting a 2 year dely thanks to Katrina.
But whatever is added to the production stream (particularly if it's domestic) it's going to soften the impact to some degree. And there's no sound reason to develop what we have. The folks on the low end of our economy will certainly appreciate it.
The head of Exploration and Development for PetroBras has stated that Tupi will produce at least 500,000 barrels/day by 2020.
The cavalry is riding to the rescue at a slow walk !
Alan
Thanks for explaining the reason behind the reason for the increasing liquid production.
Looking at ethanol the way the politicians look at it, the U.S. ethanol program has been a huge success. It's contributed to a leap in agricultural prices, something which the Congress had tried to do for years, but with little success. This is of huge importance to the Senate, given the "two senators per State idea" which was part of the compromise that started this fine country (U.S. that is) way back when.
If Democracy sweeps the world, at some distant date the U.S. may end up stuck with one of the most unrepresentative systems in the World because of the make up of the Senate. I hear it doesn't cost that much to "buy" a Senator from one of the less populous States, though I haven't tried myself.
timetobike,
One more little slap for your congressman that likes to talk up ethanol. The last figures I saw were for 2007: ethanol actually costs more to produce then the gasoline it subs for. The only reason there is a market for it is the $8 billion (2oo7) subsidy congress voted for it. And did he mention the $0.50 per gallon import fee we charge for foreign ethanol so they can keep the price of the domestic stuff up?
About the only silver lining is that this money is going to US companies.
Perhaps some of the outlier posters agree with Michall C Lynch's 1999 opinion that peak oil may not occur before the 22nd Century. I did not agree then and I don't agree now.
http://groups.google.com/group/sci.geo.petroleum/browse_thread/thread/353797c41a\
366f8/8ed555e91ccc2222?hl=en&q=mclynch+entropy123&lnk=ol&
or http://tinyurl.com4z6yuh
Rembrandt
Love the report. One thing that puzzles me though is the fact that 6mbd of NGL is considered "Unconventional" whereas the EIA/IEA Liquids definition includes "Lease Condensate".
Chemically aren't these very similar beasts, Can someone correct me on this.
Maybe TOD needs a glossary section
Thanks Neven
@Neven911
I would like to separate crude oil and lease condensates, but the problem is that there is no dataset available for Non-OPEC for crude only excluding lease condensate on a monthly basis. At least not to my knowledge.
Rembrandt
Rembrandt
Am I right then that 'Lease condensate' and 'NGL' are similar?
Thanks
Corrected link. I am curious as to why the editing function is sometimes unavailable?
http://tinyurl.com/4z6yuh
@WestTexas, Rembrandt, Ace, David Cohen, and others,
It would be interesting to graph Peak Oil for the USA, factoring in the following: (1) the zero net energy production of biofuels, (2) the Land Export Model, (3) increasing energy inputs to extract oil, and (4) declining U.S. oil production. This would be difficult, but it would be "instructive," as there are no significant alternatives to oil (according to my Wirth Peak Oil Report which researches the best scientific and government studies). Add to that U.S. hyperinflation and the monetary collapse in the dollar. Also, this has to be considered in thinking about Peak Oil: As oil depletion progresses, more and more oil is used to produce oil. When the amount of oil used to produce a barrel of oil equals the amount of oil produced, it is pointless to continue oil production. In addition to the oil used on site to produce and refine oil, energy is used in all of the processes for the machinery, equipment, and personnel used in the extraction, transport, and refining processes. For deepwater oil production, this would include all of the ships, platforms, steel piping (many kilometers of pipes on-site and to onshore locations), and their employees, including the energy used in making the hundreds of thousands of parts, the energy used in the factories that make the parts, the energy used in transportation of all of the parts and employees, as well as the energy that is consumed when employees and stockholders spend their salaries or dividends on goods and services (food, automobiles, yachts, airplanes, recreation vehicles, vacations, consumer purchases, etc.). Because there are a number of confounded energy input variables, it is difficult to measure all of this consumption of energy, but it is an economic reality that is shown in corporate decisions about the profitability of deepwater oil projects. For deepwater, heavy oil, tar sands, and extraction where special techniques are used, the point at which energy consumed equals the energy produced will be reached rapidly. For this reason, some oil that is classified as recoverable (for example deepwater oil, heavy oil, and the Bakken formation) may never be recovered.
With little oil, it will not be possible to maintain the Interstate highways and the power grid. And when they go out, that's it. Nothing coming in on the Interstate and no communications. Soon housing prices will hit the skids making it difficult to sell and move. That is why I got out of NH quickly. Anyone want to retire in a quiet, safe, and sustainable place in Mexico? Call 603-668-4207 my old NH phone number, and the same here with Vongage telly, or clifford dot wirth at yahoo dot com
@cjwirth
Sounds interesting. Any recommendation for good sources of US biofuels data?
Hi Rembrandt, What I am saying is that biofuels yield no energy for the U.S. This is covered in my 50 report at peakoilassociates.com on page 21:
A review of studies by the National Resources Defense Council and Argonne National Laboratory (these are linked in my report) regarding the net energy gain from the production of corn ethanol, reveal that some studies indicating some gain and one study indicates a net loss of energy. None of these studies, however, considers all of the energy inputs in all of the processes required to produce ethanol (mining and transport of ores, parts, equipment, heating of factories, all employees’ transportation and salaries (oil consumed in spending salaries), and maintenance, etc.), nor do the studies consider the opportunity costs of not using corn for food (sales). More important, ethanol cannot be transported by the existing pipeline network that covers the U.S., and transport by trains and trucks is very expensive and consumes much energy as well.
I will add to the report that the ERoEI is therefore zero. There cannot be any data produced on what I am saying here as there are too many confounded energy input variables. Here is what I say about alternatives on page 31:
The planning, development, manufacture, and maintenance of alternative energies consume fossil energies. Proponents of alternative energies provide an analysis of net energy produced over the life cycle of a project or device, known as a life-cycle-analysis (LCA). Invariably, such assessments are incomplete in accounting for only a portion of the energy inputs. For example, for the typical LCA of a solar panel the energy input is usually confined to the energy required to produce and construct the panels, photovoltaic cells, glass, and pylons. What analysts do not included is all of the energy used in all of the processes required to plan, develop, manufacture, transport, store, install, and maintain the panels, including: the energy used to mine the ores; process the ores; mine the silica for glass; transport the ores; mine the coal; manufacture various parts in diverse locations; transport those parts via ships and trucks from diverse global locations; build, heat, and provide electric power for the factories and offices where all of the components and parts are designed, constructed, marketed, stored, and delivered; install and maintain major solar panel installations with gasoline operated vehicles and petrochemical-based cleaners; and the salaries and stock dividends of all employees and stock holders for all of these processes that are then spent, thus consuming fossil energy in the products and services purchased. Because there are many confounded energy input variables (for example the transport of solar panel components may be transported with unrelated products), it is difficult to quantify the real energy costs of solar panels. The high dollar cost of solar panels, however, is a rough economic estimate of these energy inputs. In sum, accounting for “all of the energy inputs” (AOEI) is necessary for an accurate LCA.
Using the same logic for ethanol, the cost of ethanol is higher than the cost of oil (and it has less energy per gallon) because it uses more energy than it provides. This price differential is how we measure all of the energy costs of ethanol. Chris Shaw is right when he says that energy is the one true currency, it always was and always will be. http://www.onlineopinion.com.au/view.asp?article=3837&page=3
Here is some supporting stuff.
http://answers.yahoo.com/question/index?qid=20070522080205AAEOqEK
http://www.theoildrum.com/node/3591
Someone should point out these posts to Robert Rapier also, as he has an interest in the real price of ethanol.
The problem for most of us is this: (1) the difference between oil supply and usable oil supply. Extracted crude does not equate to refined oil supplies. Today the President urged Congress to act with respect to domestic and offshore drilling; I thought it was a good statement. Then Democrats stood up and said there are already sufficient drilling locations that oil companies simply decided not to exploit. As a voter, I’m tired of the Potomac Two Step. What are politicians not telling us (for their own purposes), and what do we need to know so that we can make informed decisions (as voters)?
As to ethanol, all it has done for us is increase demand for corn, sorghum, and sugar beets, and increased the price of beef and a hundred other products. Meanwhile, morons in Congress want us to think that additional taxes will, in any way, mediate climate change phenomena, and Osama wants us to think that a windfall profit tax on oil companies will make our pain at the pump more palatable. All of this makes me wonder if anyone knows what is really happening, and then I begin to wonder if it isn’t “by design.”
Thanks for listening.
Great work, Rembrandt, keep it coming. It must take a lot of work to prepare these and I find them useful when preparing my own reports for consumption in NZ.
I'd like add my support to the above posts to include net exports. I know you have a section titled World Crude Oil Exports, but the charts show all liquids.
Being able to point to a chart that demonstrates falling net exports from producer nations would be good. e.g. Offsetting the "Saudis can pump more" argument, by pointing to a net oil export decline of 500 thousand bpd in 2007, as illustrated by the table and methodology described here:
http://www.theoildrum.com/node/4092#more
Thanks once again for your efforts.