| Peak Oil - Whom to Believe? Part 1 - There's Plenty of Oil, CERAiously | The Oil Drum | Jamais Cascio: Finding a Little Comfort Fifteen Minutes into the Future |
| Solar Islands: A new concept for low-cost solar energy at very large scale | The Oil Drum: Europe | Portugal getting a hand on Venezuela's energy riches |
Oilwatch Monthly - May 2008
Posted by Rembrandt on May 22, 2008 - 1:00am in The Oil Drum: Europe
The May 2008 edition of Oilwatch Monthly can be downloaded at this weblink (PDF, 1.15 MB, 21 pp).
A summary and latest graphics below the fold.
Latest Developments:
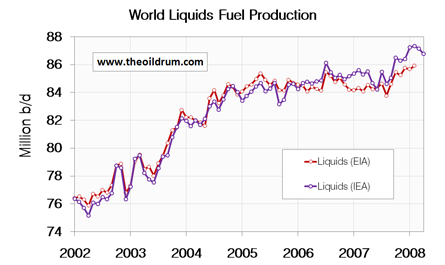
1) Total liquids - In April world production of total liquids decreased by 400,000 barrels per day from March according to the latest figures of the International Energy Agency (IEA). Resulting in total world liquids production of 86.76 million b/d. Average global production in 2007 was 85.41 million b/d according to the IEA. In the first four months of 2008 an average of 87.12 million b/d was produced. The EIA in their International Petroleum Monthly puts the average global 2007 production at 84.60 million b/d and for the first two months of 2008 at 85.80 million b/d.
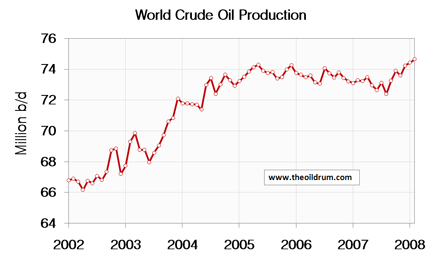
2) Conventional crude - Latest available figures from the Energy Information Administration (EIA) show that crude oil production including lease condensates increased by 226,000 b/d from January to February. Total production in February broke a new all time high production record at 74.66 million b/d from the previous month.
A selection of charts from this edition:
Personnel
Editors
Contributors
Peak Oil Primers
Archives
- November 2010 (3)
- October 2010 (6)
- September 2010 (4)
- August 2010 (7)
- July 2010 (6)
- June 2010 (7)
- May 2010 (2)
- April 2010 (8)
- March 2010 (4)
- February 2010 (6)
- January 2010 (3)
- December 2009 (5)
- November 2009 (8)
- October 2009 (12)
- September 2009 (6)
- August 2009 (5)
- July 2009 (11)
- June 2009 (8)
- May 2009 (16)
- April 2009 (10)
- March 2009 (7)
- February 2009 (10)
- January 2009 (15)
- December 2008 (9)
- November 2008 (9)
- October 2008 (9)
- September 2008 (13)
- August 2008 (10)
- July 2008 (14)
- June 2008 (23)
- May 2008 (16)
- April 2008 (12)
- March 2008 (16)
- February 2008 (9)
- January 2008 (13)
- December 2007 (13)
- November 2007 (16)
- October 2007 (22)
- September 2007 (8)
- August 2007 (9)
- July 2007 (16)
- June 2007 (8)
- May 2007 (7)
- April 2007 (7)
- March 2007 (10)
- February 2007 (10)
- January 2007 (12)
- December 2006 (9)
- November 2006 (15)
- October 2006 (4)
- September 2006 (5)
- August 2006 (5)
- July 2006 (9)
- June 2006 (5)
- May 2006 (10)
- April 2006 (9)
- March 2006 (13)
Vital Trivia
License

This work is licensed under a Creative Commons Attribution-Share Alike 3.0 United States License.
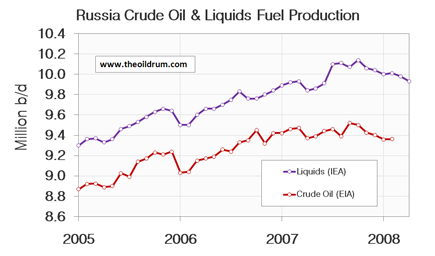
Rembrandt - once again Russia is beginning to look a bit grim. Any chance you could run up a chart for Russia going back to 1960?
Check chart 68 in the pdf file.
Does this break Russia's production out of the former Soviet Union? I've often wondered on this point.
Post 1991 its Russia's production, before it's FSU. To my knowledge, there is no production data publicly available about Russia's production before 1992.
Thank you Khebab.
I should think that would deserve a prominent footnote, as that changes the interpretation of the chart enormously.
Even better would be to stick with FSU instead of conflating what are two quite different data sets.
My experience at TOD over the last 2 years has taught me that unfortunately Khebab will publish very misleading graphs if he thinks he can make a point with them.
A few weeks back somebody with a decent stats background completely lost his cool here on account of one of Khebab's masterpieces. Not that it did any good.
Khebab, do you have any formal training in statistical methods?
If so, one of these days the God of Regressions or perhaps the Devil is going to singe your behind! ;-)
My experience has been that Khebab is an objective scientist, interested in mathematically modeling complex production situations, who has enormously contributed to the Peak Oil debate.
On the other hand, my impression is that you have nothing to offer other than useless spurious criticisms.
Asebius, perhaps you should state your statistical background, so that we can determine your level of veracity.
Strong statements! I do have a PhD in Signal Processing so I think I know a few things about statistics!
I don't recall that, do you have a link?
Beside, I don't see how bad data sources have nothing to do with performing misleading statistical analysis. In any case it won't change the outcome for Russia.
Don't forget also that most contributors are doing this work on their free time and have a demanding day work so mistakes are possible (I often find mistakes in peer-reviewed articles almost on a daily basis).
I have prepared a comprehensive list of papers and articles that Asebius has contributed to the Peak Oil debate. Here is that list:
http://www.theoildrum.com/node/3835#comment-329504
Your reply had me laughing...
LOL!!!
Oh those lovely confidence intervals. Oh how they inspire confidence!!
Phd or not. I flatly do not believe that you have formal training in statistical methods.
I predict you will soon have a new screen name.
Look, I've been on this website long enough to know that answering to this kind of negative comments is a complete waste of my time.
I stand by what I said and my confidence intervals do represent where 95% of listed peak oil forecasts are seeing future crude oil + NGL supply, nothing more.
I also strongly suggest that you open a blog yourself (it's free: http://www.blogger.com/) and share with us your vast knowledge of Statistics. You can already count me as a frequent commentator :).
Khebab...if this is Hothgar, I may have to pull out my lamprey graphic again.
or present him with the "blowfly award" (only good for eating shit and bothering people ;-)
Asebius? Nice moniker. Why don't we just shorten the phonetics a little and call a spade a spade or let an ass be an ass, as the case may be.
You provide zero objective information on your own while you flame professional contributors.
The task of timing the peak, exactly, may well be beyond anyone. If Deffreyes missed it by a few hundred thousand barrels per day, then he missed it. But it doesn't really change the fact that peak oil is still coming out in the wash and that Khebab, Deffreyes, and others, have been far more accurate in predicting world oil production than known energy optimists -- CERA et all.
The price of oil alone is an indicator how dear and scarce supplies have become -- even in an age of undulating plateau.
The problem, in general, is not enough people are aware of the kind of analysis going on here and far too many people are happy to gobble up the kind of obsfucation you blow out. But like any other cloud of smoke, it will all too soon dissipate.
The casualty, for your kind of disinformation, are those poor souls who were disoriented by it and failed to prepare or respond adequately.
Assbeass, like other worm-tongues before you, are henceforth banished...
Asebius,
I dispatched that particular commenter quite easily. He essentially didn't know what he was talking about. Khebab's model results are perfectly valid. A model itself is a best guess estimate, much different than purely statistics-driven bootstraps.
This is what I said at the time, and if you don't like it, try to argue it now, I noticed you did not back then:
Oh man Asebius, do you have nothing positive to contribute to these discussions? I find all of your comments unnecessary and counter productive, mostly I doubt you have any idea what you're actually talking about.
The people here at TOD do a great job of putting together complex info for the public's awareness on their own time, just because they feel people ought to know the trouble they got themselves into. What you're doing doesn't help the purpose of this intellectual forum, perhaps there is a forum where they welcome people who have nothing to contribute to an actual discussion, but I don't know where you would look.
I don't contribute much because I prefer to read more knowledgeble people's opinions. I do not count you as one of them.
Thanks for all the great analysis Khebab et Al
Asebius - wtf are you driving at here? Khebab is one of my most trusted sources. Sure we are all liable to make mistakes from time to time - but I'm not aware of many mistakes that Khebab has made. I'm not sure if you are being serious here or not. But one thing you have to realise is that running up charts and responding to comments like this takes time.
Splitting out Russian from FSU production is something we'd love to do - perhaps you could donate the data?
The relative heights of FSU and Russian production are actually quite irrelevant. What is highly relevant is that the territory currently known as Russia is struggling to increase production, or, has chosen to not increase production, perhaps rationalising that producing 5% less for twice the price makes good sense.
So what is your opinion on Russian oil production?
I don't think it has a lot of impact as far as C+C is concerned, I don't see any major differences with this ASPO chart:
Their peak is ~250 kbpd lower than mine.
Here is an overlay of my chart and Rembrandt's chart (Figure 68):
Rembrandt is using BP data (C+C+NGL) for 1985-2006 and ASPO data (C+C?) prior to 1985. We can see that using FSU data (EIA) prior to 1992 is higher by maybe 5% but it's a relatively reasonable approximation.
Here is my overlay considering FSU:

I have a non-shocked fit in green and a shocked fit in red.
http://mobjectivist.blogspot.com/2005/11/fsu-oil-shock-model.html
Notice that Khebab's data drops a bit lower than the data I used after 1990, but then it caught back up by 2000.
The shock perturbations:

This is not assuming any new discoveries, only discoveries up to when I generated the chart in 2005.
L. F. Buz (aka Buzz) Ivanhoe included the former USSR in a 1998 newsletter. Buz told me that he had some editing help from Dr. Walter Youngquist which included a discussion of the term to use for "Russia"
http://hubbert.mines.edu/news/Ivanhoe_98-3.pdf
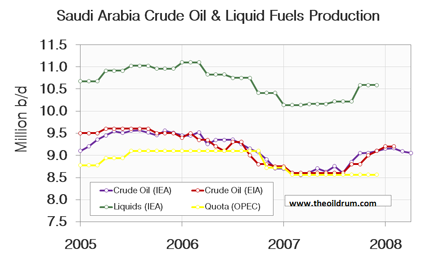
Venezuela and Iran seem to be the only major OPEC members producing below quota, all the others seems to be producing over quota, even Saudi.
I think Ali Bakhtiari was right when he used to say that OPEC died in 2004. OPEC has now two groups of members, those trying to maximize profit by producing over quota and those trying to maximize profit by lowering quotas (because they can't reach it). No one is thinking of keeping prices stable.
Rembrandt, I don't know if you have the data, but it would be nice to have a curve for tar sand production in Canada's chart and Orinoco oil in Venezuela's.
Oman 1M has just jumped to $143.33 per Barrel !
http://www.upstreamonline.com/market_data/?id=markets_crude
What's going on?
Russia Schmussia! Deffeyes goes down in 2008.
Not so fast. We will have to curve fit the next five years productions to ensure we didn't hit a peak already; a one or two month estimate does not a peak refute. Besides, the Jan/Feb data may be 'corrected' lower 6 months from now.
Good god, no. If 2008's production is higher than 2005's, Deffeyes peak is dead and buried. Done.
If one wants to get fancy and ignore year-end boundaries and calendar years, then we could say that if we have 12 consecutive months worth of production round about now that in total surpass any consecutive 12 months that contain Deffeyes' 'peak', then we look at our watches and record time of death.
Incidentally, we should also pronounce dead this crazy curve fitting that is so rampant among peak oilers. A sloppy tool used sloppily in an attempt to look scientific to the unsuspecting.
If you doubt me, learn to do some sensitivity analysis and go practice curve fitting where most of remaining oil is -- the middle east. When it comes to methodology, the curve fitters are currently working at a high school level of sophistication. Good luck with that!
If been doing sensitivity analysis off and on for about 20 years, hence your condescending tone is humorous.
If you don't understand the theory, you will never get it right. Curve fitting has to be used in order to determine where the true midpoint is. There are any number of formulas and periods to use in calculating midpoint, but if you use Hubbert's, as Deffeyes does, then it's the logistic curve to fit to. And as Matthew Simmons states it takes five years to recognize peak oil in the rear view mirror, don't be offended if I take his word over yours.
Ok, for the sake of argument lets take your word for it: it takes five years after peak to recognize the peak with curve fitting.
So, how come guys like Deffeyes are prancing around ahead of time predicting peak with HL without providing a study of the reliability of the method?
What I could never figure out was why there are only two HL graphs or so in Deffeyes book (his last one). The guy was cherry picking like you wouldn't believe.
Just like Yergin, his name is going to become synonymous with BS.
Oh, Bull! Look, whether Deffeyes' 2005 peak stands or not is of secondary importance. His was a rare voice warning of a likely early peak in world oil production when such authoritative bodies as the IEA and EIA were still projecting a 20 - 30 million bpd increase over the next twenty years. Deffeyes has earned his stripes. Yergin has proven himself to be little more than a mouthpiece (for whom, I'm not entirely sure but I would bet that it is someone with a lot of cash on the line).
Pardon me if i'm wrong, but I thought the IEA had recently revised its forcasts. The IEA seems in general to be receding from its former optimism a little. I think Deffeyes is a bit of a humourist anyway. His thanks giving day prediction was not really intented to be taken literally, just as you say, a timely warning.
Look I don't really care who calls it and who gets it right or not. If you want to get all steamed up Asebius, becasue of some obscure mathematical issues that most of us don't really understand then go right ahead. But let me ask you this: Do you think that oil production will reach a peak within your own lifetime?
You're damned foolish if you think a new peak that is anywhere within 3 or 4 mb/d is in any way significant, meaningful or useful. You're a perfect example of someone who knows a lot, but can't think his way out of a paper bag. To put it another way, you're like the dweeb who says things like, "I TOLD you the circumference of the circle when drawing the tire must be 1.5 inches and not 1.49!" to his friend drawing cars during recess in 4th Grade.
Please, just shut up unless you have something to say that makes even the tiniest difference.
Cheers
In order to know where the true peak is, all the EROI's from all fields need to be calculated. And then a certain number of barrels of oil needs to be subtracted from the total production numbers of each field, based on that field's EROI. If this isnt done then the production data is not accurate or complete because we dont know how much energy is used to produce the oil.
Here's a simple thought exercise to illustrate my point. Imagine if we found 10 trillion barrels of oil 10 miles under north america, embedded in shale. And imagine if we produced 5 million new barrels a day from this supergiant field. That would be great, as far as the charts are concerned. But if it costed 4 million barrels of oil to build all the infrastructure necessary to tap and pump all that oil, then it wouldnt mean nearly as much. This is an extreme example, but the point is that we are consuming more and more oil just trying to keep production at the plateau it is currently on. That is why I believe we are already well past the "true peak" of net oil production. And as any investor who still has his shirt knows, it is the NET that counts. There are hundreds of companies whose revenues are going up, but their stocks are losing value because their expenses are rising faster than revenue. That same dynamic applies to oil production.
I think we hit the "true peak" way back around 2001. (Probably right around 9/11/2001. How's that for a conspiracy theory!)
http://online.wsj.com/article/SB121139527250011387.html?mod=googlenews_wsj
Oil Monitor (IEA) to Slash Estimate Of World's Supply of Crude
By NEIL KING JR. and PETER FRITSCH
May 21, 2008 3:10 p.m.
Found some more of the article at DU
http://www.democraticunderground.com/discuss/duboard.php?az=view_all&add...
Here's the whole thing via Google News (sorry but I couldn't figure out a way to just post a link that would display the whole thing!)
I expect this to be a bombshell...
Oil Monitor to Slash Estimate
Of World's Supply of Crude
By NEIL KING JR. and PETER FRITSCH
May 21, 2008 3:10 p.m.
The world's premier energy monitor is preparing a sharp downward revision of its oil-supply forecast, a shift that reflects deepening pessimism over whether oil companies can keep abreast of booming demand.
The Paris-based International Energy Agency is in the middle of a large study of the condition of world's top oil fields. Its findings won't be released until November, but the bottom line is already clear: Future crude-oil supplies could be far tighter than previously thought.
The IEA has predicted for several years that crude-oil supplies will arc gently upward to keep pace with rising demand, topping 116 million barrels a day by 2030, up from around 87 million barrels a day now. But the agency is now worried that aging oil fields and diminished investment mean that companies could struggle to break beyond 100 million barrels a day over the next two decades.
The agency's forecasts are widely tracked throughout the oil patch, so a blast of cold air from the IEA could further rattle an oil market that has already seen crude prices rocket over $130 a barrel, double what they were a year ago.
Midday on the New York Mercantile Exchange Wednesday, crude for July delivery, the new front month, was at $131.55, up $2.57, or 2%. Year-to-date, crude oil is up $35.57, or 37%
"This is very important because the IEA is treated as the world's only serious independent guardian of energy data and forecasts," said Edward Morse, chief energy economist at Lehman Brothers Holdings Inc. The study, he said, could act "as a prod" for greater transparency within an industry known for intense secrecy.
The IEA monitors energy markets for the world's 26 most-advanced economies, including the U.S., Japan and all of Europe, who also pay the agency's bills. Its role is to act as a counterweight in the market to the views of the Organization of Petroleum Exporting Countries. The IEA's endorsement of a crimped supply scenario will likely be interpreted by the cartel as yet another call to pump more oil -- a call it will have a difficult time answering. At the same time, the IEA's conclusions will likely be seized on by advocates of expanded drilling in prohibited areas like the U.S. outer continental shelf or the Alaska National Wildlife Refuge.
The IEA's findings echo the gathering supply-side gloom in much of the oil patch, articulated by numerous Big Oil executives in recent months and prompting numerous upward revisions to long-term oil-price forecasts on Wall Street. Goldman Sachs Group Inc. grabbed headlines recently with a forecast saying that oil could top $140 a barrel this summer and could average $200 a barrel next year. Prices that high would put a serious strain on the world economy.
The IEA is now trying to shed light on some of the industry's best-kept secrets through a study of the world's top 400 oil fields. With behind-the-scenes assistance from major oil companies, oil-field-service companies, energy ministries and consultants, the agency hopes to assess the overall health of major fields scattered from Venezuela and Mexico to Saudi Arabia, Kuwait and Iraq. The fields supply more than two-thirds of daily world production.
The study, employing the efforts of a team of 25 analysts, marks a sea change in the IEA's efforts to peer into the future. In the past, the agency focused mainly on assessing future demand and then looked at how much non-OPEC countries were likely to produce to meet that demand. Any gap, it was assumed, would then be met by big OPEC producers such as Saudi Arabia, Iran or Kuwait.
Critics charge that the U.S. Energy Department's own forecasting shop, the Energy Information Administration, still sticks to the same demand-driven methodology, assuming that supply will keep up with the world's growing hunger for oil.
The EIA has embarked on its own supply study, which it hopes to complete this summer. Its preliminary findings are also somewhat gloomy, with a forecast saying that only significant increments of nonconventional fuels like ethanol will push global fuel supplies over 100 million barrels a day by 2030.
"We are optimistic in terms of resource availability but wary about whether the investments get made in the right places and at a pace that will bring on supply to meet demand," says Guy Caruso, the EIA's chief economist.
In Paris, analysts at IEA also fret that a lack of investment in many OPEC countries, combined with a diminished incentive to ramp up output, cast serious doubt over how much the cartel will expand its production going forward. Big non-OPEC producers like Mexico, the U.S. and Russia, meanwhile, are looking at slumping production and their own uncertain investment climates.
The IEA work aims to tally the range of investments and projects under way to raise production from the fields in question. That way, the agency hopes to get a clearer sense of what to expect in the way of production flows.
Fatih Birol, the IEA's chief economist, said the hurdles already look high. "One of our findings will be that the oil investments required may be much, much higher than what people assume," he said. "This is a dangerous situation."
The IEA study will dig into one of the issues that most bedevils those trying to forecast future prices and the supply/demand balance: how rapidly the world's top fields are declining. Oil-field-depletion rates are a much-debated barometer of the health of the world's oil patch. A study released earlier this year by the Cambridge Energy Research Associates, a U.S.-based consultancy, crunched the numbers on 811 of the biggest fields and concluded that the world-wide depletion rate was around 4.5% a year. At that rate, oil companies have to make huge investments just to keep their production steady. Others say the number could be higher.
"We are of the opinion that the public isn't aware of the role of the decline rate of existing fields in the energy supply balance, and that this rate will accelerate in the future," says Mr. Birol, who is leading the IEA's field study.
The IEA study won't be definitive. Big producers like Venezuela, Iran and China aren't cooperating with the study. Other producing nations like Saudi Arabia typically treat specific production data of individual fields as closely guarded state secrets.
To get around that, the IEA will depend on data gathered by IHS Inc., a major data and analysis provider in the U.S., as well as the U.S. Geologic Survey, a smattering of oil companies and national petroleum councils. Some oil-service companies are also lending a hand. The agency also plans to do computer modeling to make estimates where it lacks firm data.
Critics of the IEA praise the continuing study but also say a revision of the agency's long-term forecasts is long overdue. The agency has missed many of the big energy developments in recent years, like the surge in Chinese demand in 2004 and this year's skyrocketing prices. "The IEA is always conflicted by political pressures," said Chris Skrebowski, a London-based oil analyst who keeps his own database on big petroleum projects around the world. "In this case I think they want to make as inconvertible as possible the fact that we are facing a real crunch."
Maybe a big deal to the MSM and the masses, but not here. We already know reserves are at least 300,000,000,000 less than claimed, mostly OPEC's.
http://uk.reuters.com/article/oilRpt/idUKL3080747520071030
Cheers
More detailed WSJ article today:
http://online.wsj.com/article/SB121139527250011387.html?mod=hps_us_whats...
No. Read in his book "Hubbert's Peak" ISBN 0-691-11625-3 on page 158:
That was from his 2001 book. He got more confident with time.
I was thinking the same thing. The EIA and IEA estimates are normally high.
We've still lost our 2%-3% growth need to keep economies healthy. This peak seems meaningless over a three year stretch.
In six months we'll know for sure if a point was scored. Not that I think is matters. We need an extended stretch of 2%-3% growth before I'll concede that the Cornucopians have a reason to celebrate. Otherwise, this is just part of the pattern predicted so long ago.
Global exports are DOWN 2 million barrels per day over the last 2 years. Kinda rough for the importing nations, eh?
Net Oil Exports - May 2008 Update
But even though the available imports are down 5% in 2 years, Asebius will focus on whether Deffeyes was exactly perfectly completely absolutely right and miss the entire point. Deffeyes is one hell of a lot closer to being right than the twits at CERA.
Can you show the math behind that calculation?
[I generally don't download spreadsheets from anonymous sources]
The calculation is the spreadsheet, which lists supply and consumption sourced from bp and the eia (the spreadsheet notes which data is from which source), and does a simple sum and subtract - if you wanted to you could download the data from the primary sources and re-build the spreadsheet yourself, but someone has already taken time to collate this publicly available data into that spreadsheet.
Using April's chart, and April's spreadsheet data to calculate the average exports:
2005: 42.5 mbpd
2006: 42.0 mbpd
2007: 41.0 mbpd
This data covers World Top 20 Exporters.
Chart and data from http://netoilexports.blogspot.com/
Average lines (red) added by me.
Why are World exports declining?
Guys, why not download Rembrandt's pdf and use his world liquids net exports estimate (Chart 18)? Why settle for the top 20? His plot shows net exports are still on plateau, slightly down from earlier in the year. When this starts going down the real party starts.
It would probably help if both of these sources showed annual net export graphs.
.
[an erroneous comment retracted]
The Oil Drum seems to have caught a virus!
You annoy me, might put a hex on you just for the fun of it.
A hex!?! Doo00ood, make it a strong one. Teams of assassins have been deployed against me.
But you may get your wish in any event. The IEA news yesterday is the final confirmation that amateur hour is over.
The horror of Hell is its unreality.
--Borges
I know I am over simplifying but it would seem to me that this info is usless to argue without somehow showing/estimating net oil production & net oil exports.
IMO there is no "undulating plateau" there is only a decline in oil avaliable to the global market.
Isn't it possible for production to increase and at the same time less is available on the market?
Please excuse me if I am being obtuse but this is the info I need to make a killing on the commodities ex;-}
Consider the US, which did not peak until 1970. Assuming, for the sake of argument, no other changes, if the US were the sole source of crude oil, net oil exports would have ceased in the late Forties, when the US became a net oil importer.
Late '40s? I had no idea. What is your source?
I thought the US became a net importer of oil in 1968.
The not so fine print...
Check out the Net Imports data table: http://www.eia.doe.gov/emeu/aer/pdf/pages/sec5_5.pdf
The US was a net importer from 1949 on, and we probably became a net importer right after the end of the war.
Was the US a net importer of crude, or of all petroleum products? Did we import crude and export gasoline?
It does make a difference in why we were blockading Iran in 1951.
Net Exports/Net Imports refers to total liquids--crude + petroleum products.
Well, it isn't possible, unless there is a huge storage capacity somewhere. What is happening today is that the oil is becoming more abundant at the producers' markets, while it is getting scarce at the importers' markets.
Add all markets together and you'll find the entire production.
So the producing nations buy the FFs they use for production from themselves? or just not include that consumption in production #s?
Sorry if this is common knowledge already.
The two curves that matter, price-wise, are the net exports curve and the net energy curve. One is hardly ever seen and the other hasn't been invented yet.
Oil trading today at 132.48!!! See orange box top left of CNBC. How long before 5 bucks for regular unleaded at the pumps?
I think I'm getting a cramp.
oil actually got to 134.35 yesterday, and it has just opened today at about the same price (134.17) - does anyone know what is going on? - $5 rise yesterday, $2 the day before?
Reality is dawning on the financial world. See yesterdays post Has peak oil "tipped"?
Greetings all....
This is my first post here after being a lurker for not a very long time. After reading about the Oil Execs on the Hill today, I began to wonder about a connection between an oil company's use of the term "investment" (their justification for enormous profits), crude oil futures trading, and capital purchases.
I intend to cruise "these internets" seeking information about exactly what an oil company buys with it's "investing dollars" (could it be oil future options?), and with it's capital expense dollars. Before I start, does anyone know if this information is readily available?
In particular, are they speculating in the crude futures market in order to drive up the selling price of crude (and it's own profits)?
Second, what sort of "hardware" are the oil companies purchasing (especially the Saudis)? Are they buying drilling and oil rig components (indicating more drilling => more oil produced), or are they buying increasingly more expensive equipment in order to maintain current production levels?
With just a short period of time reading up on Peak Oil, my knowledge of the concept is meager; still, it seems logical that 1) the drilling stops (no drilling hardware being purchased) and 2) increased expenditures on merely maintaining current or decreasing output would be indicative of post-peak behavior.
If this is discussed elsewhere please point me to it and I'll take it from there.
Jeff Vail (a TOD editor) recently posted on his blog that demand destruction isn't happening yet, and you could even argue that it's risen in the US slightly from April 2007 compared to April 2008 depending on the numbers you use. We can see supply decreasing at around 4.5-5% a year, a figure not even CERA is fighting with much vigor these days. I've heard that the 1970s OPEC embargo wasn't a complete embargo, they just said they'd cut supply by 5% to punish the US for our Israeli support. Oil prices shot up 400% on that news. Now we've got ourselves a situation where it could decline 5% a year every year. I don't think it's outlandish to suggest we could see another 400% super-spike in oil prices if the public starts to truly wrap their heads around this. That's $535 a barrel. I cheer Goldman's Murti on his $200 prediction, but can't understand his thinking when he says he feels oil will retreat to $75 a barrel by 2011???
This is my first post as well but I've been infected by the meme a while back.
I know very little about the oil industry but I can still point out some problems with with your assumptions...
Drilling is often required just to maintain production, especially after a region has peaked. While a lot of low-return drilling can make business sense, it is rarely sufficient to offset the decline of the old, high-returns wells.
If you're talking about publically-traded companies, they're supposed to disclose some of what they're doing. Speculating isn't their business but what do I know?
The thing is, these companies are becoming less relevant every year... and good luck determining what the national companies are doing! I think we would all appreciate if you published your findings if you happened to discover anything new.
If you search a bit, I'm sure you'll find relevant material here. Some TOD contributors have been dissecting satellite pictures of Saudi for instance.
Well I've been without huge success trying to piece together what I call a real but simple model of post peak oil production. One of the interesting results is that as you pass peak it seems the noise level in published data may get very high and the data unreliable. We see it at the political level with pretty outlandish statements but the same people making these statements also often have control or influence over the final data reports.
So at one level you develop a lot of politically induced noise in the data set similar to the subprime is contained nonsense and the CAR's housing affordability calculations for California. And probably some of the most famous ones are US unemployment numbers and inflation calculations. Its not unreasonable for use to expect political noise to increase as underlying real conditions worsen. Next you seem to have plain noise in
the data itself esp consumption rates in producing countries and the rapidly expanding economies of Asia.
Real consumption may be over or underestimated significantly in any given month. So exports and share of exports may be incorrect. Certainly as internal consumption increases you have room to claim constant and increasing production and write it off as inflated internal consumption numbers in any given month.
What we don't have in general is raw export numbers and raw production numbers instead we have partial potentially erroneous numbers that have passed through a number of political filters.
So right now my grand result is that overall error increases significantly as a stressed system passes peak so unless you have raw or proven reliable numbers to work with we probably won't see numbers that prove world peak until it becomes impossible to hide via political filtering and on the collection of data level that the countries actually are able to collect reliable consumptions statistics.
My guess is that the critical export numbers are well known although not reported and that real production numbers are well known. And I think both real numbers have deviated significantly from what reported.
The political moves in the US and price indicate that peak oil is not contained. And although the public data does not seem to support it I feel that most people that follow peak oil realize instinctively that this year seems quite different from the previous years. Just like it pretty obvious to most that the US is now in a recession regardless of the official stats.
For to the whale oil logistic peak. The price fluctuated dramatically as whale oil peaked I'm sure rumors and misinformation played a large role in causing those fluctuations.
The net result is as we approach or pass or have passed peak noise becomes a issue both intentional and unintentional.
It seems to me that these are indicators of scarcity (hitting the limits to growth if you will) rater than peak.
A consumption shock can explain these disturbances just as well as a supply shock given the supply constraints, right?
The most vital issue in my opinion isn't peak oil but what's happening with global population and inequality. That problem has been festering for decades and the result is that any significant increase in the purchasing power of a significant fraction of the dispossessed billions is now going to precipitate a scarcity crisis.
This is what makes export land interesting, right?
Well my view is that Export Land is such a large factor that its hard now to get a reliable understanding of our current situation. The money from the recent price increase will be filtering through the producing countries over the next year. This flow of money will have unknown effects. The persistant high prices of the last previous years are finally filtering though etc. We don't know world storage levels that well so even if the spike was real it could well have gone into replenishing critically low storage. My only point is that in my opinion the noise level if you will in the global oil supply has risen substantially over the last year especially since the last quarter of 2007.
This advent of substantially more noise consisting of falsified data, rapid increases in demand in producing countries changes in storage levels in importing countries etc etc makes it very difficult to actually know our real situation. Assuming you agree with me that even our sparse data sets have become noisier then this alone is probably a signal that we are past peak exports for sure and potentially peak oil is already in the review mirror depending on how you gauge the data. Given all this my interpretation of the current situation is that we are actually down 4mbd including export land and decline and this spike in production is bogus or was absorbed into critically low storage if its real. The end result is the market seems to be responding to a 4mbd shortage and it may a while before we really know whats going on.
Whats interesting is not my interpretation but the un-excepted result that as complex systems get strained and start breaking down noise/misinformation in the system itself becomes large enough to cause its own problems.
Probably a stochastic resonance like effect.
This is the first time we have had the chance to watch the collapse of a complex civilization with a mathematical tool chest that should be sufficient to model the collapse albeit it seems because of the noise level after the fact. Hopefully the data can be preserved and it will be useful for future civilizations.
What I find interesting is that Matt Simmons saw this although I don't think he has ever explained it well.
The problem is as we enter the end stage clear precise data is critical if you want to make the right decisions. Because we did not achieve transparency before we entered this stage data collection problems both intentional and unintentional will probably mask the truth for some time. Losing a year or two in getting the world to accept peak oil because of problems proving it is not a good thing.
In the past I always thought Matts request for transparency was a good thing now its starting to look like it might be vital. Right now the world is probably in the middle of a Enron style accounting scandal with the oil supply we just don't know it.
Even with the best data, who's to say what the right decisions are? I doubt I'd agree with Mr. Simmons.
But yeah... openness, rules and accountability would come in real handy right now. Judging by the lack of scandal over Iraq, I doubt we're going to see much of that over a few mbpd. What are the incentives for playing fair anyway?
Also, uncertainty itself can explain a good deal of the market disturbance.
It's a little early to call even peak exports with certainty in my humble opinion: a plateau in spite of ballooning prices is distressing enough.
As production goes down and prices go up, drilling will increase. We just won't get as much oil from the drilling as we did in the past. We will drill smaller and smaller oil fields forever as production continues to collapse.
Peak Oil goes mainstream in Germany:"Der Spiegel", a nationwide weekly from Hamburg writes today, citing the Energy Watch Group:
"Bisher war die These vom Fördermaximum ("Peak Oil") höchst umstritten. Die Energiekonzerne lehnen sie zum Beispiel strikt ab. Nun jedoch könnte sich die Vorhersage schneller bewahrheiten als vermutet. "Peak Oil ist keine Theorie, sondern eine Realität, die sich bereits vor unseren Augen abspielt", heißt es in der Studie."
"Until now the hypothesis of a maximum in production ("Peak Oil") has been highly disputed. Energy concerns for example strictly deny it. But now the predictions could become truth much quicker than expected. "Peak oil is not a theory but the reality already unfolding before our eyes", the study says."
http://www.spiegel.de/wirtschaft/0,1518,554587,00.html
Best Regards,
J. Daehn, Hannover, Germany.
Very readably translated by Google Translate English translation.
Without the work of Khebab and Co people like myself and Asebius from Toronto would have only scattered fragments of information to piece together. Given the wide acceptance at all levels that OPEC has at best been over optimistic about their given reserves coupled with the blind siding concerning depletion rates in the North Sea being considerably higher than anticipated coupled with the former Soviet Union's difficulties in stabalizing the business infrastructure managing their resource coupled with the uncertainty surrounding the fundamentals in the market and their proportion of blame in the current volatility in the pricing of the resource I think the idea of searching for certainties is ridiculous.
It is not optimism that sits in the driving seat at the moment in the media, nor on the supermarket shelf price tag, nor forecourt. However I doubt that theoildrum.com contributers have caused this and in particular I would also like to point out that i will not hold Khebab personally responsible if the new Russia decides not to deviate from his graph in order to avert any personal injury or hardship.
As always many thanks for the frank and transparent mechanism of theoildrum.com.
" I know it's a long way, but how far is that exactly ?"
I really dislike IEA data, since there seems to be an complete disconnect from their data and everyone else's. I does seem that the big peak in total liquids has not hit yet but net total exports has, which makes perfect sense due to the whole export land model idea. Saying that, it doesn't seem that a peak is going to be a big deal as it will be situated slightly above a plateau. What is driving up these record breaking oil prices though seems to be this earlier peak and decline in net exports. Khebab and friends, would you expect Russia's decline rate to start accelerating along with the world's decline rate? If so it would seem the fall off of the plateau would not be far away. Why is the IEA data for russian production so much about .5 mpd higher, what are they including that the EIA doesn't? All I know is I can't wait till the 2008 BP statistical review comes out, it seems to be a lot better in quality compared to these types of EIA and IEA data sets.
To respond to a comment from Hfat: I am not exactly sure what your trying to say, but as far as International Oil Companies are concerned they do release their numbers. However I don't think they release the hard data behind their production statistics ect, as seeing just a couple of years ago shell had to lower their reserve number by 4.6 billion barrels. Also I believe international companies control 12% of world production COMBINED, the rest is national oil companies. The Senate having hearings about high gas prices, is a far outdated joke as seeing they don't control the market anymore.
Much Thanks to the guys from theoildrum.com,
It seems the swords are going to start falling soon, as we chase diminishing marginal returns in all areas of economics.
Here is our (Khebab/Brown) outlook for Russian net oil exports. The production curve was based on the logistic method. The projected initial 10 year decline rate is shown. The actual year over year decline rate should start out at a low rate and accelerate with time.
http://graphoilogy.blogspot.com/2008/01/quantitative-assessment-of-futur...
I was looking for a chart (hoping I didn't have to make one myself) that showed how flattish crude oil supply (only) & still-growing demand have resulted in higher prices. A simple graphical explanation for high oil prices from a peak oil perspective, using just three lines: supply, demand, and price, from about 2003-2008. Anybody got something like that handy?
You want the somewhat speculative bumpy plateau price forecasts of Ace:
World Total Liquids Supply and Demand and Price
...which was controversial at the time but has since turned out to be conservative.
Take that, Ace haters!!
Cool picture though.
Time for an update?
Thanks, 10K...I knew I'd seen something like that before...I've always found ace's comments & charts useful!
Actually if you use Aces chart and read off his prediction our current price is inline with a 4mbd difference between supply and potential demand inline with what I'm saying.
So whatever the cause I don't believe the production numbers.
Arguing over stats re: oil production in here is stupid. You don't know how good the data is in the first place so whatever statistical manipulations are done results in dubious results. No doubt most of us posting on TOD studied stats in grad school. Knowing how to enter data into Excel & use the Chart Wizard comes in handy, so long as we keep in mind that the output is only as good as the input, which is crap. Modelers with much more tolerance of ambiguity than I have play with the data and present their graphs for us to look at. We draw conclusions from those graphs at our own peril. Perhaps the analysis presented in here is better than nothing, and perhaps it is worse than nothing due to it's being misleading. Enjoy playing with the data & software, enjoy perusing the output, enjoy arguing over the methodology if you like. Just don't claim that you actually know anything regarding world oil production other than that it's peaked out, is peaking out, soon will peak out. The exact timing is obscure despite all the colorful graphs because the data that goes into their construction is highly suspect.
You don't realize how wrong you are. This stuff is like counting beans, easy as pie. You just need to set up the correct premise and use the correct mathematical model. Then it all falls out naturally. Unfortunately, somehow the old guard of the oil industry has directed us down a course that consists of lots of empirical heuristics. And that doesn't count for beans.
I agree with the garbage in / garbage out. But...we gotta keep sifting through the garbage to get to the truth as close as possible. Not to many others where digging for the truth...even EIA/IEA wasn't really digging until recently. I think the folks doing the work here in TOD have done a fairly good job of sifting through it and presenting it and I thank all contributors. It has helped me to learn and believe that we are at or near peak now. I am not 100% sure what it will all mean and what I will do...so I'll keep reading here and sifting and shitting my pants as it all unfolds
Its not quite as simple as garbage in garbage out. For example for fields found and developed say before 1980.
The original OIP estimates are probably pretty much correct. These can be adjusted to some extent under assumptions of enhanced recovery but that not important for the initial decline.
Considering they started peripheral water injection on Ghawar in I believe 1956 they obviously have a very good understanding of the field. Overall since production was increasing and reserves where still huge you really had no incentive to stretch your numbers. Its the later revisions to older fields that are suspect. Even if they turn out true the production rates will probably be very low.
So the real problem is we probably have garbage mixed in with good data. The consensus on the oil drum is to reject the obviously false ME revisions but that still leaves a lot of upward revisions that don't pass this probably good test.
But the real problem is we don't seem to have good ways to filter without more detailed raw data.
Especially if the errors are systematic. The source for a lot of this data are the same people that until recently claimed peak oil was a event that was past 2030 at least.
Its correct to question their models since the data itself with most reasonable models indicates a peak before 2030 but you should also question the data.
Worse it seems that what important now that we are probably very close or past peak its the short term production i.e production one or two years out from today thats important. And social/economic responses feedback loops EROI etc that control our future. Once production is down 10mbpd what ever the world is like at that point it probably won't be a lot different when we are down 20 mbpd etc. We should try and focus on this first 10mbpd drop and at least look at more short term models. These would for example discard reserve additions in older fields since the production rate would be too low to help. I think you will find if you look that the amount of oil we can produce at a high production rate is pretty close to out.
The models we have used to date don't take into account even this simple observation and they don't take into account the significantly shorter life time of offshore fields which account for about 40% of the worlds production and are generally small and can be drained with depletion rates as high as 25%. And worse in many cases secondary recovery is not even attempted because of the expense. And of course preferential production of light sweet crude vs heavy sour has lowered the quality of remaining reserves.
In any case if you look your realize about 50% of our production simply using the 40% offshore figure is enough to make the case that this is not unreasonable. So its probably reasonable to assume about 20 mbd of production might be in the very high risk category. This means a steep loss of up to 10mbd is not unprovable. Sure we may do 40mbpd on a nice smooth curve if things hold together but just these simple questions raise the chance that we may not move off our current production level at some shallow decline rate.
Its that first 10mpd thats a bitch.
darwinsdog its not that simple. I do think the latest production reports are bogus.
My best guess is that what happened if some of the production was real was storage was drained in the producing countries and refilled some low storage elsewhere in the world. So it was counted as production in proceeding months then again over Feb. This could cause a movement of real oil without having a large price impact esp if the amount was not sufficient to cover enough low storage. But the producers will have to refill so we will see
a drop in exports. The EIA has said we have been consuming more than production for 18 months.
Next of course we have export land and finally we have that given the current political climate the desire to fudge the numbers is high.
Price alone should cause you to be wary of the recent data. But not all the data is bad as I posted below the methodologies are generally in good agreement. Given the data and the models I think they are roughly correct.
But hidden in both the data and the models are a lot of assumptions that boil down to business as usual as production declines.
On the data side I'm sure the reserve estimates are assuming that past technical advances will continue along with other rosy expectations.
On the model side oil is treated as oil. Production of high sulfur tar from a watered out field is treated the same as your best light sweet crude that looks like champaign.
Bonny light is not Arab Heavy.
Sorry for doing almost the same post twice but I don't agree with the near term projections of most of the model although they are not designed to handle our near term issues. Long term I don't think they are relevant because of above ground factors. They are useful in what they have accomplished which is that we are probably at peak. That what they should be able to do +/- 10 years and they accomplish this. And since the models are robust agianst inflation in reserve estimates and don't take into account quality issues they are probably right.
However over the short term i.e < 10 years its wrong to have much faith in the exact production profiles of the models. And a 2-3 mbpd drop in production is enough to have a big effect on us.
Although I don't think it was done on purpose its a bit misleading to present these long rang model and look at say a 10 year production window around peak. Everyone using short term data and long term models to prove or disprove anything about the near term is simply engaging in a logically incorrect argument.
Now over a short term period details are important and so is good data. We care about what happens over the next 5-10 years thats what should be most important to all of us.
So finally I actually agree with you in the sense that what really matters which is near term oil production has not been adequately modeled and for people that are not independently wealthy and are trying to make difficult decisions as they try and follow Westexas ELP recommendations the lack of a shorter term model is a problem. This is I think what your angry about. I don't know if we have enough data to solve this much less the right models so who knows. For me at least this string of suspect production reports means that I might not have enough near term data for at least another 3-4 months before I can test my own short term concepts. I'm pretty confident that real production this year was either going to break upwards by a decent amount say 2-4 mbpd or lower by the same amount. This dubious blip has forced me to use price which say we went lower. Since my own opinion is that we will do a sharp turn and drop down 15mpd over the span of 3-5 years spurious blips int the public data suck. It obviously was not the upwards break or prices would have moderated thus it was the downwards break but the production data is corrupt only the price data showed it.
So at least from a historical perspective I'm as pissed as you are. We just went through one of the biggest events in human history and the bastards lied about it.
Colleagues:
Thanks to all (especially those creating articles) who contribute their time to post to this forum. We should agree The Oil Drum provides a critical and incredibly valuable service! As a scientist and manager, I believe this monthly report is a key contributor in monitoring and assessing this problem.
I ask someone with the skills and access to the appropriate database(s) to please consider doing a monthly report that provides two things...
1.) Post aggregate and also key country PRODUCTION data that is compared with industry FORECASTS (i.e. IEA, EIA, CERA, etc). The differences in the analysis I perceive could suggest further light on actual depletion rates and consumption rates. In the next few years, wouldn't these trends and deltas be vital in future decisions? Also changes in time (i.e changes...rates of change).
2.) Post aggregate and also key country "New Oil Production" that comes on-line and "Consumption Rates" compared to forecasts. Again. the differences and change per month should be illuminating.
In diagnosing and further assessing this massive problem, aren't these two issues vital? I haven't seen that much on this on a monthly basis.
Any Thoughts? Comments?
Thanks.
--Nichoman
This is the flood that was predicted by Robert Rapier, at least in part. Full credit to his predictions of several years back.
On the other hand, a seemingly firm long term price of over $75 dollars no longer seems an unrealistic basis for financial projections, and the idea that many projects are being worked as hard as possible in the short term is also realistic.
The two coinciding, and then being swallowed in the larger truth of the flattened curves on a bumpy plateau? Why not?
What is becoming more apparent is that the strategies are changing, and not merely Norway and the Netherlands will be looking to the long term regarding maximizing oil/gas production and profit.
The game remains unchangedly complicated, but peak isn't past us - my timing was wrong, no question.
And the idea that storage is being used to smooth the market into a decline no longer seems tenable, either.
Congratulations to the global oil industry - pumping what pretty much seems to be full out, they could jump oil production a couple of percent. Which we will need to do next year, too, if we wish to stay even, much less book another gain.
For the UK folk, Evan Davis directly popped the "peak oil" question to an energy broker yesterday morning and the person evaded a direct answer. To paraphrase the reply, it was "we need to start using less oil as supply cannot be increased to match demand". He went on to say, quite authoritively, that we have no replacement for oil on the horizon. Take it or leave it, outright denial of peak oil is starting to wane. If one wants to be correct I suppose demand can never exceed supply, but potential demand probably can.
What struck me was Evan has to date generally avoided the subject of peak oil, and has previously emphasised the fact oil is not running out, which of course is true, its supply rate (and possibly exports) thats running out.
Here's the link to the interview
http://www.bbc.co.uk/radio4/today/listenagain/ram/today3_oil_20080522.ram
Pemex just posted there April production numbers.
Look at the recent steep declines in production. If these declines continue Mexico will be an oil importer in less than 3 years.
Here is the Link to the PDF file
http://www.pemex.com/files/dcpe/petro/eprohidro_ing.pdf
Total production in February broke a new all time high production record at 74.66 million b/d from the previous month
If tar sands production is subtracted from both February 06 and May 05, is May 2005 still the record month for conventional oil (+ condensate) production ?
Sorry for the late question.
Alan
Yes - May 2005 would still be the record. (the dark gray is sans tar sands - graph from Khebab)

What is the nett energy of the 2 or so million barrels of tar sand contribution? I doubt if it yields the same energy input to society as the same volume of Crude + Condensate would. This is what really counts.
What does the P stand for in NGPL?
note -the above graph is gross energy, of all types. even using gross numbers, excluding tar sands, we have not broken May 2005 peak. Using net energy, Im guessing the peak is 1999-2001 or even earlier. It gets complicated and theres no way I could do it with the public data available. One would have to consider, fixed vs marginal EROI (e.g. how much of Ghawar production is just due to a 10,000:1 EROI of the initial well, and is still being milked?), quality (oil production uses electricity and nat gas), and environmental costs that are difficult to parse into energy.
Still, the biggest sign to me of declines in net energy and borrowing energy from rest of society is relentless price increase, which is what we've seen for 9 years now....
Thanks for this. I've been hoping for and asking for this info for a while. I think contributors developing the habit of breaking tar sands and other non-traditional "oils" out from conventional C+C is very valuable for clarity of the real issue. The immediate problem *is* conventional oil decline. It is that that must be covered by the non-conventionals, no?
Best Hopes for New Habits,
Cheers
The following link is for Radio 4's PM programme. You will need the relevant player, but it is an interesting interview with Chris Skrebowski and others. First article after the news headlines. This is the 4th time I have heard the subject of oil depletion on radio 4 in a space of a week. Unfortunately I am usually sat in my car consuming the stuff whilst listening to the programmes!
http://www.bbc.co.uk/radio/aod/radio4_aod.shtml?radio4/pm_thu
Here at Forth Coming UK Energy deficit (FCUKED) we hae maintained there are 2 (two) Peak Oil Points.(POP)
POP 1. When it happens
POP 2. When folks realise it is going to happen
We have reached POP 2 - although many TOD subscribers were a trifle ahead of the game.
Ziz
On blog sites its difficult to know whether the contributor has a sense of humour or not. One has to write a reply and sit back and wait for the response!
I chuckled when I read this and my initial thoughts on the order of the letters was obvious, but there is much truth in what you say. If you listen to the R4 programme above one guy says we have been walking into this for at least 10 years, C Skrebowski says we are at the foothill of peak oil, where the light sweet crude we all require is in short supply. The next kick is net a exports declining, followed by the peak, where nobody anwhere with oil of any kind can increase production; full stop.