A Primer on Reserve Growth - part 2 of 3
Posted by Rembrandt on December 26, 2006 - 11:05am in The Oil Drum: Europe
This post is the second part in a three piece series about the phenomenon of reserve growth in already found oil fields. Insight in future reserve growth, which is often attributed to advancement in technology, is crucial in determining the peak of conventional oil production. For those not familiar with reserve growth it would be best to read part 1 first:
In this second part various scientific studies about reserve growth in the United States, the North Sea and Russia are analysed. The third part will look at the reliability of the estimate from the United States Geological Survey in their World Petroleum Assessment 2000 with respect to future reserve growth.
What can we tell from reserve growth in the United States?
The situation in the United States is quite unique in the world. The country shows the largest amount of reserve growth over time in the entire world. Soveral fields have grown ten to twenty times their original size. The cause of this huge resreve growth is the reporting practice of operators, which report proven reserves only:
"In principle, US companies are expected to follow industry guidelines that define Proved (described as having "reasonable certainty" in the SEC rules) as having a 90% probability of occurrence, but in practice it appears that their estimates come closer to the Mode value. For the last 20 years, the amount of positive revisions reported by the US Department of Energy were double the negative values, meaning that the original estimates had a probability of around 66%. That is close to the Mode value, which in fact represents what the engineers consider the most likely.The huge "field growth" of the United States is clearly a reporting phenomenon, as only 6% of the additions over the past twenty years have come from new discoveries. The rest-of-the-world reports Proved & Probable estimates, because the industry has a greater need to know what the fields will actually deliver when they plan costly offshore facilities or pipelines to remote areas.
It is worth discussing this critical issue in greater detail. The SEC rules were formulated long ago when most US production was onshore, and required that reserves for financial purposes were restricted to those being drained by a producing well.. Such onshore fields could be placed on production as soon as the first well was drilled, meaning that the reserves grew as the field was drilled up over time, in some cases tapping subsidiary reservoirs or new pools at greater or lesser depth or in the immediate vicinity. In some cases, infill drilling was also undertaken changing the reserve estimates.
In the rest of the world, the reserves of a field are normally reported when production starts, the earlier estimates being held confidential by the company. Host governments take an interest to ensure that good oilfield practices are used to maximize recovery, and in some cases revenue. The companies accordingly have to compromise in their reporting between their general desire to under-report and the demands of the host government. For these reasons, more valid estimates are reported, although still often as much as half what the field is eventually found to deliver."(J. Laherrère, 2000)
Because US operators are obliged to report very conservative proven reserves, a huge amount of reserve growth occurs. This makes it very difficult to estimate whether reserve growth is due to technological advancement or not. It is important to know that the Energy Information Administration makes an excellent division between added contributions from new discoveries, field extensions, new reservoirs discovered in old fields and changes in the reserve estimates of a given oil field. This makes it possible to exclude the contribution from added Oil Initially in Place in estimating Reserve Growth of the United States.
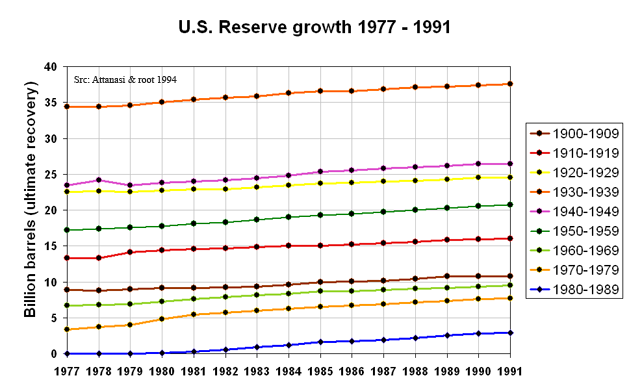
One of the main studies on reserve growth in the U.S. has been done by Attanasi and Root (The enigma of oil and gas field growth, AAPG Bulletin, 1994). The authors show that in the United States reserve growth keeps occuring, even in very old basins, based on proven reserves data from the Energy Information administration. The chart below shows the data from the article divided between oil discoveries per decade. It is clearly visible that most oil in the U.S. has been discovered in the '30s. The data from Attanasi and Root shows that reserves grew with 26 billion barrels between 1977 and 1991. More recent data from the Energy Information Administration shows reserve growth of 22 billion barrels between 1977 and 1991 and 10 billion barrels between 1991 and 2005.
Thanks to the excellent division from the EIA between reserve growth caused by growth in the Oil Initially In Place (OIIP) and growth in estimates for recoverable reserves, growth in OIIP can be canceled out from estimated reserve growth increases. However, it is impossible to tell based on the data to what extent reserve growth is caused by operator underestimates of recoverable reserves due to the practice of proven reserves reporting or due to technological advancement caused the growth in reserves. Nonetheless, the USGS concludes that technological advancement is the main driver in case of the U.S.:
"After 90 years of production, reserves continue to grow for both oil and gas. As part of their study, attanasi and Root (1994)... Although the reserve growth in common fields, as shown above, is attributed primarily to water flood as well as to other EOR techniques [enhanced oil recovery techniques], it is not large enough to offset the decline in the remaining proved oil resreves caused by the ongoing production from the existing fields....The application of EOR techniques has occured in only a limied numbers of fields to date. Therefore, there is potential for additional resreves if EOR techniques are extended to other fields. " (USGS, 2000)
By analysing single field cases better comprehension of the influence of technology on reserve growth can be gained. Jean Laherrère has done analysis on several single fields in the U.S. and the North Sea. By plotting cumulative production versus annual production a reliable estimate can be made of the ultimate oil recovery of the field. Several of his examples are shown below:
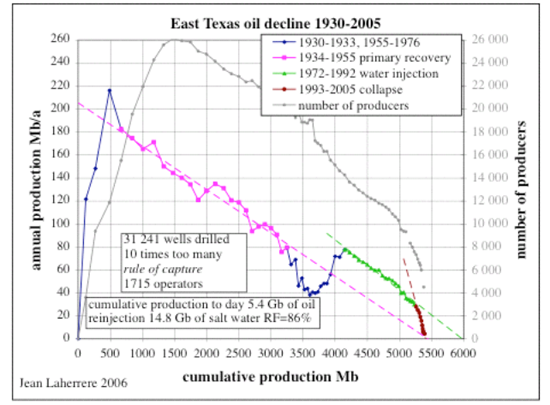
East Texas is the largest oilfield in Texas with an API of 37 degrees and 0.21% sufur content. Production started in 1930, a water injection program began at the end of the '60s. Due to the water injection program east texas ultimate recovery of reserves (URR) estimate was changed to 6 billion barrels. This URR was held between 1975 and 1991. The URR changed back to the old estimate of 5.4 billion barrels in 1992 due to a sharp increase in the decline rate towards 10%, leading to an ultimate production value of 5.4 billion barrels. No increase in the recovery rate is apparent in the later life of this oil field, one of the largest in the U.S.
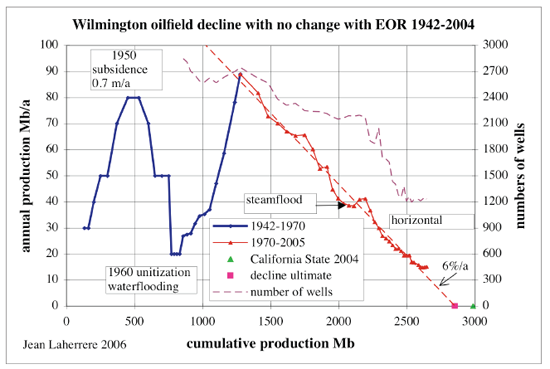
Wilmington is an oil field discovered in 1932 in the Los Angeles Basin in southern California with an API between 13 and 25 degrees. In 1965 a Waterflooding program started. Due to subsidence (a downward shift of the surface), the reservoir became unitised which caused a large increase in the production level, peaking in 1970. The ultimate recovery of reserves (URR) estimate was increased due to this change from 1.2 billion barrels to 2.5 billion barrels. This estimate slowly increased towards 3 billion barrels in 2002. In a 2002 annual AAPG publication it was noted that an optimized waterflooding program and the application of horizontal wells had lead to a significant increase in proven reserves. Jean Laherrère noted however that an Ultimate of 2.8 billion barrels could already have been established in 1972. His observation leads to the conclusion that neither horizontal wells nor steamflooding did increase the reserves of the oil field. Reserve growth occured due to the natural change in the geology of the reservoir.
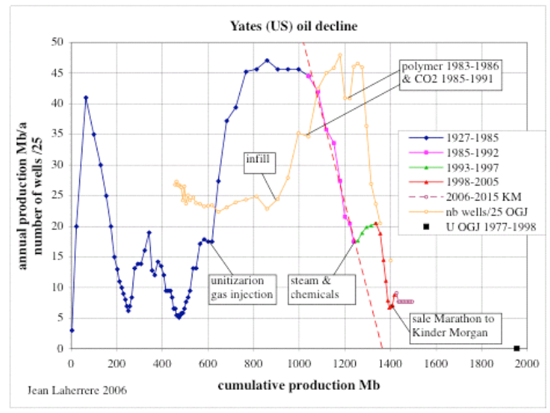
Yates is an oil field discovered in the 1920's in Texas with an API of 30 degrees. After a gas injection program began, oil production sharply increased from 1975 to 1979. In 1984 production started to drop after a sharp plateau and continued to drop despite a Polymer flooding and a CO2 injection program. Between 1993 and 1997 production slightly increased for a few years due to a steam & chemical flooding program, soon after this program decline started again. The ultimate production will probably be 1.6 billion barrels. Enhanced oil recovery programs appears to have slightly increased the recoverable reserves of this field.
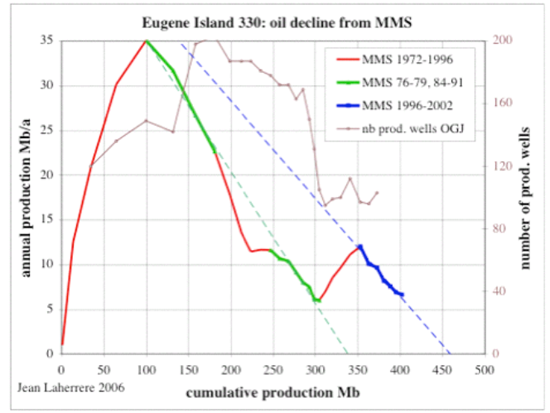
Eugene Island is an oil field in the gulf of mexico discovered in 1971 with an API between 23 and 35 degrees. The field has an expectional structure with one of the largest faults (planar rock fractures, which show evidence of relative movement). This large fault (the red fault) allowed the reservoir to fill rather quickly from the source rock after pressure dropped 24 years from initial production. This exceptional structure caused a significant increase in reserves by reserve growth. Technological advancement does not seem to play a large role here.Details about the reservoir can be found in an article published in an AAPG journal available online.
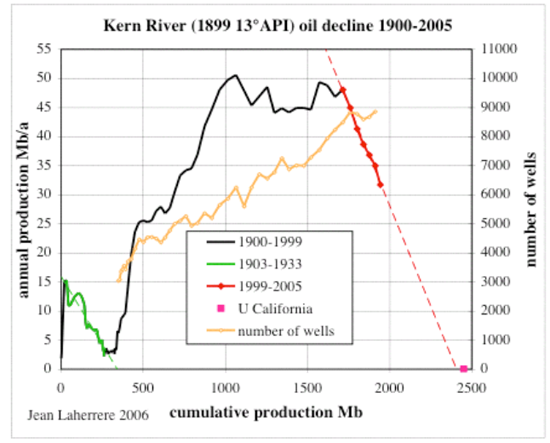
Kern river is an oil field in california discovered in 1889 with an API of 13 degrees. An interesting detail is that the field was discovered by a hand dug hole. A nice graph showing the fields history is also available online. Production of this heavy oil field was first managed by conventional techniques. After 25 years production started to decline towards nearly zero in 1950. In 1961 water injection tests began in the reservoir, causing a slow by steady increase in production. Quite soon a steam injection program is started which helped to increase the production of the field once more, topping at 140.000 barrels per day in 1980. Finally in 1999 the fields production starts to decline again. This example shows that in unconventional heavy reservoirs the application of steam injection helped to increase the reserves of the field.
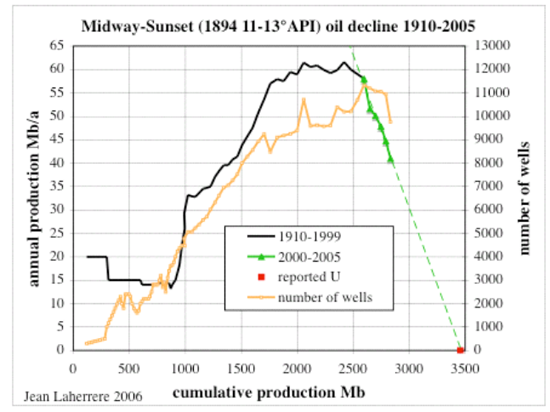
Midway Sunset is an oil field in california discovered in 1893 with an API of 13 degrees. The field shows the same pattern as in the Kern river oil field described above.
Based on the figures and examples that are available with respect to the United States it is not so easy to reach a very clear conclusion on this oil producing region of the world. A large amount of reserve growth in the United has occured due to the practice of reporting proven reserves only. While reserve growth does occur due to technological advancement this seems to be mainly in unconventional oil fields. Several of these fields are also in the case of the U.S. added to the conventional oil reserve pool, and as such used in forecasting reserve growth for conventional oil reserves in the entire world by the USGS. This likely leads to too optimistic estimates with respect to reserve growth for the entire world.
What can we tell from reserve growth in Russia?
In June 2003 a study was published in the Natural Resource Research journal called: Reserve growth in Oil fields of West Siberian Basin, Russia by Mahendra K. Verma and Gregory F. Ulmishek of the United States Geological Survey.
This study compares reserve growth in the following 42 large oil fields in the West Siberian Basin:

The study shows the change shown in the chart below for reserves in two categories, after the discovery year and after producion starts. These categories are divided between four different field sets of the 42 fields.
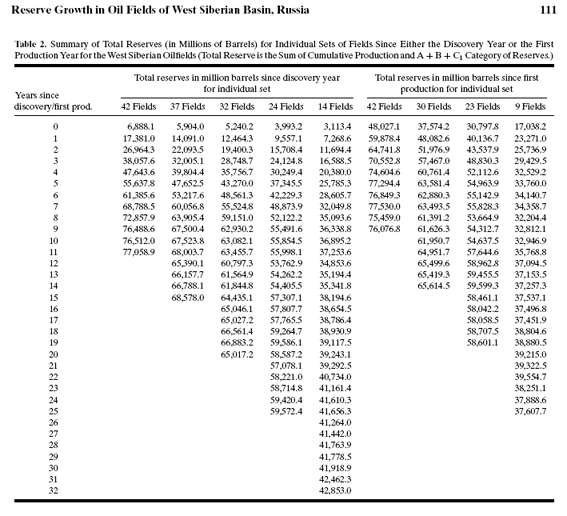
What can be observed is that reserve growth mainly occurs in the first six years after initial discovery. The most likely explanation is an underestimate of initial reserves. Furthermore very little to no reserve growth occurs in later stages of the fields production, supporting the idea that technology does not influence reserves. The authors of the study conclude:
"All the models show rapid reserve growth in the first five years, though to different levels, but the West Siberian models show gentler growth in the following years. Slower growth in West Siberian fields is caused by different reserve booking requirements and probably by insufficient investment in improved production technologies."
In a latter reference to this study the main author, Verma conclude that based on this study and assessments from the US that:
"Field growth occurs in almost all petroleum provinces of the world primarily due to the advancement of technology in various aspects of petroleum exploration and development."
Several doubtful claims about technology are lifted towards reality by the USGS, which are not supported by their own studies. Reserve growth data from Russia does not support the idea that the advancement of technology causes reserve growth in conventional oil fields.
What can we tell from reserve growth in the North Sea?
The North sea is very interesting because the historic data for the United Kingdom and Norway vary wildly with respect to reserve growth. At the same time, both regions have excellent (but different) reporting practices. An early study from MIT (1997) showed large reserve growth in Norway and small reserve growth in the United Kingdom. This was confirmed by a latter more detailed study called Characteristics of North Sea Reserve Appreciation from 2002. Both studies looked at reserve growth since first production started. The author of the second study (Watkins) concluded that:"The size distribution of recoverable oil reserves for oil fields in the North Sea basin has much in common with that elsewhere. It is heavily skewed, with a predominance of smaller fields. The hypothesis of lognormality would not be rejected. The average field size in the UK is less than half that for Norway. In both sectors, a minority of fields account for the majority of aggregate reserves. Reserve appreciation between production start-up and the last observation year (usually 1996) for the average field in the UK was about 20%. For Norway it was close to 50%, over an average production period much the same as for the UK. This difference is marked. And given their larger average size, average appreciation of Norwegian fields approached five times that in the UK."(Watkins, 2002)
The author then goes on looking at the causes of reserve growth in the UK and Norwegian part of the North sea:
"More light on the contrast between appreciation of Norwegian and UK fields is shed by attempting to break down estimates of recoverable reserves into the two components of oil-in-place and the recoery factor, the proportion of oil-in-place expected to be recovered before shut-down. About 75% of appreciation recorded by Norwegian fields was accounted for by increases in the recovery factor, a factor averaging some to 32% at start-up, 42% in the last observation year, a 10 percentage point increase. The rest represented appreciation of oil-in-place of some 13%, on average. The UK experience was quite different. For the field sample used, the great majority of the (lower) appreciation was accounted for by increases of oil in place of 11%; the increase in the recovery factor was some three percentage points between start-up and its value in the last observation year of 47%. However, these UK results are based on information from only about one third of the 96 fields, Norway's on 29 out of 30. The UK oil-in-place analysis, then, must be regarded cautiously. Moreover, comparisons between the two countries may be bedevilled by differences in reserve reporting standards." (Watkins,2002)
"Apart from inherent variations in the physical nature of the fields, much of the difference in reserve appreciation characteristics between the two sectors has to do with the higher average recovery factors at production start-up in the UK. UK field development relied on early inception of ER [Enhanced Recovery] schemes to a greater extent than seems to have occured in Norway. Indeed, by 1996 average recovery factors in Norway still had not caught up with those in the UK."(Watkins,2002)
The first thing that we can conclude from Watkins findings is that reserve growth does occur in the North Sea. The figures he quotes, 20% for the UK and 50% for Norway have been confirmed by Francis Harper, a geologist from BP:
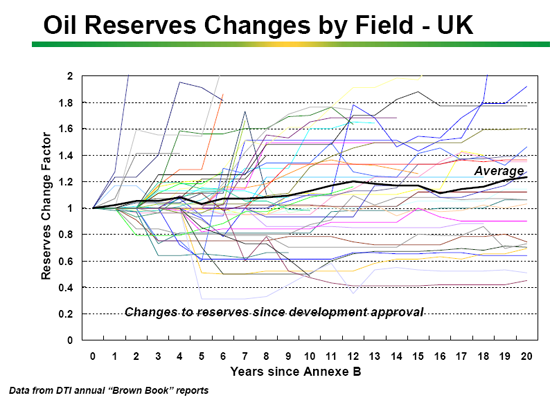
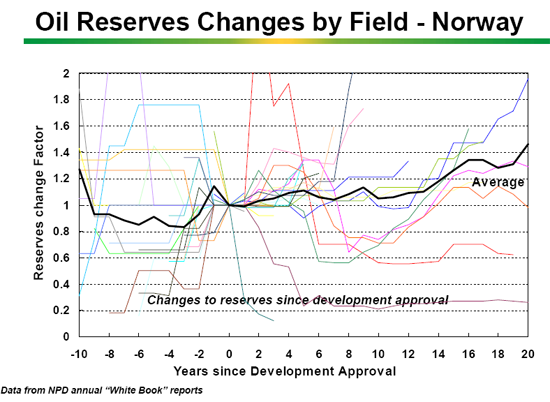
Most of the reserve growth in the United Kingdom can be explained by an underestimate of the Oil Initially In Place. The reserve estimate has been quite accurate over time. For Norway it appears that an underestimate of the recoverable reserves is the right explanation. The conclusion that an influence of technological advancement is the main cause of the increase in the recovery factor for Norway cannot be made from such aggregate figures.
Nonetheless the IEA still uses the North Sea to propagate this view of technological advancement. After showing a chart on the increase in recovery rates in the Norwegian part of the North Sea, the IEA concludes in their resource to reserves report (2006) that "conservative recovery rate increases [from enhanced oil recovery] of 5% of oil in place adds at least 300 billion barrels to the USGS figures.". Again, just like in the U.S. the only way to get a reasonable estimate of the influence of technological advancement over time on North Sea oil reserves is to look at individual cases of fields because the available aggregate data is too imprecise. Jean Laherrère already did a comprehensive field by field study of North Sea oil fields back in 2004. A few examples of his work are shown below:
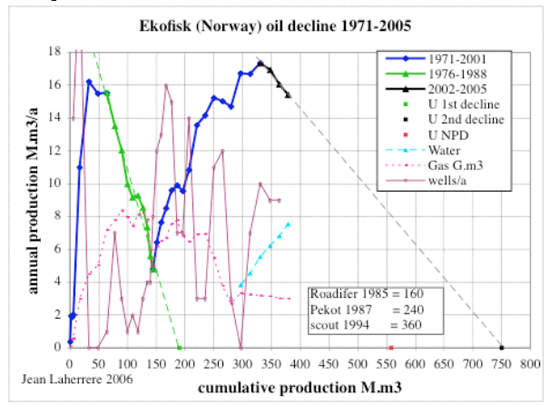
Ekofisk oil field was discovered in 1969 in the Norwegian part of the North Sea with an API of 37.5. Initial production patterns led to far too low estimates for ultimate oil recovery. In the 80's however production started to increase again because the reservoir collapsed when pressure decreased, causing a subsidence of 7 meters. Soon after the collapse many wells for water injection were drilled leading to a large production jump in 1988. The collapse was caused because the reservoir comprises of a special chalk. In 2002 production started to decline again, no changes due to technological advancement have been apparent so far.
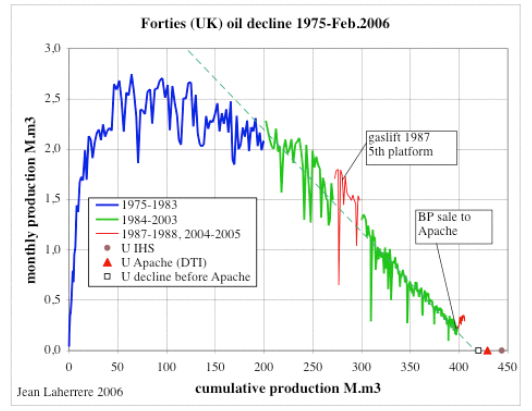
Forties is an oil field in the UK part of the North Sea discovered in 1970 with an API between 43 and 45 degrees. Production followed a normal pattern in the field, showing no increase in reserves over time. A gaslift platform was introduced in 1986, which slightly increased production for a few years until it dropped again to the old production level.
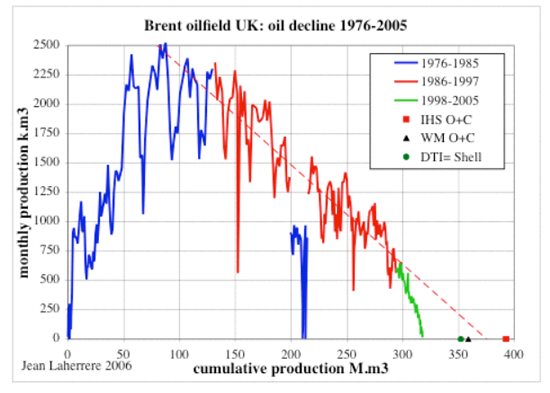
Brent oil field in the UK part of the North Sea was discovered in 1970 with an API of 38 degrees. Production followed a normal pattern until 1988. Due to the Piper Alpha Platform fire production was disturbed between 1989 and 1991. Afterwards, oil production quickly returned to normal leves and continued towards the expected oil recovery path. At the end of the fields life, however, oil production collapsed, leading to a lower then expected ultimate recovery. Reserves did not grow but declined in Brent oil field.
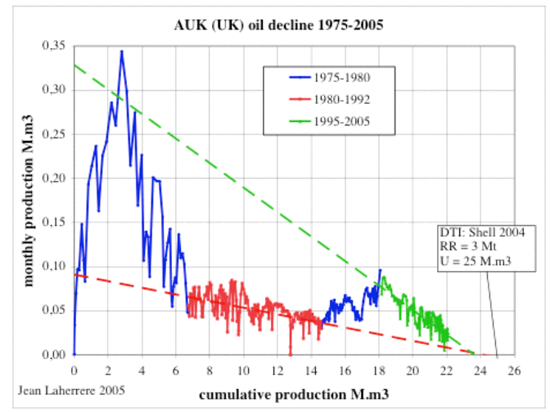
Auk is an oil field in the UK part of the North Sea which was discovered in 1971. Production followed a normal pattern of peak and slow decline until the introduction of Horizontal wells in 1993 (start of second blue part of the graph). Production increased until 1995, after which a sharp decline set in. The implementation of horizontal and multilateral drilling did not change the ultimate recovery of the field. Schneider in AAPG memoir 74 from the year 2000 mentioned that the recovery factor of the field would increased from 17% to 30% from the start-up to the end of the fields life:
"The estimated ultimate recovery in 1988 was 93 million barrels or about 13 million barrels remaining (Trewin and Bramwell 1991). The estimated ultimate recovery in 1998 is about 180 million barrels or about twice the 1988 estimate. A major share of the reserve additions at Auk is from a large field extension (Auk North) found previously by seismic, but considered uneconomic for many years. Previous work by Shell/Esso showed Auk North production was not feasible to develop from a satellite platform or from extended reach wells from existing Auk platforms. Improvement in economics that make Auk North development now possible for Shell/Esso comes from the use of multilateral wells from existing Auk development wells and the use of electric submersible pumps deployed and retrieved on coil tubing without the need of a semi-submersible rig." (Schneider, 2000)
The expected extension (AUK noth) has, however, not come on-stream yet. The claimed incerase in the recovery factor is not visible in the graph.
While it is apparant that reserve growth is a large factor in the North Sea, it is not so clear to what cause. In the UK it appears that it was mainly due to an underestimates of Oil Initially In Place, in Norway mainly due to underestimates of ultimately recoverable reserves. Technology does not appear to have a large impact, but this could be the wrong conclusion. More study on the North Sea would be necessary to determine what the exact cause of reserve growth is.
Summarizing and Concluding remarks
1) Reserve growth occurs in all the three examined regions, Russia, the United States and the North Sea.
2) The huge increase in reserves due to reserve growth in the United States, which sets the US apart from other countries, can be explained because of the unique practice of reporting proven reserves only. This makes extrapolation of the amount of reserve growth in the United States not applicable towards countries that do report in a different manner, which are most other countries in the world. It is impossible to tell from aggregate figures what the influence is of technological advancement on reserve growth. Separate case studies show that in uconventional heavy oil fields, technological advancement plays a main role in reserve growth. In conventional fields no clear role of technological advancement is visible.
3) In Russia most reserve growth in the Siberian basin occurs in the initial phase after discovery/production in oil fields. No reserve growth occurs in later stages of lives of oil fields that have been studied. Reserve growth in Russia appears to be mainly due to initial underestimates of the oil fields potential, not to technological advancement.
4) In the North Sea reserve growth mainly occured to underestimating the Oil Initially in Place in the United Kingdom, while in Norway it was mainly due to changes in the reserves either by underestimates of reserves and/or by technological advancement. Far less reserve growth occured in the UK then in Norway. In the reserve reporting in the UK, enhanced oil recovery was already being taken into account, while in Norway this was not the case. This could explain the difference between Norway and the UK, with respect to the high increase in the recovery factor in Norway and the lower increase in the UK. However, is the difference due to the EOR techniques, or simply due to underestimating the recoverable reserves because of other reasons? And more importantly, can these effects be extrapolated to the future? If the increase in the recovery factor is caused by EOR techniques, this would probably be the case. Single oil field cases do not show an increase in reserves in later stages of fields lives due to the application of enhanced oil recovery techniques.
5)While technology seems to play a part, reserve growth appears to be mainly a function of reserve accounting. Due to more accurate reporting, reserves grow over time. Technological advancement could very well play a role in reserve growth of conventional reservoirs, but this cannot be concluded from the data available in the studies above. This makes claims that reserve growth will occur in the future as it did in the past unreliable.
Personnel
Editors
Contributors
Peak Oil Primers
Archives
- November 2010 (3)
- October 2010 (6)
- September 2010 (4)
- August 2010 (7)
- July 2010 (6)
- June 2010 (7)
- May 2010 (2)
- April 2010 (8)
- March 2010 (4)
- February 2010 (6)
- January 2010 (3)
- December 2009 (5)
- November 2009 (8)
- October 2009 (12)
- September 2009 (6)
- August 2009 (5)
- July 2009 (11)
- June 2009 (8)
- May 2009 (16)
- April 2009 (10)
- March 2009 (7)
- February 2009 (10)
- January 2009 (15)
- December 2008 (9)
- November 2008 (9)
- October 2008 (9)
- September 2008 (13)
- August 2008 (10)
- July 2008 (14)
- June 2008 (23)
- May 2008 (16)
- April 2008 (12)
- March 2008 (16)
- February 2008 (9)
- January 2008 (13)
- December 2007 (13)
- November 2007 (16)
- October 2007 (22)
- September 2007 (8)
- August 2007 (9)
- July 2007 (16)
- June 2007 (8)
- May 2007 (7)
- April 2007 (7)
- March 2007 (10)
- February 2007 (10)
- January 2007 (12)
- December 2006 (9)
- November 2006 (15)
- October 2006 (4)
- September 2006 (5)
- August 2006 (5)
- July 2006 (9)
- June 2006 (5)
- May 2006 (10)
- April 2006 (9)
- March 2006 (13)
Vital Trivia
License

This work is licensed under a Creative Commons Attribution-Share Alike 3.0 United States License.
Rembrandt, thank you for a colossal and magnificent piece of work, it really adds a lot to my understanding of the phenomenon of reserve growth and why it differs in various areas.
There's one other factor that may add very substantially to future reserve growth in the United States-the historical age of discovery of the fields. Many of the great old fields in the US were discovered before any modern geophysics, even before electric well logs. They have been in the hands of small, stripper operators since at least the 1950's, and much of their productive area has reverted to the heirs and assigns of the original mineral owners. Ownership of minerals is mainly in private hands in Texas, Oklahoma, Arkansas and Louisiana. These fields have never had modern siesmic studies and may contain large stratigraphicially isolated reservoirs. This is true for many old Gulf Coast fields in Texas. There's also a heck of a lot of "forgotten" oil in these fields-heavy oil in salt dome cap rock and sands that are very shallow and were not economicly viable until the price run-up of this century. The same may very well be true for old oil fields in places like Baku and the old onshore Mexican and Iranian salt domes.
Hello Rembrandt,
Yes, a terrific analysis! Do you think enough oilfield & tech history has occured where the USGS could take this info and then go back to reassess the oilfields' remaining potential worldwide?
Could the USGS do some kind of massive sorting and compilation by geologic structure and composition, API [heavy vs light], EOR % already applied, % of modern seismic and other tech tools used, additional build-out infrastructure cost-estimates, and other pertinent factors, then derate URR and future possible production by past production history and HL analysis to sum-up a global Minimum Recoverable Reserve [MRR]?
I think the current USGS 'optimistic scenario' needs to be counter-balanced by an additional USGS 'pessimistic scenario'. In short: I would like to see a raging USGS in-house debate not much different than what occurs here on TOD [for example, WT vs R-squared]. IMO, the internal competition would be good for the bureaucrats, and would make their jobs more rewarding.
If there was a USGS faction that wanted to break away from the standard in-house group-think, the overall USGS leader should encourage this team action. They could then openly post to TOD with an 'official blessing', and we would be glad to help them do further research and discussion to build their new scenario.
Bob Shaw in Phx,Az Are Humans Smarter than Yeast?
totoneilia, thats an interesting idea about the USGS stating a pessimistic reserve figure, but not practical because the low stance is obviously a complete crash in oil production-every well stops producing right now. What I'd like to see is a range of probabilities of production in the future, possibly veted against the strategic information gathering from other countries. I'd love to see what the Saudi's and the Russians think is the world future production model and discovery model.
Its really too bad and frustrating that essential information is being judged too political to be released.
oilmanbob,
Good points....let me ask you, what do you think of prospects in the recently opened areas of the Rockies? I am interested in areas that have been "off limits due to environmental "moratoria", and thus not profitable to spend money on exploratory work until recently...
This is very fascinating when it comes to natural gas, and the issues of "stranded gas". This is of interest also in Eastern Kentucky, where the terrein is very rugged, but there is believed to be a lot of natural gas associated with the coal seams that while not profitable to work at $2.00 per million/BTU, it is much more interesting at $7.00 plus.
Any thoughts?
Roger, I just don't know about the Rockies. The whole area was completely open to leasing until the moratorium until, as I recall, about 1980, except for the national parks.How many giant oil or gas field have been discovered since then in the areas not placed in the reserved areas? None.
Same way with the eastern Gulf of Mexico shallow water areas, the California, Oregon, Washington Coasts, the Eastern Seaboard-the major oil companies pretty well picked over the inexpensive and moderately priced potential areas. I wouldn't expect many giant fields in any of those areas.
Areas where technology has improved to the point of new exploration-Deep water Gulf of Mexico-look a lot better. Areas where prices and technology have improved to make reserves formerly uneconomic to develop worthwhile-Bingo!
I think the real economic message of Hubberts peak is the cheap, inexpensive oil and gas has been discovered, and mostly produced. Ehat's left is going to cost more and money until no one can afford it.Quibbling about the exact timing is important to people trying to validate economic mathematical models, but not the rest of us.
Probably 98% of the oil and natural gas thats ever going to be discovered has already been discovered in the producing areas in the US. "New fields" like the Barnett shale were known to exist for many years-thats why George Mitchell tried to produce the shale gas for twenty years before he came up with an economic method. Same with Appalachian coal seam gas and a dozen other plays. People have known about coal seam methane for 150 years in the US. Thats when miners started accidentally blowing up mines.
Whats different is the price, so good engineers have devoted their time to figuring out how to make a profit.
My father had an economic concept he called trading dollars. He said there were a lot of areas-the Giddings Austin Chalk play was the one he referred to-where except for tax sheltering advaantages an investor was just trading dolars. In other words by the time he reached pay-out the cash flow was about the same as buying stock, and stock was a heck of a lot more safe. And he was right, except for the oil price run up from the oil embargo and new technology such as horizontal multi-lateral completions changed that game.
I think horizontal wells and fresh water fracs have changed the economics on coal seam gas and Devonian/Ordivician shale plays. And peak gas has raised prices permanently in the USA.
So how do we make money with this? Aye, thats the rub. The majors aren't a good idea-they're overhead is too high. Same way with companies run by promoters who are always chasing the next hot deal, like EnCana or Chesapeake. My bets are on players like XTO, where Boone Pickens is putting his money, or Anadarko which has stayed focused on buying or drilling long-lived production. These companies are smart and very well managed. Service company stocks are going to do great, this stuff is expensive to drill and complete
Working interests with low overhead or royalties under areas where there is production look best to me. Gas Royalty Trusts look wonderful, they're priced by being discounted to today's prices for future reserves, ad gas prices will very likely double in th next year as we have an average 32% depletion rate in new wells coming online and the stored gas won't cover the decline rate very long.
At any rate, thats my best thinking. I'm personally planning to do 4 or 5 oil well reentries about 60 miles southwest of Houston in an oil field that was discovered in 1902. The wellheads are leaking oil, so I know there's some pressure and a couple of months of production at 5 barrels a day per well should get my money back.
Sounds familiar. Would this be the field that often gets cited by the advocates of abiotic oil?
While I don't hold much stock in the abiotic oil theory, I WAS under the impression that the depths at which the new oil is being pumped into the reservoir was from a location that was outside the 'magic window' where oil can form and not be broken down. Could the magic window be far larger then we believe?
Absent fluids like water or lava, heat diffuses slowly through substances like rock. ISTR speculation that those deposits may not have been at their current depth for very long (in geologic terms). If we had come along in a few million more years there may have only been gas there.
i have heard that speculation also (rapid subsidence) but what do we really know about the fluids produced from this reservoir? there is a fine line between a volitile oil reservoir and a retrograde condensate (gas) reservoir . now i know chevron's scientists know what they are doing but the difference is not always obvious. east anschutz ranch field in se wyoming is a fine example . i dont know if they have ever resolved the issue .
Who knows the reality of the location of the magic window, or if its just a bad hypothesis of the geochemists ? Certainly Jack 2's oil productive zones in the Wilcox and Eugene Island's recharge zone that is thought to be Cretaceous argue that the current hypothesis is incorrect.
The first time I heard the abiotic oil theory was from a petroleum engineer and drilling company owner named Carnes Weaver over 20 years ago in Houston. He was a great old guy, now dead at least 15 years. He presented me the theory not because he believed it, but rather as a thought stimulating exercise. His point, and its definitely a fact, is that oil is where you find it. He thought any place with reservoir rock was potentially productive. His main example was the field in the Panhandle of Texas that produces 25% helium in natural gas. Helium is not reactive with many other chemicals and has a volcanic origin.
So Hothgar, that's a great question, and I don't know if there is an answer to the oil window theory and its place in opposition to Abioticists
Not the threadjack, but that was by far the best Hothgor post I have read yet.
Actually, the SEC restrictions on speculations regarding oil reserves is a form of abiotic oil formation. Clearly the SEC is not an organic entity and they can force reserves to go up and down due to the whims of the current regulators.
For every Eugene Island that we deal with, we have an army of regulators and collusions amongst and within the oil companies to make vast amounts of reserve oil to appear or disappear at a moment's notice. Now that's what I call abiotic oil!
The depleting reservoir that increases flow due to structural anomalies could be another of Mother Nature's cruel tricks. Like when thousands of doomed people gather fish as the tide recedes before a tsunami. Yet another is global dimming masking global warming. Many people interpret good luck as a sign we are being looked after from above. Those people will be left wondering when the luck starts running out.
yes it is (eugene island) the prime evidence cited by the abioticians and what a crock it is other examples i have heard is (are)grant canyon nevada the labarge field wyoming and there is apparently a claim by the abioticians that the tar sands of alberta are "proof" of abiotic oil because of the claim that no known source rock could have produced that much oil a theory that has been debunked
edited post
Is abioticians a new word coinage? I like it, its concise, precise and descriptive, unlike our favorite word on this site, cornucopians.
you read it here first
congratulations on your work and research on the subject of reserve growth. the yates field of west texas is usually cited as an example of gravity drainage and i dont know about wilmington but it seems that i have heard that claim (gravity drainage) as well. I think your conclusion that reserve growth in the norwegian sector is correct because of the larger fields there (than the uk sector). what does all this have to do with reserve growth ? i will try to explain
the fundamental methods available a reservoir engineer are generally based on volumetric calculations, material balance calculations, and production history (decline curve analysis). numerical simulation can also give a forecast (of reserves) but requires an extensive knowledge of the reservoir.
volumetric calculations require an estimate of original oil in place . early in the life of a field this may not be known. material balance calculations cannot be applied until a substancial amount of production has occured
as to recovery factor this is dependent on the producing mechanism of the reservoir and as a general rule the following applies
solution gas drive (depletion) 10-20% of ooip
complete water drive (or a real successful waterflood) 40%
gravity drainage up to 65% (gas cap expansion is really a special case of gravity drainage)
the field may not fit neatly into a single catagory so you see that the recovery factor can be all over the map
decline curve analysis is valid after an actual decline in production has occured and is the most reliable
Did we loose WESTEXAS? I don't see his name on the contributor list...
Is that clumsy fingers that created 'loose' rather than 'lose'?
I am quite impressed with those West Siberia reserves numbers since first production. The do not ever go down although, as you say, after the first 5 years they do level out. I shall have to look at the actual basins/fields and see if I can find the actual production data.
I don't think we are supposed to look at these numbers subtracting production. These are modifications to the original reserve estimates, which assumes production does not deplete the reserve.
You misunderstood me. Perhaps I was not clear, WHT. In the old Western Siberian fields, production is declining. I just want to know what those numbers look like. Yes, we're probably supposed to look at these numbers outside depletion. Apparently, it would cost me $40 to find out for sure. But here is the point --
See, it's those incompentent Russians! More fun with reserves numbers!I don't understand the great distinction between reserve growth in US versus Siberian Russia.
According to A&R's data, most of the reserve growth occurs in the first 10 years after discovery. While in Siberia it "mainly occurs in the first six years after initial discovery".
The other thing that bothers me is this: "Thanks to the excellent division from the EIA between reserve growth caused by growth in the Oil Initially In Place (OIIP) and growth in estimates for recoverable reserves, growth in OIIP can be canceled out from estimated reserve growth increases." It just seems to me that if we can actually separate out the influences to reserve growth to that fine a degree, that we would have a great model for what is actually going on. However, I don't see a model or simulation describing this referenced anywhere. After all, these are both virtual/abstract metrics and do not represent anything concrete.
or maybe it is "false concreteness" as expounded by bolton (short term un rep)
If he said that, it was his moustache talking. I didn't think Bolton was that clever.
he reminds me of that short guy on "laugh in" artie something wearing a top hat who was always mumbling something and then he would get whacked in the head with a cane
Very interesting, but stupid!
(sorry, wrong Artie Johnson character)
When I saw this:
I immediately thought of this:

Euan posted the second last week and prior to that at some point. Sorry, it's only peripherally related to the point of this post, but it makes the case that Euan noted that a few outlying points don't necessarily make HL wrong.
(Edit - I should note that Euan's graph was in response to one by Freddy Hutter here.)
major oil pipeline explosion in nigeria kills 500
I'm in agreement based on what has been presented. The IOR & EOR seem only to accelerate the recovery ... not extend it. When Euan has enuf data points, it will revert to SA's 290-Gb ultimate from its present "infinite" course.
In a wider study, we may see that only the graphs that support the theory have been presented. There is an element of trust in Rembrandt's presentation.
I thought the point was made even more dramatically with the East Texas graph
Look at that crash!
Any knowledgeable posters out there willing to explain why the East Texas field crashed like that?
Could a similiar crash be in store for Ghawhar? or Burgan?
Correct me if I'm wrong, but I always viewed an oil field from the standpoint of a good old fashion East Texas water entertainment system: the slipping slide. Any kid knows that the longer the slipping slide, the less 'water' shoots out at you, and the steep the slope needs to be. On the same token, I suppose you could look at an oil field like a giant slipping slide or a balloon: the more 'holes' you punch into it, the quicker it deflates and drains out.
As the graph itself says, they drilled 10x too many oil wells, and the pressure dropped like a rock. That also helps explain why SA has drilled only a fraction as many wells and has maintained a high rate of production for many decades.
I don't have any experience at forecasting reserves, but just analyzing the data presented here shows that the EOR techniques have boosted ultimate reserves. Net effect from water flood, infill/horizontal drilling, or gas injection is a boost in production for a short time, then a steeper decline in production. Most of the graphs show rather small increases in URR for the US fields.
mbnewtrain, thats true for major fields of conventional oil. Kern County California heavy oil would have been abandoned except for steam injection about 50 years ago.
The moral is that unconventional oil-Its heavy oil, very shallow in Kern Co.-that can now be produced with new technology is a gain in total fluids production. But the jury is still out on conventional fields, because any real gain is only going to be calculable after the point where the field would have been abandoned without the technology. And since money in your pocket is worth more to you than any promise that the check is in the mail, a.k.a. present value, then the production increase for the present is worth more.
The East Texas Field is a large water drive and very high quality oil field. The water is pushing oil to the producing wells. The field was initially overproduced, and after several round of litigation and some very colorful interventions by National Guard troops and the Texas Rangers (in one case--one Texas Ranger, Lone Wolf Gonzalez, as in "One Riot, One Ranger,") the state succeeded in restricting production in the Thirties, but not before oil prices fell as low as 10 cents per barrel. This was the start of the Texas Railroad Commission's control of oil production.
I believe that the allowable was gradually increased in the Sixties, leading to the secondary peak. The decline was a result of natural depletion, as more and more oil wells watered out. The field is now producing 1.2 mbpd of water, with a 1% oil cut, i.e., a 99% water cut.
All of these large water drive reservoirs are on the same path to where East Texas is now. For example, Prudhoe Bay has a 75% water cut. Ghawar is somewhere between 30% and perhaps 55%. Cantarell is quickly watering out, with as much as a 40% annual decline rate. Burgan is watering out, and Daqing reportedly has a 90% water cut. In any case, a 30% plus water cut in a field that has already been redeveloped with horizontal wells (Ghawar) is not a stable situation.
Ghawar is to Saudi Arabia as East Texas is to Texas. The big difference is that Ghawar accounted for more than 50% of Saudi Arabia's recent production, versus about 7% for the East Texas Field versus overall Texas production.
The near certain simultaneous decline of the four super giants (we just can't confirm a decline/crash at Ghawar) is why is it so unreasonable to expect rising world production. In any case, as Deffeyes predicted, world crude + condensate production is declining.
http://www.txdps.state.tx.us/director_staff/texas_rangers/
Rethin, the East Texas field is an interesting story, Halbouty and Clark's book The Last Boom tells the story. This is my understanding, and may not be exactly correct unless I reread the book, and I haven't read it in 20 years. With that caveat: Oil prices fluctuated wildly in the early days. World consumption wasn't very high, and every time the producers brought in a new field the price crashed until the production crashed. The State of Texas put regulation of the oilfields in the office of the RailRoad Commission in 1919, but early regulation was pretty lax. Oil prices mostly varied from about $1.00 a barrel to $2.50 per barrel.
In 1929 the US economy collapsed. The cotton economy had been in a depression since the end of the first world war, and times were tough in East Texas. A wildcatter named Doc LLoyd poor-boyed some wells, selling more interest in the wells than 100% and then had bad luck-he found the biggest oilfield in America, the great East Texas field which produced huge wells-10,000 barrels a day. His lease block only had a portion of the field, and every promoter in America headed for Kilgore and Longview, now famous as Hothgar's home.
It was shallow, sweet crude from the Woodbine, a cretaceous sandstone, very prolific and all the operators drilled as fas as they could and crashed the price of oil to 10 cents a barrel. Nobody was making money. The Governor of Texas was Ross Sterling, one of the founders of the Humble Company, now Exxon-Mobil. He sent in the National Guard and the Texas Rangers and made all the operators shut in their wells and stop producing until oil reached $1.00 a barrel. Thats the first crash on that chart above.
Then the RRC was given the authority to regulate wells to prevent economic waste. They had lots of hearings and court fights, but the result was operators could only produce their wells 18 barrels a day for about 15 days a month. Then the US entered WWII in 1941. The field was cranked up, and it produced about 1/4th of the Allies oil for the duration. Regulation reumed in the late 40's, but natural decline had set in, it was a water drive and areas were watering out. Sometime in the 1950's the operators started reinjecting water, but the wells had the same low allowable. In 1970 the RRC set the allowable statewide at 100% except for East Texas and Yates, one of Rembrandt's other graphs.
This regulation was a real economic success, and proved the value of regulating production and reinjecting water. But because of its history-uncontrolled production before 1932 and hard production during WWII, I'd be cautious applying the slope to other Supergiants. There's more than you ever wanted to know about the East Texas Field!
WT,Bob thanks for the replies.
Re: The "Dog Leg Up"
Texas and the Lower 48 showed similar deflections right before they peaked, and like Texas and the Lower 48, Saudi Arabia and the world are both now showing lower crude + condensate production.
I'd love to see a plot of the URR broken out by the age of the field say 5 10 15 20 20+ years. Even better would be a time snapshot every 10 years from say 1920.
I'm pretty sure it would show that right now a lot of our remaining URR is located in older fields that have peaked or will peak soon. This is I think important. And in a sense its the underlying physical reason for the HL method.
I am assuming that the twin charts, Chart 10 and Chart 11, "Oil Reserve Changes by Field U.K"., and "Oil Reserve Changes by Field Norway" were put in for comic relief, I know it's the best laugh I have had today!
I would love to take a chart that looked like that to my boss and tell him that it was indicative of anything other than raw chaos....but I want to wait unitl the las day I intend to be employed with him to do it! :-)
The whole thing is becomming a "how many angels can dance on the head of a pin" type exercise. The input data is bad beyond belief, and so the output equally so....GIGO. If I had to rely on the numbers I have seen here and elsewhere when investing my money, I would want ti hedged twelve ways from helll, but of course, that destroys the option of "directed focused action", which is just what we need if a major change must occur and SOON.
What amazes me is that given the blind fog they operate in, the energy industry can get any investment al all.
RC known to you as ThatsItImout
But that's why we love statistics so much. Put enough of this seriously noisy data together and you can start to see emergent behavior. We know the answer is in there somewhere, we just have to dig it out.
Looking back at when I previously analyzed these two "noisy" charts, it really tells us the amount of reserve growth is pretty small and the estimates are noisy because they are essentially trying to chase down a SWAG to a gnat's eyelash. In other words, this kind of noise when put on the USA's reserve growth of 10x or so, would appear as a small jitter.
http://mobjectivist.blogspot.com/2006/03/reserve-growth-reloaded.html