| Site migration this weekend; make sure your email address is up-to-date | The Oil Drum | DrumBeat: December 23, 2006 |
A Primer on Reserve Growth - part 1 of 3
Posted by Rembrandt on December 23, 2006 - 7:05am in The Oil Drum: Europe
The only institute that has done exensive studies with respect to the growth of recoverable reserves over time is the United States Geological Survey. In their World Petroleum Assessment 2000, the USGS claims that between 1996 and 2025 worldwide conventional oil reserves will increase by 730 billion barrels due to reserve growth.
A large amount of forecasting institutes such as the International Energy Agency and Energy Information Administration take the figure of 730 billion barrels from the USGS for granted. In addition to forecasting institutes, oil companies often claim that reserve growth is the key to postponing the worldwide peak of conventional oil production. The question is to what extent the USGS prediction can be relied upon.
Two weeks ago I posted a piece about the discovery forecast of the USGS. In this second post with respect to the USGS World Petroleum Assesment 2000 we take a first glance at what reserve growth really is and what we can learn from studying the worldwide recovery factor of conventional oil fields
Because the topic is so complex, I have decided to split this keypost into three parts:
-
General introduction to reserve growth, what can we learn from the worldwide recovery factor of conventional oil fields?
-
What do scientific studies say about reserve growth in the United States, the North Sea and Russia?
-
To what extent does the USGS study give a reliable figure for future reserve growth?
Lets start with a simple definition of reserve growth
Reserve growth is an increase in the estimated recoverable oil reserves from the moment that an oil field is discovered and/or starts producing until the end of the fields life.
In order to study reserve growth it is necessary to look at the change in estimates for recoverable reserves over time in the life of an oil field, from initial production until the time at which production seizes.
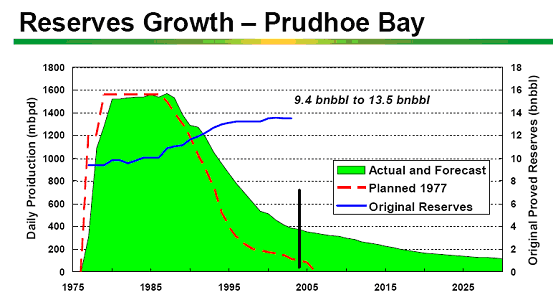
As an example of reserve growth the American oilfield Prudhoe Bay is shown below. Prudhoe bay is one of the largest fields in the world. Production started in 1975. In 1977 it was forecasted by reservoir engineers that ultimately, 9.4 billion barrels would be produced from the field. By 2005 this estimate had been increased to 13.5 billion barrels. Estimated reserves in Prudhoe Bay have so far "grown" with 4.1 billion barrels over time. Of course we won't know until Prudhoe Bay stops producing whether this will actually be the case.
The causes for reserve growth can be classified into three main groups:
1) An Increase in the Oil initially in place (OIIP), for instance by the discovery of an extension to the field or the addition of a satellite (small oil field nearby). This addition is sometimes counted as a discovery and sometimes as reserve growth. The addition of Oil Initially In Place usually does not change the recovery factor.

2) An increase in the reserves of the field due to bad and inconsistent reporting practices. For instance, due to financial reporting rules (conservative) instead of geological reporting rules (probable). The change of reserves from past underestimates falsely change the expected oil recovery factor.
3) Technological development that causes an increase in the amount of oil that can be recovered. These changes cause actual changes in the oil recovery factor.
The way in which overall reserve growth can be measured is by simply looking at past estimates for recoverable reserves and comparing those with present estimates for recoverable reserves in oil fields, countries and the world. By correcting for discoveries in a given timeframe, this comparison gives the amount of reserve growth. However there are a few restrictions that need to be taken in mind. In order to prevent comparing apples with oranges it is necessary to look at the best estimates for recoverable reserves over time (not too conservative or too optimistic). This means taking changes in proven + probable (2P) reserves over time, because this approach gives the best estimate for ultimate recovery of an oil field. This implicates that publications and databases that base themselves on proven reserves such as the World Oil, the Oil & Gas Journal and the BP Statistical Review are automatically ruled out for purposes of making reserve growth estimates!. The only sources that should be taken to study reserve growth are the IHS Energy and WoodMackenzie databases, because these are the best databases which contain proven + probable reserve estimates.
However simply looking at the changes in reserve growth over time do not tell enough for future forecasting. This is because this method does not make clear by which of the three causes reserve growth has occured. This is important to know, because as the amount and reliability of data on the world's oil fields increases it is not likely that reserve growth due to underestimates caused by bad reporting practices will be as large in the future as in the past. If reserve growth is however caused mainly by technological development, it is more likely that the trend in past reserve growth will continue. This is why it is necessary to find a way in which to measure the different types of reserve growth.
One of the better ways to do this is by looking at the change in the recovery factor over time. The recovery factor is the percentage of oil resource in an oil field that is estimated to be recoverable. As an example, if there is an oil field that contains 2 billion barrels of total resource (Oil initially in place), and over the lifetime of the field 26% is recovered (520 million barrels), the recovery factor will be 26%. Many claim that the recovery factor over time will keep increasing due to technological advancements (IEA, resources to reserves, 2005). Since type I (increase in the OIIP) does hardly influence the recovery factor, a seperation can be made between Type I and type II (bad reporting) + III (technological advancement) of reserve growth. Secondly, if the reporting practice is good enough, then reserve growth should not occur anymore due to type II since there is sufficient reliable data that can be tracked over time.
The problems with studying reserve growth
The main problem with reserve growth is that the data on oil field reserves is very bad. The best databases in the world are IHS Energy and WoodMackenzie, of which IHS Energy (formerly petroconsultants) is the largest. These databases have been gathering data for a long time, but it was not until the end of the '90s that the sum of data has become so large to be reliable with respect to looking at worldwide reserve growth. In addition there still is no reliable data for the largest oil producers with respect to recoverable reserves (the OPEC countries in the middle east and Russia). The most problematic example is the huge increase in reported oil reserves in the Middle East in the '80s. The OPEC countries claimed an increase in their recoverable reserves of approximately 300 billion barrels within the space of five years while no significant new discoveries were made. This increase is accepted for several Middle East countries even in the IHS Energy database, and to lesser extent in the WoodMackenzie database. We can count these increases as reserve growth, but to what extent are these increases reality? Is the oil really recoverable? If the claimed reserves from OPEC countries is too high, then reserve growth would also be overestimated.
The second problem is that big assumptions are made based on very little data. There are only three countries in the world for which reasonably consistent datasets are available in the public domain, Norway, the United Kingdom and the United States. The USGS study for reserve growth is based on extrapolation from the past in the United States onto the entire world. The authors claim that this is not a problem, which we will discuss in part 3.
What are the various claims with respect to reserve growth?
In essence there are two different visions with respect to expected reserve growth. The first sees technology as the main driver which will continue to cause a large increase in the recovery factor in the future and therefore a large increase in the amount of oil that will be produced. This group ignores the two other categories of reserve growth (underestimates of OIIP + bad reporting practices). Acting as if all reserve growth comes from technological development. One of the most important publications in this part is the World Petroleum Assessment 2000 from the United States Geological Survey. The USGS claims that there is potential for reserve growth potential between 1996 and 2025 for 730 billion barrels in the entire world. While the USGS in the World Petroleum Assesment 2000 did not promote the view that this was solely due to technology, in latter publications this has been mentioned (USGS,Vekma, 2000). Others who use the USGS figures also claim that there is no problem ahead with respect to peak oil because of technological development. Examples are the International Energy Agency, the Energy Information Administration and oil companies:
"Currently available technologies enable 30 to 35% of the oil in place in reservoirs to be recovered. Increasing this percentage by 10% could represent an additional 200 billion to 300 billion barrels of global reserves, or nearly ten more years of production." (Total, Corporate Social Responsibility Report 2004, page 74)
It is interesting to note that the figures cited in the TOTAL publication are flawed. Since the Oil Initially In Place is estimated to be 5500 to 7000 billion barrels for conventional oil, an increase in the recovery factor of 10% would mean an additional 550 to 700 billion barrels.
The second group thinks that reserve growth is mainly an anomaly due to bad reporting practices. Since the amount and reliability of data has increased over time, this means that reserve growth will decrease in the future. More importantly, if reliable estimates are taken for the recoverable amount of reserves and the Oil Initially In Place, one would not have to account for future reserve growth, since it would no longer occur. While technological advancement serves its purpose to produce reserves faster and more cost efficiently, the amount of recoverable reserves does not increase due to technology in the world view of the second group. One cannot simply change the geology of an oil field due to adding for example horizontal instead of vertical oil wells. The main argument used is that the largest amount of reserve growth occurs in the first six years after initial discovery/start of first production. In later years, when new technology is applied, little to no reserve growth occurs. In some very special cases reseve growth occurs seems to occur due to technology at the end of the life of several oil fields, however this is due to natural causes which change the structure of the reservoir (such as in the Ekofisk oil field in the North Sea). In nearly all cases technology only succesfully enhances early production at the detriment of production at a later stage, it does not increase the recoverable amount of reserves.
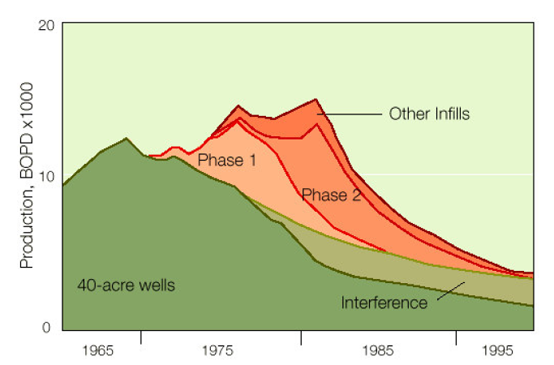
An example of this effect is shown in the chart below. We see a field at which two types of Enhanced Oil Recovery techniques were applied (phase I and II). Due to the introduction of these techniques production by conventional means dropped further then would normally have been the case (darker green). The amount of production shown in the light green part of the graph would have been produced by means of conventional recovery if EOR had not been applied. Now the same amount of oil is produced in phase I and II in red/pink. The light green slice has been added in the graph for comparison purposes. The oil wells of the applied techniques interfered with the normal production wells, causing a sharp drop in the normal production wells. On a net basis, conventional production techniques would have caused the same reserve level at the end of the fields life, but the oil would have been produced much more slowly.
The best known proponents of the second group are investment banker Matthew Simmons (Simmons & Company) and geophysicist Jean Lahherrère (ASPO France).
What does the worldwide recovery factor tell us?
By looking at the change in the worldwide recovery factor in oil fields, we can obtain a rough estimate whether reserves are increasing due to technological advancement or not. The problem is that the change in recovery factor is largely influenced by bad reporting practices and past underestimates. However, over time the data has become better so it is possible to look at what the change in the worldwide recovery factor tells us in more recent years. In general, a figure of between 33% and 37% is often quoted for the worldwide recovery factor. The reliability of such precise figures is highly doubtful as also agreed upon by the International Energy Agency:
"Numbers of this order [recovery factor of 35%] are often quoted, but rarely supported by abundant data. In fact, it is in principle necessary to look at abandoned reservoirs, estimate original oil in place (which is always somewhat uncertain) and compare it with actual cumulative production up till abandonment. Also, because such analysis looks at the past, it does not necessarily take into account current, more advanced technology practices. The data available is mainly from the United States." (IEA, Resources to Reserves, 2005, pag. 51)
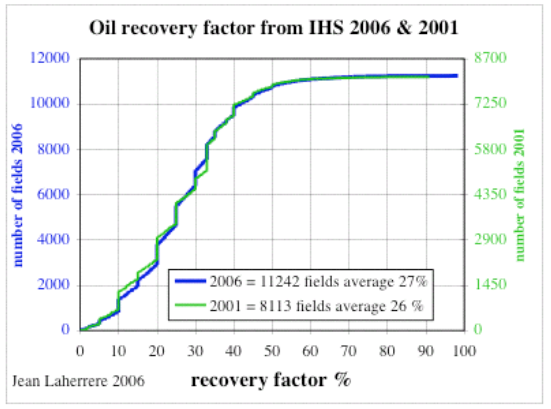
A recent chart from geophysicist Jean Laherrère from ASPO France shows that the worldwide recovery factor worldwide is more likely to be 27%. He bases this on an average of 11242 oil fields from the IHS Energy Database. IHS Energy, formerly Petroconsultants, has a considerable amount of data that is not available to the public. An earlier comparison from the IHS Energy database back in 2001 when the database was less complete showed an average recovery factor of 26%. This implies that the recovery factor has hardly changed over time. The slight difference is more likely to be explained by the increasing number of fields, then an increase in the recovery factor.
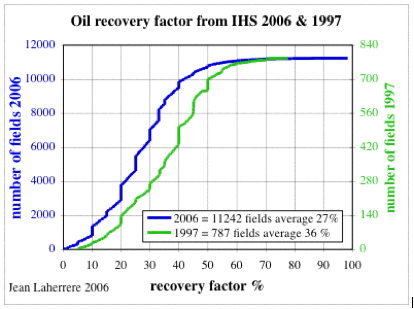
An similar graph from Laherrère comparing IHS 1997 (897 fields) and IHS 2006 (11242 fields) actually shows a large decrease in the recovery factor. This can be explained by the sheer change in fields used for comparison.
Kjell Aleklett, President of ASPO recently gave a presentation in my country in the city of Groningen. There he presented the following graph below on recovery factors which, if I remember correctly, was based on data from Statoil. It shows a current worldwide average recovery factor of 29%. A nice detail is the line which compares the claims from the Saudi's about the average recovery factor in Saudi Arabian oil fields with the average recovery factor of the world. The claimed recovery factor in Saudi Arabian oil fields appears to be unrealistically high at above 50%. There are several claims that Saudi Arabia will be able to increase their recovery factor by 10%/20% in the next decades by Saudi Arabia/oil companies and the IEA/EIA. These claims seem to be even further from reality when comparing recovery factors from Saudi Arabia to other countries such as Norway, which has an average recovery factor of 45 and hopes to get this to 50% in the coming decades.

A similar value has been quoted by Francis Harper, a geologist from BP. Based on 9000 fields in the IHS Energy database he came up with an average recovery factor of 30%.
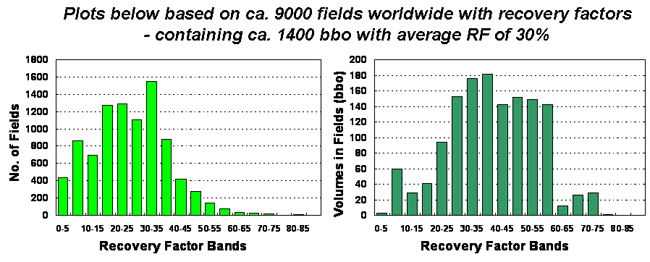
In all the time that I have studied the issue of peak oil I have only come accross one chart that compares the worldwide recovery factor in oil fields over time from the "optimists" perspective. This chart was published in the International Energy Agencies World Energy Outlook 1998, shown below. In this chart the IEA compares giant oil fields from two databases (200 giants Laherrere 1996) and (300 giants Roadifer 1987):
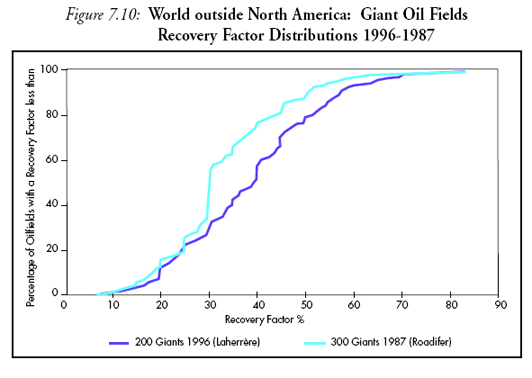
The IEA concludes from this chart that:
"Using data from Figure 7.10, it has been calculated that the average recovery factor for Roadifer's 1987 sample of 300 giant oilfields was 33.3% compared to 38.6% for Lahherere's 1996 sample of 200 giant oil fields. This analysis suggests that the average giant oilfield's recovery factor increased by 5.3 percentage points in the space of nine years, or 0.6 percentage points per annum. In the unlikely event that giant oilfield's recovery factors were to continue to increase at 0.6 percentage points per annum, then by the year 2020 the average recovery factor would be some 14.2 percentage points higher than in 1996. The average giant oilfield in 2020 would therefore have an average recovery factor of 52.8%." (IEA, World Energy Outlook, page 100)
The IEA then goes on with discussing the validity of this comparison:
"One criticism of this analysis is that it is based on two different sets of giant oil fields. In discussions with the IEA about this comparison Jean Laherrère has made the point that the comparison is between two different distributions of fields. Each distribution therefore contains different fields and one is not directly therefore comparing like with like. While this criticism undoubtedly has some validity, the sample sizes are sufficiently large for there to be considerable overlap between them. Put simply, Figure 7.10 shows evidence of giant oil fields' recovery factors improving during the period 1987 - 1996. It may no be possible to extrapolate this result to all fields."(IEA, World Energy Outlook, page 100 - 101)
The problem with this graph from the IEA is that it appears to compare apples and oranges. While looking through several of Jean Laherrère's papers I came accross an old graph which depicts his 200 giant fields set (1996) based on IHS Energy used in the IEA graph. The graph from Laherrère also shows another set of 800 large oil fields from Laherrère (1996), Roadifer's set of 300 giant fields from 1987 and a set of 3300 oil fields Laherrère (1996). The distribution in the 300 giant fields Roadifer set does not show the same difference with the set of 200 fields from Laherrère in the graph from Laherrère! When one looks in more detail, it seems as if the IEA has taken the Laherrère(1996) set of 800 large oil fields, and compared it with the Laherrère set of 200 giant fields (1996). The comparison is shown below (click for large version).
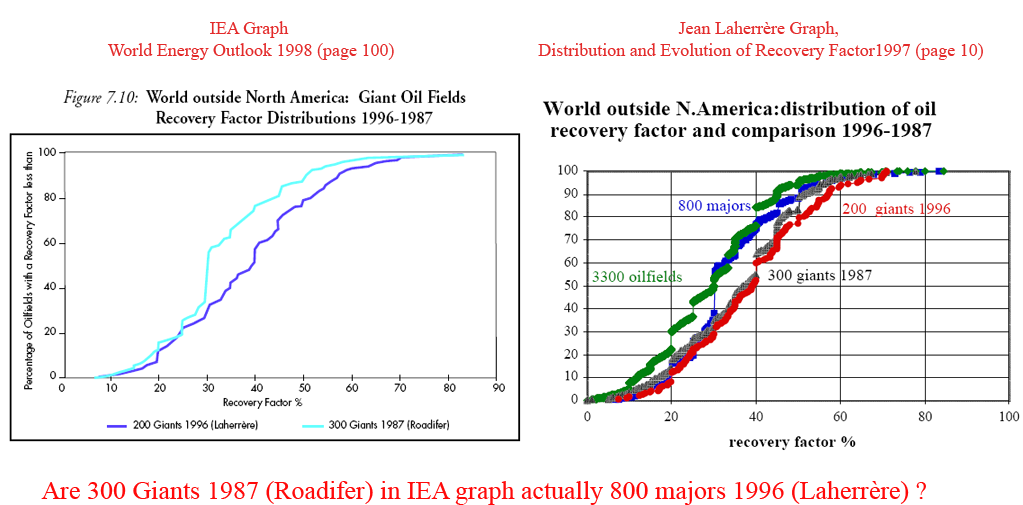
In one of these charts there is a large error. The question is which one? I tried to find out which chart shows the error, however when contacting Jean Laherrère he told me that he has lost the original datasheet from 1997, and I can't find Roadifer's data. Before this case is solved, it is hard to discuss recovery factors based on this specific graph from the IEA. To me it looks like the IEA graph is flawed.
Summarizing and concluding remarks
-
The issue of reserve growth is a very complex one that needs to be studied in detail.
-
The data that is available to the public is not usable at all to compare reserve growth. One needs to compare data in large reliable databases that contain estimates for proven + probable reserves over time, preferably per separate oil field.
-
Claims about reserve growth based on changes in the worldwide recovery factor before the end of the 90's should not be taken seriously. This is because it is only in the last decade that the amount of data in the IHS Energy database is large and reliable enough to make comparisons.
-
There are large differences in views with respect to reserve growth from technological advancement. One group sees technological advancement as the leading factor. Since technological development continues this means that reserve growth will continue in the future like in the past. The second group thinks that reserve growth is mainly an anomaly due to bad reporting practices. Since the amount and reliability of data has increased over time, this means that reserve growth will decrease in the future. More importantly, if reliable estimates are taken for the recoverable amount of reserves, one would not have to account for future reserve growth, since it no longer would occur. While technological advancement serves its purpose to produce reserves faster and more cost efficiently, the amount of recoverable reserves is not increased due to technology in the world view of the second group.
- Based on the data in the IHS Energy database it seems that the worldwide recovery factor did not increase in the past five years. This could mean that large reserve growth due to technological advancement can be ruled out. However, the time period is so short that this conclusion could be preliminary.
Personnel
Editors
Contributors
Peak Oil Primers
Archives
- November 2010 (3)
- October 2010 (6)
- September 2010 (4)
- August 2010 (7)
- July 2010 (6)
- June 2010 (7)
- May 2010 (2)
- April 2010 (8)
- March 2010 (4)
- February 2010 (6)
- January 2010 (3)
- December 2009 (5)
- November 2009 (8)
- October 2009 (12)
- September 2009 (6)
- August 2009 (5)
- July 2009 (11)
- June 2009 (8)
- May 2009 (16)
- April 2009 (10)
- March 2009 (7)
- February 2009 (10)
- January 2009 (15)
- December 2008 (9)
- November 2008 (9)
- October 2008 (9)
- September 2008 (13)
- August 2008 (10)
- July 2008 (14)
- June 2008 (23)
- May 2008 (16)
- April 2008 (12)
- March 2008 (16)
- February 2008 (9)
- January 2008 (13)
- December 2007 (13)
- November 2007 (16)
- October 2007 (22)
- September 2007 (8)
- August 2007 (9)
- July 2007 (16)
- June 2007 (8)
- May 2007 (7)
- April 2007 (7)
- March 2007 (10)
- February 2007 (10)
- January 2007 (12)
- December 2006 (9)
- November 2006 (15)
- October 2006 (4)
- September 2006 (5)
- August 2006 (5)
- July 2006 (9)
- June 2006 (5)
- May 2006 (10)
- April 2006 (9)
- March 2006 (13)
Vital Trivia
License

This work is licensed under a Creative Commons Attribution-Share Alike 3.0 United States License.
I think this is a key statement and I have to admit to not fully understanding this phenomenon but want to document a number of "behavioural" points which I think may be releavnt to the overall debate.
- The more wells that are drilled on a field the more reserves get shifted from 2P to 1P reserves - so growing 1P reserves is a natural consequence of drilling activity.
- In a new province, such as the North Sea was 35 years ago, companies making large discoveries often saw advanatage in concealing the actual size of discoveries from the authorities - so as to not attract too much attention for taxation purposes.
- Companies would often adopt a very conservative approach to reserves estimates for investment purposes - better to underestimate and have a field turn out better than expected than to overestimate and make a loss.
- Giant fields have tended to produce more oil than objective estimates of their reserves.
So point 1 leads naturally to reserves growth with time and points 2 to 4 have tended to result in declared reserves being underestimated with the inevitable consequence of subsequent reserves growth.- In smaller fields companies have tended to over-estimate reserves.
- I wonder if companies that are struggling now to make new discoveries and to replace their reserves may be inclinded to over-state the position of new discoveries.
In short, I speculate that reserves under-estimation may be a feature associated with times of plenty and production growth and wonder if reserves over-estimation and shrinkage might characterise the production decline phase stemming from points 5 and 6 - note this is speculation.Given that this is a "Primer" it behooves us to provide some pointers for newcomers regarding what a "Reserve" number is to begin with.
- Wikpedia here tries to explain that reserve numbers have to do with what is "economically feasible" at a given time. If you want to better grasp that concept and differentiate between "reserves" and the total amount of oil that is actually down under, play this mind game: Instead of boring (drilling) a few thin pipes down into the ground after you have found a promising geological formation, you dig out the entire area to form a canyon that is 10x the size of the Grand Canyon, siphoning off all the oil you find as you dig. Of course the economic costs for such a method will be astronomical. In truth it is not "economically feasible". The reserve numbers will be significantly lower than actual oil below.
- News reporters generally don't know "Jack" s**t about what the word "reserves" means.
- Many a cornucopian fruit cake confuse growth of the human-generated reserve number with belief in abiotic oil.
- Wikpedia here provides a list of major fields and estimated recoverables. Included in their list is Ghawar.
We now return you to the regularly scheduled program.Given that the operating requirements of NOCs and IOCs are somewhat different, is is helpful to clarify whether observations about reserves are specific to NOC or IOC, or common to both.
I understand that something like 90% of oil reserves are held by NOCs. While we may have more data about the operation of IOCs than NOCs, I think it is important not to draw conclusions that are specific to IOCs.
This is why I am wary of comparisons between the US or North Sea and the ME. We can't assume that NOCs in the ME operate exactly the same way as IOCs elsewhere.
I don't know if you'll be talking about it, but the worldwide decrease in field size limits the effect that EOR can have. More than half of the world's oil fields produce less than 20 kb/d; in such fields investment in EOR might not be even possible.
I've came across this claim several times, or with the claim that Saudi Oil in Place stays around 720 Gb (100 Gb produced + 260 Gb yet to produce + 360 Gb unrecoverable). Do you have any official reference to these claims?
On the decreasing size of oil fields: The World's Giant Oilfields by Matt Simmons.
On the decreasing number of fields where EOR is applicable: Peak oil and energy related peaks! by Jean Laherrère (pag. 24).
The recent Growth rate is unprecedented and is a reflection of another component of Reserve Growth ... those fields and resources made feasible by higher pricing.
The infamous ASPO graph showing Discoveries dwindling sine the mid 80's seems ominous. But when global discoveries are viewe in the context of total Resource Growth (incl Reserve Growth), they pale in comparison and the calculation errors of the past are put in perspective.
The main databased of discoveries have been backdated. While my graph shows presently available data (eg BP, Petroconsultants, OGJ, API & WorldOil, all these annual data filings from the 50's, 60's & 70's were later doubled or tripled by backdating the corrections. In other words, Reserve Growth as u define it Part One is actually magnificent if u could use those original numbers in our 100-yr database.
please click on the above link to view the Legend
But look at Resource Growth previous to that and compare to Discoveries on the ASPO graph for the same period:
1960's - 278-Gb Resource Growth
1970's - 254-Gb "
1980's - 325-Gb "
1990's - 431-Gb "
1288-Gb of Resource Growth in 40 years. Incredible numbers! In 1960, there was 660-Gb of Resoureces remaining. Add 1288 in Discoveries and Reserve Growth and the total is 1948-Gb. 832-Gb has been consumed in that 40 year period. That means we should have 1116-Gb left in Y2K. I don't recollect the total of Discoveries from 1960 to Y2k, but when one deducts that figure from 1288-Gb, that gives us the Reserve Growth of conv oil. Anyone?
Freddy, a nice chart. One of the features that catches my eye is how the AV URR less past gets close to the Past Consumption curve around 1998 - the year of $10 oil - but since then there has been a rapid divergence.
So this is a bit curious, back in 1998 when "the world was awash with oil" your chart shows conceptualy that future resources were running out. Today, when there is wide spread concern that the "the world is not awash with oil" and the price is close to all time highs your chart shows there is no problem with future supplies.
OK, so the argument is that reserves are linked to price but this is uncharted territory isn't it, because the oil price has never been driven high before because of market supply - demand forces - and as demand has been growing at a steady rate of 1.1mmbpdpy for 25 years, its really supply problems that lie at the heart of the current bull run.
Can you name us some countries that currently belong to the past peak crowd that will have fooled us and by growing production rapidly in the next 6 years, attain new peaks based on this price related inflation of their reserves?
In my study, this ratio has a historic low of 35 years in 1978, a recent low of 40 years in Y2K and has since increased to 62 years. While the metric has no bearing on supply rates in the future, it does bode well for a lengthy duration of supply at whatever flow rate.
According to EIA the US had in 1984 28.446 million proven reserves and produced that year 3,249,696,000 barrels i.e 11,4% of the total. In 2004, before the hurricans struck, the US had 21.371 million reserves and produced 1.983.302.000 barrels which works out as 9,3% of the total.
Inquiring minds want to know:
(1) How does Freddy have that information
(2) Why has not PEMEX said so publicly
(3) Is Freddy predicting this to be a 1Q affair or will it be longer (2Q, 3Q, 1Y, 2Yrs, 5Yrs, ... infinity years)
(4) If Freddy is predicting this information based on field by field analysis is he willing to share that information? Or state that he will not share it? - for xxx reasons!
Have you tried to validate their estimate? you said in conclusion: Based on the data in the IHS Energy database it seems that the worldwide recovery factor did not increase in the past five years.. If I understand you correctly, we should have observed a reserve growth of 750/(2025-1996)*5= 129 Gb and we observed nothing!
To their credit, they did discuss the limitations of their approach:
src: Estimating Potential Reserve Growth of Known (discovered) Fields: A Component of the USGS World Petroleum Assessment 2000
The TrendLines URR Estimates show that today they are at 3008-Gb. In 1996, URR was at 1870-Gb. That's a net of 1138-Gb in Resource Growth including both Discoveries and Reserve Growth. I don't know how much of the 1138-Gb is conv oil, non-conv & how much is reserve growth ... but there's lots for all of 'em.
BTW, the current EIA/DOE estimate of URR is 3990-Gb compared to the concensus fugure above of 3008-Gb.
More in Part 3, eh...
Given numbers from other regions it should be possible to calculate the plausible reserve growth in the ME.
Also for unconvential reserves such as tar sands NG supplies add a additional limiting factor. Infact the interaction between peak NG and oil is problematic esp in North America after 2010.
Fabulous article. I have been very curious about this issue for a long time. You have answered many questions I've had.
I look forward to parts 2 and 3
Thank you
Question - wouldn't reserve growth slow down in the future for the following reasons?
- obviously reserve growth will continue to happen, but at some point most of the fields have been re-worked with horizontal wells, water injection, etc so fewer fields would have expansion capability with the current technology
- diminishing incremental gains from future technology
- more accurate initial estimates in the current environment when putting a field on production
http://mobjectivist.blogspot.com/2006/12/conun-drum.html
Totally non-intuitive and sure to annoy the wing-hutters trolling the blog.
For the USA, Attanasi & Root published data for reserve growth starting as early as the discovery date:

http://www.peakoil.com/fortopic16568-45.html
20 years after the Prudhoe discovery, growth was going up perhaps 3% a year which puts it right in line with the rest of the USA data.
So reserve growth always looks biggest when the earliest estimate is given.
MK Hubbert stated that in 1971 the estimate was 10Gb. And he expected that to could grow to 30 to 50-Gb
WHT and ET ask questions about Prudhoe Bay reserve estimates. If one goes back to older reference sources such as American Petroleum Institute statistics, a 1977 reserve estimate, from when the pipeline opened, was in the 9 Gb range. This was proven reserves. Jeremy Gilbert, who was with BP when BP and ARCO inaugurated Prudhoe Bay development, said that internal reserve estimates were 12-15 Gb. See, in hardcopy...
Jeremy Gilbert. "New Technology and Opening Up ANWR - The Keys to Resolving the US Oil Supply-Demand Imbalance?" Presentation to the International Workshop on Oil Depletion, Uppsala, Sweden, May 23-24, 2002. Energy Exploration & Exploitation 21 (February 2003), pp. 71-78.
...or, online...
Roger Blanchard. "Will Technology Delay Peak Oil?" EV World, February 3, 2006.
http://www.evworld.com/view.cfm?section=article&storyid=968
So my interpretation is that 9 Gb versus 12-15 Gb, is a P1 versus P2 comparison. Obviously, a P1 estimate is going to grow. I see a herculean effort by petroleum engineers to get us to the 12-15 Gb range, but I don't see P2 reserve growth.
This reminds me that I bumped into Gilbert and his wife in the hotel after the ASPO-USA conference in Boston, and asked if I could get a copy of the paper above to get onto the Internet. They were taking a detour before going back home, so I agreed to e-mail him a couple of weeks later, and never did. So I will send that e-mail request now, and see if I can get it parked with Ron Swenson on hubbertpeak.com.
Rembrandt is doing a great job with this analysis.
EROEI X claimed reserves > some constant
Let's say EROEI was 30 in the early days but is now 10. We want a threefold increase in reserves to preserve 'wealth'. Those with the numbers should be able to confirm or deny this.
However a significant part of the eroei cost is indirectly consumed, so in terms of the actual oil reported pumped it would now be at the 111 barrels, but with a significantly larger $$ investment on behalf of the oil company.
Earlier this week, I posted an analysis of North Slope oil here:
http://mobjectivist.blogspot.com/2006/12/alaska-peak.html
smooth buildup:


shock caused by opening the taps on the pipeline:
This is a stochastic analysis, and so it aggregates the huge Prudhoe Bay field with the smaller ones at Kuparuk, etc.
Quite a masterpiece! I REDDIT already. I hope in future postings you discuss the effects of modern seismic sensing and other tech-tricks used to help demarcate early the truly recoverable oil [no matter the price/barrel].
I admit I am mostly ignorant on oilfield knowhow, but if these computer tech-tools combined with early drilling mudlogging and early production results in 90% confidence levels of true URR--then any following 'reserve growth' will be mostly inconsequential in regards to ramping extraction rates with desperation in-field EOR, and hopeful, but ultimately dryhole outfield drilling results.
Thus, if most of the existing and newly discovered oilfields have been 'truly outlined' by the application of these techniques--
what you see is what you get-- and the days of 'reserve growth' to increase 'production growth' may be soon over.Bob Shaw in Phx,Az Are Humans Smarter than Yeast?
Thank you for a clear exposition of fundamental issues in regard to reserve growth. There is, however, one point that puzzles me: Let us suppose, for the sake of discussion, that technological advances have nothing to do with reserve growth; in other words, we assume that technological advances increase rate of production but not total production from an oilfield. If this is the case, why?
Intuitively, it seems to me that over the past hundred years there must have been great efforts put into finding technological advances that would increase the percentage of oil ultimately recovered. If none of these efforts have been fruitful, why not?
Don,
Good to see you back in the oil patch again. How have you been? Did you finish your book?
There is a "technology" already in existence for getting at every drop of "ultimately recoverable" oil. It's called digging (strip mining) and rock crushing --and basically that is what they are doing with the Alberta tar sands.
All you have to do is dig a giant deep hole, get all the oil bearing rock and squeeze it (crush it) like an orange to get the lucious nectar out.
The word "reserves" is a term of art. It refers to getting out that oil which is economically extractable, not ultimately extractable.
Please see my post up top.
The very broad definition starts with Petroleum (or Oil) Initially in Place (PIIP or OIIP). This is narrowed to the old term of Ultimately Recoverable Resource (URR) that includes:
a) past consumtion
b) reserves (P1 & P2 & P3)
c) discovered contingent resource (req economic or technical feasibility within Outlook timeline)
d) undiscovered resource
Not all Estimates include all the classifications set out by the Society of Petroleum Engineers, but if they drop any ... at least we are working towards common definitions to measure the figures:

http://trendlines.ca/economic.htm#urrclasses
Thanks for the input. I'm always learning here.
Can you provide some more verbage for your above diagram? What is the outlook timeline? 10 years? 5? 3?
Is the following equation correct?
OIIP= Unrecoverable knowns (discovered but uneconomical)
+ Unrecoverable unknowns (undiscovered)
+ Definitely extracted oil (already produced oil)
+ Oil extractable to a 1P confidence level ("Proved")
+ Oil extractable to a 2P confidence level ("probable")
+ Oil extractable to a 3P confidence level (political)
+ Recoverable unknowns (undiscovered) ...
Just because there isn't evidence of tech increasing recovery rate now doesn't mean it hasn't in the past. Low hanging fruit yada yada.
You may recall Simmons harping on about how the tech pipeline looks empty these days in comparison to his earlier years.
This effect may have been exacerbated by the pillaging of the oil industry in the 80's and 90's.
Also, dont forget that there is a great incentive to extract oil faster from a financial sense - time value of money etc. If research opportunites to explore extracting oil faster look more promising than research opportunities to explore increasing recovery factor, then research funds may be displaced.
Lastly, remember that in the context of the last century, the time value of money is much higher than it was pre 70's (ie. higher inflation). This means research prior to this period would have been relatively directed toward increasing recovery, in comparison to research dollars spent after 1970, which must have allocated a relatively larger focus to a speedier recovery of available oil.
Very good point except that the last word in your explanation should not be "oil". It's all about $$$$$$. When doing an investment analysis, one looks at $RO$I, not at eROeI.
In the roaring mid 90's (1995 to 2001 dot.com bust) the highest $RO$I to be had was in Internet and software companies. Thus the Invisible Appendage (blessed be its name) saw to it that a large chunk of VC dollars went in to Internet ventures, into R&D for getting streaming You-Tube to us faster and in more vivid colors rather than to finding alternate sources of emission-free (or emission-reduced) energy.
The Lower 48 and the North Sea are examples of where the oil and gas industry has done its very best to maximize production from existing fields and to find new reserves.
Based on the HL method, the Lower 48 hit the 50% of Qt mark in 1970 and started declining in 1971. So far, the the oil and gas industry has been able to keep the net decline rate down to about 2% per year.
The North Sea hit the 50% of Qt mark in 1999, and started declining in 2000. So far, the oil and gas industry has been able to keep the net decline rate down to about 6% per year (assuming 4 mbpd average production for 2006, crude + condensate).
Just imagine what the decline rates would be if the fields in these two regions had not been managed by private companies doing their absolute best, with the best technology available, to maximize production.
We should all keep these two examples in mind when we hear bold, confident predictions of rising conventional production from regions that have crossed the 50% of Qt mark.
I for one am impressed at the oil and gas industry's ability to limit the North Sea decline rate to only three times higher than the Lower 48 decline rate, and I confidently predict that the oil and gas industry will be able work similar wonders with world production, now that it has crossed the 50% of Qt mark (crude + condensate).
Do you have information on this and is it a more common approach to intentionally low-ball the initial reserve estimate (at least in the USA) so that there appears to be large 'reserve growth' as time goes on?
If you want an objective estimate of URR for large producing regions, I suggest the HL method. Of course, it is now producing estimates of URR that people find extremely disconcerting, even on a Peak Oil website. The phrase cognitive dissonance comes to mind.
In any case, I am absolutely convinced that the Saudis are voluntarily cutting production, in exactly the same way that we have voluntarily cut production here in Texas. In an odd coincidence, the Saudis started voluntarily cutting production at the same stage of depletion, based on the HL method, that Texas started voluntarily cutting production. Odd, isn't it?
Until SA falls below 8.6-mbd w/o announcements of facilities maintenance, natural disaster or political influence, there is no indication of structural decline in that jurisdiction.
At last count, I had 10 articles published on the Energy Bulletin, and I have been a petroleum geologist for 25 years.
I have given numerous talks on Peak Oil, including a joint presentation with the head of research at Simmons & Company.
At Boone Pickens' request, I briefed his staff on the Hubbert Linearization (HL) technique, and I recently had the opportunity to discuss the HL technique with Richard Rainwater.
Both of these gentlemen--Pickens & Rainwater--who probably have a slightly higher net worth than either you or me, agree with me about Peak Oil (that we are at or past the world peak). And both of these gentlemen have been profitably acting on this premise, while doing what they can to warn those who will listen.
I'm still looking for some kind of publication by you at some website like the Energy Bulletin that has a review process.
In any case, since January of this year, I have been unequivocally starting that I thought that Saudi Arabia would start showing a production decline this year.
WT, Boasts of submitted articles to obscure websites and name dropping of dinosaurs won't change the fact that you have no comprehension of the nature of swing producers. This is thread is meant for reserve growth discussions, and i do not wish to let u take if off on a tangent but it seems your implication is that SA's dwindling reserves are signalled by its decline in production. That is so immature.
SAramco has published its sustainable monthly production for 32 months. It started at 8-mbd and is presently 8.6-mbd. SA has the ability during political intervention or natural disaster to ramp up to 11.2-mbd and has been one of the globe's swing producers for four decades. Your assertion that each reversion back to 8 or 8.6 is decline inpired is one of the most naive statements that we have ever heard on TOD. Swing producers go both ways. They swing up. And they swing back down. That's why it's called "swing".
back to regular programming ...
What's your rebuttal here westexas? This seems to me this is the nub of the debate about the Saudi Arabia peaking issue (and world peaking for that matter). Is KSA voluntarily 'swinging' their production or do they really have a problem? With quite a few significant world economies appearing to slow slighty (US, China, Canada) it may be a few years before the resurgence of oil demand can provide a 'tell'.
Chart 3 is wrong. Area under the rate time curve greater under infil or other scenarios. Therefore, greater total production.
Thanks.