| The architecture of UK offshore oil production in relation to future production models | The Oil Drum | DrumBeat: December 1, 2006 |
| The architecture of UK offshore oil production in relation to future production models | The Oil Drum: Europe | EuroNews: November 29, 2006 |
USGS WPA 2000 part 1 - A look at expected oil discoveries
Posted by Rembrandt on November 30, 2006 - 12:40pm in The Oil Drum: Europe
If you would read a random energy scenario study there is a very high chance that it is based on the United States Geological Survey's World Petroleum Estimate from the year 2000. This is because the estimate for the ultimate oil recovery of conventional oil + Natural Gas Liquids (NGL) of that study is being used as the basis for oil production projections in the:
International Energy Agency - World Energy Outlook
Energy Information Administration - International Energy OutlookSince allmost all energy policies in the world are based on scenario's from these two institutes, it is of the utmost importance that the USGS figure of 3345 billion barrels for ultimate recovery of conventional oil + NGL is correct. If not so, then the studies from the IEA and EIA give far too rosy projections on continuously rising oil producion. Instead, the world will encounter a shortfall in the supply of oil far earlier then now anticipated. Besides the studies cited above the figures of the USGS are also used by oil companies such as ExxonMobil and even the Saudi's to give the impression that there is plenty of conventional oil remaining.
The USGS World Petroleum Assessment 2000 came up with two estimates. One for the potential of oil to be discovered between 1996 and 2030, the other for the amount of reserve growth between 1996 and 2030. Reserve growth is the increase in reserves over time due to past underestimates of oil reserves in oil fields and new technology that increases the recovery factor in a given field.
In this first part I will deal with the first branch of the report, expected discoveries between 1996 and 2030.
First a look at the study itself, in 2001, Jean Laherrerre, geophysicist of ASPO France already wrote some critical remarks about the USGS report:
This study [USGS world assessment 2000] was a good project to define all the petroleum Systems of the world with the help of the major oil companies and to draw good maps, but the results were poor because the oil companies did not participate in the assessment, preferring to keep their knowledge and ideas confidential since they were competing with each other for the prime areas. It was left to a single USGS geologist to assess each individual basin (in the past it was done with Delphi inquiries involving many geologists). It was done without the benefit of seismic coverage and well data. Most of the estimates were made by academic geologists with little oil exploration practice. The database for reserves by field from 1995 & 1996 was out of date for a 2000 assessment and it was also inconsistent, with Proved reserves being used for the US and Canada (P) and Proved & Probable reserves (2p) being used for the rest of the world."
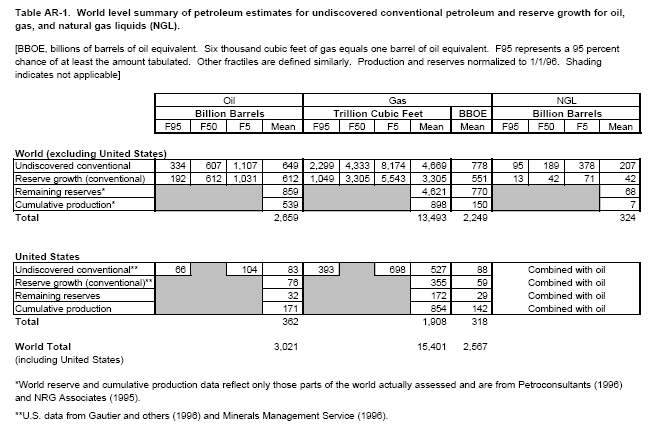
The results of the study are summarized in the main table below:
Click for full screen.
The table outlines three categories, Oil, Gas and Natural Gas Liquids (NGL). In this post I focus on the expectations for Oil + NGL only. These two liquid sources currently provide 98% of the world's liquids needed to fuel our cars, airplanes, plastics etc..
Below the categories are the probabilities of the expected recovery values, citing the figures for 95%, 50%, 5% and the mean value. The mean value is derived from taking the probabilities at 95%, 90%, 85%, 80% and so on until 10% and 5%, then dividing between the amount of probabilities taken (in total 20). The probabilities are derived from numerous statistical runs (monte carlo).
The categories cited are the undiscovered conventional (yet to be found) Reserve growth (expected increase of reserves due to new technology/insights), Remaining reserves and Cumulative production.
The ultimate recovery value for conventional oil + NGL is calculated by adding the 3021 billion barrel figure for oil + the 324 billion barrel figure for NGl. That adds up to 3345 billion barrels that will be recovered eventually according to the USGS. This 3345 billion barrel figure is the one that is being used by all the institutes such as the IEA for their scenario's.
It is very important to note that the figures start at 1 January 1996 as noted above the table! The end year of the estimate is 2030. As an example, the USGS expects the potential for discoveries between 1996 and 2030 to be 649 billion barrels for conventional oil (excluding the United States)
One may wonder why there has been no new assessment, since the study is already six years old. The authors in August of 2005 looked back at their study in a publication in AAPG bulletin ("An evaluation of the U.S. Geological Survey World Petroleum Assessment 2000", AAPG Bulletin, v. 89, no. 8 (August 2005), pp. 1033-1042). In this evaluation the authors (Albrandt et al.) claim that their study is still valid.
Discoveries in the past ten years
The USGS stated that between 1996 and 2030 a total of 939 billion barrels (649 + 207 + 83) could potentially be discovered. According to the ASPO International database and my own guesstimates between 1 January 1996 and 1 January 2006 around 110 billion barrels of oil were found. At the same time, 265 billion barrels of oil were produced. This is shown in the chart below.

Click for full screen.
Of the USGS potential of 939 billion barrels, around 12%-13% has been realised so far, while already 30% of the time period (1996 - 2030) has passed. This is confirmed by figures from IHS Energy, as shown in the chart below.
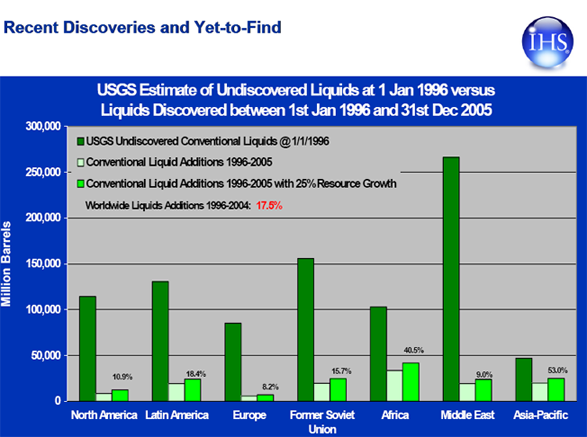
Chart from IHS Energy presentation by Ken Chew at the Energy Institute conference in London
IHS Energy states that 17.5% of the USGS potential for discovery has been realised by the beginning of 2006. In this figure they include a 25% increase in reserves from those discoveries (reserve growth). If we subtract the 25%, we get an amount of 14% that is realised from the USGS potential for discovery, or about 131 billion barrels.
The USGS authors (Albrandt et al) in their August 2005 publication in the AAPG journal do acknowledge the low amount of discoveries in the past ten years. However, according to them this falls in line with what could have been expected:
"Most of the undiscovered resources reported in the U.S. Geological Survey World Energy study are in environmentally, economically, or politically difficult locations.""Some of the oil resources estimated by the U.S. Geological Survey were expected to come from remote localities such as northeast Greenland, but the World Petroleum Assessment 2000 predicted that most of the undiscovered oil could be found in and around the existing major petroleum provinces of the Middle East, North Africa, and the countries of the former Soviet Union. Large parts of these important areas were not available to exploration during the first 8 yr of the forecast span. This is certainly the case in some of the countries of the Middle East and North Africa. Iraq, Iran, and Libya presented limited investment opportunities during the 8-yr period of this study, and investment in oil and gas exploration in Russia, Azerbaijan, and the central Asian republics has been limited also by various constraints on pipeline construction and perceived political and economic instability."
"In this context, it is surprising that as much as 11% [end 2003] of the estimated undiscovered oil resource was found"
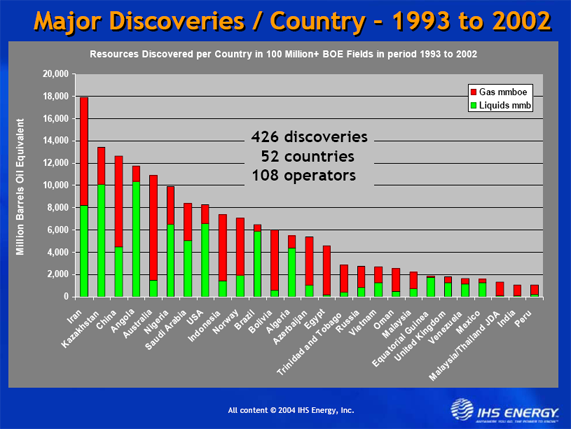
While it is actually the case in some countries such as Iraq that very little exploration has taken place, for others this is simply not true. A significant amount of exploration is taking place in Iran, with good results. The country had the largest amount of large discoveries between 1993 and 2002 for oil and gas, as shown in the chart below from IHS Energy:
The authors also quote the lack of access due to environmental regions such as northeast Greenland, where no drilling has taken place so far. Recently several oil companies have been given rights to start drilling in the remote region. The USGS expects a potential of 51 billon barrels to be discovered in Greenland.
What do the two regions with the largest potential for oil discoveries tell us?
Saudi Arabia
The USGS noted a potential of 136 billion barrels of conventional oil + NGL to be discovered between 1996 and 2030 in Saudi Arabia (9% of the total of 939 billion barrels). Between 1 January 1996 and 1 January 2006 approximately 5 billion barrels have been discovered in Saudi Arabia. Since the nationalisation in the '70s foreign companies could not drill in the country. Only since 2004 have several western oil companies have been allowed to drill for gas in the Rub Al Khali Region (empty quarter), which is positioned in the south and south/west. In the chart below we see that drilling so far has taken place mainly in the east:
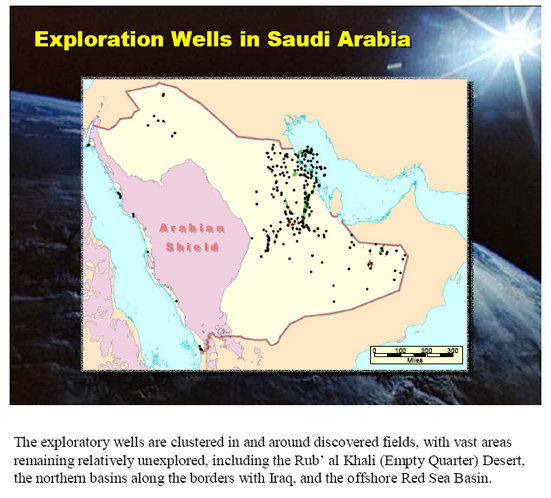
Chart from Saudi Aramaco presentation by Abdul Baqi and Saleri at a CSIS meeting in Washington in 2004.
The Saudi's describe three regions as being relatively unexplored as shown above. the Rub Al Khali, the border with Iraq and the Red Sea. The USGS gives the following expectations for these regions in Saudi Arabia:
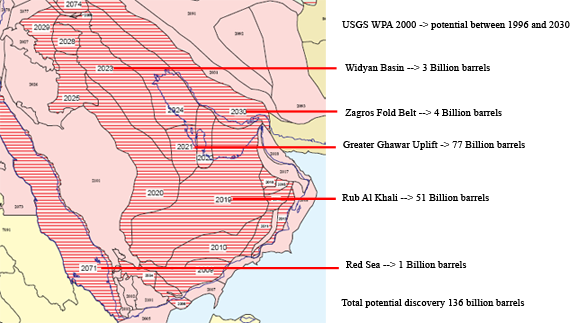
According to the USGS, there is very little potential in the Northern part and the Red Sea. Most of the potential lies in the already extensively explored region around Ghawar! The remainder is to be found in the Rub Al Khali.
Only 4% of the expected potential has been found so far in the first ten years of the period given by the USGS. Furthermore, the main potential for discoveries according to the USGS is in the already extensively explored part of the country. The authors of the study (albrandt et al) seem to contradict themselves in the case of Saudi Arabia, by stating that "Large parts of these important areas were not available to exploration during the first 8 yr of the forecast span". Those parts may not have been available, but that was not were the oil is expected to be.
In the chart below by geophysicist J. Laherrere drilling (new field wildcats) versus the amount of oil discovered is plotted. This clearly shows that new drilling does not deliver any giant discoveries in regions in Saudi Arabia were drilling has already taken place. No large field has been discovered since the end of the '70s in the country.

Russia
The USGS states a potential of 115 billion barrels for discovery in Russia between 1996 and 2030. The largest part, 75 billion barrels, is to be expected in the West Siberian Basin. This is the same Basin were the main stay of Russian production is currently coming from. However, the basin is very large. Most fields in the basin are concentrated in the centre.
Very little fields have been discovered in the past ten years in Russia. Discovery in Russia peaked in the '60's, rose to a lower 2nd discovery peak at the end of the 70's. After that discoveries declined until after the fall of the Soviet Union. Around 1995 some discoveries started to pour in again, but no real big fields have been found. The largest discovery in the past ten years has been found at the beginning of this year. The Vladimir Filanovsky discovery in the Russian part of the Caspian Sea containing 600 million barrels.
It is difficult to obtain reliable discovery for Russia. Discovery in the past ten years amounted to an approximate of 6 to 15 billion barrels, depending on the source.
Will discoveries lead to the 115 billion barrels eventually? Due to the lack of data on Russian exploration it is very hard to answer this question. However, the discoveries in the past ten years are not a good sign.
What does shell think about future discoveries?
Oil majors almost never disclose any of their data or vision on future production potential. In the back of the latest Shell Global Scenarios to 2025, however, Shell printed a graph that showed future discovery expectations:

Under the graph Shell wrote:
"While major new finds cannot be ruled out, recent statistics do provide worrisome signals... Discoveries only replaced some 45% of production since 1999. In addition, the number of discoveries is increasing but discoveries are getting smeller in size. The 25 biggest fields hold some 33% of discovered reserves and the top 100 fields 53%; al but two of the giant fields were discovered before 1970.""A simple extrapolation of the volumes discovered annually suggests that volumes to be found between now and 2050 could be as low as 500 billion barrels. However , this magnitude of undiscovered potential is considered conservative by some, who believe it is influenced too much by the declining exploration success of late and by cautious views about the commercial viability of future finds."
If we take the 500 billion barrels and subtract the period of 2030 to 2050 it gives an expected 350 billion barrels between 2005 and 2030. An amount that is far lower then the USGS expected figure of 939 billion barrels.
Concluding remarks
1) In the first ten years of the 34 year time period of the USGS WPA 2000 between 110 and 140 billion barrels have been discovered. An amount that is far lower then the expected 939 billion barrels between 1996 and 2030 from the USGS WPA 2000.
2) If the estimate from the USGS WPA 2000 is correct, approximately 800 billion barrels are awaiting discovery in the coming 25 years. Implying a tripling of current annual discovery for a period of 25 years.
3) There has been limited exploration access to several regions due to environmental, economical and political restrictions. However this does not necessarily imply that there is a large amount of oil in these regions.
4) Many of the environmental, economical and political restrictions have been lifted in the past few years. If the authors of the USGS study are correct (albrandt et al) this should result in a sharp increase in discoveries in the coming years.
5) The authors of the study (Albrandt et al) do appear to overestimate the discovery potential in Saudi Arabia.
6) It seems unwise to bet our future on a single study which has so far turned out te be too optimistic. Unfortunately,this is common practice throughout the world.
Personnel
Editors
Contributors
Peak Oil Primers
Archives
- November 2010 (3)
- October 2010 (6)
- September 2010 (4)
- August 2010 (7)
- July 2010 (6)
- June 2010 (7)
- May 2010 (2)
- April 2010 (8)
- March 2010 (4)
- February 2010 (6)
- January 2010 (3)
- December 2009 (5)
- November 2009 (8)
- October 2009 (12)
- September 2009 (6)
- August 2009 (5)
- July 2009 (11)
- June 2009 (8)
- May 2009 (16)
- April 2009 (10)
- March 2009 (7)
- February 2009 (10)
- January 2009 (15)
- December 2008 (9)
- November 2008 (9)
- October 2008 (9)
- September 2008 (13)
- August 2008 (10)
- July 2008 (14)
- June 2008 (23)
- May 2008 (16)
- April 2008 (12)
- March 2008 (16)
- February 2008 (9)
- January 2008 (13)
- December 2007 (13)
- November 2007 (16)
- October 2007 (22)
- September 2007 (8)
- August 2007 (9)
- July 2007 (16)
- June 2007 (8)
- May 2007 (7)
- April 2007 (7)
- March 2007 (10)
- February 2007 (10)
- January 2007 (12)
- December 2006 (9)
- November 2006 (15)
- October 2006 (4)
- September 2006 (5)
- August 2006 (5)
- July 2006 (9)
- June 2006 (5)
- May 2006 (10)
- April 2006 (9)
- March 2006 (13)
Vital Trivia
License

This work is licensed under a Creative Commons Attribution-Share Alike 3.0 United States License.
A most truly excellent and worrisome keypost!
I would love to see how Yergin and CERA would try to dispute your findings.Will this also get posted soon on the TOD/US website? If not, in 24 hours or less, I will encourage those TODers to come to TOD/EUR and study your writeup. I am sure Dave Cohen, and other TODers with oil production experience [I have none,BTW], would have much more info to add and buttress your analysis. Rest assured that I will go to REDDIT to help spread this text and graphs to the world at large! Thxs again!Bob Shaw in Phx,Az Are Humans Smarter than Yeast?
http://www.energyseer.com/NewPessimism.pdf
especially figure 2 and the associated discussion. He shows an example where constructing creaming curves at different times leads to different asymptotes and different predictions of ultimate recovery.
In fact, Lynch is criticizing the Parabolic Fractal Law that has been studied by Jean Lahèrrere and not the actual "Creaming curve" shown on Fig. 2. However, the PFL is quite a general phenomenon that has been applied with success in many different areas (Astronomy, Geology, biology, internet traffic, etc.) and is a simple variant of the Pareto distribution. I don't think he really understood Lahèrrere's approach.
I have had some training in statistical analysis, but I am unfamilar with the concept.
Thanks,
Alan
http://wolf.readinglitho.co.uk/mainpages/reserves.html#creaming
When I read about "geologists" making these wildly optimistic forecasts about oil and gas reserves, I wonder how many of them have ever actually worked with the oil industry.
Decades ago, oil exploration was a rather random process - companies would drill where oil had already been found, and would often find that if they drilled else where that they wouldn't find oil.
Eventually a detailed understanding of the requirements for oil and gas to occur was acquired as detailed in the cartoon below. Source rocks are one of the most important pre-requisites - if a basin / area has no source rock then there will be no oil or gas. The source rock then has to be buried to a depth where the temperature is in the range 90 to 150 C. Too shallow / cool - no oil or gas. Too deep - CO2. And so on.
However, even armed with this understanding, companies would still drill lots of dry holes - normally the result of one of these 5 factors failing. For example, seal failure, no reservoir etc.
The bottom line is that oil and gas is hard to find - even with todays array of technology.
The reason that the oil in Saudi Arabia is all clustered in one region is that this is the area where all 5 factors have combined to produce oil fields. It is the same in the North Sea, where fields are concentrated along the graben axes - where source rocks are buried deeply enough.
So those who look at a map of Saudi Arabia and observe that much of the area is unexplored need to be aware of the fact that geologists will have studied these areas and probably for multiple raesons decided that they are not prospective.
One of the more sobering aspects of your article is the fact that a 600 mmbbl oil field has made the news in Russia. It is analagous to the 100 mmbbl field discovery making headlines in the UK. The media have no sense of perspective - but unfortunately they have a lot of influence - and very short memories.
I've described oil fields as a multiplication process versus an addition process.
For example, A + B + C + D + E can be a number greater than zero (all positive numbers), even if one or more of the variables is a zero, provided we have at least one positive number.
However, A x B x C x D x E is zero, if any one of the variables is zero.
In other words, as you said, if any one of the requirements for a field is missing, we don't have a field. Also, as you know, not all oil fields are commercially productive.
Iran - I believe the large gas addition may be the South Pars extension of the already discovered North Field of Qatar
Kazakhstan - liquids there are I beleive Kashagan, which as we learned here, is technically very challenging, and has problems with oil export routes.
http://europe.theoildrum.com/story/2006/11/18/102426/08
Angola - one of the real success stories
USA - Crazyhorse + other deep water discoveries - to be developed using sub-marine platforms? (see The Abyss)
Norway - mainly Ormen Lange gas - maybe just enough to keep my central heating going till November 2011
Algeria - another genuine success story - but an interesting one. The Algerians re-opened the door to OECD companies who then discovered a new "play" in the Berkine basin.
A major lesson here, as I see creeping renationalisation everywhere - and so the future exploration success will probably be significantly lower than the past 10 years - the trend is already down and will steepen.
USGS estimates 800 billion barrels remain to be discovered betweeen now and 2030.
This is approxiamtely 32 billion barrels per year on average.
Global comnsumption is also (currently) approximately 32 billion barrels per year
Globally we have NOT managed to discover more oil than we have consumed for one single year in the past twenty years.
Why should we believe or expect new oil discoveries to break the trend of two decades?
(This does not even examine the fact that many reserve "discoveries" in the mid 1980's were bogus additions to reserves made by OPEC members for export quota purposes - as we have seen in the IHS/CERA documentation of Kuwait..... thus NOT to be relied upon)
Further, if we look at the four main providers of URR estimates, URR has grown since Y@K at 113-Gb/yr. And with new $50-plus pricing of oil, the 2006 revisions to URR are massive, with the fires estimate of over 5-Tb Ultimate in the past month.
Oil did not drop $20 bucks by accident. There is currently almost 2-mbd of over-supply in the system. That is why are seeing massive cut backs ... to preserve the PRICE. Some here will see the softer production figures in Q4 & 2007Q1 as delightful proof that there PEAK has finally come (again). But like the 8 downward corrections since 1975, this one too shall pass as the market adjusts.
Reserves will be part II later, and glad to see you freely admit that the USGS blew it on estimated discoveries. What do your studies indicate for potential discoveries going forward in barrels/day, geo-areas, and on-stream production times? How much do you differ from the USGS and CERA in
discoveries onlyplease?Bob Shaw in Phx,Az Are Humans Smarter than Yeast?
Yes of course. Geologists have been trying for decades to explain this strange phenomenon. It was noticed almost a century ago that after the first well penetrates a reservoir, the reservoir begins to grow. At first everyone thought it might have been "oil multiplying bacteria" causing the reserve to grow. It was thought that the drilling bit caused the bacterial contamination.
Then other theories were put forth. Some thought that relieving the pressure in the well caused oil to push up from below, filling the spaces left by the oil pumped out.
But then a few years ago someone threw a monkey wrench in the works. Shell pointed out that occasionally reservoirs shrink instead of growing. Their reserves shrank, in a single year, by 20 percent. And it is rumored that Kuwait's reserves have shrunk by 50 percent. And there is fear throughout the Middle East that reserves in that area are about to shrink by at least 50 percent, perhaps by as much as 65 percent.
But the reasons why reserves sometimes grow and sometimes shrink is still one of the greatest mysteries of geology.
Ron Patterson
What is going on with you? There's fear in Hollywood that revenues will shrink by 50% this year. I've had nightmares where I feared my penis shrinking by 50%. Luckily at 11 inches I don't have much to worry about.
Can we get back to some realistic issues with verifiable data and calm approach. Please.
Sincerely,
Henry Kissinger
Please take a European vacation, where you will be arrested as a war criminal.
TIA
Rat
I've always been the premier voice on this stance here. Not even oldhippie has proved very convincing.
My views here are based on Hitchens. And I'm sorry, but I disagree with Hitch on this one.
And I can. Cuz I'm the only one reads him.
Hello?
Probably much more than that, because over the last 20+ years, ME reserves didn't decline despite all those billions of barrels extracted.
I agree that there is some excess capacity, but where did you get the 2 mbd number? I have guessed at 1 or 2 mbpd, but that is based on extrapolations from areas that I know have excess capacity.
You don't wanna be Freddy's friend. You don't understand the relationships. You're still just a kid when it comes to TOD. Crossing the Freddy line is gonna cause you trouble. Freddy's great. And he's right.
But you don't need that involvement in your life right now.
Looking out for you,
Oil CEO
(Ughh! I've failed. This is worse than Kissinger Brezhnev. How could I have let this happen?)
Q1 0.4-mbd surplus
Q2 1.9-mbd surplus
Q3 1.8-mbd surplus
What I'll bet you is that "the optimists" get completely wrong footed by believing reserves growth will go on for ever - because of course when you start from a position of understatement - either by accident or by design, and grow your reserves annualy on the back of this, you do eventually reach a point where stated reserves equal actual - and any further increases become unwarranted.
I'm hoping to persuade some of our new contributors here to look at the reserves growth history of the 5 super majors - was wondering if you might already have done that?
I agree with you about current over supply, soft demand and peak lying in the future - but the more I look, the harder I find it to see growing production beyond 15 Nov 2011.
The USGS is overly optimistic for some areas but is completely outdated for some others. For example, in Egypt it only assesed Red Sea and Maqna basins. Considering the recent boom in discoveries both on and offshore Egypt, I believe that the USGS data are outdated for Egypt. Similar holds for Libya.
By the way, I think for the US undiscovered oil and reserves growth CERA used USGS 2000, which I commented at my blog
http://karbuz.blogspot.com/2006/11/ceras-tango-with-peak-oil.html
I believe we need to really understand the scientific process behind the USGS assessment, keep track of their forecasts and eventually provide an alternate estimate.
The probability distribution resulting from the Monte-Carlo is asymmetric (F50 is closer to F95 than F05) therefore the median should be used and not the mean!Assuming a uniform distribution of new discoveries, we should get 939/34= 27.6 Gb/year of new discovery until 2030. So far we observed, 110/10= 11.0 Gb/ year! assuming a constant rate of new discovery we should get at least 34x11.0= 34 Gb of new discovery between 1996 and 2030. Note that if you take their F95 estimate for new discoveries (334+95= 429 Gb), you get a discovery rate of 12.6 Gb/year which is closed to what have been observed so far. Have you tried also to assess actual reserve growth for the 1996-2006 period versus the USGS prediction?
Looking at the F95 numbers for Oil: Reserves stood at about 890 Gb, take from that the consumption of the last 10 years (circa 200 Gb) and you get 690 Gb. Now add to it the undiscovered F95 numbers (circa 400) and you get 1090 Gb.
1090 Gb falls in the line with present day projections for 2P remainig reserves + undiscovered of people like Deffeyes, Laherrère or Campbell.
I'm genuinely curious.
Recently, for example, I lost ALL of their final papers! I was driving home during a northeaster here in Maine with the papers on the passenger seat of my VW, and when I cracked open my sunroof (I had just passed a little gas), the sudden change in pressure SUCKED all the papers out of the car! What to do??
Consult the USGS, of course.
Here's what I did:
I based students' final paper grades (and thus their final grades for the semester) not on their actual work, but on statistical probabilities. It works like this:
Student X's semester performance:
first paper F
second paper D
third paper D+
fourth paper F
Final: LOST
My sophisticated Monte-Carlo simulator (basically a plastic 8-ball filled with liquid and a small window at one end) determined the following probabilities for student X's final paper grade:
P95 F
P50 C
P5 A
Mean C+
With a C+ for the exam, Student X was very happy, as it allowed him to pass the course with a D.
I have to confess: this method does not make all students happy. Student Y is a case in point.
Student Y's performance is a follows:
first paper A-
second paper B
third paper A-
fourth paper B+
Final LOST
Monte-Carlo simulator for statistic final paper product:
P95 A-
P50 C+
P5 F
Mean C
The resulting statistical C for the final paper meant that Student Y received a B for the course. Needless to say, she was not happy.
However, it is to be observer that the sophisticated Monte-Carlo simulator is not designed for students' happiness so much as for instructors' convenience.
"It is to be observed that...."
Now i don't know how much this affects reserves really, but i would really like to see it discussed more in peak-oil -aware communities. I do think it is quite a good point from an economist point of view, and that it should be considered, not only from the reserve growth point of view, but also regarding development of new technology and alternative sources of fuel.
So explain to us, why has he been so horrifically wrong. Both his books open with the worst possible analysis of then current numbers. They are so bad, it's hard to see why anybody would buy his next book. The second was a copy of the first.
On second reading of both, I really feel sorry for him. I think he may actually still believe what he is saying.
Deffeyes in the course of two books proved Hubbert wrong. I'd like to see how Khebab and WT react to that statement.
So you are an anti-economist, now?
"Money means nothing to me, I'm extremely rich"
-Hunter S. Thompson
Imagine a car driving toward a child sitting in the road 5 ft away. We can agree there is a 95% chance the car will hit the child and a 5% chance the car will swerve at the last second. Would you take the mean of those numbers and assume there is a 50% chance of avoiding an accident?
Why did they block out the 95% confident reserve numbers? That is where we are most confident.
There is a 99.9999% chance I will win nothing.
There is a 0.0001% chance that I will $10,000,000
Add and divide by 2. I expect to win $5,000,000
Hmmmm, we don't like the most probable result predicted by our analysis so lets average some numbers together to get a number we do like.
Furthermore, the presumption here, as I also had pointed out is that the IOCs are presumed to be competent in petroleum geology but the NOCs are not. The argument finally relies on faith in an "unfettered profit-motive" represented by XOM or Chevron but not by Saudi Aramco or, presumably, Rosneft as well.
I have highlighed the Greenland part of the text because a recent study by Woods Mackenzie (pointed out recently by HO) is pessimistic about the Arctic (includes Russian, Norway, Alaska, Canada, Greenland).
I wonder how much of the USGS "undiscovered resources" are supposed to come from the northern polar regions.The discoveries trend is clear now and has been for many years. I shall remember to use this post as a counterargument whenever somebody makes the "yet-to-find" argument concerning oil that does not exist -- oil I am now calling the IOR -- Imaginary Recoverable Oil.
Not sure that the Norwegian Barents should be the indicator for total Arctic exploration prospectivity. It is just one (relatively) small part of the total and not the most prospective part.
The Russian Barents has proven prospectivity on world scale Shtokman and further east into the Kara Sea (off Yamal). Overall, there has been insufficient exploration to call time on this area, and certainly not on the basis of an area which has always been recognised as limited.
Woodmackenzie does not have much G&G capability in its analysis and I would be a little sceptical of their conclusions. I do agree though that nothing is going to happen quickly and that the Arctic may never contribute huge capacity relative to potential volumes in the gound due to the cost of development and infrastucture.
On a brighter note, ENI is appraising the Golliat structure in the Nor Barents - likely to lead to a 300mbbl development (though not yet).
Have a good day :-)
No, I don't mean that Barents should be an indicator for the total, and there are finds there, especially for gas, and much drilling has to be done.
If you go back through the expolration history to date, however, there is no question that the disappointments have greatly exceeded the successes, and this was not anticipated. My understanding from reports last year (that I would really have to research to find again), was that the lack of oil finds in particular was leading to a reevaluation of the potential of the area as a whole, and to reexamining the assumptions and understanding of the area.
I was mainly pointing out that even with our best understanding, there are still surprises out there, not all good.
One must understand that the present rate of discoveries of last of the cheap oil era is maintaining ample proven reserves for the industry. To build a 50-yr, 60-yr or 70-yr reserve in this present environment of alternative source development is plainly silly and not prudent as far as the shareholders are concerned. Nobody had a 50-yr supply of wood. Nobody had a 50-yr supply of coal ready.
If there is a problem, it is related to steady annual production and refining ... not proven reserves. That will be addresed by increasing global SPR's and spare capacity ... and both are being presently addressed (for 2011 fruition).
Interesting points. If all Americans were Peakoil aware--IMO, we would gladly finance starting a fifty year SPR supply full of light, sweet crude. Very Cheap Insurance vs waging war for it later [or is the US fighting in Iraq for it now?]. If techno-alternatives start coming to fruition, it could always be sold off to those countries that cannot yet afford the techno-alternatives.
Bob Shaw in Phx,Az Are Humans Smarter than Yeast?
For clarity, i do not track field discoveries or reserve growth. By following the data that is background to the models in our Depletion Scenarios, i am only interested in global totals. I do however watch with interest the Russian & Saudi Arabia components wrt production targets at the timelines to monitor that they are within reason as well as in line with 12.5-mbd targets published by Aramco.
In that respect, i am also not troubled by minor errors or exaggerations. We have seen that the modelers are often caught underestimating and much as over and thus on balance, their targets are being found to be fairly accurate as the years go on. It is especially pleasing tho to see that scrutiny (incl that at TOD) seems to be monitored and subsequent releases often show corrections. It's all about sharing data and being sensitive to constructive criticism.
and
For clarity, i do not track field discoveries or reserve growth. By following the data that is background to the models in our Depletion Scenarios, i am only interested in global totals [sic]
Perhaps you could enlighten us as to what, if anything, disturbs your sleep? What is the data? Since you do not track discoveries or reserves growth (ie. the reserves data), what exactly is it that you do track? Just other people's happy production estimates? Is that it? End of story?
As you can see, Rembrandt and others like IHS Energy, etc. put a lot of effort into tracking this kind of data. Clearly, you see no need to do anything like that. Your numbers needn't be disturbed by anything like the data, is that right?
I'm tryin' ta be nice this week,
The Oil Fairy
It is the showing of many models in one format that they like. The good, the bad and the ugly. Well not the ugly actually, Bakhtiari was left off again! His website server stats show that he gets visitors from 12 countries. TOD gets 22 different nationalities right now. But for over a year, TrendLines has been sharing our graph blog with folks from 83 to 90 countries each month.
Dave, despite your pleas, the world and/or TOD does not need another bottom up study. A 13th or 14th model will prove nothing at this point. So i wll not likely do that study. My strength is working with the producers of the best Outlooks and exhibiting them in a way that allows those interested to talk intelligently about long term prospects of All Liquids oil. I look for glaring errors and we comment on the changes. Most importantly, we reconcile the production targets with their stated URR estimate (or the avg of estimates). And last month we started adding footnotes to comment on discrepancies.
A guy would have to be nuts to start bottom-up studies for TOD. You had Campbell. Then disowned him when he jacked up his forecast to 2010. Laherrere. Same. 2017. Along came Rembrandt. Dropped when y'all saw his final document. 2012. Then the Peaksters put their money on Skrebowski. Nope, persona non grata, when he upped his production target and pushed the date out to 2011. Nobody can please the Peaksters at TOD. Instead, we see a cheerleading club for the anecdotal specialists that espouse throughout the threads like manure spreaders. Cuz that's what many here want to hear! Very sad. Almost pathetic. Thank gawd for the few shining lights that come once and awhile and put the integrity of their data and character ahead of looking for love...
We all get too much spin in the media and on the WWWeb. The view on many topics is unfortunately swayed by the concensus. Unfortunately, the truth and facts are not changed by a majority vote and reminders are required once in a while that discussions are far from reality.
Do you account for tar sands in this and other slower to produce, lower eroei resources?
What about the apparently overblown reserve estimates of Kuwait, Saudi Arabia and probaby Qatar?
Thanks
Then we look at their URR estimate and compare it with the total volume of their proposed production until exhaustion and add on past consumption. If it does not reconcile, we extend or shorten the plateau 'til it matches. If no URR is given, we used to use the Avg, but in yesterday's version all 12 had submitted a URR estimate. The OPEC URR (2.187-Tb) was the lowest and did not copute with their production target at all. We used an aribitrary of 2.95-Tb to justify it. The Avg btw has risen to 3.607-Tb this month.
Thus we do not account for either their high/low peak rates or high/low URR. The Scenarios is merely a best effort representation of their published targets and timelines in a recognizable and comparative format.
click on the respective tiny square icons just below the title near the very tip-top of this thread.
Now, if someone could get Stuart to come back and post....hmmm.
While it may not be the nail in the coffin, it certainly does pound it in a bit.
Great work. I have a similar but less detailed presentation that I have been giving to a few business folks here in Oz and also at the Australian Institute of Energy Conference this week.
You note that IHS included 25% reserve growth to scale up the discovered reserves to get to 17%, but the USGS assessment lists reserve growth separately to discovery.
ie 939 GB of Discovery and 730 GB of Reserve Growth.
If IHS want to add 25% to the discovery numbers, then they need to compare the resulting figure to the total of 959 and 730, which will bring them back below 14%.
There's not much new in my presentation for you, but if others want to have a look it's briefly available at:
http://philhart.com/public/presentation/PeakOil_A_change_in_direction.pdf
cheers
Phil
ASPO Australia
so IHS can multiply their discovery by a reserve growth factor if they like.
no doubt the problems with the 44% reserve growth, especially multiplying it by past production is part of your next post!
cheers
Phil.
- What has been the actual reserve growth for 1996 to 2006?
- How does that compare to what they projected?
It is interesting to see how many people are risking so much to what amounts to a coin toss.Wow! So, does so if this trend continues, they are going to be 600 billion barrels short, dropping their URR to 2.7 trillion barrels. So, one of you HL guys calculate how many years this would shift the peak if you dropped the URR from 3.3 trillion to 2.7 trillion.
Cumulative Prod. at Peak: 2700/2= 1350 Gb
Cum. Prod in 2006: 1086 Gb
1350 - 1086= 264 Gb
Assuming 30Gb/year: 264/30= 8.8 years
So production mid-point reached in 2012-2015
hmmm... sound familiar.