| Wind's latest problem: it . . . makes power too cheap | The Oil Drum: Europe | Deepwater Oil Spill - Pressure Tutorial - and Open Thread |
Oilwatch Monthly May 2010
Posted by Rembrandt on May 18, 2010 - 10:35am in The Oil Drum: Europe
The May 2010 edition of Oilwatch Monthly can be downloaded at this weblink (PDF, 1.24 MB, 33 pp).
The Oilwatch Monthly is a newsletter that is available free of charge with the latest data on oil supply, demand, oil stocks, spare capacity and exports.
Below the fold is an executive summary, subscription form to receive the Oilwatch Monthly by e-mail, and latest graphics. For much more detail and a country by country profile, download the .pdf.
Subscribe to receive Oilwatch Monthly by e-mail
Latest Developments:
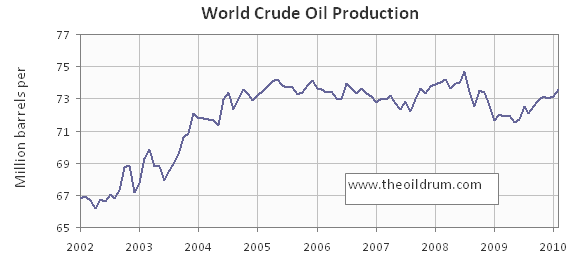
1) Conventional crude production - Latest figures from the Energy Information Administration (EIA) show that crude oil production including lease condensates increased by 442,000 b/d from January to February 2010, resulting in total production of crude oil including lease condensates of 73.59 million b/d.
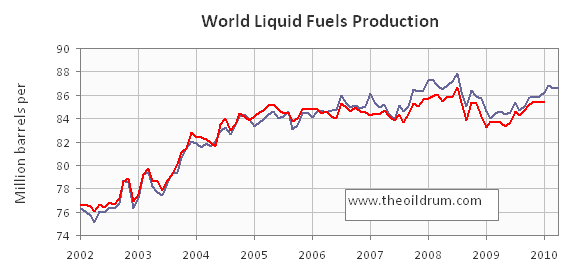
2) Total liquid fuels production - In April 2010 world production of all liquid fuels remained stable from March according to the latest figures of the International Energy Agency (IEA), resulting in total world liquid fuels production of 86.62 million b/d. Liquids production for March 2010 was revised downwards in the IEA Oil Market Report of May from 86.8 to 86.6 million b/d. Average global liquid fuels production in 2009 was 84.94 versus 86.6 and 85.32 million b/d in 2008 and 2007.
3) World oil production capacity - Total oil production capacity in April 2010 decreased by 85,000 b/d from March 2010, from 90.17 to 90.09 million b/d. World production capacity is measured here as the sum of world liquids production excluding biofuels plus total OPEC spare capacity excluding Iraq, Venezuela and Nigeria.
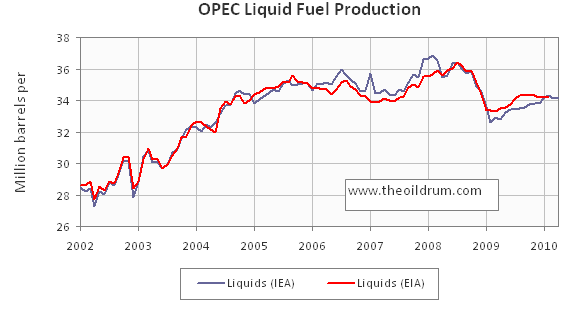
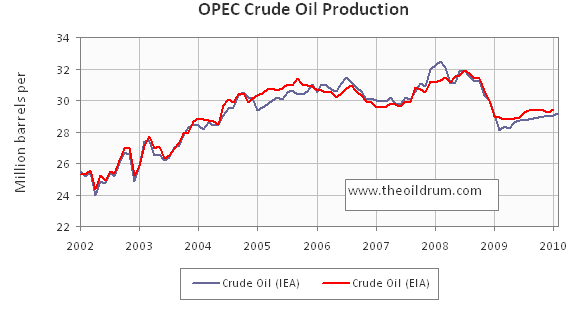
4) OPEC Production - Total liquid fuels production in OPEC countries increased by 40,000 b/d from March to April 2010 to a level of 34.15 million b/d. Liquids production for March 2010 was revised downwards in the IEA Oil Market Report of May from 34.13 to 34.11 million b/d. Average liquid fuels production in 2009 was 33.7 million b/d, versus 36.09 and 35.02 million b/d in respectively 2008 and 2007. All time high production of OPEC liquid fuels stands at 36.4 million b/d reached in July 2008.
Total crude oil production excluding lease condensates of the OPEC cartel increased by 40,000 b/d to a level of 29.02 million b/d, from March to April 2010, according to the latest available estimate of the IEA. Average crude oil production in 2009 was 28.7 million b/d, versus 31.43 and 30.37 million b/d in 2008 and 2007 respectively.
OPEC natural gas liquids remained stable from March to April 2010 at a level of 5.13 million b/d. Average OPEC natural gas liquids production in 2009 was 4.67 million b/d, versus 4.47 and 4.55 million b/d in 2008 and 2007 respectively.
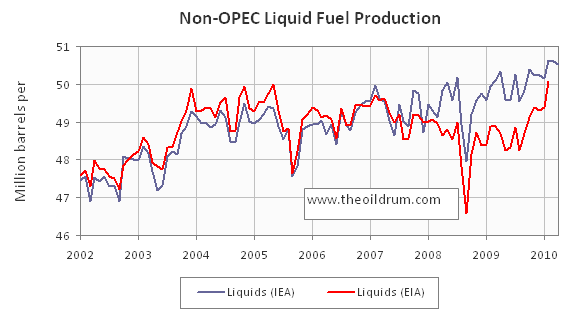
5) Non-OPEC Production - Total liquid fuels production excluding biofuels in Non-OPEC countries decreased by 55,000 b/d from March to April 2010, resulting in a production level of 50.53 million b/d according to the International Energy Agency. Liquids production for April 2010 was revised upwards in the IEA Oil Market Report of May from 50.55 to 50.59 million b/d. Average liquid fuels production in 2009 was 49.67 million b/d, versus 49.32 and 49.34 million b/d in 2008 and 2007 respectively.
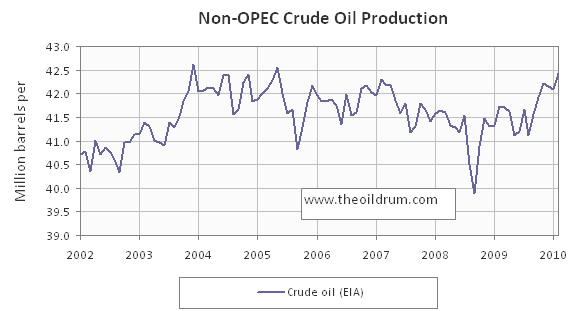
Total Non-OPEC crude oil production including lease condensates increased by 348,000 b/d to a level of 42.43 million b/d, from January to February 2010, according to the latest available estimate of the EIA. Crude oil production for January 2010 was revised downwards in the EIA International Petroleum Monthly of May from 42.27 to 42.08 million b/d. Average crude oil production in 2009 was 41.62 million b/d, versus 41.32 and 41.80 million b/d in 2008 and 2007 respectively.
Non-OPEC natural gas liquids production increased by 32,000 b/d from January to February 2010 to a level of 3.46 million b/d. Average Non-OPEC natural gas liquids production in 2009 was 3.34 million b/d, versus 3.65 and 3.79 million b/d in 2008 and 2007 respectively.
6) OPEC spare capacity - According to the International Energy Agency total effective spare capacity (excluding Iraq, Venezuela and Nigeria) decreased from March to April 2010 by 40,000 b/d to a level of 6.11 million b/d. Of total effective spare capacity an additional 3.75 million b/d is estimated to be producible by Saudi Arabia within 90 days, the United Arab Emirates 0.41 million b/d, Angola 0.2 million b/d, Iran 0.25 million b/d, Libya 0.16 million b/d, Qatar 0.08 million b/d, and the other remaining countries 0.55 million b/d.
Total OPEC spare production capacity in April 2010 increased by 230,000 b/d to a level of 5.3 million b/d from 5.07 million b/d in March according to the Energy Information Administration. Of total effective spare capacity an additional 4.05 million b/d is estimated to be producible by Saudi Arabia, the United Arab Emirates 0.30 million b/d, Angola 0.15 million b/d, Iran 0.10 million b/d, Libya 0.15 million b/d, Qatar 0.25 million b/d, and the other remaining countries 0.15 million b/d.
7) OECD Oil Consumption - No update from last month
8) Chinese liquids demand - No update from last month
9) OECD oil stocks - Industrial inventories of crude oil in the OECD in March 2010 increased to 1022 million from 990 million barrels in February according to the latest IEA statistics. Current OECD crude oil stocks are 55 million barrels higher than the five year average of 967 million barrels. In the April Oil Market Report of the IEA a total stock level of 972 million barrels was tabulated for February which has been revised upward to 990 million barrels in the May edition.
Industrial product stocks in the OECD in March 2010 decreased to 1412 million from 1440 million barrels in February according to the latest IEA Statistics. Current OECD product stocks are 5 million barrels higher than the five year average of 1407 million barrels. In the April Oil Market Report of the IEA a total stock level of 1441 million barrels was tabulated for February which has been revised downward to 1440 million barrels in the May edition.
Personnel
Editors
Contributors
Peak Oil Primers
Archives
- November 2010 (3)
- October 2010 (6)
- September 2010 (4)
- August 2010 (7)
- July 2010 (6)
- June 2010 (7)
- May 2010 (2)
- April 2010 (8)
- March 2010 (4)
- February 2010 (6)
- January 2010 (3)
- December 2009 (5)
- November 2009 (8)
- October 2009 (12)
- September 2009 (6)
- August 2009 (5)
- July 2009 (11)
- June 2009 (8)
- May 2009 (16)
- April 2009 (10)
- March 2009 (7)
- February 2009 (10)
- January 2009 (15)
- December 2008 (9)
- November 2008 (9)
- October 2008 (9)
- September 2008 (13)
- August 2008 (10)
- July 2008 (14)
- June 2008 (23)
- May 2008 (16)
- April 2008 (12)
- March 2008 (16)
- February 2008 (9)
- January 2008 (13)
- December 2007 (13)
- November 2007 (16)
- October 2007 (22)
- September 2007 (8)
- August 2007 (9)
- July 2007 (16)
- June 2007 (8)
- May 2007 (7)
- April 2007 (7)
- March 2007 (10)
- February 2007 (10)
- January 2007 (12)
- December 2006 (9)
- November 2006 (15)
- October 2006 (4)
- September 2006 (5)
- August 2006 (5)
- July 2006 (9)
- June 2006 (5)
- May 2006 (10)
- April 2006 (9)
- March 2006 (13)
Vital Trivia
License

This work is licensed under a Creative Commons Attribution-Share Alike 3.0 United States License.
My monthly crude oil graph:
17/5/2010
World hangs on offshore drip
http://www.crudeoilpeak.com/?p=1464
Thanks for the chart, matt. It answers the question that immediately popped into my head from the charts in the main post--where is that new non-OPEC production coming from?
Eyeballing it, it looks like the answer is US, Canada, Iraq, Nigeria and Russia are some of the biggest contributors. I'm still surprised that they are able to overcome the rapid fall in production from other places like Mexico.
How long can this trend continue? Is there going to be a new peak in the coming months? As of a year ago I, and (I got the impression) many others here, thought we were on the otherside of the slope. But now it looks as if we are still on the plateau, at least.
Was there a particular event that coincided with the 5/09 minimum that your dashed vertical line represents?
Stuart Staniford, on his blog Early Warning, has been 'speculating'(not predicting) that production may make a new high this year, overtaking the '08 high.
Definitely looks like there will be a new peak for crude. My guess is that plateau will hold out till 2013-2014 at least.
Rembrant, would you kindly also post a graph of "Net Exports" of oil on the international market. I think that by now, that graph in particular is more relevant and important that total world production, seeing as the oil exporting countries will be increasing their own consumption. Also, will there be an update to the the Wikipedia Oil Megaprojects any time soon? Are there going to be further additions to production from 2011 onwards?
I think it will be rather ironic in the coming years that the higher the price of crude, the more awash with cash the oil exporting countries will be, and hence the more they will consume their own oil, with the overall net effect that for all other countries, the more they are willing to pay for oil, they less they will get :)
@Shox
I discontinued the net exports graph as I found it to be too inaccurate (the proxy methodology of subtracting consumption from production and counting the remainder as exports was not good enough as oil flows are more complicated). I have incorporated a few actual export figures in the Oil Watch but this is only a small part of the total market. So for now until I have better data I won't be able to produce such a graph in the accuracy that I would like to have.
As to the megaprojects, I have not been involved in that so don't know. You would have to ask ACE that question.
Rembrandt
Rembrandt,
Thanks for your continued work on this.
As I look at the top graph, it seems to me that there is a high correlation between world oil production/consumption and the health of the world economy. When production started dropping, and reached its low point in the early part of 2009, the economy was truly doing poorly. Prices were at their low point.
More recently, the graphs show oil production increasing by something like 1.5 million barrels a day, and prices are have been up. We have heard a lot about "green shoots" and a possible recovery.
Going forward, we are reaching the point where the piper needs to be paid for all of the stimulus. The net energy coming through the system is not high enough that governments around the world get an adequate share with historical tax rates--instead, tax rates need to be raised or services cut back (and employment reduced). All of this is likely to result in reduced demand for oil and lower oil prices (like we are seeing now).
Also, some tax rates were set too low (for example, for retirement plans such as Social Security) because of growth built into the system. As the growth rate is reduced, these tax rates will also need to be raised or the benefits lowered, further reducing demand for oil, because most citizens (either the ones paying in or the ones receiving benefits) will be poorer. This further will tend to have a dampening impact on oil use and prices.
I fully expect that my contributions into social security are just a net reduction in pay for me (much like my contributions to medicare). Fine, salary deflation was bound to happen. Maybe one day we can admit that the game of musical chairs is over and we'll stop pretending that anyone under 40 has a chance at getting a seat. Phase out the benefits starting today and I'll figure out my retirement some other way.
GregTx
Social Security should be considered warefare and only those in extreme need should receive it. That way it would last longer. Don't depend on anything from the government is the best policy. I expect even those who are receiving Social Security today will have to give it up and just die off. The U.S. is going broke along with most other western nations. GregTX you won't get anything, just hope you can survive what's coming.
hotrod
GregTX,
(warefare) welfare.
hotrod
When I retire, I intend to minimise my exposure to oil.
Is this a majority view in the general population?
If so, the boomers will kill demand for oil.
Certainly there is the potential for the aging baby boomer population to aggressively curtail its oil usage.
Effectively not drive much after retirement. However I have to imagine that for most if they make such a sacrifice it will generally be because of price. And of course if the price of oil rises its increases the cost of everything and you probably will see just as many boomers forced back into the work force if not more. Net result is open but if we assume a continued decline in property prices I have to imagine that boomers trying to stay in the work force longer will be the larger force.
Regardless it does not look like a simple problem at first glance simply aging is not enough.
And of course if costs rise more families will be forced to go to the extended family model i.e parents move in with children etc. This increased density will put even more pressure on housing asset values forcing more boomers to try and work and forcing more people to reduce housing costs to offset other rising expenses.
It seems to me if you work it through a number of vicious cycles develop where more and more people are forced to both work and cut expenses and of course spending generally gutting equity positions.
That cannot end well.
"vicious cycles"
Yup, that about says it--vicious cycles 'R' us.
Thanks Rembrandt,
Gail, just a quibble with your description of SS, it was never intended as a retirement plan. I know most people think of it as such, and like anything that is repeated enough, it becomes accepted as such, but SS is not nor has it every been intended as a retirement plan.
I do agree with you regarding the effective tax rates will be higher in the future as well as 'services' provided by all forms of gov't - from local schools and libaries, to county roads and assistance programs, to state and regional all the way to the feds - from (hopefully) farm subsidies to you name it.
P.S. Thanks to the staff and all of the posters for some remarkable posts and more remarkable discussions on the disaster in the Gulf. Thank you all!
really ? how 'bout taxing all earnings ?
the main threat to social security i see is the "trust fund" is long past spent, searching for wmd's.
imo, social security is not a retirement plan, just another tax to leverage finance another run of the mill energy grab.
According to Chart 23, US oil consumption has dropped roughly 2M bpd from 2007 to 2010.
According to Chart 116, US oil production has risen roughly .5M bpd from 2007 to 2010, and liquids production has increased by about 1M bpd.
So, US oil imports should have dropped by about 2.5-3M bpd from 2007 to 2010.
But, Chart 54 suggests that imports have only dropped by about 1M bpd from 2007 to 2010!?!
Chart 54 looks like it's badly inaccurate, right?
We discussed this previously here: http://www.theoildrum.com/node/6304/603537 :
"My source is here: U.S. Imports of Crude Oil and Petroleum Products ( http://tonto.eia.doe.gov/dnav/pet/pet_move_imp_dc_nus-z00_mbblpd_m.htm ). This is EIA, the IEA number seems to be the EIA's "U.S. Imports of Crude Oil and Petroleum Products (Thousand Barrels per Day)" minus imports of Finished Products, but not minus "Other Liquids"; these latter two comprise the "Petroleum Products."
EIA absolute peak for crude oil + products imports was Aug '06 at 14697
kb/d; subtract 2028 kb/d of finished products imports from the same month and you get 12669
kb/d, close to what's on Rembrandt's chart. This may just be a methodology quirk of the IEA, like the way BP doesn't include biofuels or CTL in their production numbers for the Stat Review, but they do include NGLs, giving numbers that are neither C+C nor liquids as usually defined."
So, it appeared that chart 54 didn't include "Finished Products". That seems like a big error.
- US oil production rose by 923,000 b/d from 2007 to 2010 (average January through April) from 7.47 to 8.39 million b/d.
- US oil consumption dropped roughly 1.8 million b/d (dont have exact statistics here as I am travelling)
So difference should indeed be around 2.8 million b/d which would reflect in import statistics.
- Chart 54 on import only goes to 3rd qrt 2009, I will update this next month with 4th qrt 2009 data.
- A part of the difference is due to stock buildup (50 million barrels added in North America in 2008/2009)
Chart 54 very likely doesnt include finished products as this is JODI data.
Rembrandt
The 50M barrel stock buildup - if it was over a year, then that's about 137K per day. That's significant, I suppose, but it's only about 5% of the 2.8M b/d.
The omission of finished products seems to cause an error of about 1.3M b/d in chart 54 - that's quite a lot. How can we correct this? Perhaps we should use EIA's import data?
Chart 113 really needs an update - it should show a large up-tick in liquids production, bringing it close to 8.5M bpd.
That would make the chart look very different.
@Nick,
Chart 113 will be updated when new BP Statistical Review figures come in in July. These figures are however slightly different from EIA figures (somewhat lower).
Why are EIA and BP figures different? Should we see about an increase of 1m b/d in either case?
I know no one gets marks for having a memory, but I would like to recall two charts:
- one from Khebab when he took the IEA survey data and plotted it. It showed a sharp drop off in 2010
- one from ACE with megaprojects data: 08 and 09 had large, above average increases in supply and 2010 showed a sharp drop in new supply. In fact the sharpest yoy drop in his data set (starting in 2002)
now, I do believe the IEA data represented by Khebab, and also the megaprojects data.
so I cannot explain the increase to 73 MBD on Rembrandts chart
perplexed in Toronto
@Polytropos
Khebab and Ace their estimates are approximations only with many underlying assumptions that could be wrong. For example, they plot megaprojects building up per annum not per quarter and estimate a decline rate that is likely off the mark as we simply don't have the information on what the actual decline rate is.
Rembrandt
Well well well, look at those non-OPEC numbers. Reminding certain persons of my prediction:
A few tens of thousands more bpd should do the trick. We may already be there.
Models, schmodels. I don't need no stickin' models. My hunches are better than some people's fancy models.
I do think you need a model. Otherwise you couldn't have posted the comment on a computer which happened to be designed entirely by a model.
"Intel Inside - Design by Hunch"
That was ridiculous. I'm not building anything, I'm just making a prediction. Do we need models to decide everything?
Tell me, did you model your statement before you posted it? Did you carefully design a model of what your dinner would be tonight? Did you model falling in love with your wife/husband/s.o.? Are you going to tell me you have never, ever made a decision in your life based on a hunch? If you say you have never done so, you are lying.
Many a good decision and prediction have been made on hunches and guesses. Not everyone needs to carefully plot out the mathematics of something, complete with a thorough inventory of all possible inputs, before they make a decision. In fact, most don't.
I don't have a dog in this fight, I just wanted to tell a story about predictability, models, and hunches, which I heard from hurricane expert Kerry Emanuel. Any factual inaccuracies are mine: this is a cocktail party story.
So through the '80s and '90s, there was a scientist at the National Hurricane Center who released an annual hurricane forecast: by looking at ocean temperature patterns and trends in spring, he guessed whether a given summer/fall was likely to be a bad hurricane season or not. And it turns out, he was pretty good at it. Nowhere near 100%, but his predictions were significantly better than chance.
As he neared retirement, he started to focus on adding in data from computer climate models, and writing down algorithms and predictive equations, so that people could continue his predictions after he was gone. But the models all sucked: none of them predicted hurricanes better than chance. And in the end, it took 20 years of work before rigorous modeling was able to replicate the success of one guy and his hunches.
Does this mean that going by hunch is better than using models? No, it's just a funny story.
A little Internet fact-checking: I believe the guy in question is William Gray, at Colorado State University, not the National Hurricane Center. Like I said, I heard this story at a party a decade ago.
I am afraid you will need a model for everything. The way the world works now if you snooze, you lose.
About the "World oil production capacity" decrease, is it an EIA published figure or an Oil Drum one ?
If an oil drum one, how is the OPEC spare capacity computed ? By taking top production (in 2008) minus the current one, or from OPEC published figures ?
About the "World oil production capacity" decrease, is it an EIA published figure or an Oil Drum one ?
If an oil drum one, how is the OPEC spare capacity computed ? By taking top production (in 2008) minus the current one, or from OPEC published figures ?
It seems to me that we are not at peak yet.
I wonder what is going on in Russia, their production keeps on increasing while it was expected to peak at a lower level.
There has been no new country joining the "beyond peak club" last year (except Kuwait may be, about Saudi Arabia I don't have any guess), and for the coming year it should be more or less the same (even if one could expect China and Russia to reach their plateau soon).
And some countries should enjoy quite high growth rate in their oil production and /or capacity (Brazil, Kazakhstan, Iraq, Azerbaidjan, Emirates, and some other smaller producers).
Consequently my bet would be peak in 2015, but I would be interested to know whether anyone here predicts a peak before 2013 ? And on which basis (countries)?