| European gas buyers unwilling to pay for security of supply | The Oil Drum: Europe | An interview with Stoneleigh - the case for deflation |
The Future of European Transport: iTREN-2030
Posted by Rembrandt on October 30, 2009 - 10:23am in The Oil Drum: Europe
![]() On 21 October the final workshop was held in Brussels (Belgium) of the integrated transport and energy baseline until 2030 (iTREN-2030) modeling project. At the workshop a final scenario was presented that incorporated likely transport and energy policies, and the effects on European transport of a continued global plateau in oil production up to 2030. The integrated scenario was generated by four energy and transport models that have been linked in iTREN-2030 to increase the forecasting power of the transport policies of the European Commission.
On 21 October the final workshop was held in Brussels (Belgium) of the integrated transport and energy baseline until 2030 (iTREN-2030) modeling project. At the workshop a final scenario was presented that incorporated likely transport and energy policies, and the effects on European transport of a continued global plateau in oil production up to 2030. The integrated scenario was generated by four energy and transport models that have been linked in iTREN-2030 to increase the forecasting power of the transport policies of the European Commission.
In this post I describe the iTREN-2030 project and the different models, covering the POLES global energy supply and demand model in more detail, highlight the conclusions of the present integrated scenario, and give my reflection on the workshop commenting on some areas of improvement to augment the potential of the models.
The iTREN-2030 project is all the more important because the resulting model set and integrated scenario will be used by the European Commission (DG-Tren) in preparing the white paper on transport policies due for 2010. After discussion with the European Parliament and approval by the council of Minister, the European Union will as a result have set out its new course for the future of transport in the period up to 2020.
The iTREN-2030 project
The integrated transport and energy baseline until 2030 (iTREN-2030) project ran for 30 months starting May 2007 and ending October 2009. Funded by the 6th framework program of the European Commission the project aimed to extend the forecasting and assessment capabilities of TRANS-Tools, which is the EU transport network analysis model. Including the potential to include new policy issues. With the end goal of giving the European Commission the possibility to create coherent baselines wherein technology, transport, energy, environment and economic developments until 2030 are integrated. The project was carried out by a consortium of seven institutes among which ISI (Germany), NEA (Netherlands), TRT (Italy), TML (Belgium), IWW (Germany), IPTS (SPAIN), TNO (Netherlands).
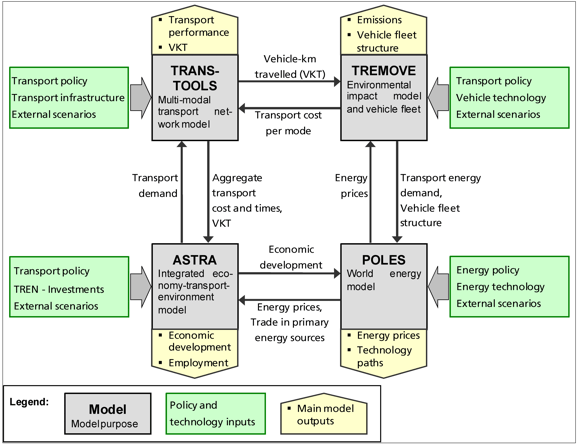
In more detail the project entailed linking and improving four different models that already existed, thereby enabling a more integrated modeling exercise on transport and energy. The advantage of linking these models is the creation of a much more detailed outlook. Each model covers its own area (transport network, energy supply, passenger flows, emissions etc.) in much more details than the others do. By linking them many more variables and feedbacks within the system can be taken into account.
The four models are
- TRANS-Tools (PDF Description), the model mainly used by the European Commission which gives an overview of the European Transport Network covering passengers and freight and inter modal transport.
- TREMOVE (PDF Description), a model that assesses the effects of different transport and environmental policies on the emissions of the transport sector in EU-27.
- POLES, (PDF Description), a model that simulates long term energy supply and demand developments for different regions of the entire world including sources such as fossil fuels and renewable energy soures as well as energy types such as heat and liquid fuels.
- ASTRA, (PDF Description), a system dynamics model that incorporates technology, employment and energy policy to analyse long-term consequences of European transport policies within the EU-27 plus Norway and Switzerland.
An overview of the four models and how they were linked is given in figure 1 below.
Limits to understanding: transparency and accessibility of the models
To understand a scenario we need information on which assumptions, formulas and data have been used in its derivation. In the best case detailed documentation is made available alongside a copy of the model itself. Although all the models are accessible to the European Commission and the consortium, some of them are proprietary in case of iTREN-2030. TREMOVE and TRANS-tools can be downloaded at no cost on the internet, but ASTRA and POLES are not available. This creates boundaries in comparing the outcome of these models with other studies. As a consequence most questions at the final workshop were related to understanding what the consortium did on many specific input levels such as how a 'breakthrough' in electric cars had been implemented in the model.
The need for transparency was also brought up by the consortium as a recommendation by participants of previous workshops, and by participants in the final workshop. Some effort was made by the iTREN-2030 partners to increase input by organizing two additional workshops were participants were given the possibility to recommend input on specific terrains. One of the outcomes of these additional workshops was the addition of economic crisis effects in the integrated scenario presented at the final workshop.
The POLES Energy Model
Since the Oil Drum is a blog about Energy and our future, and the POLES model covers the energy aspects of this modeling project, I highlight its core as far as information is available. POLES was developed by the French research institute IIEPE-EPE together with French energy consultancy Enerdata and the Institute for Prospective Technological Studies of the European Commission (IPTS). It has seen several iterations and was used in the World Energy Technology 2050 outlook by the European Commission and the 2007 World Energy Council Policy Scenarios (PDF).
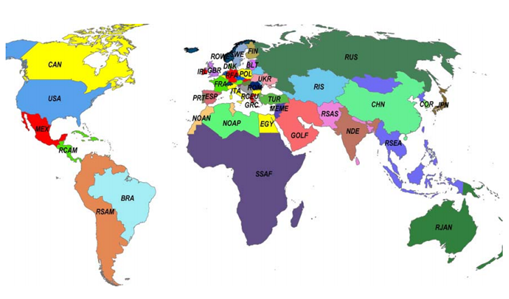
The Poles model divides the world in 47 zones. A total of 32 of these zones represent individual countries including the G7 countries, the European Union countries and BRIC countries. The other countries are modeled as 18 homogeneous regions. For example all of Africa except the northern countries are modeled as the region SSAF
The model employs a 'backward' calculation from final energy demand to primary energy supply. Starting with estimating final energy demand in different sectors including different Industries (Steel, Chemical, Non-Metallic, other), Transport Modes (Road, Rail, Air, Other), and RAS (Residential, Service, Agriculture). Separate calculations are made for 12 non-fossil energy technologies and 12 power generation technologies. In the next step diffusion of new & renewable energy technologies is modeled and generation of these sources subtracted from final energy demand resulting in 'net final energy demand', subsequently electricity transformation in fossil fuel power plants is 'undone' resulting in the needed primary fossil fuels to supply the remaining total fossil) energy demand. Imports and exports are incorporated to simulate trade flows of fossil fuels.
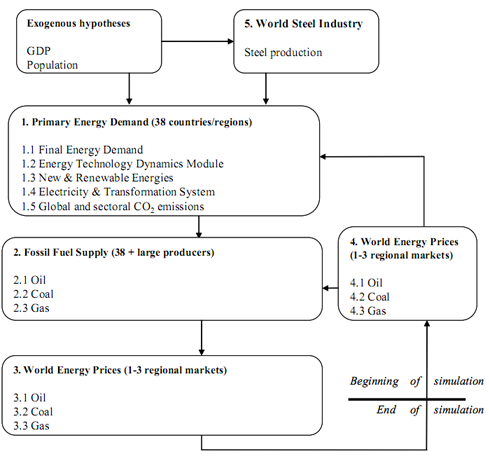
Oil and gas production is simulated by a discovery and reserve modeled using United States Geological Service (USGS) data from the World Petroleum Assessment 2000. Specifically:
- First the model estimates the cumulative amount of oil discovered as a function of the Ultimate Recoverable Resources (revision of USGS numbers with discoveries and production). Incorporating a recovery ratio that increases over time also depending on the price of the resource. In the World Energy Technology Outlook 2050 upon which iTREN-2030 was based the recovery rate for oil increased from 35% today to 50% in 2050.
- Secondly remaining reserves are calculated as being equal to the difference between cumulative discoveries and cumulative production. Using Rt+1 = Rt + DISt - Pt (where R = reserves, DIS = discoveries, P = production, subscript t = year of account).
- Thirdly, the model calculates production for non-OPEC based on a Reserves-to-Production ratio decreasing over time and the calculated remaining reserves, and for OPEC based on the oil needed to balance the oil market (OPEC total oil production = total oil demand - Non-OPEC total oil production).
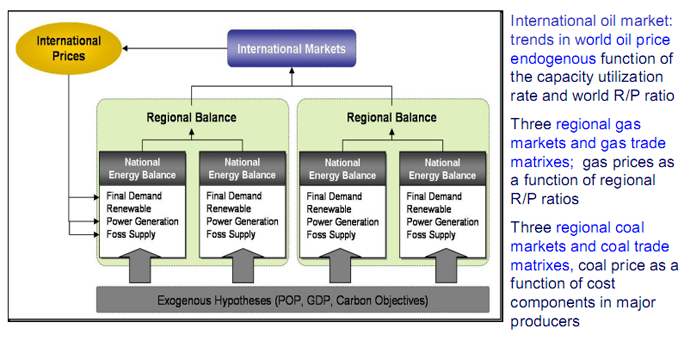
The world oil price in the model is for the short-term based on the rate of capacity utilization in the OPEC gulf, and in the medium and long-term on the world R/P ratio (including unconventional oil). Unconventional oil comes into play at a certain price when it is deemed competitive versus conventional oil. The price of gas is calculated in three different regional markets (US, Europe and ?) depending on demand, domestic production and supply capacity in each individual market. The main driver in gas price determination is the variation in the Reserve-to-Production ratio in each market.
More information on the POLES model can be found in this presentation describing the POLES model used for the World Energy Technology 2050 assessment.
An overview of the Integrated Scenario
In the iTREN-2030 an integrated scenario was made to show the effect of linking the various models. It was explicitly mentioned by the consortium that it was not the goal of the project to create the best scenario possible. This was a sub-objective from the main objective of linking and improving the models themselves. Nevertheless it was an interesting scenario worthwhile to show to The Oil Drum readers. The approach taken in the integrated scenario was to to incorporate likely future policies, with as policy drivers three factors influencing transport markets, namely climate policy, fossil fuel scarcity and new technologies. Also a fast recovery scenario for the economic crisis was included where GDP growth would continue to normal by 2012.
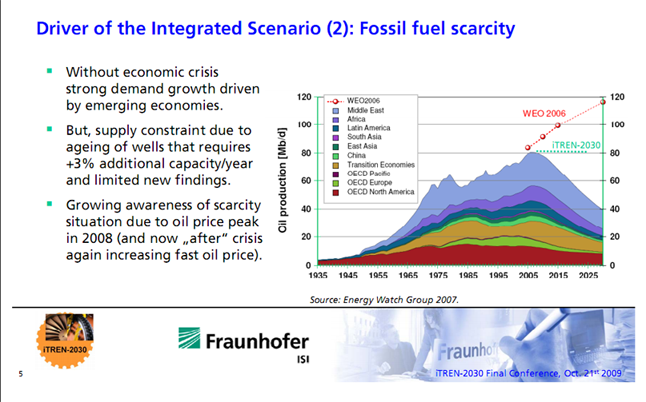
With respect to fossil fuel scarcity the project leader, Dr. Wolfgang Schade from the Fraunhofer Institute for Systems- and Innovation Research (ISI), presented two scenarios, one from the World Energy Outlook 2006 of the International Energy Agency, and the other from the Energy Watch Group from 2007. He made the remark that supply constraints due to aging wells require +3% of additional capacity per year while new discoveries have been limited. This figure is almost certainly too low given that three sources have independently from each other concluded that annual average declines are around 4.5% (CERA 2007, IEA 2008, Hook et al. 2009). Given the wide divergence of opinions over the issue of oil scarcity it must have been difficult for the consortium to decide upon which oil production scenario to take. In the iTREN-2030 project a choice was made to keep oil production at a plateau from 2005 until 2030, neither declining nor increasing. Shown in figure 5 below.
As to new technologies the project focused on five developments: 1) Biofuels, 2) fuel efficiency, 3) available alternative technologies including hybrid vehicles, compressed natural gas vehicles (CNG) and LPG powered vehicles, 4) Battery electric vehicles and hydrogen fuel cell vehicles, 5) New transport means including electric bikes, electric scooters, and segways. These developments were based on changes seen today that will accelerate.
Many European policies were incorporated. For Transport these included transport pricing for trucks on interurban networks after 2020, charging cars on interurban networks after 2025, city tolls for peak pricing after 2025, harmonization of fuel taxes, inclusion of air transport in the EU-ETS, liberalization of the railway system, CO2 regulation for cars (130 gCO2/km in 2015, 105 gCO2/km in 2020), CO2 regulation for light duty vehicles (170 gCO2/km in 2015, 150 gCO2/km in 2020), battery electric support leading to electric cars entering the market of city cars after 2012, and electric light duty vehicles for urban delivery after 2015, enforced implementation of CNG fueling stations, effective car labeling, regulation to use HDV low resistance tyres. Also all large scale European infrastructure road and rail projects were included by using TRANS-tools.
For Energy the policies included, 20% greenhouse gas emissions reduction by 20% in 2020 against 1990, 20% renewable energy in the final energy mix until 2020 (including 10% biofuels), the measures in the energy efficiency action plan of the European Commission and the deployment of demo-power plants for Carbon Capture Sequestration.
Results of the Integrated Scenario
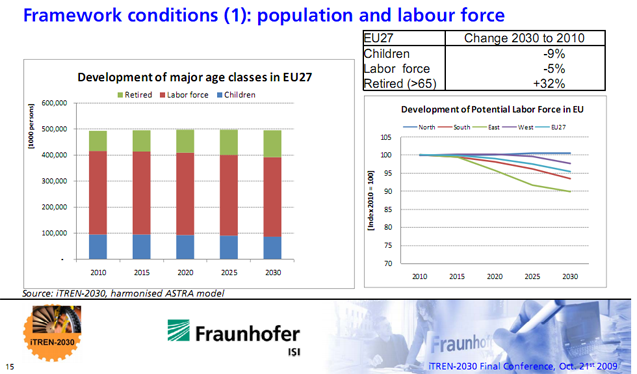
Population and GDP developments in the integrated scenario were first shown in the workshop. Population and labour force developments, show a relatively stable population up to 2030 and a decline in the labor force by 5% from 2010 to 2030 due to demographics as the number of retired people increases by 32%, shown in figure 6.
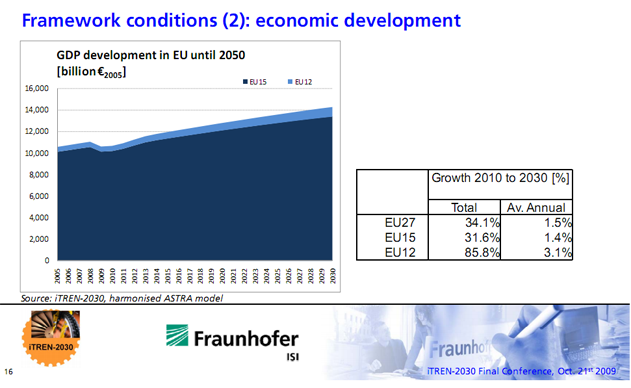
As to GDP, assumptions were inserted that the current economic crisis will be V-shaped and that a fast recovery will occur. In the integrated scenario the European Union is back to a constant growth pattern from 2012 to 2030. Growing at an average annual rate of 1.5% in EU-27, shown in figure 7. The total effect as modeled here is a 6.3% loss in GDP in 2010 versus a situation with continued growth from 2005 onwards, and a loss of 3.8% in 2030 versus a no crisis scenario.
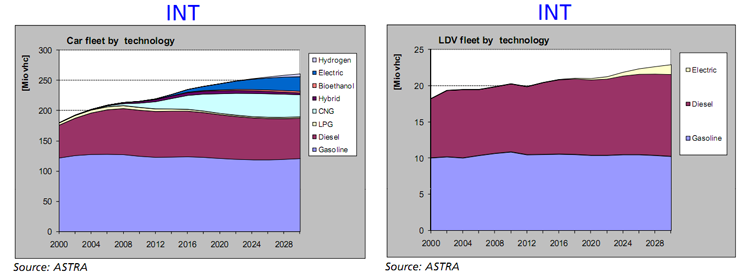
Although maritime and air developments were also shown I focus here on road transport as most changes occurred in road transport in the integrated scenario. The development of car fleets looked very promising under the assumptions used. Due to the assumption that oil production remains stable until 2030, oil price in the scenario rose to 90 euro per barrel and remained around that level until 2030. Combined with a stable GDP development this resulted in smooth technological developments. A large increase in the efficiency of cars (both diesel, gasoline as well as new technologies). This made it possible for the car fleet to grow while oil usage declined. An overall decline in oil consumption in transport (mainly due to less oil usage in car transport) of 0.1% was noted. The car fleet grows to 260 million in 2030 from around 205 million in 2005 as motorization takes off in Eastern Europe. The growth was filled in by new technologies, however, and my guess is although this was not shown, displacement of oil usage from Western to Eastern Europe. In total the integrated scenario shows a growth to 35 million compressed natural gas cars in 2030, a take-off of electric cars to 25 million in 2030, and the introduction of hydrogen vehicles by 2025. Also 3 million pure bio-ethanol cars would be on the road in 2030 The total number of Diesel and Gasoline cars declined from 200 million in 2008 to 190 million in 2030. And these cars (purple and purplish blue in figure 8) also run up to a certain percentage of biofuels.
Light Duty Vehicles benefit also from high oil prices by increasing efficiency, and the take-off of electric vans and light trucks by 2018 resulting in 2 million of these vehicles by 2030. In total oil driven light duty vehicles increase from 20 million in 2008 to 21 million in 2030.
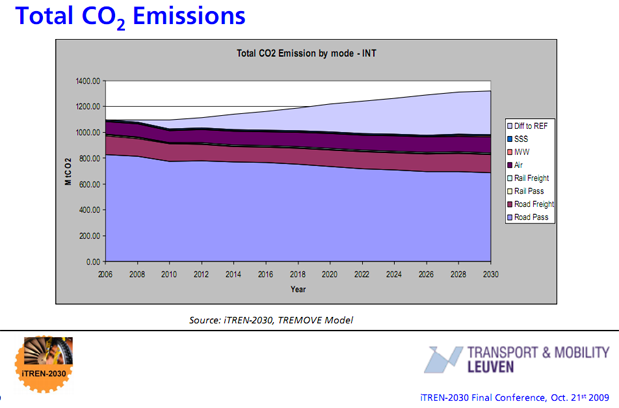
If these changes occur in the road sector it will lead to a significant decline in CO2 emissions in the overall European transport sector as shown in figure 9. Despite increases in total freight kilometers by 33.9% or 1700 to 2450 billion tonne kilometer from 2010 to 2030, and an increase by 25.7% or 4400 to 5500 billion passenger kilometers from 2010 to 2030 in cars. According to the iTREN-2030 team the European Union is steering towards a trend-shift in emissions against a 'business as usual' reference scenario shown in the light purple bar on top in figure 9.
Conclusions from the iTREN-2030 team
The iTREN-2030 team concluded the workshop with several interesting conclusions here reproduced from the presentations:
About CO2 emissions:
-In the integrated scenario total CO2 emissions from transport decrease due to declining emissions from road transport.
- Rail CO2 emissions continue to increase but at a lower growth rate, and only Air transport CO2 emissions continue at relatively the same pace of growth.
About economic growth:
- Economic growth is expected to be lower than in the past (less than 2% versus more than 2% before the economic crisis),
- In a fast recovery scenario around 4 years is needed to achieve the pre-crisis economic level.
- The impact of the economic crisis provides additional time to solve problems and foster the break-in-trends.
- Dr. Wolfgang Schade the project leader however put his doubts at whether this is such a realistic scenario by saying "This assumes that the financial crisis is solved - is it solved permanently? There are signs that we are building up the next bubble."
About vehicle fleets:
- Savings achieved by increasing fuel efficiency of passenger cars compensates expenditures for road charges.
- Average CO2 emissions of the EU-27 fleet until 2030 indicate that measure of the integrated scenario are not sufficient as only a level of 140 gram of CO2 per kilometer is reached in 2030 (versus a policy goal of 105 g cO2 per kilometer in 2020.
- Despite breakthroughs of battery technology, the potential of electric cars for long distances is supposed to be limited.
- Motorisation in EU-12 (Eastern Europe) reaches the EU-15 (Western Europe) level in 2030.
Reflecting on transparency and modeling limitations
I conclude with some personal reflections on the final workshop and the models. It was great to see many people from the European Commission (DG-TREN) and knowledgeable stakeholders being closely involved and openly reflecting on the process at the final workshop. This type of approach, where models are constructed to aid policy makers, and policy makers and knowledgeable parties are involved in the process, is in my opinion a necessity to deal with the complex problems that we face. I can only hope that such an approach will be more embedded in political decision making at the national level of my country, the Netherlands. I do think that more room needs to be given in these type of workshops to limitations and uncertainties. As in the end I did leave the workshop with a feeling that the modeling exercise did not properly addressed this. Although the purpose of iTREN-2030 was not to create the best possible scenario but to integrate the four models and show the possibilities of a scenario with likely policies, the integrated scenario did show the limitations that are inherent in the current model setup. These cannot be solved by simply altering some variables of the models, hence it is relevant in light of the main goal of iTREN-2030. Specifically I here mention three areas of importance that from my point of view need to be addressed in the future.
1) POLES the energy supply part of iTREN-2030 models energy supply from a neo-classical economic point of view. Higher prices resulting in more reserves and a gradual shift from conventional to unconventional production. Looking purely at reserves from a price perspective ignoring energy costs of production, and ignoring production flows constraints due to physical (water, materials, labour force) or political (lack of market access, oil production cap policies in OPEC countries) limitations. The iTREN-2030 project team wisely has steered around this limitation by imposing a scenario where oil production does not increase up to 2030. However this is only a partial solution. Better supply modeling can be done by either creating a new model, or augmenting the power of POLES to forecast supply by integrating physical and political production factors, oil & gas industry cycles, and energy costs of production (Energy Return on Energy Invested). Also I think more feedback needs to be created in the POLES model although based on the limited information available on POLES this may be an incorrect perception.
2) Macro-economic effects of high oil prices appear to be incorporated in a limited fashion given that GDP growth continues in a smooth fashion until 2030 after the fast economic crisis recovery. We know from several studies conducted independently that the United States economy is not able to bear oil prices much above 80 to 100 dollars per barrel. At a global oil price of 90 euro's per barrel until 2030, or around 140 dollars per barrel, as endogenously determined in iTREN-2030, it becomes extremely unlikely that the global economy can continue to grow in a smooth pattern, and hence that the European Union economy continues to grow smoothly at around 2% per year. At the least a more shock like pattern will occur as the United States economy gets hammered by these high prices and this effect ripples through the global economy. From my perception this effect will continue until a different country/economic bloc is able to replace the role of the United States in the world economy or until the rules/system of the economic game have changed significantly.
3) A more fundamental macro-economic question lies in the world situation on the relationship between our debt based economies and limits to energy production growth. When assuming a limit to oil production growth to 2030 in the Integrated Scenario, will economies still be able to service the global debt bubble? Estimated by Hannes Kunz of IIER to be around 345% of global GDP (chart). According to his needed estimates needed GDP growth in the world economy is 6.9% to be able to create an average real return on investments of 2%. Under an oil constrained future scenario debt will become too big of a burden and the world economy will have to inflate or deflate. Certainly smooth GDP growth is out of the question if the debt bubble bursts.
Finally, I wish the European Commission the best of wisdom in creating the white paper on transport. An area that is of huge importance in my perception of an oil scarce world.
References
CERA, 2007. Finding the Critical Numbers: What are the Real Decline Rates for Global Oil Production?, Cambridge Energy Research Associates, 21 pages.
IEA, 2008. World Energy Outlook 2008, International Energy Agency Publications, Paris France, 569 pages.
Hook, M., Hirsch, R., Aleklett, K., 2009. Giant Oil Field Decline Rates and Their Influence on World Oil Production, Energy Policy, Volume 37, Issue 6, June 2009, Pages 2262-2272.
Personnel
Editors
Contributors
Peak Oil Primers
Archives
- November 2010 (3)
- October 2010 (6)
- September 2010 (4)
- August 2010 (7)
- July 2010 (6)
- June 2010 (7)
- May 2010 (2)
- April 2010 (8)
- March 2010 (4)
- February 2010 (6)
- January 2010 (3)
- December 2009 (5)
- November 2009 (8)
- October 2009 (12)
- September 2009 (6)
- August 2009 (5)
- July 2009 (11)
- June 2009 (8)
- May 2009 (16)
- April 2009 (10)
- March 2009 (7)
- February 2009 (10)
- January 2009 (15)
- December 2008 (9)
- November 2008 (9)
- October 2008 (9)
- September 2008 (13)
- August 2008 (10)
- July 2008 (14)
- June 2008 (23)
- May 2008 (16)
- April 2008 (12)
- March 2008 (16)
- February 2008 (9)
- January 2008 (13)
- December 2007 (13)
- November 2007 (16)
- October 2007 (22)
- September 2007 (8)
- August 2007 (9)
- July 2007 (16)
- June 2007 (8)
- May 2007 (7)
- April 2007 (7)
- March 2007 (10)
- February 2007 (10)
- January 2007 (12)
- December 2006 (9)
- November 2006 (15)
- October 2006 (4)
- September 2006 (5)
- August 2006 (5)
- July 2006 (9)
- June 2006 (5)
- May 2006 (10)
- April 2006 (9)
- March 2006 (13)
Vital Trivia
License

This work is licensed under a Creative Commons Attribution-Share Alike 3.0 United States License.
This is a model that I came up with which describes the likelihoods of various speeds of human travel.
Model - http://mobjectivist.blogspot.com/2009/10/scaling-laws-of-human-travel.html
Verification - http://mobjectivist.blogspot.com/2009/10/verifying-dispersion-in-human-m...
The model result is very simple and it shows a scale-free distribution of travel rates (up to a finite limit). What will be very interesting is watching slight shifts in this distribution as travel habits change with modifications in the transportation infrastructure. As far as I know, no one is looking at the trends in other than an empirical view of the data, that is, no one else has a model to explain the distribution.
Firstly - thank you for such an excellent post; a pleasure to read something presented so succinctly and impartially.
I think I share your concerns, particularly over the potential flaws to the models. Assuming stable oil prices at €90/bbl is crazy - one assumes they have done this because modelling wildly fluctuating oil prices is near impossible. Also, the assumption "OPEC total oil production = total oil demand - Non-OPEC total oil production" is a dangerous oversimplification, but at least seeing policy makers acknowledging the possibility of non-growing oil supply for the next 20 years is a step in the right direction.
How much of the discussion was focused on transport beyond the motorcar? Europe already has the best rail network of any continent - did the calculations incorporate the percentage of car uses who are likely to switch to rail as prices rise? Perhaps a more accurate model would have seen oil supply stable, but [average] prices rising steady through to 2030, gradually causing different kinds of oil-replacement actions.
Nice to see some joined-up thinking from the powers-that-be even if it has a few flaws.
@Singo
Thanks for the reply and forward thinking. Maybe I described it wrong but the oil price wasn't assumed to be stable at 90 euro's per barrel but endogenously determined and came out to be quite stable around that level. I think that this is an effect of the limited incorporation of macro-economic effects of the model. I do not know how the pricing module works as it is a 'black box' due to the proprietary nature of POLES. However I think it is a simple elasticity model with supply and demand, where the elasticity figures are based on empirical data, which would explain the stability in prices.
There was not so much discussion in general actually as more questions regarding clarification and pointing out potential errors. This is I think a natural consequence of these type of meetings where 1 part holds most of the information and the others lack it so no open discussion can take place. As to what extent the rail situation was taken into account, TRANS-tools has a complex part to calculate the flows of the entire railway system in Europe and in iTREN-2030 they took into account all expansionary plans that are on the table to 2030. They also included some behavioural patterns on switches between modes depending on price levels I think (not entirely sure what factors where incorporated). I think the model is purely economically centered so it does not incorporate cultural behavioural switches in any sense (then again how do you model that?)
Yes - I had a read of the Trans-tools pdf, the work on increased rail passengers and tonnage looks pretty extensive.
I suspect you are right on the elasticity issue, but the empirical data is largely meaningless in a constrained environment.
The Millennium Institute's T21 model does include oil pricing.
The US economy "cracks" at $300 to $345/barrel (depending). The resulting decline in consumption drives oil prices down to $180-$210 despite depletion.
Some enhanced supply of oil at those price levels (with about a decade delay).
Alan
Yep in the technology perspectives to 2050 project wherein the POLES model was used they assumed developments as outlined in this post based on the USGS reserve figures, and no plateau whatsoever. I think voucher codes and coupon codes are more important than ever to people trying to save money on their shopping online.
I get your point Singo but I would disagree slightly. " ...modeling wildly fluctuating oil prices is near impossible" isn't true actually. The pricing assumptions in any model are just that...assumptions. One can put any range of prices in a model and vary those prices as wildly as you wish. These are assumptions...not predictions. Now predicting...that's a whole different matter and "near impossible" IMO. In my experience assumptions made in most models they are not unbiased. Often assumptions are made which lead to a predetermined conclusion. What will be the price of oil in 5 years? Everyone is free to guess. And they can present any numbers of reasons why that guess is correct. But the fact is no one "knows" what oil will be selling for in one month let alone years down the road. All predictions are unsupported guesses IMHO. Yes...they'll offer very clear and well defined reasons why their prediction is valid. And when you find their prediction is very incorrect they will also list a string of very good reasons why their guess was valid even though it was proved wrong. Want to impart a happier future...just use lower prices in your model. Want to scare the hell out of folks....just use a very high price.
Just the opinion of someone who has made a living for 34 years running various kinds of oil/NG models.
And, speaking as someone else who made a living for 34 years running oil/NG models, I would have so say you are right. Many of their assumptions are invalid, and therefore many of their predictions are going to be wrong. They are likely going to see a Black Swan rather than what they expect to see. (Yes, I read the book too).
In my opinion, the system could be modeled using Catastrophe Theory, but that is a branch of mathematics too far outside their comfort zone for them to use, or even understand.
Outside my comfort zone too RMG but Black Swan has helped me appreciate such concepts on a qualatative level. As far as predictions vs. model I got into a friendly debate with one of our cohorts here. I still prefer my take: all models are correct (assuming the basic construction is sound). And the underlying assumptions used in the model are not predictions...they are assumptions. Thus a model cannot be right or wrong. But one can take the results of a model as say this is how things will be. That's a prediction which assumes, at a minimum, that the base assumptions will develop as described. Of course, even if the assumptions prove to be true the model may still not be validated if the basic relationships are not correctly factored in.
What's the chance of any aspect of PO being predicted accurately by some model? Pure luck IMHO. Too many variables which, for the most part, are not themselve very predictable. If someone hits it right at any point along the path I look at it like 1 person out of 16,000,000 picking the winning lottery ticket: sell 16,000,000 tickets and someone is sure to win. But that doesn't mean they are better number pickers then the other 16,000,000 folks.
My world view is that all models should work in the statistical limit. For example, all the computer software in the world works according to a model of the statistics of an ensemble of electrons (and holes). The model is exact at a certain level, otherwise electrical engineers could not design the devices and circuits, and programmers could not execute their code anywhere.
Well I suppose that is a bit pedantic, but the model I mentioned at the top of this post is also exact in the limit and obeys the laws of maximum entropy. You may be surprised to know that it is also a Black Swan fat-tail model according to Taleb's definition. Who would have thought that travel patterns by people follows that kind of statistics, yet it does.
My point is that the whole world is open to interpretation via these wonderful modeling ideas.
True Web. My reservoir engineer models are certainly ruled by such statistical limits. But this is where my interest in Black Swans is growing. Statistics work only to the degree that one takes into account the full range of possibilities. As I think you imply many don't utilize the fat tails, etc because it's beyond their abilities. I've just gotten Mandlebrot's "The (Mis)behavior of Markets". Though economic analysis generally sends me headlong into nap time I can already see the broarder implications he offers. Years ago I got jacked up on Chaos Theory. Then reached my intake limit. Now, with PO and the connectivity to Chaos and Mandlebrotian thoughts, my interest has been renewed. Theory has never been able to hold my interest too long. But practicality always does.
BTW --If you've read this work you might want to go online and check out an appendum he added in Oct 2008 and his reflections on the market crash last year.
Obviously a huge amount of work gone into all this -I can't begin to even speculate where the flaws might exist but suspect the wing of The Black Swan will be working its magic to make many expectations null and void.
One personal note: just got back from Thailand where it is common to see 4 people -basically a whole family- share a moped to get from A to B. On driving back into London @ rush hour I was struck by how many cars where single occupancy commuters. We are obviously way along the consumption curve due to relative 'cheapness' of the means. BAU growth implies the Asian family buys a small car, early peak might imply WE move to electric mopeds...
-Have a look at some of the numbers on Chinas growth here (~slide 28 onwards), quite an eye opener;
http://www.molymines.com/public/documents/4/8/Desjardins_molconference_2...
Regards, Nick.
"and the effects on European transport of a continued global plateau in oil production up to 2030."
Now people are finaly admitting we are sitting on a production plateau its apparently going to stay that way for a long time. Although I admit that timing exactly when we will drop off this plateau is difficult to estimate considering the number fudging of OPEC during the 80s and Saudi Arabias secret reserves, 2030 is way to optomistic in my opinion.
This report also does not factor in the export land model and concidering Europe is a net importer of crude, it cannot be ignored.
@Grautr,
>This report also does not factor in the export land model and concidering Europe is a net importer of crude, it cannot be ignored.<
The model actually incorporates exports and imports in POLES so the 'Export land model' is incorporated, even under the assumption of a stable oil supply until 2030. I.E. POLES models energy globally including supply, demand, imports and exports.
OK cheers Rembrandt,
I had a good look round the link to the POLES models but it was heavily loaded with acronyms and difficult to understand.
I did find this though;
"The conventional oil production plateaus at around 100 mbl/d, it is
even decreasing a bit in 2040-2050"
So they arn't even talking about the production plateau we are sitting on now but a hypothetical one of 100 mbs/day!
@Grautr
Yep in the technology perspectives to 2050 project wherein the POLES model was used they assumed developments as outlined in this post based on the USGS reserve figures, and no plateau whatsoever. So in iTREN-2030 a significant change in assumptions was made (stepping away from USGS numbers).
This is very much like what I have been doing with the Millennium Institute for the USA (with partial funding by ASPO-USA).
Busy today, more comments later.
Best Hopes,
Alan
@Alan
Thanks for pointing out on the T21 model, ill have a look at it
Rembrandt
Here's the reddit and SU links for this post (we appreciate your helping us spread our work around, both in this post and any of our other work--if you want to submit something yourself to another site, etc., that isn't already here--feel free, just leave it as a reply to this comment, please so folks can find it.):
http://www.reddit.com/r/worldnews/comments/9zdxx/the_future_of_european_...
http://www.reddit.com/r/energy/comments/9zdry/the_future_of_european_tra...
http://www.reddit.com/r/environment/comments/9zdxy/the_future_of_europea...
http://www.reddit.com/r/Green/comments/9zdy4/the_future_of_european_tran...
http://www.stumbleupon.com/submit?url=http%3A%2F%2Feurope.theoildrum.com...
Find us on twitter:
http://twitter.com/theoildrum
http://friendfeed.com/theoildrum
Find us on facebook and linkedin as well:
http://www.facebook.com/group.php?gid=14778313964
http://www.linkedin.com/groups?gid=138274&trk=hb_side_g
Thanks again. Feel free to submit things yourself using the share this button on our articles as well to places like stumbleupon, metafilter, or other link farms yourself--we appreciate it!
I would say, based on decades of experience in the oil and gas industry, that many of their assumptions are invalid, and thus they are going to come face-to-face with a Black Swan - a bird that they did not expect to see.
I particularly had doubts about the statement:
because I believe the USGS lost touch with reality some decades ago. When US oil production peaked in 1973 it came as a complete surprise to the USGS, but they are still predicting that next year the downturn will stop and production will begin to increase again, as they have predicted for the last 36 years.
The crude oil price predictions in this report are completely unrealistic:
We will probably see prices exceed 97€/bbl next year, as we did last year. The behavior of this system is better described using catastrophe theory:
But these are bureaucrats, and something like that is too far outside of their experience to contemplate. So, expect to see a Black Swan in the near future, but don't expect the bureaucrats to admit that it exists.
I noticed that the chart on page 14 of the POLES models showing oil and gas price predictions wasn't showing last years 2008 price spike. I then checked the date of the article and it was 2006. This was back in the days when CERA were getting 80% of their predictions wrong and the IEA graphs were always climbing skywards irrespective of the fact we had been on a plateau since the last quarter 2004. If they had been making policies based on these two organizations predictions at this time,then its to be expected things will be a little skewed.
According to Taleb's definition of what constitutes Black Swan fat-tail behavior, I would say that all of discovery and production follows this pattern. The logistic sigmoid derives from dispersive fat-tail behavior and the qualitative reserve growth and hyperbolic declines are fat-tail. And the distribution of reservoir sizes is definitely fat-tail.
So what the fat-tails tell us is that we still have a possibility of the occasional giant oil field discovery and that the potentiality of a sudden collapse may not be as obvious as one may think. You see, Black Swans can work both ways.
When reading all these comments on 'fat tails' I just couldn't connect them to European models. However the latter have been known to tumble and land their skinny tails on the runway when the tenuous balance maintained over their spikes gave way-kind of the wobbling bridge effect :-)
I don't mean to make light of the modelling being done here. I would add to what WHT observes that a miraculous technological leap forward is also a 'black swan event'. iTREN 2030 ignores that possibilty as well. How do you rate the probabilities of major outlier events? Don't the positive and negative outliers tend to cancel one another out when they are charted?