Mind-sized Hubbert
Posted by Ugo Bardi on September 21, 2009 - 10:46am in The Oil Drum: Europe
The bell shaped Hubbert curve is commonly observed when a non renewable, or slowly renewable, resource is exploited in a free market. But what is the origin of the curve? Ugo Bardi and Alessandro Lavacchi have recently published a simple "mind sized" model of the Hubbert behavior in "Energies" . Fat cows and lean cows are not included in the equations of the model, but come as a logical consequence of it.
(Note: I made the figure above using two cow images that I had downloaded from the internet long ago. If someone owns these images, please alert me or the editors. We'll be happy to give due credit or to remove the images if so requested.)
Possibly, peak oil will always be beyond the intellectual capabilities of the average politician, but it is also true that there are plenty of intelligent people out there who are perfectly able to understand the concept. The problem is how do we explain it to them. And, if we have to explain it, we must understand it first. What is, exactly, that causes production peaks for oil and for other non renewable resources?
If you look at the common explanations for the Hubbert curve, you'll see that it is often said to be due to the sum of many extraction curves for individual wells. (see, e.g., Roger Bentley's paper, here ). There is something in this explanation: as you scratch the bottom of the wells, you produce less and less and that may generate some kind of curve that first goes up, then down (see this paper by Dudley Stark). But this interpretation requires a number of af hoc assumptions and I think it is not enough to explain how general these curves are. The bell shaped curve appears not just with crude oil, but with a number of resources which don't have the same behavior in terms of single production units. For instance, there are the cases of coal, whale oil, caviar, Carrara marble and many other cases of mineral resources . So, there must be some general explanation for why we have bell shaped curves so often and in so many different cases.
Hubbert himself never clearly explained what he thought was the origin of the bell shaped curve, but his model has been analyzed over the years using various versions of system dynamics and standard economics theory. There are many models which can explain bell shaped production cycles, including the well known "Limits to Growth" scenarios. The problem is that most of these models are not easy to understand for the non specialist. If you look at the scheme of the "world3" model used for "The Limits to Growth" scenarios, you'll see just a jumble of boxes and arrows. How does one make sense out of that? Yet, the bell shaped curve is not so complex, in itself. Can't there be a "mind sized" explanation for it?
"Mind sized" is a term invented by Seymour Papert, the creator of the "logo" programming language. He said that complex problems can always be broken into mind-sized blocks, and so can be grasped by the human mind. Indeed, most of us (including politicians) tend to take decisions based on the way we understand what's going on and our understanding can't be but mind sized. In addition, we tend to ignore what we don't understand. That may be one of the reasons why peak oil is so commonly ignored by politicians and decision makers.
While trying to understand the Hubbert curve a few years ago, I started studying the history of whaling, which turned out to be a perfect example of a the Hubbert cycle. Even though whales are, theoretically, a renewable resource, they were exterminated so fast that they didn't have time to reproduce. So, I found very clear, bell shaped curves for the production of whale oil. It was while I was working on whales that there came to my mind the Lotka-Volterra model. After all, Volterra had developed his model studying Mediterranean fishing, so could the model be used to describe whaling?
You have probably heard of the Lotka-Volterra model that goes also under the name of "predator-prey" or "foxes and rabbits" model. You find it typically in biology textbooks, but it is not so often used in biology because it doesn't catch the complexity of a complete ecosystem. Nevertheless, the Lotka-Volterra model is a good "mind sized" model that tells you how populations grow and tend to overshoot their resource base. Think of an island inhabited by rabbits and foxes. Initially, foxes reproduce rapidly with plenty of rabbits: it is positive feedback. But, with many foxes around, the number of rabbits goes down and foxes starve and die, too. That's negative feedback. Then, without foxes, it is the surviving rabbits who have an easy life, they reproduce and grow. At this point, foxes start having plenty of food again, and the cycle restarts.
So, I spent a few Saturday afternoons developing a simple fitting program for the whaling data based on the Lotka-Volterra model and, bingo! It worked right away! The model could reproduce very well the production of whale oil (the prey) and the predator activity, taken as proportional to the tonnage of the fishing fleet. I could also simplify the model assuming that whales were just like crude oil: a non renewable resource. Here are the results in a graph that I made a few years ago (there is another, more refined version of this fitting in the paper in "Energies").
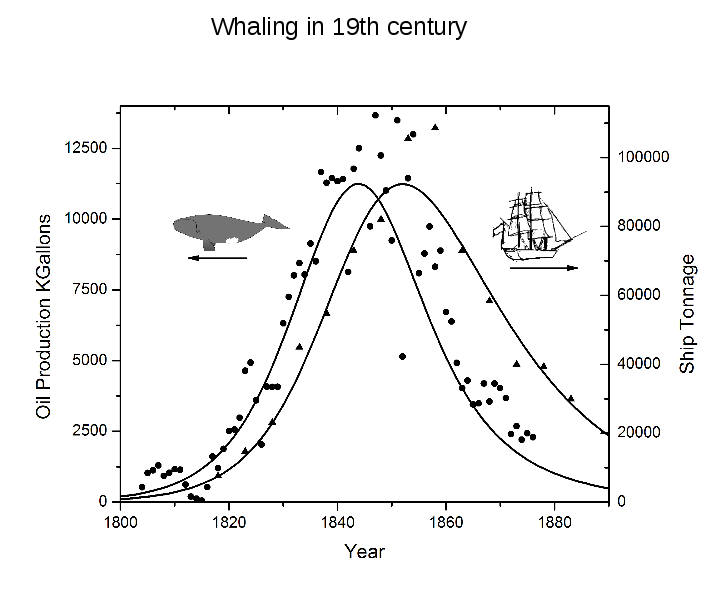
So, there is this very complex system with whales, whalers, whaling vessels, the whale oil market and all that, and the way it has evolved in time is - basically - mind sized. Whalers have been catching as many whales as they could, reinvesting their profit in more whaling vessels. It was positive feedback. But, with whale numbers dwindling, catching them became more difficult and expensive. Profits went down so that, after a while, whalers had to reduce their activity. It was negative feedback taking over. Eventually, they had to stop whaling altogether, at least for those species of whales hunted in 19th century. That was helped by the appearance of crude oil in the market but, surely, depletion was the main factor. It has been estimated that at the end of this whaling cycle there remained only fifty females of "right whale" (the main species hunted) alive in all the oceans.
Now, I think there are not many cases of a quantitative fitting of the Lotka Volterra model to a real life situation; so this is a very interesting result. And, when you discover something interesting, you feel excited and elated. But you have to see whether you have something that has general validity or if it is just a quirk of the particular system that you are studying. In my case, I needed to show that the model applies to other resources, including crude oil. That took quite a bit of head scratching.
Think of crude oil, the "prey" is oil itself, but what is the "predator"? Evidently, it is all those things that are used to find and extract oil: people, machines, rigs, trucks, etc. All this can be described with a single term "capital", as it was done, for instance, when modeling similar situations in "The Limits to Growth". The problem is how to quantify capital.
There are plenty of historical data available in terms of the extraction of crude oil and of other mineral resources. But data on what I called "capital" are not easy to find. And, then, what should be used as capital for crude oil? The budget of the oil industry? The number of workers? The number of active rigs? When I could find data for these parameters, I tried to fit them to the model, but nothing worked. That was good, incidentally, because, at least, it told me that the model is not a "fit-all" model.
Since this work was done mainly overnight and with no financial support, it took me a lot of time, years, to reach a conclusion. (There is a general rule in scientific research that says, "No research that is relevant is ever financed".) Initially, I enlisted the help of Leigh Yaxley, petroleum engineer based in Jakarta, and we published a preliminary version of this study in the proceedings of ASPO-5 in 2006. Unfortunately, Leigh had to stop working on this subject because of other engagements. So, I asked Alessandro Lavacchi, a former PhD student of mine, to give me a hand. Both Leigh and Alessandro are much better than I am at data processing and curve fitting and, with their help, eventually, we found the key to the story.
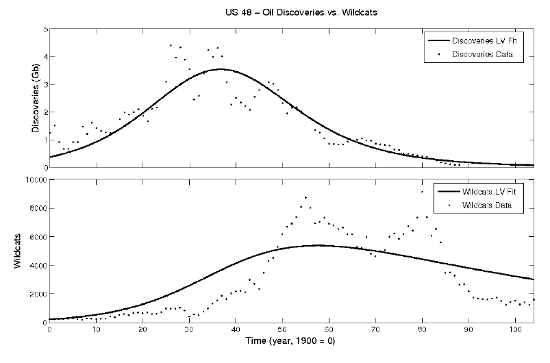
Let's go back to whaling in 19th century; at that time the main problem related to killing whales was finding one. Once it was found, killing it and making whale oil out of it was a relatively quick process. In the case of crude oil, instead, the length of delay between discovering a field and getting oil out of it often amounts to several years. But, the main point is discovery: once a field is discovered, it will be put into production at some point--that's almost automatic. So, prospecting for oil is the main "predation" activity, and also the most expensive one. So, the production parameter in the model is the amount of oil found , not the produced oil. At that point, you can think that a measure of the effort (the capital) placed into prospection is the number of wildcats drilled. Once we found this idea, it was bingo again. The relationship of predator to prey was there, although it was not as good as for whaling. Here are the results for the US 48 lower states (the case studied by Hubbert).
Indeed, once you start thinking in these terms, you'll see that the "predator/prey" relationship is a very useful concept that can help you understand a lot of things. For instance, you may go back to the jumble of boxes and arrows that is the "world3" model, and now you'll see that you can cut it down to a number of "mind sized" subsystem that are often based on negative/positive feedbacks similar to those of the Lotka-Volterra model.
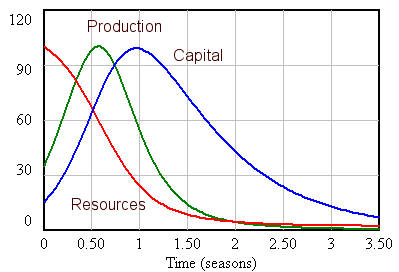
It may be difficult to find sufficient data for a quantitative fitting but, qualitatively, the Lotka-Volterra model can be applied to many cases. Here you can see it, without experimental points - mind sized.
Maybe I am seeing ghosts created by my own mind, but I tend to see many things that I have done in my life in these terms. I see it even with the research grants for my lab, at the university of Florence. Despite having stepped up our efforts, we are getting less and less money to run the lab. "Peak grants" has taken place a few years ago and my lab is being destroyed by the same mechanism that, long ago, brought down the Roman Empire.
But we had started with the idea of explaining the Hubbert curve to a politician; so, let me summarize the main assumptions of this "mind sized" model. It may still bee too much for a politician, but at least it gives you a fighting chance.
1. There exists a non renewable or slowly renewable resource which is limited in amount and "graded" in costs of extraction/production.
2. People will extract/produce first the low cost resource and will re-invest an approximately constant fraction of their profits in more facilities for extraction/production. This is the positive feedback that generates the rapid initial growth of the curve
3. As the resource is consumed, increasing costs of production reduce profits and - as a consequence - investments in extraction/production. This is the negative feedback that generates the decline.
When these three assumptions are described by two coupled equations, they generate a nearly symmetrical, bell shaped, curve. Political, technological and market factors may modify the behavior of the system. However, since the curve has been often observed in historical cases, we can conclude that these three assumptions are sufficient at least for accounting for the main tendency of this kind of system.
In the end, don't take the Lotka-Volterra model as the universal explanation of everything. But it is mind sized model that can help you describe what the peak is (including fat cows and lean cows) next time you discuss with a politician.
Acnowledgement
Besides my coauthor, Alessandro Lavacchi, I would like to thank the people who have helped me in various ways in this work: Leigh Yaxley, Colin Campbell, Jean Laherrere and Juergen Mueller. I would also like to thank the friendly and supportive staff of the "Energies" journal at MDPI References
The paper that we published in "Energies" in 2009. It is written in what (I believe) is a readable style, so that you can download the paper and understand it. Here is the full reference:
Ugo Bardi and Alessandro Lavacchi, "A Simple Interpretation of Hubbert’s Model of Resource Exploitation" Energies 2009, 2(3), 646-661; doi:10.3390/en20300646
The early paper on the LV model applied to the Hubbert cycle written with Leigh Yaxley is at http://www.aspoitalia.it/images/stories/aspo5presentations/Bardi-ASPO5.pdf
You can find one of my papers on whaling at http://www.energybulletin.net/node/3338
Personnel
Editors
Contributors
Peak Oil Primers
Archives
- November 2010 (3)
- October 2010 (6)
- September 2010 (4)
- August 2010 (7)
- July 2010 (6)
- June 2010 (7)
- May 2010 (2)
- April 2010 (8)
- March 2010 (4)
- February 2010 (6)
- January 2010 (3)
- December 2009 (5)
- November 2009 (8)
- October 2009 (12)
- September 2009 (6)
- August 2009 (5)
- July 2009 (11)
- June 2009 (8)
- May 2009 (16)
- April 2009 (10)
- March 2009 (7)
- February 2009 (10)
- January 2009 (15)
- December 2008 (9)
- November 2008 (9)
- October 2008 (9)
- September 2008 (13)
- August 2008 (10)
- July 2008 (14)
- June 2008 (23)
- May 2008 (16)
- April 2008 (12)
- March 2008 (16)
- February 2008 (9)
- January 2008 (13)
- December 2007 (13)
- November 2007 (16)
- October 2007 (22)
- September 2007 (8)
- August 2007 (9)
- July 2007 (16)
- June 2007 (8)
- May 2007 (7)
- April 2007 (7)
- March 2007 (10)
- February 2007 (10)
- January 2007 (12)
- December 2006 (9)
- November 2006 (15)
- October 2006 (4)
- September 2006 (5)
- August 2006 (5)
- July 2006 (9)
- June 2006 (5)
- May 2006 (10)
- April 2006 (9)
- March 2006 (13)
Vital Trivia
License

This work is licensed under a Creative Commons Attribution-Share Alike 3.0 United States License.
One thing that occurs to me as I read this post is that your model does not seem to say that world oil production will follow a Hubbert Curve on the way down. You have shown that it is really oil discoveries that follow a Hubbert Curve. It seems like world oil production may decline more rapidly after peak than a Hubbert Curve would suggest for several reasons:
1. The big old fields are depleting at the same time new smaller more recently discovered fields are depleting. The overall decline curve may be dominated by the drop-off in the big old fields.
2. Technology is such that production can be held up by horizontal drilling and injection of water or gasses before a steep terminal decline. This may tend to make the downslope of individual large fields steeper.
3. Demand has been held up by the world's large debt load. As major areas of the world are no longer able to maintain as high a debt load, their ability to buy the things that oil produces will drop off, so world oil demand will drop, reducing oil prices, and thus profitability of extraction.
4. The whole system is embedded in the world's financial system and the world's international trade system. If there are problems with these, they might tend to reduce world oil production.
5. What we see in a production curve is gross production. It is really net energy we care about, and it drops more rapidly.
One thing that could theoretically partially offset this steep decline is all of the very heavy oil from around the world. This was long ago discovered, but didn't seem to be worth producing. If it can be produced at a low enough cost (=high enough EROI) to be worthwhile, and the amount of capital and other inputs required is not too high (multiple big ifs), it could theoretically have its own flatter production curve.
Another possible source of long very slow recovery might be enhanced oil recovery techniques applied to fields that would other wise appear depleted. EOR issues would seem to be similar to those of very heavy oil (EROI, capital, other inputs).
All your points are correct, Gail. My model is a "zeroth order" model that explains the main forces at play. Then, there are other elements: first order, second order, etc, which have to do with technology, finance, etcetera. The point is, I think, that the fact that we see so often nearly symmetric curves means that there exists such a hierachy.
About the EROEI question, I suggest you to read the original paper; where we discuss the point in some depth.
Actually, in the real world we don't see your nice symmetrical Hubbert curves that you have drawn through the historical data - in reality all you can say is that that production of finite resources will peak then decline, but not in a predictable way (with serious economic consequences). If you don't believe me use Jonathan's Energy Export Databrowser
http://mazamascience.com/OilExport/
It is very rare to find a country with a symmetrical production curve - drawing a smooth single peak line through almost random data points (like your lower 48 plot for wildcats) when anybody can see two 'real world' peaks will convince few people - the single peak is clearly a lie so you will likely be ignored by most.
Because the timing of the world peak is not predictable, and your smooth curves through the data are not reality, IMO you will find it very difficult to convince anybody, especially politicians and oil company directors and indeed anybody whose livelyhood depends on the peak not being any time soon.
exroid -- taking upon myself to speak for all the thousands of us in the oil patch we all understand PO and agree it is upon us. But, yes, I don't know CEO of a public company or one board member who would say so publicly but who wouldn't agree privately. I personally don't get into the curve fitting and numeric models. Being a geologist I tend to keep my models simple...I'll leave that to the less math challenged. I don't try to estimate how much spay any one skunk might put out on any given day. But I know it stinks. And so, IMO, does the prospect for the world's ability to carry on FF BAU.
I would hazard a guess that secondary peaks -and perhaps even a longer 'bumpy plataue' are caused by real world 'harmonics' -i.e. the 2nd higher order impacts discussed above. This makes sense because the human 'energy system' can divert resources and borrow from the future to expand current production via debt.
-In the simple fox and rabit case the foxes cannot 'import' rabbits from outside the system at the first signs of 'rabbit scarcity' so it is a simple bell shape.
Nick.
Good image. If foxes could import rabbits from another island, they would keep growing for a while more, then their population would crash down even harder because also the other island would be eventually depleted of rabbits. Either there is an infinite number of islands, or - more likely - there is no escape from the limits of the system!
There actually is, in a practical sense, an infinite amount of *islands*. They are the stars with their planets, in the uncountable trillions. We're just, seemingly, trapped on this one, finite planet, and can barely even brush with our nascent hands, our own little moon.
Seemingly trapped? No, we are trapped. Please let us not go down that road again. Leave it to the science fiction fans and trekkers who are willing to believe anything is possible.
Ron P.
Leave it to the science fiction fans and trekkers who are willing to believe anything is possible.
No, anything is possible.
Just not probable.
Of course it is Eric, of course it is. All one must do to make the impossible possible is believe. Believe in free energy, perpetual motion, travel faster than light, believe all the impossible things that physics says are impossible. There are no laws of physics, just things that are not probable. Just believe!
Ron P.
So, ridicule is the mode of the doomers this week?
We need a better breed of religious fanatic, this is getting old.
So which impossible things do you believe in?
I believe that rational discussion can be had with anyone as long as guns aren't involved.
Ok, I'll agree to leave the guns outside. However as for the first part of your belief, let's just agree to disagree ;-) I start from the premise that rational discussion is at least a *TWO* way street. I also believe that ridiculing ridiculous ideas is fair game!
Sure, but ridiculing someone for saying that something that is clearly possible (i.e. can be done if sufficient priority and resources are assigned to it) is still likely to be impractical (enough resources are not likely to be available) just because it is an optimistic position is pure poo flinging.
It is clearly possible that we can establish a colony on the moon, maybe even on Mars.
Whether we can afford to do it, and whether we know enough to make a self-sustaining colony, I'd call "unlikely" at best right now.
The net result if we set out to do so right now would most likely be some new knowledge and an empty station on the moon.
The funny thing is, every response to that statement I've gotten in the past indicates that people stop reading after the second sentence. Simply saying that a space colony is possible shuts down the doomer mind, completely preventing any point that may follow it from registering. It may even be the simple act of saying "space colony" without immediately ridiculing the concept that inspires the reaction. More research is necessary there.
'Twas brillig, and the slithey toves,
did gyre and gimbal in the wabe.
All mimsey were the borogoves,
and the momeraths outgrabe.
--Lewis Carrol (with apologies for any misspellings...)
Look, you can do a lot of things with other people's money-what you are proposing is just another way to piss it away. We have an overwhelming surplus of land on Earth for humans-this has been pointed out repeatedly but somehow you cannot comprehend this reality. All this crappy land is a paradise for humans compared to the Moon or Mars-period. If you want to spend some money on some wild scheme, start with making this excess land useful in some way.
If DD's frequent assertion that human extinction is not only possible but imminent due to humankind exceeding Earth's carrying capacity is true, then your assertion that there is plenty of space on Earth is not.
And exactly what wild scheme did I propose spending money on this time?
I simply said that making an off-Earth colony is possible, but we probably can't afford to do it right now and would likely fail if we tried.
On the other hand, if DD ever managed to actually convince me of his position on human extinction I would have to put all my resources into making it happen, and anybody else's money I could get my hands on. A thin chance at survival is better than none at all, eh?
it appears that you are unable to comprehend the absurdity of the first sentence you wrote. Again: 1. There is a surplus of land on Earth. 2. A minority of this land is useful, a smaller percentage is useful for food production. All the crappy land on Earth has at least a theoretical possibility of usefulness for human life, something the Moon will never have.
Which is why I am unlikely to ever buy into DD's human extinction idea.
Can people really not see conditionals in statements that contain emotionally charged information?
DD may very well be right-the odds are not bad that he IS right.It's just that his case is not airtight.
As far as carrying on a rational discussion with anybody,all I can say is that you must lead a very sheltered life if you're serious,but most likely you just forget your winky;)
But just in case you know of a place where there are no fools,I want to move there asap;)
There is definitely a finite probability that he is correct. I mostly don't consider his position (as presented) particularly useful, which makes his incessant banging on the topic annoying. The least he could do is defend his case with more rigor, otherwise I have no reason to change my evaluation of it.
As far as a place with no fools, I suspect if I moved to a place where I thought there weren't any there'd be one there as soon as I arrived ;) I worked tech support for 4 years between the Navy and my first programming job. It's simply awe inspiring what you can run into out there.
Darwinian,
It's not directly relevant at this minute but let's not forget the passage about running just to stay in the same place and running REALLY FAST to get someplace.
I'm suprised you haven't brought it up in regard to maintaining oil production.But I'm new here ,maybe you have.
...but if it takes more energy to transport the rabbits from 'Planet Claire' than you get in eating them then they might as well not be there in the first place other than to say 'look, here is a Planet Claire Rabbit bought back at huge expense...'
-The human analogy would be something like fruit grown on the moon or more Energy specific: fuels with EROI < 1.
Nick.
Hydrocarbons from Titan. They're just laying about on the surface up there ...
Ha Ha Ha!!! I remember getting so excited when I read that there were oceans full of liquid methane on Titan until i started to think about how much energy would be required to bring it home!
I've been an Oil Drum reader for several years and this is my first post. Finally have something worth contributing... I think :)
I think Ugo's model is a great explanation for the 1st order cycle of depletion for non-renewable resources. However, xeroid has a good point that simple, single modal distributions don’t fit historical data sets very well.
I think classical economics supply and demand drivers are a good explanation for 2nd order cycles that all of us who have spent time in the oil industry (and/or studied its history) are well aware of.
Perhaps, early in the cycle of depletion, the 2nd order supply and demand effect actually dominates the signal (and is mis-interpreted as the 1st order driver).
Let’s take the predator / prey mechanism further, by adding a classic supply and demand 2nd order effect on top of it. But first, I’m going to make a few changes…
· Fox / rabbit system replaced by human / mammoth, since mammoths were a non-renewable resource relative to the human reproductive cycle.
· Let’s say mammoths aren’t found everywhere, only in valleys, and the number of mammoths in a valley is proportional to the valley size.
So let’s start with the first isolated human population in valley #1, that discovers a way to kill mammoths for the first time. Their population explodes and peaks when mammoth numbers fall-off to a critical point. Some hungry cave man decides it might be worthwhile climbing over the mountain to see if he can find some more mammoths. He discovers valley #2, which has more mammoths than valley #1 originally had. A 2nd order peak in human population beings, as valley #1 continues to deplete and harvesting of mammoths in valley #2 begins.
Using the model above, one can imagine long periods of time, where cavemen put less effort into finding new valleys, because current mammoth discoveries provide mammoths in excess of human consumption, until the human population increases to a critical level.
The human population would continue to go through 2nd order increases and decreases, with an apparent 1st order exponential growth trend, until the biggest valley with the largest mammoth population was found and depleted. Only at this point, in hind site, would it become apparent to the average caveman that mammoths were a non-renewable resource and they’d better put some effort into finding a replacement food source. Whether or not peak caveman population was tied to peak mammoth production, would depend on whether or not the (hopefully) yet-to-be discovered food source could provide the same calorie density per unit effort as mammoths.
Did I pass the test?
Petro, one of the things I sometimes dream about is to have data for mammoth hunting to fit with the LV model. I am sure it would work but, alas, a little difficult. Maybe those little notches on ancient mammoth bones means a kill each one. So, who knows.....
But, more seriously, what you are describing is very similar to whale hunting. Also in that case there was a spatial part to the story, even though the aggregated data show only the total whale oil production. Whalers started with the whales which were close by, there were "hunting grounds", areas of the oceans that were depleted one after the other, while whalers would wander farther and farther off in the ocean. Nevertheless, the Hubbert curve stands!
Ugo I found your article most impressive. Good luck with your ambitions to explain things to Politicians! ;-)
There is a typo in your link to "The Roman Empire" above - you meant http://europe.theoildrum.com/node/5528 but there was one digit inadvertently dropped off the Node number.
Fixed. Thanks!
I use trees and trees growing in valley and on hillsides.
The reason for the hillsides is it adds in EROEI and money concepts.
So they first hunt the mammoths in the valley and as this resource is exhausted the hunt up the hills and ravines of the valley. If you think about simulated annealing then you can consider it as the valleys filling with a water like substance that turns valleys into hills.
Basically depleting the resource changes the topography such that you loose your deep valleys and the system becomes patchy with many small valleys.
At this point as they search the new smaller valleys or old topography hills they find a new deep valley and exponential growth begins anew.
Thus the search algorithm remains the same its just the topography of the search regions is altered by the search itself. Think of looking for buried treasure digging holes as you search or dig your search region is itself altered.
If you dig a really deep hole you could pile the dirt on top of the real location :)
In any case the issue and in a sense its the one I need to understand with WHT's dispersive discovery model is it seems its difficult to tell the difference between simulated annealing finding different minima and simulated annealing with a variable surface.
They look very very similar on the way up in my opinion and its difficult to tell which process is occuring. Its not even clear if they are really different at least during the search phase.
Of course the difference as you notice is huge on the back side as you end your search phase in the second case where search was efficient once you found mammoths and only then expanded to other regions.
The problem of course is once you searched the last region you have very few mammoths left in any region. For a period of time you have the contribution from all regions providing the last of their mammoths then all are gone.
It pure a pure extinction event and happens shortly after the last valleys are searched. Thus mammoth population drops rapidly to zero in based on the rate the final ones are hunted independent of the original search algorithm.
This is important in my opinion because obviously once a population of mammoths is found the rate its depleted depends on the hunter function not the search function.
In the second case of efficient search once a population is found followed by search of poorer reasons the hunter function steadily dominates the curve and eventually search provides little additional in the form of additional mammoth sources.
This is what I think we have done with oil and as you can see it ends badly.
What I don't understand is how to add this hunter shock to WHT dispersive discovery model I swear to god one day soon I'm going to set down and add this hunter feedback loop. And its a positive/negative feedback slowing and speeding search based on past discovery. And of course underlying this are the intrinsics of pure dispersive aka first order/ second order search.
I define second order search as above where the search itself also modifies further search patterns. In the case of oil we got the easy stuff first but we also developed better search methodology and made new discoveries in old areas I.e the search was repeated. In my water like concept the valley was filled but not evenly leaving often smaller valleys although a big one could still be missed its still intrinsically dispersive with the probability of finding or more correctly missing the big one remaining. In the real world highly unlikely and the big ones are found early during the initial search. Not first but also highly unlikely in secondary "better" searches.
And last but not least in nature the Hunter function is of the same magnitude as the search function if not larger. The assumption that search is the predominate function is in my opinion fundamentally wrong both are at least equal in magnitude or on the same order.
To see why all you need to do is note that production rates become rapidly more dependent on producing existing discoveries and independent of new discoveries as the search peters out. Not only does the original discovery model not tell you the future it should not be able to since it simply does not contribute much to the future overtime and as the date of discovery drops into the past.
Another way to see this is the date of discovery of a resource becomes secondary and its size and production profile dominates future production levels.
Its important of course to determine the depletion level assuming the URR estimates are correct which is highly questionable since URR itself it tied into the Hunter function via technology and price.
Regardless once a finite volume is searched and most of the resources found and exploited in general in my opinion the system reaches a broad maxima or golden age followed by rapid collapse. The golden age occurs as contributions to production change overtime yet production continues to increase.
At first new production coupled with new discoveries cause production increases then new production and search technologies extend both the search and production domains then as search dwindles new technology continues to contribute and searching previously searched regions adds more. In the end your just plain out as technology hits its limit and expanding extraction by poking more holes fails. Note how infield drilling plays a huge role in maintaining and boosting production but its technically just a more detailed search.
This repetition of the search pattern in existing discoveries completely hides the real situation as it does not add new oil it simply increases the depletion rate. And this is where the real problem lies as we actually add these together.
This is URR expansion overtime and later discovers assume that the original estimate was low and tack on more. In reality its not simple addition as you can't easily correct the original estimate for the new one since the original was dependent on the technology and price at the time. Its complex to determine what was really missed.
Thus all of these extensions are for the most part bogus and they are simply the Hunter function posing as discovery its a huge fraud.
Its like a hunter searching a valley thats been hunted for decades "discovering" mammoths they where discovered long ago and their numbers calculated in the original discovery adding them again when you hunt and kill them is simply wrong. Maybe the original estimates where not precise but thats a different issue and not one solved during via hunting and simple addition.
Even including all those you killed in the past with the ones you kill now is not correct.
The correct answer is of course to look at past production plus good estimates of remaining production and total amounts and recovery factors etc. Its a process outside of the actual hunting.
Anyway enough.
Since you suggested simulated annealing, take a look at popcorn popping dynamics. The question is : Why don't all the kernels pop at the same time?
Figure 1: Each bin has a width of 10 seconds, and the first kernel popped at 96 seconds. So the overall width is quite large in comparison to the first pop time. From http://www-mariachi.physics.sunysb.edu/wiki/index.php/Statistics_with_Po...
Certainly, if you stuck a thermometer in the popcorn medium you would find the average temperature rising fairly uniformly. Naively, you would imagine everything popping at once or within a few seconds of one another -- after all, water seems to boil quite suddenly. But from the figure above, the spread seems fairly wide for popcorn. The key is the dispersion in the characteristics in the popcorn. This dispersion does not show up in the time but in the activation barrier of the kernels or in the micro-variability in the medium. It gets transformed into something approaching a logistic curve as the medium temperature accelerates in temperature and then keeps rising. You can think of the individual pops as those kernels meeting the criteria for activation. The laggards are those kernels that haven't caught up, either intrinsically or because of the non-uniformity of the medium. (as a counter-example, water is uniform and it mixes well)
This experiment is an example of simulated annealing in action (sorry Memmel, but finding local minimum is a red herring). And it is why that all these Lotka-Volterra and Verhulst formulations are quite useless to understanding the dynamics of real systems such as oil extraction. They simply do not take into account the stochastic environment of exploration and beyond.
If we had applied an LV formulation to the popcorn experiment, what would we get? Since it is deterministic, it would come out like a spike with the cumulative showing as a step function. All the LV can do is work on the mean value, so that it misses the real dynamics of random effects.
I could easily work out the popcorn dynamics from first principles and use that as a predictive tool for some future need. I would tell a politician that I could accurately gauge how long popcorn would take to pop. Unless he had never seen a popcorn popper in action (GHWB perhaps?) he would say, yeah that would make sense -- and it also makes sense how oil depletion dynamics plays out.
This is the kind of mind-sized model we need to work out.
Well using the popcorn model and forgetting for a moment about minima.
I would not go so far as call them a red herring but not needed for the core model.
You can also express it as changing the rate the popcorn is heated. In your example we are assuming the steady application of heat and out pops :) the dispersive model. However if the heat is not ramped evenly then what happens ?
Next assume you don't care if the kernel pop and are turned into charcoal i.e only ones left in the unpopped state. This assumption removes the issue of burnt kernel maybe for a later discussion.
The simplest answer is it depends. The simple model still holds in the sense that your probably not going to get a different volume from the one the dispersive discovery model predicts. For every kernel that pops because of a changes in speed that would not have popped in the steady case you stand a good chance of say drying one out if your heating to slowly at some point.
However the profile of popped vs unpopped is now influenced strongly by how you change the heating rate its distorted and its not clear in the least how to remove this distortion and discern what is heating and what is dispersion.
The extreme cases would be some sort of uber microwave vs a low heat burner that only periodically crosses the pop threshold i.e the function can be distorted to either a delta function or a sort of decaying sine wave like pattern.
Given that any signal can be generated within the constraint of the overlying dispersive integral.
I'm just saying that if the search rate varies in time then I don't think dispersive discovery generates a smooth curve. Indeed the full shock model handles this via its shocks.
Nothing wrong with the model I'm just wondering what happens when the shock and dispersive discovery are of the same order of magnitude and if its possible to discern this i.e pick out the real dispersive curve when hit with a huge shock.
Now the shock model is a perturbation model and these generally don't behave well with large perturbations. I get uneasy about the validity of the model under these conditions esp since I think the shock is itself in a feedback loop with dispersive discovery so they are not independent.
And example of this sort of shock is say a nuclear war after the shock the value of the original dispersive discovery model is questionable i.e its a new problem. Thats extreme but thats the point when is extreme to extreme ?
When does a shock become to big ?
I just don't really know what it means to add a large shock and understand even less if its in a feedback loop. Its not that I don't think I can do it its just how do you know your right ? It seems to me you can plausibly get any answer you want with a range of valid shocks. This forces the problem back towards proving that some sort of large shock is correct yet in the case of oil since the data i.e production and discovery is contaminated by whatever the combo of shock and dispersion is its a bit of a catch22 you don't have a good way to develop a pure if you will large shock. And of course given the nature of the shock I envision it really only becomes large around the peak and post peak.
For oil production it obviously suffered a large magnitude shock in the 1980's.
However the functional form was permanently altered after that. Given I generally end up with the symmetric peak most probably being slightly after 1995 my best guess is still 1995-2000. Oil production at its peak in the 1980's
was not really surpassed until 2000 twenty years later. Given the sharp rise in oil prices past that point I personally question purported production numbers past 2003 an we just happened to invade Iraq at this point the largest known reserve of real oil left. Its twilight zone after this numbers don't add up.
Given the fiasco of Food for Oil production numbers after the first Gulf War in 1990 are a bit questionable as far as Iraq's real contribution. Price suggests the market was well supplied so I suspect production numbers might be a bit low from say 94 to 2003 for Iraq.
In fact price generally suggests that actual production from 1979 to 2000 was probably significantly higher than reported and reported production numbers are low. Given how OPEC quota's worked this makes sense low ball numbers making it into the official books with prices suggesting otherwise. Especially for KSA as it seems the announced one thing and did the opposite. Things make more sense if you assume Saudi Production was higher than reported for quite some time.
The assumption of a low of 6mbd instead of 4mbd actually works surprisingly well if you modeling consumption and price. And back up to eight a lot faster.
From then on out spare capacity of at least 2mbd remained for several decades.
In the past at least it seems Saudi Arabia has actually acted as a true swing producer more often than the official numbers seem to indicate and done a very good job of keeping the market well supplied with plenty of oil in fact more than they admit to.
Given the above ground geopolitical situation the argument that real oil production was systematically understated up to about 2003 and overstated after that is not a bad argument and it tends to do a very good job of resolving price supply and demand. The US does a good job of ensuring that wars further obscure the situation but still it seems to hold.
Regardless at least for oil large magnitude shock seem to be the rule not the exception thus I'm still not quite sure how our ability to model the shocks and introduce speculative ones that may be valid esp if they are large makes sense.
I just don't know and don't have good vibes ...
Its just to easy to get the number you want the ability to prove your right seems to be missing.
Of course the heat applied to the popping process is ramped upwards via Newton's law of cooling/heating. It wouldn't show a strong peak in pop frequency otherwise.
Dispersion is known to play a huge role in popping times as the
distribution of critical pressures is due to variations in thickness. This is amplified by the sensitivity of the Arrhenius pressure to changes in temperature. So in effect what you get is a huge apparent acceleration as the popcorn kernel passes through the activation temperature window. Dispersion creates the fat tails.
I only bring this popcorn model up because I happened to be microwaving some popcorn last afternoon and listened for the popping profile and thought it fit a dispersive model. The fact that it had some connection to your mention of simulated annealing made it somewhat apropos on this comment thread.
It is definitely analogous to an accelerated dispersive search model as the activation energy creates an equivalent acceleration term as the temperature sweeps through the region. Technology and fast adoption provides the acceleration term in oil exploration.
I really don't know why this dispersion argument is so hard for people to accept. As Nassim "Black Swan" Taleb has pointed out, "probabilists are born, not made -- many mathematicians are capable of computing, but not understanding probability".
Relax WHT.
I understand (and like) your dispersion model.
However, the chosen analogy is a bad one.
How about popcorn randomly 'dispersed' on the floor of a totally dark movie theater and clean up crew without flashlights trying to find and remove as much of the popcorn they can --in other words hunting for the big piles first and then looking for unpopped small kernels near the end of the process because all the 'easy popcorn' had been found and picked up?

__________________
Left click on image to enlarge
Those and the unpopped kernels are the "fat tail" bits. The veritable "Black Swans" of the popcorn world.
And my only real argument is this term is large i.e it doubled the rate of search over time. It also doubled the production rate. We found and extracted oil twice as fast vs a dispersive model without this term.
If your running twice as fast then you have half the amount of oil predicted by symmetric solutions.
A very easy way to not that this guess of about 50% is not far off is to note that average field lifetimes have halved over the last several decades from about 20 years in the 1970's 1980's to about ten now.
The problem is it tends to remove oil from the fat tail i.e there is no fat tail
we have burned it up.
Whats really really interesting is because the base equation i.e dispersion has a fat tail if you figure out how to tap this resource then every thing looks great for a long time.
Using the concept of finding all the pop corn in a dark room analogy I'm saying the flood lights where turned on and a high powered vacuum cleaner used. Vs using a small dustbin in the dark.
Its still dispersive discovery sure not a problem but the time evolution of the problem or rate of discovery changed by and amount equal to the original rate.
In fact the large revisions to URR that make the bulk of current know reserves are and artifact of this. Again they are in general on the same order of magnitude as the original discovery but all they really are is double counting the same oil using better technology its just the definition evolved over time as we got better at actually imagining the oil in place. In general before the 1970's the fat tail of oil in reserves was discounted i.e it was not considered economically recoverable outside of the stripper wells.
Maybe one thing thats missing here and this analogy is a good one is a lot of the last pieces of popcorn found are near former large piles. I.e they are found in new regions but by re-visiting already explored areas. The best place to find oil is where you have found oil. The search volume is swept multiple times not just once each time with better technology.
True original discoveries of virgin basins falls off rapidly. I'd suggest that by the 1980's most of the important basins had been found and really by the 1970's.
Virgin search i.e new basins with substantial potential for oil rapidly became a rare problem and now we have deepwater and the arctic but deepwater is in general just finally seriously searching known basins in general.
Regardless if your dealing with major changes in your search methodology then a smooth search algorithm does not seem to be the correct one.
In any case given the magnitude of the shock that technology seems to have caused you don't have to do much math there is no fat tail its gone there is no backside its gone. The original dispersion model with a fat tail ensures that if technology is developed to exploit this intrinsic behavior of search then you don't have it anymore.
Its because it was there in the first place that technical advancement was able to bolster oil supplies so dramatically. We simply figured out how to cheat at the game of dispersive discovery and exploit the fat tail phenomena.
I have some good data for popcorn popping and will apply a dispersive model to show how well it matches to the observed statistics. Essentially a 2 parameter model and the insight it provides knocks your socks off. Contrary to what people think, the envelope is not a Gaussian normal curve.
Hi Ugo,
We met at the ASPO conference in Ireland in 2007, when I was one of those "politicians." I have had years of experience explaining peak oil to politicians. I don't find them any more dense than the average university professor. In fact, I've had some of my most heated conversations about peak oil with one of my former geology professors (we're still friends though).
Someone posted a George Carlin piece several days ago and it is worth a re-post.
I think we delude ourselves by thinking that our political system is capable of doing much to respond under these circumstances. Perhaps you followed the first recall of a California Governor back in 2003. He was largely blamed for the 2001 electricity "crisis" in our state. California's budget crisis will now be blamed on his replacement, the Terminator. But the reality is that the voters are to blame in a myriad of ways. We are asking politicians to lead us across a frozen lake but we aren't willing to follow him unless/until we see they don't break through. And it's not just one lake, every day there is another lake just waiting to drag you to your death.
I applaud your effort in attempting to develop an appropriate message that people will grasp and heed. It has been my experience that too many of these exchanges turn out to be more like trying to convince someone that their god is not the true god. It has also been my experience that most of the politicians who do get it say to me, "What am I supposed to do about it." Even here at TOD, I think we'd be hard-pressed to come up with a plan and then get a majority to agree to it.
OK, defense rests. Now all you politician/government haters, tell me how stupid I am...
But when it comes to the god of the "wise and free marketplace", that is exactly what we need to do.
Otherwise we are all doomed.
Recall however, that our current monotheistic religions began with someone (e.g. Abraham) trying to convince idol worshipers that there idols are false and that the Invisible White Bearded Rabbit is the real thing instead?
By defintion, my God is the true god because she is in my corner and she has my back covered. Period.
Debbie, first of all apologies if you felt included in the "politicians" category - I wasn't thinking of you when writing my little piece!!! If all politicians were like you, the world would be a very different place.
But you are perfectly right to say that politicians are not more stupid than anybody else. There is Sturgeon's law that says that 99.9% of everything is crap. And Peter's principle that says that people rise to their level of incompetence and stay there. These laws apply to politicians as well as to university professors. No evidence that professors are smarter than politicians - perhaps the opposite is closer to truth. Actually, professors have a capability of muddling issues with appropriately academic gobbledigook that is unrivalled in any category on this planet, except perhaps lawyers. Trying to explain peak oil to a professor can be much worse than to a politician.
Anyway, I emphasized the concept of trying to explain peak oil to politicians as the result of a personal frustration with the political debate as it is here, in Italy. But I subscribe completely to your statement "the public sucks". Absolutely.
I think we can apply (with some changes) my model to the public/politicians relationship. Politicians are predators, the public are the prey. Now, of course, politicians don't eat the public (although, sometimes, I have this sort of feeling that maybe, given some special circumstances.........), But they are predators of the public's minds. They absorb the public's fears and feed back these fears to the public. That is a positive feedback that makes a few issues grow out of control and shuts off the debate on everything else. There is a basic problem with the way "mass media" work.
Eventually, politicians mirror the public and the public mirror politicians. Our politicians can't solve our problems for us. Nor can the public. And so, what do we do? Oh, well......
Hi Ugo,
I wasn't fishing for an apology--just trying to point out a trap (or sport) we all fall into. Anyone who tries to serve in public office is called so many names that you either develop the appropriate self-preservation skills, or you get out. There are very few politicians that I admire, but even those can disappoint us on particular points. If anything, I hope my comments cause a few here to pause and consider an attitude that can poison our ability to find productive discourse. I keep putting off writing a piece on governance because it brings out the worst in bloggers--it is almost a "third rail" issue. Perhaps I'll make some time after ASPO conference...
Your predator/prey observation is interesting. I agree, the public does feel like "prey" and hence their attitude toward government. With great effort, it is possible to be more inclusive at the local level, but it takes great effort. For anyone who has ever participated in a homeowner's association, they can probably testify to how quickly relationships break down over seemingly meaningless issues. Transition towns will suffer these same challenges. So now imagine the issues at a state, national, or world level, and it is amazing anything works. Essential to governance is a well-informed populace and that isn't possible as long as the MSM sees their role as protagonist/entertainer/gotcha machine.
Debbie, I know that you weren't looking for an apology; I just felt that I owed one to you :-). Incidentally; I have been a politician for a short time of my career. I have been engaged with the Greens. I even got some kind of high level (maybe) position in the party's hierarchy. That was when the Italian Greens still existed; now they are way post peak. Apart from that, I think there is space for a politician to do good work, it takes nerves of steel and a certain ability of dodging blows (metaphoric but, sometimes, even physical). It is not very different from being a university professor. But I found that being a professor is more fun; so I gave up with politics!
I'm more than willing to cut George Carlin some slack he was a great comedian!
However when a politician stands up and says "'The Public Sucks. Fuck Hope.'" Then I have a problem with that. It sounds exactly like the arrogant stereotype we have come to expect our politicians to conform to.
Foreperson addressing the court: Your Honor the jury has reached a verdict.
Judge to Jury: Ladies and Gentlemen of the jury, Is this your verdict?
Jurors respond: Yes, your Honor.
The Foreperson hands the court clerk the verdict...
Court Clerk reading: We find the Politician guilty on all counts!
Debbie,You have got your head on nice and straight.
Another way of expressing Carlin's point is to say we get the government we deserve.
If you present a "liberal" position to a "conservative" dressed as a conservative idea ,the conservatives will embrace it like a long lost favorite child.
Ditto the liberals.
But everybody in an advantageous position is sure that if things change he will lose,and so we manage to turn lots of win -wins into LESS THAN zero sum games because not only do we get no change-we expend a lot of effort fighting to make sure there will be none.
I'm too tired right now to put up and explain a good example but someday soon when the subject turns to politics again I will.
Yes. That first.
Second. Extraction and production become ever more capital intensive as we go deeper. Therefore rapid extraction is required to get timely payback on investment, i.e. an adequate IRR. Rapid extraction stretches things out, but results in a steeper decline when it does occur. I think this is being seen in shale gas.
There are of course a lot of different routes a depleting resource can take. Take a glass of water. It can go down in one gulp, i.e go from 1 to 0 in a vertical drop, or one can sip it steadily until it is all gone, which means we have a straight line going down from 1 to 0. (Picture time as the x-axis, quantity the y-axis, 1 as full, 0 empty.) One can also picture the resource depleting very slowly at first, but picking us steam in proportion to the amount already consumed, that is sipping in proportion to the amount already sipped -- but also sipping in proportion to the amount remaining, which in the latter half causes one to sip ever more gently finishing the glass off without a slurp.
You actually get Hubbert's curve by saying that the rate of sipping is proportional to the product of the amount in the glass times the amount already sipped. That seems to be a very natural compromise between the gulp and the steady sip. And maybe one could prove it results from some kind of average over all possible paths from full to empty. But I agree with Gail that global depletion isn't obliged to strictly follow Hubbert.
The depleting resource is not the water in the glass, but the water in your body. The water was not depleted from the glass, it was depleted from your body, that's why you drank the glass of water.
Now suppose you are on the verge of dehydration in the middle of the desert, and there is an oasis of freshwater on the horizon -- about 20 km away.
There's plenty of water, and you won't get it, because you don't have enough right now to get there.
There's plenty of oil in the ground, just like there's plenty of gas at the station, which is no good if you run out of gas before you get there.
The current machine of global civilization is like, well, one big machine, and the machine is oil-dependent, like a car is gasoline dependent. If you want to switch out the gasoline tank for a propane tank or electric batteries, the entire car goes offline during the transition. You can't drive home, to the store, to work, to your girlfriend, or to your other girlfriend. You are now also offline.
The only reason we can do any fuel source switching now is because it takes a few hundred to a few thousand cars out of circulation at any one time, out of over 800 million total cars, plus buses, trains, ships, and airplanes also still in operation.
Hello Ugo,
Thxs for the keypost--I greatly appreciate your efforts. I tend to agree with Gail and the other commentors that the backside of Hubbert will be different than the frontside; more like a sharkfin than a smooth rolldown. Of course, I am also partial to my 'Rogue Wave Theory'...
http://www.theoildrum.com/node/5482/512259
...whereby we race to get all we can now because we want it all now [Hat tip to Nate H]. In short: we build a giant house of cards as high as we can until it collapses downward to get the sharkfin curve:
http://img16.imageshack.us/img16/6686/sharkfin.gif
[source: http://www.theoildrum.com/node/5258/489050 TODer WebHubbleTelescope]
This Sharkfin has been much discussed by Memmel and WHT plus others. It also figures into my predictive thinking for my 10-year WAG of [19 @ '19]:
http://www.theoildrum.com/node/5795/541926
Bob Shaw in Phx,Az Are Humans Smarter than Yeast?
Yep; it is easy to modify the model to make the curve look like a sharkfin. I didn't do that in this paper just to keep things simple - but it may well happen. And notice that the model doesn't assume anywhere that humans are smarter than bacteria!
As the link concerning carrara marble is in Italian, an english translation link might be useful.
I had written up an even simpler explanation for this phenomenon. Ugo's explanation is more precise, nevertheless I list mine here:
You can simplify the wave function by a triangle:
1. In the beginning someone discovers the resource, then business is picking up and as a consequence of the plentiful supply an increasing demand is developing.
2. Eventually the physical limits of this resource becomes noticeable (the peak point) and the production cannot be increased any more.
3. After this point the production declines. Even higher investments cannot prevent the decline due to at least one of the following reasons:
- this resource becomes more expensive than alternative resources, by which it is being substituted (smooth transition) or
- the rise in exploitation investment is limited by the purchase power of the resource consumers (supply crisis).
This mechanism has probably much to do with Kondratiev waves or Supercycles (although I disagree with Kondratiev in that the real waves are not regular but irregular).
In fact it is probably related to any business cycle as all economists know them: after discovery phase the business becomes a "rising star", later a "cash cow" and then declines as a "poor dog". (Which phase do you think the international oil companies are in ;->)
BTW: The weblink about Carrara marble is dead, can you fix it Ugo?
I am sorry, but the paper on Carrara marble exists only in Italian. I linked it anyway because I think you can still give a look to the graphic with the Hubbert behavior. BTW, I fixed the link.
Thanks. As far as I know the problem about Carrara marble is its declining "quality": Carrara was famous for its pure white marbles, but these are completely mined out since about the 80s. They were substituted by the white marbles from Estremoz, Portugal, which meanwhile are exausted too. Nowadays pure white marbles are shipped from Brazil (Espírito Santo?).
I don't know if there will be a substitute when the brazilian mines are exhausted. Otherwise white marble may become pretty expensive...
Hi Ugo. Thanks for that easily digestible foray into portraying peak oil. If we take this to the global, human scale, we can see that the predator (mankind) has just about devoured all the prey (Earth's resources). I also think that we would get some interesting correlations if we paired mankind off with other essential resources, like water, arable land, fisheries, forests, and biodiversity. These would even make the most lame minded politician peek over his glasses, be them reading, or containing spirits.
Yes, Drillo, Carrara marble shows the same behavior as oil: the best quality is extracted first. In the case of oil quality is defined as EROEI, in the case of marble as other properties; color, purity, etc. The interesting thing is that, while we can substitute oil with other energy sources (I think it is the meaning of the world "fungible") there is no substitute for good marble. Once it is broken/cut/used it is gone forever. Or, at least, for the geological time it will take to make it again.
Drillo, I think your explanation is substantially equivalent to ours, although, as you say, we tried to make it quantitative. About Kondratiev, I don't know. It has always seemed to me something arbitrary; but perhaps it is because Idon't know enough about the idea
One of the assumptions for a symmetrical bell-curve is reinvestment of profits made from production. But a lot of expensive off-shore wells are developed very rapidly with up-front funding and, as a consequence, end up producing in a non-symmetrical manner.
Given that a large % of new production is offshore this assymetry may impact on the global bell-curve going forward?
TW
Good point, TW. Indeed the "zeroth order" model assumes that a constant fraction of profits is re-invested in new exploration. But that is - obviously - an approximation, albeit supported by historical data. If the economic system decides to pump a lot of money into finding and developing new wells, then the real curve will be asymmetric. It will be sharkfin shaped. And, of course, it will be an extremely bad idea to try to squeeze as much oil as possible out of the earth: the decline will be very rapid and will take us by surprise. I have sort of a feeling that this is exactly what is going to happen.
Not to mention that it would be one of the worst things we could do. We need to substantially reduce fossil fuel consumption as soon as possible, not increase it.
You speak in the future tense? Isn't the evidence that the world economic collapse was preceded by an "unexpected and unexplained" six year escalation at ~25%/yr in the prices of our two universal resources, food and fuel, a little suspicious? I think what you're predicting already happened, didn't it?
Humans do tend to reason cause and effect as determined by what news stories are popular... but why would this most extraordinary event demonstrating that earth was in fact lagging in producing supplies for our growing demands not being inquired about? I offered a model in Profiting from Scarcity for why people are missing it, that it's profitable to miss it. That seems consistent with the rest of the discussion here on the the whole resource bind, and EROI traps, and why so much of our whole technological society seems blissfully unaware of them even as issues, let alone things to act on.
I see your intention Ugo of finding a simple way to explain to a politician what to some may seem a difficult topic to grasp in a brief period of time. However, politicans pivot to the whim of their constituency and not to anything else. Peak oil, as real as it is geologically, with implications across the economic spectrum, is only going to be important to a politician once the masses are engrossed by the topic. Once that happens you'll be able to explain it to a politican in great detail and he'll get every drop of it. Of course it may be too late then, but anyway.
Like my Father who was born in 1927 says, "Developing situations always have to reach a crisis before anything is done about it." And peak oil is a developing situation, much like the increasing temperature of the water in a pot with a frog in it. I guess the question is: Collectively, are Humans smarter than frogs? I suppose time will tell, but in the meantime simpler explanations of peak oil will achieve nothing more than more involved explanations. Either someone is motivated to understand or they are not. Motivating someone is much more difficult than explaining something. So maybe we should be discussing how to motivate politicans to discipline themselves to understand peak oil.
Well, Cslater, what I said, actually, is that it is hopeless to try to explain certain matters to politicians. The model I have developed is more for the intelligent person willing to learn. Sometimes, these people are put off by the impression they have that the Hubbert curve is arbitrary. Unfortunately, anyway, your father is perfectly right: nothing wiul be done until it is - probably - too late
Crude price as predator? Posters as prey?
That find took extra high cognitive skills! Awesome! Hah!
Thank you. Your kind words are appreciated at a veritable asymptote of gratitude.
Interesting graph!
What is the base that the percent refers to on the vertical axis-population American, all isp addresses,etc?
Re: "He said that complex problems can always be broken into mind-sized blocks, and so can be grasped by the human mind."
This is a very important concept that is often ignored by those following Peak Oil IMO. It is the reason there are so many doomers among us. If a difficult problem is attacked all at once as a whole it overwhelms. The key is to break it down into manageable pieces that can be worked on.
We do not have to solve the world's energy crisis in one fell swoop or alone. We just need to work on our piece of it. Others can work on their piece as they see fit or as they are forced to deal with it by circumstances.
And we do not have to solve our individual energy problem all at once. We just need figure out a part of it as it presents itself.
Slowly, overtime as we deal with our own piece and others work on their piece, the Peak Oil dilemma will resolve itself. The outcome is unclear, but life goes on. The clock does not stop even for Peak Oil and that is why I am not a doomer.
I think this is one of the statements that sounds reasonable only because there's an unstated assumption in there. If almost everyone were working on a real problem in the world (one of which being energy issues), then I'd be quite confident that a BAU solution could be engineered. However, there's a huge number of people who take the view "there are some super-smart other people who will work on the incredibly hard and effectively on the technological aspects of the problem (even if they're mind sized), whilst my part is to trade stocks, or write op-ed pieces, or lobby for my favourite subsidy, or build a real estate empire, etc, etc." There's a great tendency to convince oneself one's issues are part of the solutions to small problems that make up the bigger problems, rather than at best tangential to it.
I tend to count myself as a "big changes" guy rather than a "doomer", but whether there's a distinction probably depends somewhat upon your point of view about what's desirable in life. I take this view partly because almost everyone expects other people to display ingenuity and solve the hard, relevant stuff in solving the big problems; if more people were actually involved in attempting to come up with solutions to "mind-sized" problems I'd actually be quite optimistic.
For a post that I started off agreeing with, I don't think I have ever made a quicker about face. I am a doomer pure and simple and primarily because most people are like X or Embryonic. That is, they see "solutions" for every problem, if only we would just put our shoulders to the problems that face the world and fix every one of them, or most of them at least.
Sevareid's Law: The chief cause of problems is solutions.
We had a world food problem. We solved it with the aid of irrigation and the Green Revolution. Irrigation has caused the world's water tables to drop by meters per year in many areas of India and China, and feet per year in most other areas of the world. Irrigation, to help cotton growers in the Former Soviet Union, caused the destruction of the Aral sea and the fishing industry there. Hundreds of thousands were displaced because their livelihood disappeared as the Aral Sea dried up.
The same can be said about Lake Chad. It is almost completely gone now along with the populations it supported. Rivers are drying up everywhere in China. Indian farmers are committing suicide because they cannot support their family when their irrigation water disappeared.
The Green Revolution has allowed our population to more than double in the last half century. More agricultural products required more water, more pesticides, more fertilizer and more fossil fuels to grow and transport it. Those extra people are drawing down the world's resources at an alarming rate. Because of the Green Revolution, at least three billion more will die when the crash finally does come. Because the Green Revolution feeds people, not animals, and because people take habitat from other animals, most of the world’s mega fauna will become extinct before and during the crash.
If we all put our shoulders to the grindstone and help solve this energy problem, we may put off TEOWAWKI for another fifty years. By then we could add another three billion to the world's human population and kill off what remains of the world's animal kingdom. That way, many more billions of humans could suffer miserably and die when the crash inevitably does come.
Ron P.
Hubbert on the Hubbert Curve, according to Ivanhoe.
--------------------------------------------------------------Quoting Hubbert:
“The curve does not keep going up, but passes over a hump and then goes back to zero. This is the one
future point on the curve that you definitely know and it greatly facilitates the mathematics. The area
under the (production) curve is graphically proportional to the amount of development. The area under
the curve cannot exceed your estimate. It is a very simple, but very powerful method of analysis.”1 “This
complete cycle has only the following essential properties: The production rate begins at zero, increases
exponentially during the early period of development, and then slows down, passes through one or more
principal maxima, and finally declines negative exponentially to zero. There is no necessity that the
curve P as a function of t, have a single maximum or that it be symmetrical. In fact, the smaller the region,
the more irregular in shape is the curve likely to be. On the other hand, for large areas such as the United
States or the world, the annual production curve results from the superposition of the production from
thousands of separate fields. In such cases, the irregularities of small areas tend to cancel one another and
the composite curve becomes a smooth curve with only a single practical maximum. However, there is no
theoretical necessity that this curve by symmetrical. Whether it is or is not will have to be determined by
the data themselves.”2
http://hubbert.mines.edu/news/Ivanhoe_97-1.pdf
Yes that is the real world, I think Hubbert actually made a mistake by drawing symmetrical bell curves on his diagrams, people look at pictures and gloss over the words - the only thing he got correct was the timing of the US peak, the important bit, the actual flow rates at peak, were way out. By claiming Hubbert knew what the future would be (when we all know that nobody does) does the peak oil story little favours IMO.
Our politicians, given presentations on Peak Oil, assume that any peak when it comes will be symmetrical. But for importing countries that will not be true because of ELM, the recent use of techniques that deplete the oil wells faster in the second half of world oil etc.
Since demand and supply are equal I think politicians might understand PO better by talking about it from the simpler consumer's point of view, not the producer's, also we are actually able to use real world historical data now that shows we are several years past peak - stop being theoretical, use the data.
Not too long ago, I took some of Hubbert's curves where he "predicted" when the peak would occur. His assumptions about the production growth in his graphics suggested that the "halfway point" in his summetrical curves would be reached about the year 2000.
If you look carefully, you will see that his estimates for the rate of production growth of oil (not all liquids as is often reported by the media) reached a peak of nearly 45 GB per year. We have never come close to that. That lower production rate extends the time before the "halfway point" is reached. But, in terms of the area under the curve, which is what he was really stressing at the end of the day, we are currently traversing through those volumes NOW when he estimated the peak would occur. Furthermore, with the exponential growth (and the amount of time you spend near the peak before decay), being off by 100-200 GB does not really buy very much time.
If you are way off (say 2-6 trillion barrels) AND all that oil you did not know was there was of the same quality and extractability as the first trillion barrels, then and only then could one guess that peak might be a bit of a ways off (but exponential growth shortens that dramatically). There is no empirical data that suggests the Jed Clampett is going to shoot his way into the next megafield.
Hubbert had a true scientific mind. He was well aware of his predictive limitations. According to the late L. F. Buz Ivanhoe (personal communication), Hubbert made no true predictions for world peak oil. He did make projections using assumptions for total endowment - the commonly used 2 Trillion barrel estimate for example. He was pressured for predictions from various publications, including Scientific American, which may have led to misinterpretations. His US prediction was for the lower 48 states and included no estimate for Alaska or Federal water. Michael C. Lynch has expressed differing views - both on the USENET during the 90's and more recently on Yahoo energyresources and elsewhere.
Well peak capacity ala peak cheap oil was pretty much right on target around 2000.
Production numbers or total production estimates much after 2003 when wall the space capacity was brought online are dubious at best flagrant lies at worst.
In any case because of spare capacity issues peak oil production and the true peak are not simultaneous. For global production I like to think of it as a peak band extending from 1995 to 2005 where productive capacity ability to expand production and actual production changed overtime. Somewhere in this band was a maximum in total possible production without good numbers 2000 is as good a guess as any. And given that regardless of the model one would expect both the decline or increasing rate on both sides of peak to be small the actual peak year is not all that important.
Next because of the existance of both spare capacity and also production that could readily be brought online within a 2-3 years or so via infield drilling or acceleration of the development of known fields. One would expect the true peak to be more like a lambs shift and occur when prices reach their minima not maxima since this represent fairly well the maximum capacity which is whats important when production capacity is higher than the production rate.
Of course prices have inflation etc issues but looking here.
http://inflationdata.com/inflation/images/char/Oil/Inflation_Adj_Oil_Pri...
Oil prices bottomed in about 1998 well inline with peak being about that time.
Thus its fairly safe to put peak oil at 1998-2000.
Now actual production will continue to rise after the real peak but this is just eroding spare capacity and near term capacity as current production declines. The final maximum in production is significantly lower than what could have been obtained at peak. Probably to the tune of 10-20mbd lower.
If we had actually produced at the oil when we hit peak I suspect most people would agree we would have been closer to 90mbd or even 100mbd. If you dig just a bit you will realize the present production level is much lower then what we could have hit in the 1990 and early 2000 if demand existed.
Its not hard to deduce that peak oil is well in the past if you just look.
It was hidden somewhat by spare capacity issues and above ground demand but its fairly obviously there. Later sharp price increases with marginal production increases should make it obvious that we had already passed peak oil at that point.
Now this does not tell us what future production is going to look like both the shark fin model and a smeared long peak from a symmetric model coupled with production below capacity at peak give about the same answers for the initial production post peak as both produce a plateau. Its only when you come off the plateau that they being to diverge. Regardless both models are centered well back in the past sometime between 1997 and 2000 the common symmetric peak models presented on the oil drum with peak around now are simply wrong.
Most of those are contaminated by seriously incorrect additions to total URR made in the late 1980's to 1990's. This rubbish makes everything look good and self consistent but its just a case of GIGO.
Now the reasons that URR claims expanded had to do with better technology yet this actually suggests that the shark fin model is the correct one as both discovery rates and production rates where accelerated over time.
In any case one has to look beyond raw production and URR data to deduce what the post peak production curve might look like. Indeed we have other data in the form of price and demand that help us guess the curve.
First in the symetric case with excess production one could easily assume that it would become somewhat asymmetric as prices increased and that either way production decline would be gradual. The price curve from this sort of production model would be a slow linear increase in price. With long plateau or shallow stair steps perhaps. No spike in prices is predicted or warranted.
On the demand side simple conservation as the price increases is more than enough to balance supply and demand or even cause a surplus leading to falling prices. In general conservation should be able to handle a fairly static oil supply with ease for many years. No spikes and no reason for spikes even in our ponzi scheme economy as it would be unable to really diverge for long from intrinsic oil production levels. You get a sort of bumpy plateau or sort of long linear increase. Now of course we have a ponzi scheme economy so you get bubbles in other areas such as technology or housing but oil prices would not really follow these bubbles outside of inflation effects. Once inflation is removed the prices would be flat. And thats really about it decline rates are low and conservation efforts and recessions should eventually result in the economy having plenty of time to adjust to constrained oil supplies and they don't change much i.e 2-3% at most per year.
Now on to the fast collapse model since its identical with the peak/capacity model up through when production starts to collapse they are the same. However they do differ significantly once production collapse starts. And right here its import to note that the collapse is effectively synchronous occuring pretty much the same worldwide. I'll come back to that.
However the economics of fast collapse are quite different since you have to blow the bubble bigger and faster as collapse starts. Assuming oil production started to collapse back about 2003 then you get good aggrement with the bubble and in fact you use the onset of the last bubble to determine the start of collapse as price is part of the signal. Both the last bubble and sharply rising oil prices happen at the same time and signal oil production has started to acclerate its decline rate.
In retrospect I realized that this would also result in a sort of first peak in prices this occurs right before the ponzi economy goes through and initial collapse in part because of high oil prices in part from simply being driven to hard. In any case the base model predicts a price spike up the front side with no reason for it to decrease while the addition of a ponzi scheme causes collapse or a true spike.
However given oil production is rapidly falling the period where production exceeds demand is very short and prices will quickly begin rising in our case only six months passed.
The importance of the spike is not so much in its timing and occurence as it in my opinion a signal of fast decline or shark fin collapse.
And next the beauty of the model is it predicts collapse is synchronous i.e if you read my hunter post with collapse starts its across all regions. This is important since about 45% of the world oil is produced from oil super giant fields if you get a single well documented case of one giant collapsing it means all of them are collapsing within a year or so. For the pure model its simultaneous real world will give a bit of fuzz. Now the reason this is cool is we have a well documented collapse case in the form of Canterell we don't need any other information for this model. We have the spike ponzi blowup and a giant collapse thats all thats needed to prove the model. The next prediction is a rapid return to high prices quickly reaching and surpassing the previous peak. As the global economy simply does not have much bubble left to pop you don't get the sharp declines. Production is falling fast enough that conservation can also do little to ameliorate prices. If it could have then you would not have quickly returned to rising prices in the first place after collapse. And you would not have gotten a spike or been on this curve etc.
Mini pops are possible but given the big one only dropped prices for six months later pops will be less effective say a three month pull back then none. So at best you might see a peak prices pull back for say three months then go to new highs. After this the timing is so short that its lost in random market noise.
But your in general looking at new highs every 3-4 months or so until final economic collapse.
Given the speed of fast collapse which I've put at 8-12mbd or so lost annually for the only remaining prediction of the model to come true we need to beat the 2008 high within the next six months. By then decreased demand can no longer cover falling production. If not then I've got the model wrong and will just have to wait to figure out the real one however the other choice is symmetric but then the price spike has to be almost purely a financial phenomena having nothing to do with fundamentals. Thats actually the claim but I really don't buy it. I might just have to accept it one day but its still very troublesome.
But we can and will bubble any market so perhaps a way to bubble oil was found and exploited on top of the general financial bubble. However again no way oil prices would have bounced back given that they would have been in the toilet for years after the initial collapse not only would the financial bubble be blown but real demand is lower. Its absolutely impossible to reinflate. Heck look at the housing bubble and a massive government intervention has only resulted in a brief pause in the slide. No way crafty traders can jump back in and pump oil esp with the physical glut.
Now before talking about production claims after about 2000 there is another and more troublesome issue which is rising tanker rates. I'd argue that these are at first glance damming evidence that the model is wrong and really sink it. Initially I believed the rising production numbers because they were consistent with rising tanker rates which where consistent with other shipping rates.
The key to understanding what happened in shipping actually lies in the fact that shipping rates where going up across the board for all types not just tankers and the big driver was rapidly rising bunker fuel prices not demand.
So the basic behavior is to practice whats called slow steaming once your on contract you conserve as much fuel as possible to maximize profits. Next you almost certainly make use of the futures markets to fix fuel costs. As further bunker prices increase your insulated in your hedge window making even more money. Indeed if rates don't increase fast enough you actually make more money not excepting any cargo and just collecting your winnings in the futures market.
Airlines played a very similar game with a vengeance till it blew up. I suspect it was being played across all transport networks. Conserve fuel to the point of refusing contracts and collecting money from the futures market.
Obviously this means a lot of the sharp increases in transportation costs had nothing to do with increases in shipping volumes indeed it leads to people excepting full price to even ship on a partially loaded ship both oil and container ships. So not only is shipping supply being artificially withheld in many cases because of the delay the ships when they finally sailed did not sail with a full load. In some cases certainly full or even overloaded.
Now on to oil tankers specifically there is another important factor as oil supplies fall and local storage gets depleted you move to the final product market to bolster your own production in the cases of countries without refining capacity you by a cargo on the spot market regardless of where it is in the world paying the cost. And again in all cases even accepting partial loading to get something.
So for tankers this means more tankers where cleaned and moved into the final product shipping market and out of crude. In general instead of shipping crude to its destination and the products getting refined and distributed internally via pipeline rail or truck you had the crude shipped to a refinery and a good bit of the product loaded onto another tanker and shipped elswhere in the world.
Worst case you needed twice as many tankers as before one to ship to the refinery and one to ship refined product. And of course cleaning tankers is non trivial so you have added delay from the cleaning process. Desperate customers paid and paid and paid so who cares.
Next for the US Mexico production was declining and the US was chartering tankers with significantly longer transit times from Africa or the middle east so again you have yet one more factor leading towards higher rates without increased production.
And last but not least you also have a mandated move to double hull tankers with single hull tankers being phased out along many trade routes. This not only leads to competition for double hulls but also for single hull tankers accepting circuitous routes as long as the customer paid. Throw in a healthy dose of slow steaming and all is well.
What all this really describes is your typical cluster traffic jam like situation when you have desperate customers. As long as they pay the actually efficiency of transport declines dramatically its just a shell game and under the covers the total volume of raw crude actually delivered can decline dramatically before it collapses.
In fact the sharp collapse in shipping rates following the collapse of the ponzi scheme economy indicates that the cluster f@c!k model for global shipping during the period of rapid price increases is valid. Otherwise as oil prices started increasing spurring further increases in oil production rates would have rapidly rebounded. Also of course single hull tankers are being scrapped and as new ships are brought on the least efficient fleet members can be used as floating storage. Reasonably credible reports of significant floating storage should have also put a hard floor under rates.
As and example in housing you had bidding wars driving up prices for houses even as there was and obvious supply glut and more on the horizon. The frenzy lasts well past when the market has obviously turned as long as the frenzy itself is able to disrupt the efficiency of the system and make it inefficient.
And last but not least using tankers for floating storage maybe sailing slowly also removed supply.
Overall there are a number of very valid reasons to see how tanker rates can increase even as supplies fell.
The last question and most troublesome one lies with absolute tanker counts coming out of the Persian Gulf. At this end a few things become important.
One is of course here.
http://www.country-data.com/cgi-bin/query/r-11616.html
KSA has its own extensive tanker fleet. Next of course ships ship weight not volume lower crude grades are significantly heavier than the lights grade so the volume drops as the oil gets heavier.
Next as far as I can tell the heavier NGL's are shipped in either tankers similar to oil or the same as oil tankers. I'm researching the topic but also it seems they can be added to crude as a diluent for pipeline shipping although I have no information of this process is used for ships. I have a open question as to how NGL's are shipped. This is important because to date I have no reason to not believe NGL production has not been steadily increasing and it should esp in the ME as gas caps are blown down on dead fields.
Its far from clear if tanker counting takes into account the nature of the cargo and quality of oil and even loading level. Changes in these variables can lead to a significant deviation in the volume of real crude oil shipped.
And of course many of these countries don't have enough refining capacity and export land model is in full force leading to increased product inflows even if outgoing tanker traffic is increasing. The net is declining from export land.
Regardless at the end of the day even with all of this I'm left looking at KSA's tanker fleet and concluding that if the Shark Fin model is correct and my timing is correct then to finally bring the entire past to closure there must have been some significant amount of subtrefuge with one big tanker owner and big oil exporter that happened to be a big tanker owner.
Indeed in the end for my model to be correct on top of everything else someone had to play a very blatant game with the tanker trackers sending out partially loaded or even tankers full of seawater and setting low in the water to fake oil shipments. No matter how I run the numbers I feel like some fake shipments must be needed to bring everything into line.
This shocking conclusion also has a interesting result if your running a lot of fake oil shipments then if the price collapses you can cut these back and "drop production". I came to this conclusion that not all the traffic coming out of the gulf could be real back in 2008 the KSA lead cutback simply reinforces this conclusion since in my model they would have no way to cut back much less increase.
Now what really interesting is we have had reports surface that Ghawar had already declined in production by up to 2mbd several years ago I believe it was 2006 or so.
In any case whats striking is my model actually suggests that these are true and Ghawar has already suffered a significant decline. TSHTF if you will and in a sense we missed it of course 140 dollar a barrel oil does not seem to be enough to convince people something is seriously wrong so ...
In any case by adding the assumption that Ghawar has already declined significantly and that KSA is actually playing games with tankers I can get everything to fit. As and aside they also probably are seriously abusing export land by claiming a 3.5% increase in internal consumption this is fairly increadible and not even close to other documented increases in consumption regardless of the price of oil. Nigeria for example does not come close and it should at least be similar for price driven export land.
But games where played.
http://www.thefreelibrary.com/NIGERIA+-+The+Local+Oil+Market.-a0166943581
In any case rising imports into KSA maybe even hidden to some extent in partially loaded tankers could also work to cover the real situation. Indeed the simplest way to play the game is to send the tanker out fully loaded then either just offload say in the Red Sea and run the pipeline in reverse periodically. Needless to say plenty of ways to play a shell game are possible.
And last but not least this is pretty damming of course technically is a huge issue how on earth did they pull it off ?
Well with all lies it probably started small and grew overtime into a whopper however the real problem is the EIA effectively went along with the ruse probably initially because they don't have any way to check data so at first it was a GIGO problem however at some point given what I'm claiming it simply became to large to hide we are talking about 2mbd at least of fake traffic if not more. Sooner or later you can't hide it.
Now lets just guess that the EIA caught on and confronted KSA infact GWB would have flown down personally to discuss the issue with his pal the king. Now however you have a very interesting situation. If KSA comes clean and tells the world its been lying its ass off and its real production is significantly less the EIA and US look like fools and the world goes crazy esp with oil at 140 a barrel. There are weapons of mass destruction in the ME but not in Iraq they are in KSA.
Now of course the US is pissed and forces KSA to empty its strategic product storage and send it all to the US along with effectively paying tribute from here on out. The US has no choice but to pull the plug on the global economy setting of a collapse that almost got out of control as it screwed Bear Stearns and Lehman both deeply involved in the oil trade. The real insiders knowing the true game took advantage of this and the hurricanes messing up gulf imports to amass a huge floating storage position of real oil and start a oil bank. The US continued to muscle the futures markets and probably started serious interventions via massive cash infusions to allow certain ahem (GS) players to rig the stock and oil markets.
Despite all of this the oil prices still started increasing steadily quickly after the big one as the basic model predicts. No of course we are looking at another price spike. A faux economic recovery has been blatantly rigged to blame rising prices on recovery and the stopping of fake oil shippments provided cover for OPEC cutbacks. This works so well its hard to believe that the US and KSA did not work on this together. Thats not to say some muscle is not being used but even though the EIA may have been duped its not clear if the CIA or other agencies and higher powers don't know the truth.
It does not matter since pulling the plug did not work the collapse is simply to fast further spin is not going to do much good. This suggest of course that a new game will eventually have to be played fairly soon. Four obvious ones that are brewing are all wars either in Nigeria, Mexico, Venezuela or Iran.
Thus if the model is right one can suspect that this time around shortly after oil makes new highs war will break out effecting a significant oil exporting nation. Which one is probably not known yet the US is in position to handle war in all but Nigeria which would probably involve the EU.
So if you read down to here and don't have your tinfoil hat on thats your problem :) Whats interesting is the only physical lie needed is KSA playing tanker games then everything else works.
The hunter function is at most a perturbation on the search function. Once you isolated a find, a local transfer function takes over. Whether you want to call this hunting or reserve growth or extraction rate, it doesn't matter.
We may make the same argument to different ways in the same thread :)
Thats rather my point is it just or at most a perturbation ?
This is the problem my own research tends to indicate its not just a perurbation but of the same magnitude as the search function ala traditional hunter/prey Lotka-Volterra model.
Right now most of the worlds oil is produced from reseviors discovered decaded ago and worked and reworked with many different technologies esp horizontal drilling how much does the date of original discovery really mean when dubious backdated reserve expansion make up 70% of the worlds remaining oil and extensive field rework with advanced technology most of its production ?
It seems to me that dispersive discovery can eventually be swamped out by second order hunter effects if they are large enough.
Thats both and assertion since obviously it can happen and a question did it happen ?
If so can we tell ?
The rather obvious change in slope of the production curve under the popcorn thread indicates yes something happened and it was big and similar in magnitude to dispersive discovery.
Technology is the rather obvious one. It seems strange that the Oil industry like the rest of the world can make rapid technological advances after the 1980's yet oil production remain close to that predicted by dispersive discovery. Only backdating of reserve estimates causes this without them or if they have large errors you get a very different answer.
And honestly I'm mulling the issue since I think I'm right but yet I'm at a loss as to and easy way to make the case.
1.) Dispersive Discovery is the correct base model.
2.) The shock extension is correct.
3.) Reserve additions should be questioned
4.) The technology shock is missing almost certainly large and may not be a simple perturbation.
5.) Technology changes effects reserve estimates.
6.) Backdated reserve estimates bloat the dispersive search curve
7.) Goto 3
8.) Maybe the real answer is a higher order mix of LV and Dispersion but how ?
Eight can be generalized to when is a shock not a shock but fundamentally altering both the overall production and the search itself ?
I don't see and elegant answer it seems adhoc and that goes back to the reason perturbation theory sucks it can't tell you when its wrong.
Laminar vs Turbulent flow. Low speed sonics vs compression effects as you approach the speed of sound. Explosion vs burning etc etc etc. This is a common problem and not one easily solved theoretically.
http://en.wikipedia.org/wiki/Reynolds_number#Transition_Reynolds_number
This is and experimental number calculating the correct transitional Reynolds number is a feat theoretically.
My opinion is that somehow this gnarly problem may well be readily solvable with the way the shock model and dispersive discovery works.
Just because I don't yet understand how does not mean I'm not very interested since I think the kernel is there and right now my best guess is multiple dispersions i.e the shocks are themselves dispersive. This same trick is how they solved quantum field theory from quantum mechanics. When in doubt make everything a wave.
For the Shock model my hunch is all shocks can be decomposed into dispersive like models and you have dispersive discovery and dispersive shocks.
The neat thing is this seems to allow feedback loops to be modeled.
In some cases its better to consider them as negative dispersion or concentrators. So in general its concentrators and dispersion.
I still need to play with the math. Above ground factors i.e maybe losing my job have forced me to postpone the research. It really sucks since I wanted to dig in right now. However I still need to work :(
In the interm my question is if you can show the shock modeled with the shocks converted to dispersive/concentrator like form just like the search model if so then they need not be pertubations and can be of any magnitude.
And then you have a very strong model that can cleanly work across boundary crossings.
If so I bet you money it also works as and elegant solution to laminar vs turbulent flow and naturally drops out the transitional reynolds numbers :)
My gut says you have a super fundamental model just needs a tad bit of tweaking.
Thats the approach I want to pursue but yet again real life has intervened.
I need to become independently wealthy dammit :)
I bet your issue is that you can't seem to grok the idea that perturbation shocks don't travel backward in time and affect the discovery profile. I reconcile this by the premise that the discovery is a given and it will go on regardless of what kind of socio-economic and geo-political shocks may occur. This discovery essentially goes on because technology advances have always moved forward, and activities such as computer imaging didn't stop during the 80's (a previous shock-filled period) and actually made significant advances. However, it was very easy for the producers to turn off the tap.
I have absolutely no problems with reserve growth in these models; this is just a form of maturation as the "hunters" figure out exactly how much is in the reservoir.
I have absolutely no problems with reserve growth in these models; this is just a form of maturation as the "hunters" figure out exactly how much is in the reservoir.
Thats where we differ as far as I can tell its a simple problem of double counting not new reserves. Well maybe not that simple since it involves including more and more of the remaining better defined OIP as reserves when they are not really extractable at flow rates close to todays if at all.
As a simple example the recovery factor has stayed relatively constant i.e about 30% while in general URR has increased over time by about 50%.
Correct discovery factors are actually getting closer to 50% from 30%.
However about 80% of this additional recovery is at low flow rates.
Ignoring that technical advances have at best added 10% to URR accessible at high flow rates despite the healthy increase in claimed URR.
No for that 10% its not clear at all if its not just simply causing the production profile to become asymmetric and halving the production rate for the 80% of slow to produce oil.
As and example with horizontal drilling into a thin layer of oil you get this 10% high flow rate oil but once your done and convert to stripper well extraction your stripper wells produce at half or worse than if you had not used a horizontal well. You have very effectively sucked most of the oil out of the fat tail.
What should be happening right now is as horizontal wells water out the fields actually become uneconomic to produce i.e you never actually recover the remaining oil. Most of the URR expansion is written off and you end up really only getting the 10% more and most of that was not really new oil.
Technically your way overestimating the total recovery from horizontal drilling probably because your underestimating when the well will water out.
And these URR additions are very technical/money constructs not really based on the reserves in the field but based on the profitability of recovery using known technology.
As long as its profitable the fact you really blew it on the backside is not all that important at least to the oil industry as long as you can keep drilling new horizontal well with inflated recovery.
This reserve growth is very similar to the concept that a rolling loan gathers no loss. As long as you can make new inflated claims they cover the eventual write down of the original claim. In fact the oil companies in general do this and keep claimed reserves relatively constant.
Its only as you run out of places to drill and attach fraudulent reserve claims that the truth begins to surface.
Then you switch to BOE as a metric and hide the oil situation in your NG wells.
Here is one SPE paper.
http://www.spe.org/atce/2008/technical/schedule/documents/spe116263.pdf
What I'd like to point out is that this well is already running a 50% water cut and most likely will soon suffer major failure. Its 1000 bpd. I suspect using it as and example that it will either be abandoned or reworked withing two years yet I also suspect that its booked to be a five or ten year lifetime well with a almost constant 1000bpd production rate to the end.
The problem is that when this well does not live up to expectations that don't remove the reserve estimate its rolled forward and mixed in with new horizontal wells or simple left on the books and the well is assumed to be repairable to fix the water break through.
In general instead of smoothly extracting the thin column of remaining oil booked as reserves what happens in the real world is these wells suffer serious water or gas problems earlier than predicted and die sooner then expected.
They quickly become one major challenge after another but the reserve estimates are never revised to reflect the real situation. As I said as often as not a new horizontal well is sunk with high hopes its going to perform as expected.
Read this.
http://www.joshitech.com/spe83621.pdf
In particular note they book larger reserves if they use horizontal wells.
Water break through and the various complex problems of older horizontal wells are treated as solvable technical issues that don't effect the reserve estimates. But regardless real production rates decline more rapidly than expected.
x -- perhaps a mistake but as his words say he wasn't predicting the shape of the downward curve. But if he had I would bet you lunch he would have stretched production much farther into the future then we've seen (ignoring above ground factors, of course). While he had a geologic based limitation on the rate and size of new discoveries he would have no hint of the vast improvements in recovery and production rates in the future. Consider horizontal drilling as an example. These wells can deplete a new discovery in at least half the time of vertical well. And perhaps much faster. While it's also true there have been big adavances in secondary recovery since Hubbert's time these techs improve recovery rates but don't add proportionally to the production rates.
Not really fair to put words into Hubbert's mouth but I bet if he could see the tech advances since his time he would have predicted a faster downslope pace.
Xeroid,
As you probably can guess, this is how I feel and why the Energy Export Databrowser looks the way it does.
At one point about a year ago I wrote some routines to allow one to select a region of data from a production curve and then perform a Hubbert Linearization based on the selected points. I was hoping to put up another Hubbert Linearization plot type in the databrowser that I hoped might have some predictive value.
What I found was very discouraging.
By hindcasting, using historical data to predict current production levels, I was able to test the accuracy of the HL fits in various countries. If you include real error bars on the predicted line (I'm using the statistical package R) you end up in many cases with huge uncertainties -- sometimes ranging from zero to infinite growth!
There are only a couple of cases where the fit comes close to matching -- the US and Norway being the prime examples.
The rest of the fitted curves were either way off the mark, had huge error bars or were ridiculously dependent on cherry picking the right data points for input. So I shelved that project. HL theory is nice but it is only a theory. The real world is dominated by historical events like economic growth, wars, natural disasters, drilling technology, etc.
The plots in the databrowser attempt to present the current situation in easily understandable graphs that capture the historical evolution without requiring users to buy into any theory.
People are good at recognizing patterns but poor at understanding theories. If want to convince the non-engineers out there I suggest we make it easy for them to look at the data and reach their own conclusions.
-- Jon
IMO, the HL method gives us a decent estimate for the URR from mature basins. I used it in early 2006 to warn of an impending problem with net oil exports, focusing on the top three net oil exporters.
In January, 2006, I thought that Norway would continue to show declining production; no surprise there (although I think that CERA and the EIA disagreed, and as someone else noted, if they can't get the North Sea right, why would we expect them to get more complex regions right, but I digress). After conferring with Sam, I thought that Russia would resume its production decline within one to two years and I thought that Saudi Arabia was on the verge of a production decline. The Russian data presents some problems, which we addressed by using the production data through about 1984 to forecast future production. Note that from 2002 to 2005, combined Saudi and Russian total liquids production had increased at an annual rate of change of +8.1%/year, with net oil exports showing a +8.9%/year rate of change (EIA).
In any case, here is what the EIA subsequently showed for the (2005) top three net oil exporters, relative to recent production peaks, which may or may not be final production peaks:
Saudi Arabia (2005-2008)
-1.0%/year (Prod.) & -2.7%/year (Net Oil Exports)
Con: +6.4%/year
Russia (2007-2008)
-0.9%year (Prod.) & -2.4%/year (Net Oil Exports)
Con: +2.8%/year
Norway (2001-2008)
-4.7%/year (Prod.) & -5.1%/year (Net Oil Exports)
Con: +0.2%/year
As implied above, the wild card is production from immature basins, and this is especially a factor in Russia, but I suspect that the Russian frontier basins are to Russia as Alaska is to the US, i.e., helpful, but no panacea.
More is Less (after you have passed the peak)
The other day we were discussing the Kern River oil field (in the USA) because it was used as a poster child example by a Scientific American author (October 2009 issue) to demonstrate that more and more oil can be squeezed out of the ground by deploying ever more efficient extraction techniques.
But then came the non-intuitive consequence that success breeds its own failure as seen by the purple curve in Gail's earlier post re Kern River:
Note from the graph below that Kern is past peak and creeping ever higher on the water cut numbers. More wells and yet less and less production.
They keep adding more wells (purple) per free market theory and yet total production declines.
Oh yea market forces, why hath thou forsaken us?
Kern river is definitely reaching the end of its oil. There are smaller and smaller bypassed pockets left. At some point, economics will dictate the end of production (but the cost of sealing all of the wells may put the end off further into the future than logic might suggest). Then production is likely to drop off a cliff.
Gail,
Have you seen the article in the October 2009 issue of Scientific American?
What is you take on it?
Has Sci_Am flipped to the unscientific dark side?
By using the Prony method, these bell shaped curves can be decomposed into either 2 or 3 exponentials. If two, one decays from the top and one decays from the bottom. If a proper definition of the exponentials can be made, I believe the bell curve could be constructed.
This is very true. You can construct the logistic sigmoid exactly by piecing together a set of truncated exponential curves. This is the basis of the dispersive discovery model.
LOL! My first thought when looking at the graphic before I read the post (and also before I had my first cup of coffee) was that this was going to be about The Chinese take on Peak Oil and Hubbert's Curve, I thought those cows were Chinese pictograms...
I also have this image lodged in my brain of a vicious salivating Tyrannosaur, labeled "GDP Predator" chasing down, terrified, little green energy bunnies, labeled "Energy Prey"
Thanks Ugo! :-)
Ugo,
In my "mind's eye" view, the Lotka-Volterra explanation has several problems that preclude its use for truly understanding what is going on.
1. It is a carrying capacity model. What it calculates is not a cumulative but a steady-state or dynamic "population" or "production" level. The concept of ultimate non-renewable resources does not exist.
2. Following from the first point, most of the interesting solutions to L-V models will oscillate over the course of time. The graphs shown are conveniently truncated before the curves will again begin to bend up. This of course allows the L-V models to match reproducing entities such as whales better. Perhaps an extinction event will take place but that is not found in the results; you will see that the "prey" values never reach zero and that is why the solution oscillates.
3. Look at the order of discoveries and wildcats and you realize that the discoveries are not "stimulated" by anything. Discoveries appear to be non-causal and come about about as divine intervention. Yet, since the Lottka-Volterra uses the concept of reproduction as a chaotic stimulator, you realize that it is not really demonstrating anything but exponential population growth on the up-swing. This again breaks the minds-eye view because most people can't visualize discoveries as reproductive entities.
4. The equations are deterministic. In the real-world, random stochastic effects have a bigger impact on what we see. Moreover, the deterministic coefficients have very little meaning in terms of real-world measures. The big problem is that the area underneath the curve has no relation to any kind of URR and can vary depending on the prey capture rates! More realistic is that we will see easier and harder-to-extract resources that smear the curves over time but that do lead to a distinct URR (and that does not depend on the vagaries of non-linear deterministic equations).
In general it is tempting to go down this path of using non-linear Lotka-Volterra equations, but it will just make everyone more confused in the end. They don't see the non-renewable aspect and they may actually think that the resource levels will recover! Don't laugh about that last point. I can imagine some abiotic fool taking these equations and proving that we can enter some self-sustainable regime. Or the cornucopians can at least twist the results and make you look bad -- example: "At least we realize that the resources are constrained but the Lotka-nistas believe it will recover and last forever!"
I think there is more that I could criticize, but since it comes from an initially flawed premise, there is no reason to pursue it much further. At best, it is an interesting exercise into understanding population dynamics.
Sorry to sound a bit of a downer, but I would like to see this analysis done correctly so that we can practice some realistic depletion management in the future. I really believe we can do this analysis correctly from a solid foundation.
Let's go in order, WHT, but let me say from the beginning that you should give a look to our paper in "Energies" to understand how our model works. I think you read this post a little too fast and missed the main points.
1. "The concept of non renewable resources does not exist" in the LV model. True, but it is for this reason that we modified it to describe exactly that, non renewable resources, by assuming that the reproduction rate of rabbits is equal to zero. I think this is a very general model that in our times is more interesting than the original predator/prey model as it was conceived at the time of Lotka and Volterra
2. "most of the interesting solutions of the LV model will oscillate over time". A first answer is that, no, in the modified LV model there is no oscillation; in the long run foxes and rabbits go to zero and disappear forever. It is not because we truncated the calculation: it goes to zero and it stays there. A second order answer is that in "world models" oscillations have a very long period, as you can see by looking at the results of the scenarios of "The Limits to Growth". You see that many of their curves seem to be poised to restart, but they did truncate their calculation at the year 2100. In any case, such a range is enough for most of us, I think!
3. I am sorry, but I am not completely sure of what you mean, here. Maybe you could explain your point better? Anyway, in my interpretation, in order to discover something, you need resources (aka, money). In an oil company that money comes from the exploitation of previously discovered oil wells. So, there exist this capital/resources or predator/prey relationship. Or so I see things.
4. Yes, of course the equations give deterministic solutions. I played with stochastic models in a paper that I published a few years ago: the results are just the same, except that there is some "noise" in the curves. So, I think that it is easier to go with deterministic models. Of course, we must always remember that the simulated future is not the future; it is ONE future.
About your last comment, it is true that there will be always some idiot who misunderstands even the best work one can do. On the other hand, keeping silent will be worse :-)
OOK, I went and read through the paper and you have a point that didn't come through in the posting.
I had somewhat of a knee-jerk reaction based on my experiences with LV in the world of biology.
You state that "These assumptions can be stated in mathematical form as two coupled differential equations derived
from the Lotka–Volterra model." So you have two equations that you work with:
I assume that the prime tic indicates that these are both derivatives with respect to time.
With that premise, I agree that these equations are coupled.
They are so coupled in fact that we can rearrange them in terms of a single differential equation
All that this equation says is
(a) that there is a proportional draw-down of resources that starts out with a
fixed efficiency based on an initial capital outlay:
(b) multiplied by a growing proportional extraction rate based on cumulative resources turned into capital
(c) and then modulated by a exponentially damped "depreciation"
If it wasn't for the depreciation, the extraction would continue to infinity.
So in fact there is no ultimate recoverable resource and the downslope shape of the curve is purely governed by depreciation effects.
With that, let me go through my points again.
1. It is still a carrying capacity model. The peak and decline is only determined by the depreciation and how it overcomes and eventually damps out growth.
2. OK, it doesn't oscillate, it just damps out as the machinery of extraction gradually grinds to a halt due to people giving up due to some cost factor.
Yes it is a Lotka-Volterra model but with the usual reproduction stripped out.
3. No real temporally driven stimulus is included, apart from a delta-function at time t=0.
In other words, a capital outlay at year zero is the only stimulus in the model.
4. Randomness is not the same thing as noise. In this model everything is predetermined at year 0,
and the arc of the trajectory is set in stone from the coefficients selected initially.
That is the drawback of a deterministic causal model.
Realistically, varying rates of exploration and the effects of URR constraints will cause the
Hubbert curve to form a peak, both of which factors do not show up here.
I bet that if you changed the value of K2, you could get an effective URR that would vary by orders of magnitude.
We must have learned by now that oil extraction is more inelastic than that and we will spend anything to get at the oil;
something as simple as depreciation won't prove a huge obstacle.
Economists might appreciate the model, but not someone who is thinking about the fact that humans will
likely seek every method to drain the last possible drop of oil.
So, bottom-line, if you believe depreciation captures the URR, this model would be useful.
Its just that that is a very subjective premise.
I clearly have not gone through all the intricacies of the model as you have, Ugo, but I can keep up with the math,
so am very interested in how my view fits in with yours.
Yes, now we are getting to some common ground and we agree on the math. Then, it is true that this is a deterministic model. You see this as a defect, and I understand why. It depends, of course, on what you are trying to do with the model. As I said, this is a simple model that is mainly conceived as a way for human minds to grasp something that, otherwise, is a bit alien to most people. Then, what is the predictive value of the model? This I can't really estimate at the present stage. My feeling is that if you can fit TWO curves instead of one, as most models do (e.g. Hubbert linearization) then this model model is more robust and it might (just might) estimate URRs more reliably than other models. But the future is inherently uncertain. URRs are what we will decide URR will be. As I said in another comment, the models assume that humans are not smarter than bacteria. But, in reality, they are; at least a bit! So, we may decide to engage everything we have in extracting every drop of oil from the earth and that would change the model. That may be described adding other parameters or, for instance, modifying K2 as the model runs (I think this is what you mean). It is possible and I think it has value. My impression is that we badly need "mind sized" ways to understand this behavior. It is, eventually, the basic approach of system dynamics: deterministic model, but a range of them
Granted the LV model may help someone convince themselves that they understand what is ultimately happening, much like the Verhulst equation does. (This is a useful exercise to compare and contrast the differences between these two feedback models). Yet, I do think it is a dead-end way of pursuing the analysis. Let me explain why in terms of what we normally see for single reservoirs. As other commenters have pointed out elsewhere on this thread, the curves for a single reservoir are rarely symmetrical and in fact have a peak well towards the start of extraction.
This is a picture of the average depletion profile for a North Sea oil field. This data is available because the UK requires operators to release the data, BTW. Note that the average curve is asymmetric to the left. I don't thinks you can capture this shape with L-V, or can you? (do you switch the predator to being the prey?)

On the other hand, the global or by-country situation shows peaks that are more or less symmetric, approaching the classic logistic sigmoid-derivative shape. This fact supports Roger Bentley's view that the classic symmetric peak is due to the temporally spaced superposition of many of these "kernel" curves. I use that same approach in the dispersive discovery model. Therefore the L-V is not really a self-consistent or scalable model. Like you say perhaps useful to use as an analogy.
So, I am of the opinion that no amount of fiddling with the L-V model will be able to reconcile this profound disconnect between the local depletion dynamics and the global profile. If a cornucopian such as Michael Lynch sees that we are using models that are not self-consistent, they will rip our views apart. Of course, he will not have a model himself, but he is savvy enough that that does not matter, all it takes is a deconstruction of the data or our interpretation of the data.
BTW, Global Warming denialists are using the same approach to deconstruct the accepted models, but mainly in terms of data reduction. They don't have a model themselves, yet that doesn't matter if they can question the competence of the scientists.
WHT -- Thanks for all the number crunching. A thought: I can envision one possible reason why N Sea (and possibly the US) curve is asymetric and the global curve more symetric. The N Sea and US have a factor in common generally not seen in much of the world: free enterprise competion. A generalization, of course. But a region controled by a national oil company won't likely see as high a discovery rate as one where multiple companies compete to acquire and drill leases as fast as possible. Many major producing regions were dominated early on by very large concessions controlled by very few companies and thus might more closely mirror NOC control. And this status can change over time: the ARAMCO consortium becoming the Saudi ARAMCO. Thus a modification of this model would require a time function as well as spatial. If this model bears any water it will be interesting to see if Brazil develops their Deep Water play as some expect. Initially foreign companies contributed to the initial exploration push. Now the Bz gov't is restricting much of their DW play and allowing only Petrobras access to new leases.
I'm curious to see if this thought would lead some to see that comparing global curves to certain country/regional curves might be a little more of an apple to orange comparison. Not a complete disconnect, of course, but a logical variance. You're good at seeing the truth in the fog so maybe you can cipher my ramblings.
All right, WHT. You have a good point. I accept the challenge and let's see if we can fit your curve. If you have a moment, can you send me the data at ugo.bardi@unifi.it? We'll run the model on it (or some slightly modified versions of it) and we'll be back to you. Not very soon, though, because - as I said - this is work doing at night and when we have spare time.
I sent the data to you.
On a side note, I figured out why a traditional constraint-based URR does not fall out of your equations; it is because the parameters are all based on instantaneous production and not on cumulative production. You will have to transform it into the latter, as the Verhulst equation does, for it to generate a URR that has fixed characteristics. (yet I still don't think this is the right path)
Data received, thanks. Let's see what we can do. Back to you when possible
The "third way" approach I took was finding an alternative to deterministic equations for representing discovery processes. These are all discovery processes we're studying. The main problem is that science is so fixated on producing deterministic equations for everything... Sp what I did was was concede... just a little... and use the fact that nature does seem to follow deterministic patterns... temporarily.
There are explosive and vanishing discovery processes that would need to be represented in divergent equations, and that's a starting point. Thy're evident in both the data and in mathematical models sometimes, as with the perpetual compound growth definitions of economic variables. They provide a great place to begin searching for what it is in the physical systems that will cause them to diverge from their former seemingly deterministic paths. That's the subject of Models and Change, still looking for any journal and an editor that might be interested in opening the question.
Ugo, I've never seen it quoted before as a general rule, but I have always contended that all significant scientific advances have been financed by a budget intended for something else or all real research is bootleg.
That is certainly often the case in the two fields I'm most familiar with, geophysics and computer science.
This observation is not directly relevant to the problem of convincing people of the reality of peak oil, but it is relevant to the allocation of resources to do something about it.
Kly84g,
I have read a few pieces here and there over the years that have left me thinking that the grant system might be the worst possible way to finance research-for the very simple reason that it tends to concentrate most of the money in small areas of research that are vastly over funded at the expense of the much larger areas left almost entirely in the dark.
This puts researchers in the position of the drunk looking for his lost keys only under the street light because it is obviously too dark to look anywhere else.
In the end under the grant system whoever controls the political agenda ultimately controls the research.
In agriculture every dime spent on wine and christmas trees for instance,niether of which are in short supply,is a dime less that could be spent on researching soil depletion,preserving existing cultivars, or domesticating a new staple food plant that might be better suited to the
future conditions.
In medicine every dollar that goes to aids research is spent on a disease that can be very easily prevented.I am not opposed BUT-
Those dollars might be better spent on malaria or basic biology which in the long run is the foundation science on which medicine is built-but biology has grown into its current form only because the chemists,physicists,and engineers have given it the tools it needed to grow-we would probably still not understand the basics of dna if there were no electron microscopes and xray machines,etc.
The eventual consequences of this distortion may be either positive or negative for the world as a whole but my gut feeling is that they will be negative.
Throwing money at a problem ,no matter the amount,will not find a solution that does not exist but it creates the illusion,one readily swallowed by both the public and the economists, that solutions WILL be forthcoming.
The delays thus engendered may mean that other lines of reasearch which would have paid off with and early explosion of useful and immediately applicable knowledge and technology are either never pursued or pursued too late to matter in the present day world.
Who funded Darwin?
The capitalist system that made his family independently wealthy. He never had to earn a living and had enough funds to do his own studies and research.
Right! Darwin the Young Adventurer
Ron P.
His trip in the Beagle was funded by his uncle, the industrialist Wedgewood and by his father, a rich medical doctor. Later he married his rich cousin Emma Wedgewood. Among his notes there's a very interesting list in which he writes down the pros and againsts of getting married -he is quite happy when he comes to the conclusion that it is better to get married! Darwin later got grants for research funded by the British government. He never lacked connections.
Two centuries later Wedgewood the famous potters are going broke.
You have a good point, Mac. The way research is funded nowadays is TOTAL DISASTER. The only way to get money is to be sure to present a program that cannot fail; which means redo something already done. Then, you have to follow the various fashionable ideas, say, hydrogen, nanotechnology, all that stuff that is funded just because it is fashionable, but nobody knows exactly why. When they'll start funding research on peak oil, the peak will have been ten years in the past, and it will be archaeology. Too late.....
The late L.F Buz (aka Buzz) Ivanhoe self funded his research. He had retired, following a long career in the oil industry and was concerned about the availability of petroleum. .
He published in the Oil and Gas J. during the 80's. Later he decided to fund The Hubbert Center Newsletter, spending well over a million dollars and several years of his time. Much of the research performed by Jean Laherrere and other experts has also been self funded. Continuing the tradition some of the peak oil research being carried out at TOD and ASPO remains self funded. The expertise of many of the posters also adds an element of peer review.
http://hubbert.mines.edu
Yep. Another way of saying it is "Things done illegally are done most efficiently"
I think the predator / prey (foxes and rabbits, etc.) analogy adds extra complications to ‘peak oil’ or ‘peak fossil / mineral’ etc. So it is not suitable for use in explaining to children, or, lord! politicians.
It introduces, suggests, calls up:
....hard to understand time lines, as some things happen quickly and others are slow (e.g. lotsa foxes speedily eat rabbits, then it takes a long time for the foxes to die.)
.....the idea of cycles, things going up and down, and a possible return to some previous state; which might also be conceptually tagged as ‘sustainable’, or ‘renewable’, etc. as biological organisms reproduce
.....complications with ‘feedback’ (i.e. an effect continuing, augmenting, or even slowing, vs. things staying stable, etc. even in the paper itself the ‘feedback’ notion is off.) A bit the same as the previous point, but viewed from a different angle, calling up different concepts
.....the idea that changes in behavior, either as conscious choices or due to ‘mindless’ adaption, introduces a lot of ‘what ifs’ not relevant to the peak oil frame, or not directly so, in the sense of having to be transliterated back (what if the foxes fought over the remaining rabbits thus killing each other off?, etc.)
So it is not ‘mind sized’ (Papert.) I think Papert was keen on simplicity, the ‘power’ of ideas, which translates to appeal, broadness, applicability, and something like the ‘got it’ moment. As well as break down into pieces - significant ones - that can be related one to the other (but maybe I over-interpret.)
Of course, similar complications exist for peak oil as well (plain old Hubbert’s curve, excluding shark fins, etc.) but the complexity of the predator/prey relationship as living entities makes it all more difficult to understand.
I have noted that one of the difficulties ppl experience is that when they see a bell curve is that they associate it to static, atemporal measurement (shoe size, IQ..) as opposed to dynamic/cinematic (hard to find words for what ppl think), having time on one of its axes.
So the predator+prey analogy might be useful for cobbling up new representations, such as animated displays showing a ‘fixed’ quantity X (not whales or rabbits) of Z being gobbled up -harvested / used /consumed /etc. at different rates - which gives one the opportunity to discuss the reasons for the differing rates, which opens up a lot of possibilities, and goes to the heart of the matter.
Yes, but do I think it assumes a minimum threshold for the actual size of the mind in question, no?
The ones that are the approximate diameter of your average pea are slated for automatic disqualification in this exercise.
I agree with Noizette.
At the end of the day, the whales versus ships model adds new complications and does not help the politician's mind to grasp what is going on.
The politician's mind might quickly grasp for the substitution model: OK if whale oil peaks out, we'll simply find new substitutes; just as we always have. The stone age did not end for lack of stones.
Ugo,
in one of your papers you show GDP increasing for quite a while after the energy peak -in fact you say:
-Personally I would be quite happy if this where the case but I'm not sure many here would agree that GDP can continue to increase even as Energy Production declines (peak GDP is at about 3/4 Peak Energy).
How do you account for the fact that GDP can continue to rise in this way? 'Efficiency' perhaps and/or inherant momentum of the Industrial/Civilisation Juggernaut?
Also consider that some of the Sanky Diagrams we have seen at TOD point to dramatic re-allocation of Financial Capital in the decades post-peak, at first it is not lost, it is simply redirected away from discretional Consumerist things to Non-Discretional Energy productive things as EROI falls...
What this screams to me as an investor is that "energy production investments" (including efficiency ones) are the screaming retirement BUYs of the coming decades... Or is that a few dots joined too many?
Regards, Nick.
Well, I am not so sure about this interpretation, either - that's why we didn't show it in the "official" paper. Anyway, it could make sense: GdP is surely related to energy, but not in a direct relationship. It is a measurement of of the economic exchanges in the economy, and those exchange may involve very little energy. That is, I could still increase the GdP by buying and selling shares while freezing in my house because I can't afford central heating. As you correctly mention, it is something strictly related to the concept of "efficiency", that is the ratio of GdP to energy consumption. Most economists think that efficiency is a good thing, because it means you do things better because of better technology. But note that our diagram shows that the ratio GdP/energy increases with time without having to assume anything about technology. So, as I say in my paper, there is something here, but we'll have to work more on this subject to understand it.
Ugo, I think you're overlooking the real connections between GDP and energy. Price is quite reliably related to the more realistic estimates of total embodied energy. The issue behind the theoretical dispute is with how you trace the accumulation of embodied energy, and that's where a big difference lies.
The LCA methods that are the world standard now count exclusively the energy used in the technology chains the create a product or service, and explicitly exclude the energy cost of supporting the human technology required to deliver the product or service. Their method was not written consistent with the functional necessities of the operating whole systems, unfortunately, but uses an (unfounded) concept that all impacts come from the entropy of the technology employed.
The impacts also come from needing to support the systems that use the technology. It's the business as a unit that delivers the product, not the business as a mechanical device sitting in isolation. Consequently you need to treat paying people for their services the same as buying technology for its services. The energy needed to support each is obviously part of the total embodied energy accumulated in delivering their coordinated products.
The systems principle for embodied energy would be that no part can operate without the whole. When you do the statistical analysis of how money spreads it seems the great majority of all spending will necessarily end up having nearly average embodied energy, i.e. the 6000btu/$ global average in 2008 that is slowly declining at about 1.8%/yr. I go into some of the details whole system measures for embodied energy. If you study the whole system embodied energy per dollar curves you also see graphically displayed some good evidence of the world economy acting uniformly as a whole.
The argument from economists is pervasive and comes in several flavors, but the one cited above sums it up "How come that you can describe an economic system without taking prices into account?".
I am thinking that the counter-argument goes something like this. Think back to the question of whaling - as long as the limiting factor has to do with the number of ships out there whaling, then yes, a higher price will motivate people to build more ships, which will increase supply.
But if the number of remaining whales are the limiting factor, the whales don't know or care what the price is. They have no incentive to reproduce more quickly just because our price for their carcasses is higher. But as the price of the whale oil goes up, humans on the other hand have an ever increasing incentive to catch the whales - the result being catastrophic for the whales.
I am always reminded of a photo I saw of a whaling factory ship from the 1960s. It had a giant slipway for hauling (blue ?) whales on board for processing. It had a (relatively) tiny whale of another species on it, being hauled in. It has stuck with me as a defining image of unsustainability.
This idea of bubbles and peaks had already been discovered over 2500 years ago. In Buddhism there is the idea of "Arising and Passing"; that everything, EVERYTHING, is impermanent. Objects comes together when conditions are right, has a middle life, and then have an ending.
I just see this arising and passing as a fractal of the nature of the universe. We are deluded into thinking thinks are permanent because either this arising and passing happens really fast or really slowly.
You can never stand in the same river http://www.crackmeup.com/details.asp?ID=1310127
Yes, I own the t-shirt-it is an old classic.
They changed Islam-it used to be "If s--t happens, take a hostage".
No doubt people have been observing these tensions between growth and limits for a long time. Every organism survived an evolution surrounded by them, and hardly any natural process does not display them. If you check, I even think you find that perhaps the majority of the words in our languages are about them.
What our way of thinking doesn't seem to do, with this world of life & death issues we're immersed in, is connect them as they are connected physically in the environment. I think the real culprit is how consciousness presents the world as connected by our own meanings for things rather than physical processes. So... we keep trying to explain the world as things with no natural connections...
If you listen to conversation, I thing you find nearly everything being described as a connection between human values and concepts, and missing the whole dimension of our need to search the physical things and the physical relationships between them to discover their connections. i.e. a way of missing most of what's happening.
I find it easy to tell politicians about peak oil, at least the ones that employed me three years ago. ;-)
Now have I written a 150 page book about what I think might happen post peak oil when that problem is combined with oter kinds of resource crisises, what one can do about it, what one can do about it and not end up with a bad situation if the situation is misunderstood and last the realy bad risks that makes me afraid.
Its written for a Swedish audience and this week am I am stepping up the work with finding a better publisher then self publishing.
The next step is a web page and figuring out the best way of translating it to english. But 10-20% is very specific to Sweden. I am toying with the idea of posting it a chapter at a time on ToD to gather comments and tips about additional material.
This posting a chapter at a time is a very interesting thought.
Can the site afford to post some books that are in the public domain?
Or may be the people who have located good online editions could just post the links.
I know there are a lot of good free books out there relevant to the "mission " of this site but I find it very tiresome sorting thru the chaff for the occasional grain of wheat.
Maybe this could be a regular thing if we just kept up with such links and posted them once a month with a few words about the author and the contents of the book at the tail end of a regular feature right before it closes.That would not impose any work on anybody at the site and the regulars would know where to look for the links to good free reading.
Some other system would probably be even easier and more practical but since I know nothing about actually running a site I have just tossed this out as a possibility.
I'm all for finding new and better ways to succinctly describe the peak oil problem to those who are unfamiliar. (I'll repeat that I think the best presentation I've seen is Andre Angelantoni's. He's aangel on here. Maybe a TOD editor would like to approach him on sharing his powerpoint.)
However...if we are talking about getting the attention of politicians, good logical explanations have nearly nothing to do with it.
Before I got involved in any kind of political work I shared the naive belief that the activity of politics involved engaging in debates about policy and that the better, more logical arguments would end up determining policy. IOW, I thought that politics was something like what we do here in our conversations on TOD.
After I actually went to some meetings on political issues I realized soon enough that actual politics is something entirely different. It is done by organizing people to take action around an issue they already essentially agree on. Rational arguments play a role in which audiences groups manage to get on board for their agenda, but until action is organized politics is not being done. Many people involved in political work are very set in their agendas and it is impossible to change their minds. Thus the real work is in finding those who think like you, and to build your group by getting less involved people to be more involved.
Politicians have the role of stitching together coalitions of groups that share enough common objectives that elections can be won. The last people that politicians will listen to are those who have a message that is not bought into by the rest of whatever coalition of groups they already have supporting them. It doesn't matter how correct and logical your message is, you won't get more than 10 seconds of any politician's brain time unless you represent a sufficiently large and organized group whose clout in your community is recognized by that politician. After all, they have to deal with all kinds of people who want their attention, including some number of bona-fide loonies. So you have to represent numbers to get quality time.
Therefore, the moral of the story is, don't waste these excellent explanations of peak oil on politicians. Instead, use them to reach out to as many regular folks as you can, and determine with them the best actions to take - with or without the support of politicians - to prepare for peak oil. (If you are successful enough, some politician or another will eventually get on board by default.)
Jaggedben,
I believe your insight into politicians only having time and attention for recognizable groups or factions that have already coalesced around a given issue is not only valid but critical to any real understanding of politics.
Im with you on your suggestion too -once there is a large enough block of voters who are concerned about peak oil,some politician will get out in front of us and scream "follow me!" .
This is what politcians have always done-figured out where the voters are headed and positioned themselves to take advantage of thier reading of the public mind.
Caio Ugo! I found your exposition of the predator-prey model interesting. No disrespect to your efforts, but I have found ANY reference to mathematics - let alone a model - is enough to create the glazed eye of incomprehension. While mathematicians and physicists seems to have a good baseline grasp of math, I have seen many physical scientists and engineers with very weak math comprehension. The general public? Fagettaboutit! So I came up with an analogy to explain resource peaking I use in my peak oil talk and essay. I call it the "Nut Picker Analogy." And here it is...
Let's say you are at a party and you are assaying the munchie table (exploring the resource province and collecting samples). You inspect the vegetable plate (rabbit food! yuck!) – the rumaki (ugh – liver) – and you try the 7-layer dip (whoa! too dang hot!) You sample a few other items. Who brought the damn jello fruit salad, and where are the chips? Ho hum. Then you see a bowl of mixed nuts, and you remember you really love almonds, so you move in for the kill.
The bowl contains around 10% almonds (analogous to oil reserves), and the rest are peanuts and those damn bitter brazil nuts (some greedy bastard already ate all the cashews!) So you start picking out the almonds. Go ahead, nobody's looking. At first it is easy to find the almonds complete and intact – you lightly shake the bowl and the big boys readily appear on the surface ready to pluck. Your rate of discovery and munching of almonds (analogous to production) is now high, and you waste very little time (energy) finding those lovely nuggets.
Then the almonds are no longer visible on the surface – you have now eaten around half of the almonds. You have to start digging through the nuts and spend more and more time stirring and searching (expending more energy) to find the almonds. The almonds still turn up, but they are getting smaller, and broken pieces are showing up more often.
Eventually, you have to spend more and more time stirring and digging through the junky peanuts and Brazil nuts to find ever smaller and poorer quality almond fragments. At this point, your munching has been reduced to a small fraction of your initial consumption rate, and sometimes you actually eat peanut fragments thinking they might be almond bits. Uh oh, here comes the hostess, and she knows you have been mining nuts! Busted! Run!
I have found that this sort of analogy is much easier to understand by many folks. There's other similar examples - trying to mine a specific size washer from the spare screw jar in the garage - picking out the red M&Ms.
Does anyone else have other analogies that capture the essence of the immutable law of resource extraction?
Then when you are almost completely out of almonds this sexy blonde for someplace called Alberta sidles up to you and is able to convince you that if you take the time to crack the Brazil nuts they're just as good as the almonds and they don't taste half bad if they are broken up into little pieces. Well yes it takes more energy to break them up but who cares about the EROEI.
Well, she admits they might give you gas, but that shouldn't be a really big deal as she has some Beano in her purse which she'll be glad to share with you...
So party on dude the night is still young and it's going to be a long time before the lights are turned out. Plus there is an unlimited amount of moonshine with which to wash down the remaining peanuts.
In the morning you're going to have one hell of a headache but that's tomorrow!
Very nice piece, thanks for this analysis. This lag has been mentioned with respect to why complex societies collapse also.
Nicely written.
In this video you can see a politician recognizing Peak Oil.
He says that the depletion has started, and that we have to prepare, now, for the post-oil era.
http://www.youtube.com/watch?v=qV-1axB6UwA
I have used an even simpler model.
Suppose a given resource (mineral X) is found in a desert somewhere.
The general shape of that resource will be a circle curving away from the first point of discovery.
At the point of discovery the available resource is only a spade width wide. But the more of it I dig, the wider the "line of access" to the resource becomes.
Soon there is room for a bucket dredge, then two, then 10, then 1000.
As each new miner is added to the field, the "line" across the arc gets longer and longer and the more miners it can support.
Right up to the point where exactly half of the resource has been mined.
Now, not only is there progressively less resource to be mined but, because the arc itself is shrinking, there is not enough room on the mining line for all those dredges.
However you reduce the number (bankruptcy, being bought out by others as the value of the remaining resource gets higher, warfare etc) the number of miners reduces and regardless of the technology, the production rate falls.
Until, at the end, there is only one spadeful of the mineral left.
However, we never get to the last spadeful because the cost of going out into the desert to mine it remains constant and, below a certain volume, the production and transport facilities cease to function economically.
The "shape" of any resource can be simplified to the circle and the process is identical as you say, but maybe even a politician can understand it.
What you describe is the essence of the accelerated search model for discovery.
http://www.theoildrum.com/node/2712
http://www.theoildrum.com/node/3287
What gives the discovery profile its characteristic rounded "bell-curve" shape is the fact that all these accelerations are dispersed around the mean (to the maximum entropy approximation). Thus it is called Dispersive Discovery and it can generate an exact match to the logistic sigmoid under an exponential acceleration search regime.
I would agree with you that this is the simplest model to get across to someone with an untainted mind. What is perhaps hard to get across is the fact that the fat tails on the back-side of the peak will still occur even if people do not "give up".
Right, see my comment below too. The curve comes from a search process interacting with its environment. It's two parts, and the search process is the animating part. So the curve comes from what an animated search naturally finds in a relatively inanimate environment. The 'magic trick' on which resource development depends is hidden in that period of 'downhill' acceleration of 'uphill' organization in the search process, evident wherever natural systems are taking off with their burst of development in exponential growth.
In general people can't visualize what happens when you have varying search rates. The varying search rates cause the "downhill" acceleration; search is actually accelerating still, its just that many of the fast searches have all completed, and the formerly slow ones are now starting. This is all in the context of a constrained environment. Contrary to what many people believe, this is not your traditional feedback loop.
Yes, to visualize it in the abstract takes a knack, and I standardize my representations to relate to the standard search trajectory for all accumulative developmental processes, with the search producing increasing responses followed by decreasing responses:
It would be good to have a common language for this, wouldn't it? The principles apply hugely widely to all kinds of system development and opportunity exploitation processes it appears.
In the period when the environmental response is diminishing, and the accumulation of results is coming to a climax, there may well be a ballooning of unproductive searches. As with the surges of oil prospecting after each energy crisis, that unproductive search "overshoot" quickly subsides, right?
"Have you ever tried to tell a politician about peak oil? If you did, you know what happens."
Yes, this is a problem. Being a grassroot level politician myself I have observed one reason. In our western representative democracies people vote their candidates, and typically people want to hear about good things and rosy future. If a candidate talks about problems - say peak oil.. - this wont give people "good vibrations" when choosing the person to vote. So politicians don´t talk about problems, or they talk only problems where they at the next sentence promise a solution.
To some extent, the politicians have developed an ethos where the future is rosy and all problems have a solution, since they tend to "campaign" all the time. The politicians are not dummier that people on average, actually even the other way round, but breaking into that world wiew with topics like peak oil needs fairly strong battering ram.
If there are solutions brought at the same time it helps a lot.
I agree, but denial of any problem won't help find even partial solutions, and any delay severely limits our options for a successful outcome. The underlying problem is population growth and IMO nobody is prepared to adequately tackle that.
IMO politicians won't find affordable solutions to continue exponential growth, if they exist (which I doubt) they will be found by ordinary citizens investing a lot of time, money and effort. I think we need to bypass politicians, they are not up to the proactive job.
I can't think of any adequate current alternatives to fossil fuels that are more affordable and sustainable than existing technologies - it is up to the cornocopians to prove we can actually, in just a ten year timescale, move away from unsustainable growth of fossil fuel usage , intensive farming, population growth, exponential debt growth etc etc. Solutions to all of these things, and more, have to be in place before we get any declines in them.
Have we ever made a list on TOD of the things we are going to have to do without fail? ... how do we move to a steady state ... is a steady state of anything ever seen on Earth? ... if a rapid decline is inevitable how do we survive it personally?
I have spoken to a LOCAL politician and he gets it. His response: "This is a global issue, what can we do locally? We are trying to get a more efficient county vehicle fleet, what else do you suggest?"
I will take any suggestions and forward them.
Thanks,
Jody in Fairfax VA USA
The added piece I think I have to offer is perhaps understood better in terms of the case of Rome. The peak for Rome is not, to me, what tells me what resource it was that ran out. What tells me what resource ran out is the inflection point in the growth curve. That's the point of diminishing returns for the growth process.
What I think caused the collapse of Rome is that it, like us, organized their society around their initial vigorous growth process, and couldn't change. So they then necessarily started making ever bigger mistakes as growth ran into persistent diminishing returns, eventually running their otherwise sustainable system into the ground.
The resource that ran out at the inflection point was not the gold. Gold is not acutally a resource, and has no value if there's nothing buy, like any kind of money. Money only represents a share of the healthy economic machine. What out at the inflection point was the virgin territory to bring Roman civilization to.
So, I think the true "gold" of Rome, it's great "seed resource", was uncivilized territory, which it used for building an organized economic system for what became it's empire, with security, business practices and the arts, along with superior engineering like the Roman roads, to cart all the stuff around. If the conquest of territory also gathered supplies of gold in similar proportion to how Roman civilization brought wealth to the territories, it could be coincidence.
Rome's point of diminishing returns for expanding into "uncivilized territory" was about 30 BC, and that would correspond for us to the inflection point in the Hubert curve for our great "seed resource", around 1950.
---
So what I can add to the main question above, is the idea that the bell curve shape of resource depletion could be the general natural shape of learning curves, i.e. of the 'resourcefulness' of the development process exploiting it. You can also see same shape in the first derivative of the ubiquitous "S" curves of developmental processes in general.
What development curves seem to trace is the complexity limits of organizational development (systemic learning) for complex systems. That every direction of development has a natural point of diminishing returns says that the resourcefulness and organization of complex systems have natural limits. Each curve is individually different, of course, as any individual systemic learning process would be.
So, I'm in agreement with Tainter, that it's complexity that did in the Roman's, but, think of it less as the complexity of the failing society that resulted, as it struggled to grow without a growth resource... I think of it as the complexity of its rigid society, organized only for growth. The Romans, after exhausting their great seed resource, instead of maturing like natural system economies do, kept their society organized for immature growth.
Responsive societies wouldn't rigidly organize themselves around environments of the past...
FYI that curve is almost a perfect shark fin curve.
What this means in context is Rome figured out a way to steal the fat tail from simple dispersion. So Romes expansion was not a dispersive search after a while.
Whats the fat tail in gaining lands ? Hmm.
For me at least that means that they absorbed the captured provinces and romanized the citizens then these new romans contributed to capturing more land.
So if that thesis is correct then in the first have whats being dispersed is the benefits of being a Roman citizen not unlike how the US chooses to spread democracy esp to resource rich nations. Rome played the same game and in general once you excepted there rule and where adopted into the game by force if required people realized it was a really cool racket/ponzi scheme in played along.
However as Rome spread instead of romanizing the increasingly barbaric and unwilling tribes it took to simple looting. Looting is of course unsustainable in the long term and it left pissed off barbarians to constantly fight.
Thus the game ended when Rome reached regions where it could not force people to play its ponzi scheme. It stayed around for a while of course via looting from its borders at first then from within. Not unlike whats happening in the US today. Once the looting starts the end is certain although it may or may not be near. Looting vs the traditional ponzi scheme setup is a bit of a fine line.
In the traditional form it worked because steady expansion kept injecting fresh suckers into the bottom after stripping them of their wealth. A surprising number of immigrants to the US come from countries that we bomb into the stone age. Rome did not have air power but played the same game after being massacred being Roman was not a bad deal.
However like I said when this supply of fresh citizens, slaves and gold ended the looting began and eventually collapsed the system as it was not receiving the influx from growth requiring to hide it. Actually technically it did not begin it just became unsustainable.
This bring up the real problem which is concentration of wealth and the infinite appetite for wealth and power of the rich that can never be satiated.
Its our infinite greed that eventually leads to our downfall.
In my opinion underlying this is the fine line between the ponzi scheme used by the wealth in expanding societies and looting as expansion stops. Their behavior does not change its just they are no longer getting fresh meat and go to fighting amongst themselves over whats already accumulated and existing sources of wealth.
I seriously doubt most even have a clue that a fundamental shift marking their doom has happened they are to disconnected from the sources of their wealth to realize it.
You can see why localization of wealth is vital one it limits how much can be accumulated before the wealthy start giving back second they live with their golden goose and know where the eggs come from so the are far less likely to kill it. And last but not least they have to socially integrate and preform their civic duty as the town or village wealthy person. If they shirk their duties they will find the village moving to support a replacement.
What many people don't realize about feudalism was it was a double noose certainly everyone thinks of the poor but it also tied the lord of the manor to the village thus capturing the concentration of wealth locally.
And of course for the king it worked to dissipate concentration of wealth that could usurp the throne. Before the oil age even in Roman times the tying or localization of wealth helped limit concentration at least outside of the top in Rome.
But back on track it just seems to me the key point is how do clever people figure out how to cheat the almost universal nature of dispersive discovery.
How do they learn to steal from the backside of the curve. That is the key to collapse.
Even a renewable society will rise and fall with population and environmental changes esp without serious birth control. However collapse seems to hing on the ability to in a sense steal from the future.
Whats really sad is in our society the accumulation of debt that can never be repaid even for generations is the friggin core !
We literally built our entire society around the critical tool of stealing from the future required to collapse it. Only the steady influx of immigrants and later oil ensured the empire expanded. Given how deeply we have embraced the means of our own destruction I seriously doubt the US will see a long twilight period like the Roman empire. We are way way to deep into the quagmire to last long.
I think that any global modal that attempts to understand the future needs to understand this once you do you see the extreme danger we face esp from the twin problems of a mountain of debt and falling oil supply. The combination is a deadly embrace that causes the looting period to end quickly as not only are the bottom layers no longer expanding but they are rapidly being impoverished by real cost of living increases from rising commodity prices. Defaulting on debt by the lower classes offers only temporary reprieve as rising living costs quickly eat into cash flow.
So you have the upper classes turning to more ever brazen pure looting. You have the lower classes defaulting on debt then still being squeezed but rising commodity prices this is simply a fast crash situation your burning the candle at both ends.
I think in the US one of the big events will be and outright revolt against state and local taxation even as their revenues fall off a cliff as housing values decline and sales tax receipts fall. At first it will be a push back against new taxes this will turn into a serious demand to reduce government dramatically. Pretty soon a new crop of politicians some from outside the main parties will take office and slash government to the bone. This will of course increase unemployment lower local spending by the government and not help as much as assumed. It will help for a bit but not for long. Next of course are pension defaults etc. Thats from the lower side. On the top side I think the looting will turn brazen and companies will be driven into debt all value sucked out and left to die. So I think things will get ugly quickly.
That scenario, that Rome's wealth was from looting, is the surface appearance that I'm trying to look behind. I think that "Roman Law" was a true "high technology", serving as much as like oil wells do, turning useless dusty lands into gold mines. I have not been able to find the economic historian with a good knowledge of natural systems and developmental learning processes... so I can't argue the point at length. Maybe with a little help Tainter would know enough to be able to put together the real economic drivers of the growth period.
What do you mean by "fat tail of a simple dispersion", does that mean the same as what I'm calling "seed resource", the little lump of manna that the fertilized germ cell discovers itself surrounded by in moistened seeds?
The problem with tax burdens, and comparing what we see as the Roman model of taxing your faithful to death to support excessive perks for the governing rich, is that the cases are different, though the net effect may be the same. In our case anyway, the need for increased government services is very real. It's being brought about by the economy of ever growing parts colliding with natural limits, and so creating conflicts and complications for itself, now, at erupting super-exponential rates. This phenomenon is a.k.a. "the big crunch", or "profiting from scarcity" .
The point is that even in a perfectly cooperative society if you have multiplying demand for limited resources you end up with exploding conflict. So "blaming the messenger" is what is happening with blaming the (haphazard)government efforts to solve problems for creating them...
I agree that Roman law was a bit of a elxir if you will creating taxpayers out of barbarians and dusty lands as you call it.
I think in the case of Rome the fat tail is the growth of ever wealthier taxpayers overtime as the integrate more fully into the empire along of course with continously bringing in new future taxpayers.
My best guess is it probably took close to 100 years or so to fully romanize a region after it was conquered and to a large extent this also meant pushing back the border so it was safely inside the Roman empire and not dealing with large troop concentrations. Regions initially become well inside the border.
So the fat tail is a mix of rising wealth internally as new regions are incorporated and adding new regions.
This does a good job of picking out a sort of natural timescale for Roman expansion that fits well with history. Assuming a generation is 20 years it I'm saying it takes about five generations to fully incorporate a region. Three to remove the barbaric influence and culturally incorporate one transition and then one expanding romanized generation. After this your probably looking at and additional say three generations before your reaching maximum wealth so say 150 years or so to max.
As a completely different factor that suggests these are the corrent time scales one can look at the conversion of the Roman empire to Christianity which is a very similar sort of basic cultural conversion.
http://www.unrv.com/culture/christianity.php
It took almost 300 years before the full conversion was pretty much done i.e the Emperor became Christian. But it suggest my time scale for simpler less revolutionary changes is probably not a bad guess. You can see this today where many different cultures readily adopt technology and business practices while religion and culture is difficult to change.
This might be a good book to get time scales from.
http://www.yalebooks.co.uk/yale/display.asp?K=9780300137538&sf1=author&s...
Of course starting with better documented civilization say America may be easier to refine the methods. The conversion of immigrants to taxpayers is fairly well documented for the US. The timescale is shorter it seems to take only two or three generations say 2.5 to fully convert a free soul to a indebted taxpayer but the basic concept is still there.
Of course the interesting part in my opinion is not this process but where it goes astray and the entire system begins to excessively steal from the future for today its when the balance shifts and dispersive like forces get swamped thats the interesting part. As far as I can tell it looks like for quite a while that dispersion is still at play even as another force is actually the root.
They look very very similar for quite a while. Its really hard to tell even for the US when we went from organic growth to decline as the measures of growth are simply changed. The way data is collected and valued changes dramatically while the overall numbers continue to look good. As a simple example in the US the way unemployment is calculated is fiddled with constantly. We now have U3 U6 etc etc. As far as I can tell the turning point actually occurs when simple easy obvious stats are turned into convoluted definitions. Its when the obfuscation of the truth starts that the system has already flipped to a shark fin like collapse model and simple dispersive forces are weakening.
This is easy to understand for humans but it also holds for example for very simple systems such as sand piles. The stresses and strains throughout the system are very very similar at the point of collapse as they are before. The lie if you will can be subtle and not obvious and almost in detectable but its there and its of course powerful since collapse occurs shortly thereafter.
In the case of a sand pile its of course a change in the distribution of stress and strain over the pile. Its more a pattern then any significant change in the physical variable if you can see the stress/strain relationship then the pattern change is obvious while simply measuring the forces at the grain level completely misses the truth.
This is actually my semi argument with WHT you can't ignore this macro pattern effect even as the fundamentals don't seem to vary. One of the changes actually fundamentally altered the time evolution of the system from symmetric to asymmetric collapse.
For oil the culprit is three fold better imaging technology, horizontal drilling and the way reserves are calculated. The combination of all three has resulted in wildly inflated reserve numbers that are now industry standard.
Its not all that subtle for oil.
The intrinsic trick if you will and ROCKMAN points it out is since you can image a thin layer of oil and drill a horizontal well you can make up almost any number you want for reserves. They are only barely constrained but actual production numbers and have little physical meaning these days.
The truth is hidden in the fact that horizontal wells have a large number of problems over their productive lifetime and tend to last far shorter than projected. The fact that they are generally profitable completely hides the real physical situation or no one cares since they made money over the short term longer term you go bankrupt and never produce the claimed oil but thats a different issue. In the end its simple fraud and fraud is based on hiding liabilities. Its not rocket science once system starts to play hide the liability or fraud its shark finned collapse time.
EDIT:
The reason this works is the onset of fraud follows the original real dispersive model and thats how it becomes successful. Its a chimera of the true underly dispersion and becomes a charade. They the beauty of the game you can't see it unless you pull back and recognize the pattern and find the intrinsic trick thats the basis of the fraud. Ponzi schemes are obvious other frauds less so. Its actually a concentrator or negative dispersion but it looks positive on the outside.
Well, with any of the many evolutionary change factors you say might be in play, you can clearly tell where their limits are once the curve of diminishing returns appears.
I really doesn't matter what's "in the ground", as in the case of oil. What matters is the whole system response to the increasing environmental resistance. You get that from the response curve. It's telling because it's the response to the whole system's searches.
The most informative point is the inflection point, where the growing resistance outpaces the growing search. That was about 1950 for oil I gather. From there on you're running out and better be planning on switching. Once the shape of the decay is apparent it generally isn't ever going to change.
Well 1960 except for the most farsighted. You can backcast if you will to find some point in the 1950's that represents the start. But yes even as early as then you had a good idea.
Hubberts first peak paper was in 1949. Even then a rough estimate of world peak was possible.
http://www.hubbertpeak.com/Hubbert/science1949/
If you read this paper and WHT work on dispersive search outside the issue of equations the core principles are very similar. I'd argue that Hubbert is talking about dispersive search without refining the term.
Although its a grievous sin in the presence of WHT to not develop the math if your data is uncertain then a rough approach is not that bad.
Because of the thorny reserve estimate issue its difficult to know yet if better equations yield better results. If the data is as corrupt as I believe it to be then its not suitable for predictive use.
Your reduced to handwaving as calculating correction factors in many cases for outright fraud is difficult.
The blaring example of course is OPEC's claimed reserves depending on the real correction factor they can be anything. And of course its quite possible that even the original estimates are suspect so its quite murky.
Production numbers are even worse esp in countries with substantial internal demand who knows what the real numbers are.
But does it really matter ? Even in the shark fin model which is the worst realistic collapse function you have a very broad top period so the signal is rather obvious. The divergence between possible outcomes starts occurring as you get away from the peak by several years.
Looking quickly at a graph
http://www.hubbertpeak.com/blanchard/
US oil production was 2.5 mbd for lower 48 and hit this number again in about 1985 taking this is the peak region it lasted 25 years for the US.
I have the world peak region as extending from about 1990 to 2007 a period of 17 years. Its not clear if oil production is back to its level in 1990 but its close enough. Although the data is worse backasting to 1990 as the start of the peak region if you will is not bad. Whats interesting is if the production was symmetric even with this backcast approach using the US is the model we would still have eight more years of fairly high oil supples left. And of course don't forget if we where on a symmetric production curve up through 2008 then the combination of falling demand and more aggressive extraction should keep the world fairly well supplied for almost a decade. Its rather obvious that if forced we can give up on growth without falling into chaos its not a happy world but its functional. With the above its hard to see any real pressure on oil prices for many years.
Of course I don't believe that and the market is looking increasingly like its not buying into it either but...
My only consolation is that if we are on a shark fin production curve then its a fast crash and not even pulling the economy back can keep us from rapidly returning to the danger zone. From there it becomes increasingly obvious whats really happening thus to a large extent I'll simply wait and let the symmetric peakist figure out where they messed up and see if they finally come to the same conclusions. It does not matter all that much given that if we are really on a fast crash track then we will rapidly reach and exceed the previous high prices in less than a year. The nature of the fast crash concept reduces or compress changes down to a matter of months with significant changes on the order of 3-4 months.
Indeed if you look back over the last two years we have actually seen dramatic moves in the oil market if you window them on 4 month intervals. Thats the time scale of a fast crash which is the fundamental feature.
Its the sharp compression in the time progression thats important. Even moving off of this time scale is good enough to suggest that the model is wrong. But lets see what oil prices are like four months from now.
If we are still hovering around 70 or lower thats a very good start at discounting a fast crash if its say 80 or higher then its still and open question. If we do what I think will happen and prices head for 200-300 blowing through the previous high then a fast crash in oil production is certain but its not clear we will still have a economy or the Internet to debate the issue. I think the world economy is actually far more resilient than most people believe able to handle up to 500 a barrel before things start to really fall apart.
This does not mean the US consumer/middle class won't be crushed esp suburban housing at lower prices. But there is a big difference between forcing the US middle class to conserve and live a reasonable life and the end of the global economy. The end of suburbia is not the end of the world far from it indeed the collapse of the American middle class actually buys the world much needed time to deal with peak oil. I figure whatever the price point needed to seriously send the American middle class into a death spiral is one that will hold for sometime. This is the point that they seriously start to default on debt and are forced into a more second world like lifestyle with a growing true poor class. Once this starts it really takes the pressure off of oil so I think prices will rise until this transition is reached to whatever levels are required. Given we are on a fast crash I don't think they will back off much from this point but we could easily have 2-3 years of stable very high oil prices before things get really bad.
Regardless the fast crash scenario is probably the easiest one to disprove since its relentless and soon swamps above ground financial games or the global economy falls into true collapse one or the other.
And it would have had to already started sometime in 2007 so we are now really tearing down the production collapse slope if the theory is correct.
That is why I apply dispersion. The data is uncertain so you use maximum entropy estimates on growth rates. I have no idea of how one can make the approach any more "rough" than that. Dispersion is the physical equivalent of fuzzy logic.
Math is a wondrous concept, ain't it?
This year we have been "lucky" in that no major hurricanes have hit the GOM (knock on wood, cause it ain't over just yet).
One needs to cross correlate the below ground dispersions with the above ground dispersions. It's all too easy to be fooled by the randomness.
I agree that correlation does not justify causation, which is the issue underlying the hurricane observations. Bayes has to play out here or someone has to have a real solid theory.
Yet, Taleb's book is also aimed at people that get "fooled by randomness" by assuming a normal distribution. In other words, they don't know what they are doing. The normal Gaussian distribution is one of the most misused concepts in probability and statistics. Most of the time the application of the Normal barely makes a dent in the variability of the observations. The distribution is too sharp and has no "fat tails" of the knock-on-wood kind. Dispersion provides huge fat tails that Taleb suggests is more prevalent. So that is why I don't understand what the roughness that Memmel is looking for.