Oilwatch Monthly September 2009
Posted by Rembrandt on September 17, 2009 - 10:15am in The Oil Drum: Europe
The September 2009 edition of Oilwatch Monthly can be downloaded at this weblink (PDF, 1.37 MB, 33 pp).
The Oilwatch Monthly is a newsletter that is available free of charge with the latest data on oil supply, demand, oil stocks, spare capacity and exports.
A summary and latest graphics below the fold.
Latest Developments:
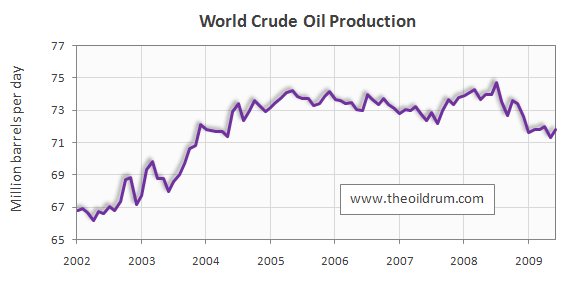
1) Conventional crude production - Latest figures from the Energy Information Administration (EIA) show that crude oil production including lease condensates increased by 444,000 b/d from May to June 2009, resulting in total production of crude oil including lease condensates of 71.78 million b/d. Crude oil production in the EIA International Petroleum Monthly for May 2009 was revised downward from 71.8 to 71.33 million b/d. The all time high production record of crude oil stands at 74.74 million b/d reached in July 2008.
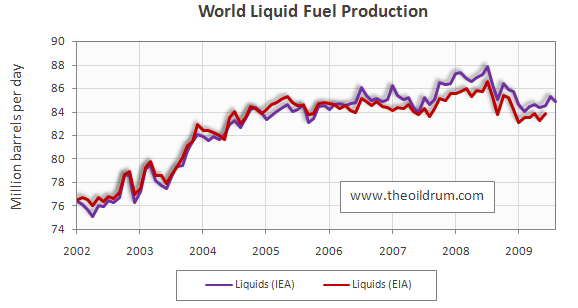
2) Total liquid fuel production - In August 2009 world production of all liquid fuels declined by 400,000 barrels per day from July according to the latest fgures of the International Energy Agency (IEA), resulting in total world liquid fuels production of 84.88 million b/d. Liquids production for July 2009 was revised upward in the IEA Oil Market Report of August from 85.15 to 85.28 million b/d. Average global liquid fuels production in 2009 through August was 84.6 million b/d versus 86.6 and 85.32 million b/d in 2008 and 2007 respectively.
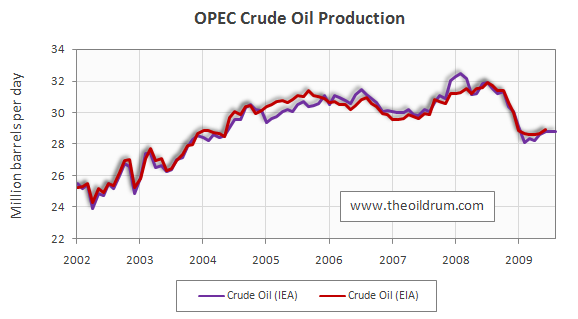
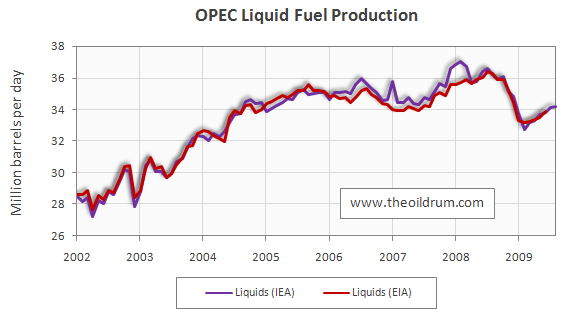
3) OPEC Production - Total liquid fuels production in OPEC countries increased by 50,000 b/d from July to August to a level of 34.16 million b/d. Average liquid fuels production in 2009 through August was 33.59 million b/d, versus 36.09 and 35.02 million b/d in 2008 and 2007 respectively. All time high production of OPEC liquid fuels stands at 36.58 million b/d reached in July 2008. Total crude oil production excluding lease condensates of the OPEC cartel increased by 50,000 b/d to a level of 28.80 million b/d, from July to August 2009, according to the latest available estimate of the IEA. Average crude oil production in 2009 through August was 28.58 million b/d, versus 31.43 and 30.37 million b/d in 2008 and 2007 respectively. OPEC natural gas liquids remained stable from July to August at a level of 5.36 million b/d. Average OPEC natural gas liquids production in 2009 through August was 5.01 million b/d, versus 4.66 and 4.55 million b/d in 2008 and 2007 respectively.
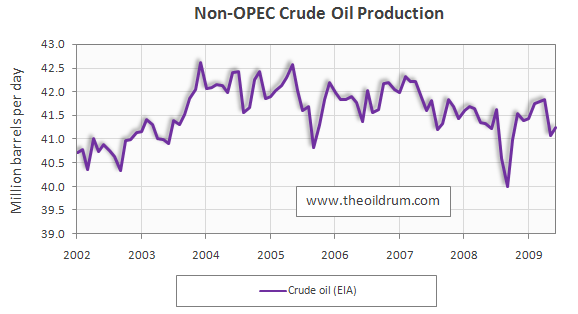
4) Non-OPEC Production - Total liquid fuels production excluding biofuels in Non-OPEC countries decreased by 450,000 b/d from July to August 2009, resulting in a production level of 49.17 million b/d according to the International Energy Agency. Average liquid fuels production in 2009 through August was 49.51 million b/d, versus 49.32 and 49.34 million b/d in 2008 and 2007 respectively. Total Non-OPEC crude oil production excluding lease condensates increased by 162,000 b/d to a level of 41.24 million b/d, from May to June 2009, according to the latest available estimate of the EIA. Crude oil production in the EIA International Petroleum Monthly for May 2009 was revised downward from 41.5 to 41.08 million b/d. Average crude oil production in 2009 through June was 41.51 million b/d, versus 41.32 and 41.80 million b/d in 2008 and 2007 respectively. Non-OPEC natural gas liquids production decreased by 117,000 from May to June to a level of 3.30 million b/d. Average Non-OPEC natural gas liquids production in 2009 through August was 3.41 million b/d, versus 3.65 and 3.79 million b/d in 2008 and 2007 respectively.
5) OECD Oil Consumption - Oil consumption in OECD countries increased by 659,000 b/d from May to June to a level of 42.85 million b/d. Average OECD oil consumption in 2009 through June was 43.87 million b/d, versus 46.10 and 47.68 million b/d in 2008 and 2007 respectively.
6) Chinese & Indian liquids demand - Oil consumption in China increased by 654,000 b/d from May to June to a level of 8.19 million b/d. Average oil consumption in China in 2009 through June was 7.18 million b/d, versus 6.92 and 7.29 million b/d in 2008 and 2007 respectively. Oil consumption in India increased by 144,000 b/d to a level of 2.96 million b/d. Average oil consumption in India in 2009 through June was 2.92 million b/d, versus 2.60 and 2.43 million b/d in 2008 and 2007 respectively.
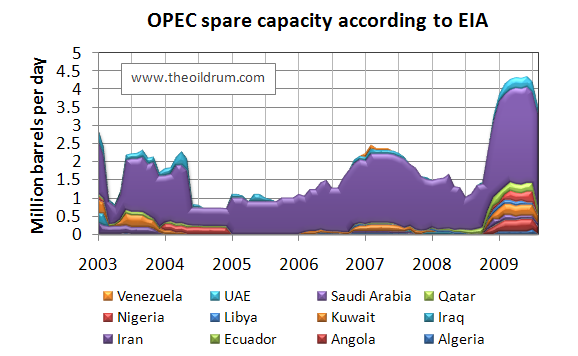
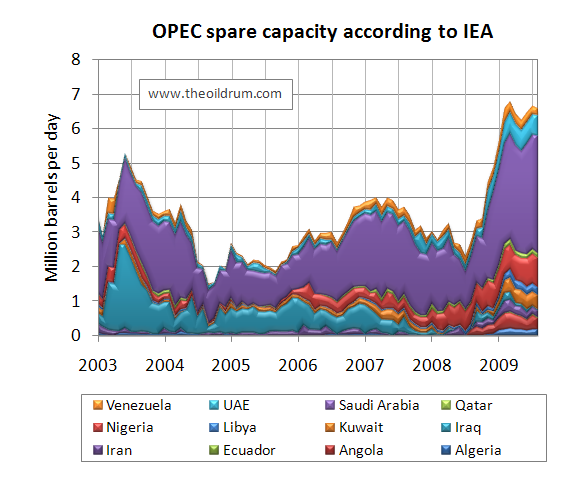
8) OPEC spare capacity - According to the International Energy Agency, total effective spare capacity (excluding Iraq, Venezuela and Nigeria) in August 2009 remained stable at 5.30 million from July. Of total August spare capacity according to the IEA Saudi Arabia can produce an additional 3.4 million b/d within 90 days, the United Arab Emirates 0.58 million b/d, Angola 0.31 million b/d, Iran 0.20 million b/d, Libya 0.22 million b/d, Qatar 0.13 million b/d, and the other remaining countries 0.46 million b/d.
Total OPEC spare production capacity in August 2009 declined by 690,000 b/d to a level of 3.51 million b/d from 4.2 million b/d in July according to the Energy Information Administration. Of total August spare capacity, 2.60 million b/d is estimated to come from Saudi Arabia by the EIA, 0.22 million b/d from Qatar, 0.19 million b/d from Angola, 0.20 million b/d from Kuwait, 0.30 million b/d from the United Arab Emirates, 0.10 million b/d from Iran, and no spare capacity from other countries.
9) OECD oil stocks - Industrial inventories of crude oil in the OECD in July 2009 increased to a level of 1012 million from 1011 million barrels in June according to the latest IEA statistics. Current OECD crude oil stocks are 54 million barrels higher than the five year average of 958 million barrels. In the August Oil Market Report of the IEA, a total stock level of 990 million barrels was tabulated for June which has been revised upwards to 1011 million barrels in the September edition. Industrial product stocks in the OECD in July 2009 increased to 1470 million from 1459 million barrels in June according to the latest IEA Statistics. Current OECD product stocks are 72 million barrels higher than the five year average of 1398 million barrels. In the August Oil Market Report of the IEA, a total stock level of 1467 million barrels was tabulated for June which has been revised downwards to 1459 million barrels in the September edition.

Note on subscription
For the time being, it is no longer possible to subscribe to the automatic e-mail service in order to receive the Oilwatch Monthly in your inbox. This is because I am working on a dedicated website for the Oilwatch Monthly which will be launched early next month together with a second newsletter, the Oil Forecast Quarterly. Publication on the Oil Drum will continue alongside this website, and the automatic e-mail service will from then on be available again to new subscribers. Inquiries about these developments can be made at contact at peakoil.nl.
Personnel
Editors
Contributors
Peak Oil Primers
Archives
- November 2010 (3)
- October 2010 (6)
- September 2010 (4)
- August 2010 (7)
- July 2010 (6)
- June 2010 (7)
- May 2010 (2)
- April 2010 (8)
- March 2010 (4)
- February 2010 (6)
- January 2010 (3)
- December 2009 (5)
- November 2009 (8)
- October 2009 (12)
- September 2009 (6)
- August 2009 (5)
- July 2009 (11)
- June 2009 (8)
- May 2009 (16)
- April 2009 (10)
- March 2009 (7)
- February 2009 (10)
- January 2009 (15)
- December 2008 (9)
- November 2008 (9)
- October 2008 (9)
- September 2008 (13)
- August 2008 (10)
- July 2008 (14)
- June 2008 (23)
- May 2008 (16)
- April 2008 (12)
- March 2008 (16)
- February 2008 (9)
- January 2008 (13)
- December 2007 (13)
- November 2007 (16)
- October 2007 (22)
- September 2007 (8)
- August 2007 (9)
- July 2007 (16)
- June 2007 (8)
- May 2007 (7)
- April 2007 (7)
- March 2007 (10)
- February 2007 (10)
- January 2007 (12)
- December 2006 (9)
- November 2006 (15)
- October 2006 (4)
- September 2006 (5)
- August 2006 (5)
- July 2006 (9)
- June 2006 (5)
- May 2006 (10)
- April 2006 (9)
- March 2006 (13)
Vital Trivia
License

This work is licensed under a Creative Commons Attribution-Share Alike 3.0 United States License.
If I'm reading correctly, spare capacity is close to where it was a year ago at about 2mbb/day once you back out demand destruction as represented by OPEC's cuts of @ 3mb/day. It looks like there might be a half a billion wiggle room.
Yet, Megaprojects indicates new additions for 2009 should be about 1mb/d over a decline rate of about 4.5% which should put spare capacity closer to 6mb/d.
Is this disparity just bad seat-of-the-pants math on my part or new production for '09 that got shut down due to the recession?
Cheers
I think somewhat similarly about spare capacity. It seem overstated and subject to circumstances that effect various regions differently.
Net exports are the name of the game now. (I suspect) increasing producer consumption will erode spare capacity so that by the end of next year, there won't be any.
While I'm sure most would agree with your basic point, a la the ELM, your time line seems a bit frantic. 5mb/d increase in consumption in one year? That doesn't seem likely. I've not read WT's comments thoroughly lately, but I'd guess their numbers are closer to decades to get to zero. Maybe somewhere between 7 and 20 as a WAG?
Cheers
The EIA puts spare capacity at 3.5 million barrels per day and I think that is very optimistic. I think OPEC was producing flat out during the summer of 2008. If that is true then spare capacity is about 3 million barrels per day. OPEC is currently producing 2.84 mb/d less than they produced in July of 08.
At any rate spare capacity will be eroded completely away by the summer of 2012 not counting any increased consumption by exporting nations.
You wrote above:
Nope! Cuts in megaprojects are happening everywhere.
The rebound Total sees is for its own production, not world production. At any rate you will see a dramatic revision in Wikipedia Megaprojects when the new revision comes out, probably in November.
Note: The above quote from Total read billion barrel-a-day. That was obviously a misprint so I changed the word billion to million.
And about your estimate of a 4.5 percent decline rate:
This new IEA decline estimate of 6.7 percent has been all over the news lately.
Ron P.
I agree. As monthly US spot oil prices rose from $67 in June, 2007 to $134 in June, 2008 (an annual rate of increase of 70%/year), I would think that virtually everyone with any spare production was producing pretty much flat out. In any case, to the extent that there is spare capacity now, and there is obviously some, I suspect that it is mostly high water cut stuff with an 80% plus water cut.
I suspect that September, 2009 is analogous to September, 2007, and we are headed for a renewed bidding war for declining net oil exports, with the average 2010 oil price in excess of average 2009 price. Note that monthly oil prices in August, 2007 and August, 2009 were the same--$72.
Regarding exports, I am defining the "Most Likely" case for the (2005) top five net oil exporters as the midpoint between Sam's middle case and high case. Based on the Most Likely case, Sam's projection is that the top five will have shipped about one-fourth of their post-2005 cumulative net oil exports by the end of December, 2009.
Some observations based on studying three former net oil exporters and 17 current net oil exporters:
Median Net Export Decline Rate* For Six Net Oil Exporters With Production Peaks** in 2005 or Later: 3%/year
(Declines by half in 24 years)
Median Net Export Decline Rate For 11 Net Oil Exporters With Production Peaks** in 2004 or Earlier: 8.3%/year
(Declines by half in 9 years)
Median Net Export Decline Rate for 3 Former Net Oil Exporters: 37.1%/year
(Declines by half in 2 years)
*Measured from production peak to 2008, or last year of net oil exports
**May or may not be final production peaks
As a given country (and a group of countries) get further away, time wise, from a production peak, they tend to move from Group #1, to Group #2, to Group #3.
Ron,
I understand what the numbers are from the two different agencies. I was asking a specific question wrt those discussed in the post and quite specifically about spare capacity. My post was pointed, as shown by the "or am I missing something" nature of the post. Note that I clearly indicated I was backing out cuts in the last year or so.
Re: decline rate. Yes. I have been one of those consistently saying I felt actual decline rates were much higher than had been stated in the past. The decline rate I stated was not "my" estimate, but a conservative number based on debate of natural vs. net decline rates that have been published over the last year of debate since the IEA report. I have stated many times my personal view that decline rates are in the 6-8% range. The pointed point being made is that the numbers are probably a bit wacky. However, I was talking about NET decline, not natural decline. I agree natural decline is at least 6%, and probably higher.
Here is my question again:
Here is the part of your answer that is relevant:
Which confirms my sense of the cause of the discrepancy.
Interestingly, in terms of decline rates, SA had announced new capacity levels of about 11 to 11.5 mb/d which would put their spare capacity at about 3mb/d. (I'm using rough numbers.) Given that is equal to all claimed OPEC spare capacity according to the EIA in the key post, that would argue for a decline in SA production from older fields that is significant given the numbers above are supposedly NEW capacity.
Hmmm.
Cheers
CCPO, not to nitpick but what you are saying here is something totally different from what you said above. For instance here you say:
Well, that's exactly what I thought you were talking about when you wrote:
Now NET decline rate would be natural decline minus new production. In your example here there would be no net decline but an increase of 1 mb/d in OPEC production capacity, give or take.
The whole point of my post was to show that new production will very likely be less than decline. That is, natural decline is greater than 4.5% and new projects will be considerably less than indicated by Wikipedia Megaprojects. This would mean that there would be a net decline in production capacity, not an increase in production capacity as would be the case in the scenario you presented.
Cheers, Ron
I know, Ron. Can we stop stating what the other has already said?
We both agree: decline rates are high and spare capacity is almost certainly lower than stated.
Revised megaprojects will be interesting.
Cheers
That will cut world production -from existing fields- in half within 10 years. But luckily .... we have politicians that understand the ramifications.
Hello Rembrandt,
After reading about the 'Ghost Fleet', I was thinking about the OPEC spare capacity too. How ironic would that be if there was a later global surge for OPEC to open the taps full-blast, but so many tankers got scrapped in the interim that insufficient boats were available to move the crude?
Yo Bob,
Nothing do drastic seems to be in the works: Gulfnews: Shipping rates to rise as tankers get scrapped
That would indicate 2884 vessels. Well, 2884.6 actually. Wiki says 4,024 >10kdwt, citing something called the "Office of Data and Economic Analysis." Google as I might I could find no information about this source. Oil tanker - Wikipedia, the free encyclopedia Morgan Downey sent me a different figure than either of these, but my Inbox overflowed and the message is tucked away somewhere on the hard drive.
@totoneila (bob)
I doubt very much that tankers will be a problem. I expect that there will be more than sufficient shipping capacity for crude on the market despite the economic situation in a couple of years.
Rembrandt
Rare photos of the Ghost Fleet: Ghost fleet moored off Singapore: 12% of ocean shipping idled
Rembrandt, OPEC spare capacity is a key variable to track. But how is it that the IEA seems to have on average about 2 mmbpd more spare capacity for OPEC than the EIA?
It all depends on what you estimate total productive capacity at. There are also some methodological differences between IEA and EIA definitions of supply, though to be fair that shouldn't impact OPEC significantly. It may be that the EIA does not include Nigerian and Venezuelan oil as spare capacity as this could not be produced even if they wanted to due to the security issues (Nigeria) and operational issues (Venezuela).
It is stotal guesswork as to what Saudi spare capacity might be. Does anyone think they had anything left in the tank in 2008 when they ramped up to 10.7 million b/d? They usually like to keep at least 1 million b/d back, but they were extraordinary times. Still, the Saudis are now producing just over 8 million b/d and have ramped up Khurais in the meantime, so you've got to estimate at least 2.7 million b/d for them. As a whole OPEC was producing 37.6 million b/d at peak in 2008 and are currently producing just under 34 million b/d. Since then they have also added 0.5 million b/d of NGLs (Nigeria, Qatar) and a further 0.5 million b/d of conventional capacity (Angola, Saudi Arabia, Qatar). I think 4.5 million b/d is probably a minimum estimate.
They have an interesting problem looming for NGLs. These are not included in quotas and Qatar and Nigeria are ramping up production big time. They will add a further 1 million b/d of capacity over the next 14 months and given the demand outlook for 2010 (and non-OPEC production) it seems likely that OPEC will need to cut conventional crude output again. If I'm Angola and I'm being told I can't bring my shiny new oilfields on stream because Qatar is going nuts with NGLs I'm pretty annoyed.
It's going to take a little while to burn off this excess capacity.
Chicken,
Nice analysis and I appreciate your thought. As far as I can tell nobody knows for sure what the spare capacity is. Some people inside Saudi Arabia have a better idea than anybody else.
The one disagreement I have is that I think you need to consider depletion/field decline when you are estimating spare capacity. You note that OPEC as a whole was producing 37.6 million b/d at the peak in 2008, and now they are at 34 million b/d. The difference is 3.6 million b/d, but you are estimating that the actual spare capacity is 4.5 million b/d. We know that Khurais and other projects have come on line since the peak and that they have added significant capacity. However, the existing fields are quite old now and I bet they were pulling them pretty hard in 2008.
The biggest uncertainty to me is what level will the existing fields be able to produce at when the time comes to ramp production back up? If OPEC as a whole was producing at 37.6 MMBOPD in 2008 and they experience a 5.3% annual decline, then that would mean they would be down by 2 million b/d now. If that was the case do you think it would be possible to get up to 38.5 million b/d (34 current plus 4.5 spare)? I guess only time will tell, but in the back of my mind I think people could be quite surprised to find out the spare capacity never really shows up. (Of course OPEC will just issue statements such as the world is adequately supplied, etc.)
Even though Saudi has dropped back production to 8 million b/d they are still depleting their reserves at roughly 3 billion barrels a year. How long can Ghawar go on making 4 to 5 million b/d without reaching a significant decline rate? Just look at Cantarell to see what happens once the oil column shrinks to some critical thickness.
Also you must consider that there is no OPEC quota on condensate and natural gas liquids. Every OPEC nation is currently producing all the condensate and NGLs that they possibly can. From eyeballing the charts, the IEA seems to be including NGLs and condensate into their estimate of spare capacity. If they are indeed doing this then this is simply wrong.
One can better gauge spare capacity by assuming that OPEC was producing flat out last July and figuring their drop from there. Of course new production like Khurais would also have to be taken into consideration, but also one would need to figure in depletion as well. That is why I think the EIA figures are far more accurate than the IEA's. I put crude spare capacity currently at about 3 mb/d. However I would not be surprised if it were slightly lower than that.
Ron P.
jimb,
Thanks for the thoughtful reply. I agree that what I did here was really just a back of the back of an envelope analysis. I was just setting out the peak of OPEC production in 2008 as a high water mark of what we know can be produced (or could just one year ago). At the time of course the Saudis claimed they had another 1 million b/d in the tank, but I think most people rightfully doubt that - we can't know for certain however.
I was however trying to net out depletion without going through the details. Now to me 5.3% sounds a little high given the IEA reckoned an average of 3.6% for OPEC in WEO2008. Maybe that's low - we'll take your estimate for the sake of argument. We have to strip NGLs out of that and apply the depletion to conventional crude (NGLs were not part of the study, and are still largely in plateau are ramp up stage). At peak in 2008 crude production was 32.7 million b/d. If we take 5.3% off that we need to replace 1.73 million b/d to stand still. So without further additions from new supply we can estimate that the lowest OPEC production could have fallen to since peak in 2008 is 32.7 - 1.73 = 30.97. Add back the NGLs as they stood in 2008 and we come to 35.83. That would leave OPEC with 1.83 million b/d of spare capacity right now as an absolute floor.
They have added capacity however. The megaprojects database says 2.465 million b/d of crude and NGLs in 2009. Now some of that has been postponed, some is still ramping up and some will come in under nameplate capacity. But then we also have to consider the 2008 production which was delayed, ramping up and postponed. Lets say that conservatively they have seen capacity additions since the 2008 peak of just 1.5 million b/d. That then takes us to the absolute minimum plus 1.5 (35.83 + 1.5 = 37.33). So I would say it is a fair estimate (and this is still very back of the envelope stuff, but we're dealing with forgiving timeframes here) that as a minimum, OPEC can produce 37.33 million b/d of oil, giving them spare capacity of 3.3 million b/d currently.
The maximum we could get would be accepting that the Saudis had 1 million b/d in the tank, adding a depletion rate of just 3.6% and adding perhaps 2 million b/d in total between peak 2008 and now. That gives you a figure of ((32.7 - 1.48) + 1.0 (SA) + 4.86 (NGLs) + 2.0 (New projects) = 39.08. That would be over 5 million b/d of spare capacity. So I'd say the range is 3.3 - 5.0, and I'd estimate 4 or just over is probably about right. I know this is far from the detailed analysis elsewhere on the site, but I think it is a reasonable estimate - and I think it is quite conservative.
The only point I'm really trying to make here is that the past year has set peak oil back by a significant margin. Or at least it has set back the point when demand will surpass available supply. Demand has taken a four year retrograde step - we're back in 2005 as far as demand is concerned. I think this is important because there may be two to three years of "ample" supply available, and this could damage the movement if it is not taken on board.
The point I make about NGLs and condensates is that it may cause problems within OPEC which could lead to over-production in the near-term. Don't be susrpised if prices fall soon, and remain weak in early 2010. None of this ultimately affects the bigger argument (in fact it may strengthen it as investment declines), but for those expecting imminent price spikes and a shortage of supply, I would say that you are probably not going to see it for several years. The economic risis has bought a fair bit of time.
Platts says Saudi decline rate from existing fields is 6 to 8 percent.
Country Analysis Briefs: Saudi Arabia
And Saudi Arabia has admitted as much:
OIL TRADING AND EXPLORATION/SAUDI ARABIA
Okay, now that we have that settled, that is that Saudi fields have an average decline rate of about 8 percent, it is also possible that they have decreased this decline rate from 8 percent to 2 percent with the aid of MRC wells and perhaps other methods:
Saudi Arabia’s Strategic Energy Initiative: Safeguarding Against Supply Disruptions
I think the picture is quite clear and since we have the data from the horses mouth, there is no more a need to "speculate" about Saudi decline rates. The problem is that the author of the above piece, Mr. Nawaf Obaid Managing Director of Saudi Arabia's Strategic Energy Initive, confuses decline with depletion. (Chicken Little makes the same error in the above post.) I think it is quite possible that Saudi has decreased its decline rate of existing fields to 2 percent. But by doing so they have greatly increased the depletion rates. It is just a matter of time, perhaps already in many places, until the water hits those MRC wells. When that happens then the decline rate will go from about 2 percent to over 30 percent.
Note: Decline is all about flow rates, that is the rate of decline in the rate of flow. Depletion rate is the annual percentage rate that oil is disappearing from the reservoir. We should never confuse the two because they are usually inversely proportioned. That is, if by more wells, especially MRC wells, we can reduce the decline rate, (superstraws), we obvioulsy increase the depletion rate.
Ron P.
Well, if we increase the Saudi decline rate (yes, I am guilty of interchanging decline and depletion erroneously - I'm simply referring to decline rates here) to 8% then we would cut an adidditional 0.3 million b/d off of the spare capacity estimate above. So we'd be in the 3-4.7 million b/d range. But I'm also cutting them absolutely no slack on Khurais, Shaybah or AFK.
I'm not sure we can say the decline rate for Saudi is settled. I'm not sure there's anyone in Saudi Arabia who honestly knows what it is. We can estimate that it is in the 3-8% region (maybe even higher, maybe lower), but we simply cannot know what it is (and nor can the Saudis) unless they produce at maximum volume from all fields for 2-3 years.
Where do you get the 30% decline rate from? That would take the Saudis from 10 million b/d to less than 5 million b/d inside two years.
Chicken, think about what you are saying! You are saying that no one in Saudi Arabia is watching the production rate from its old developed fields. No! They are watching them like a hawk and they know exactly how fast the flow rate is declining. They know the decline rate for each and every field to a fraction of a percentage point. After all they have to do is monitor the production from each field. Do you think they would be so lax as not to do that? And they have been producing flat out many times in the past. They were producing at a maximum rate from June 2004 thru 2005 and earlier, from 1990 thru 1999. And even if every field was not producing at maximum rate most were.
As the ARAMCO Vice President, and other ARAMCO officials said, they were declining at a rate from 5 to 12 percent per year. That is, the field with the lowest decline rate was declining at a rate of 5 percent and the field with the highest decline rate was declining at a rate of 12 percent and the rese somewhere in between.
They then, somewhere around 2002 or earlier, began a task of installing water cut off wells for their existing vertical wells and drilling a lot of new wells, all MRC wells. So with the aid of these Superstraws they managed to cut their decline rate from an average of 8 percent to about 2 percent.
I see no reason to doubt this. After all several ARAMCO says their existing fields were declining at an average rate of 8 percent per year. That must have been desperately hard for them to admit. But somehow they had to explain the new drilling efforts in Ghawar and other places.
I have no way of knowing but I think some of these fields hit the cliff this year, else how do you explain the desperate new efforts to find sub salt oil in the Red Sea. (The URL was posted on Drumbeats about a month ago but I cannot locate it right now.)
Ron P.
@Chicken Little
- The difference in Spare Capacity estimates by the EIA and IEA are not due to including different countries as these statistics show the same group of countries.
- Calculating Saudi Spare Capacity based on vague figures for fields that have ramped up is too speculative. I wouldn't even attempt to make such a rough calculation as it tells you little without knowing the actual status of the old fields (Ghawar most notably).
- Good point on NGL, don't know if that is of any influence/importance but it certainly could be.
- I estimate that the excess capacity will be used up by 2012 due to a combination of consumption rebound and depletion. More info about this will be presented at the ASPO USA conference in Denver
Rembrandt,
I'm not pretending to be doing anything other than a back of the back of the envelope little analysis here, but I think it is fair. See my post above for the details which address some of the points you raise here.
I expect it will be more like 2014 before we have problems again, but that might be becasue I'm very pessimsitic about the current state of the global economy. I think China's a bubble about to burst, but that's another discussion...
@Euan,
I do not know as I have never inquired/obtained information on the different methodologies that the IEA/EIA employ to calculate spare capacity.
A key feature of the recession has been the speed at which it has unfolded. A dig through the history books suggests this is not untypical of dislocations caused by financial panics. These economic events can then surprise on the upside with respect to both markets and economies. We have already seen some of this in the scale of the recovery in global stock markets since March and it's entirely possible that a recovery in global GDP could be equally rapid over the next 12 months. In some ways, given historical precedents (1975 was a good example) it's surprising how many forcasters have already been made to look foolish with their predictions of very slow recovery.
If this sort of recovery happens then predictions of oil consumption regaining 2008 levels in 2012 or later could prove well wide of the mark. We could instead be looking at next year for capacity to once more be tested.
TW
1975 was not a good example. It was not a financial panic, but rather a direct consequence of the oil crisis. The only good example of a "financial panic" in vaguely modern times, was the Great Depression. And after the expectation of a quick return to growth in early 1930, it was a grinding recession / depression for most of the next 9 years. Will this time be any different ?
Take a look at this article;
http://www.marketoracle.co.uk/Article8285.html
A new 30's style depression has been much touted but most of the evidence to date does not support the premis.
Every time there is a bear market/recession there are cries of 'Great Depression'. And every time since the event itself they have proven false. That's not to say it won't be the real one this time but the way events are unfolding at the moment it looks increasingly unlikely.
TW
Watcher, watch and wait.
Indeed! The Watcher's analysis is not just off, it's full of false/bizarre statements!
1. There is no recovery: about half of US homes sales happened because of the first time home buyer tax credit and the surge in automobile sales was due entirely to the cash for clunkers program. That is, there is no real underlying increase in GDP; it's nothing but welfare debt straight from our pockets.
2. The stock market is not the economy. I'm truly amazed anyone would equate stock prices with economy. The "rally" has been dominated by four - yes, four - stocks (If four stocks = the economy, we are in bigger trouble than even I imagined.) and insiders selling to small investors. Like George Bailey said in It's a Wonderful Life, "He's not selling, he's buying!" That is, Mom and Pop are getting hosed again.
I'd love to see the watcher actually post some of this fabulous economic data that proves (he/she uses declarative statements) all is well with the economy. Drive-by propaganda is boring.
I suggest The Watcher read theautomaticearth.blogspot.com.
Cheers
ccpo
Well, I'm certainly not claiming economic data is fabulous and that all is well. What I'm saying is that full on depression looks to have been averted and that indicators now point to growth.
The data as it is today;
Stock markets, which are leading indicators (again I never claimed they represent the current state of the economy), are up nearly 50% from the lows.
Coincident indicators such as lending (check out corporate bond issuance as well as bank lending), retail sales (US +2.7% Q/Q) and consumer sentiment surveys have all turned positive. Most economic forcasters are increasing their growth targets for 2010 for both developed and developing economies.
Even lagging indicators such as unemployment have been levelling off recently and recruitment looks to be turning up, even in the financial industry.
It doesn't matter how much you or others stick your heads in the sand and shout depression or armageddon the simple fact is that in the real world the data is now pointing to an increasingly strong recovery. The sharp reversal of the fall in oil consumption is just one more factor supporting this.
I'm not saying peak oil won't change things (fwiw I think it will), just that for the time being depression looks to have been averted and the signs all point to strengthening Global recovery.
TW
Sorry, but the only head in the sand is your head. When you say indicators are turning up you are actually saying they are turning less down, so you need to be honest about that. A one month slowing in rates of decline does not equal a rise. A month-to-month rise does not equal a rise in trend. And, a short-term (Q to Q) trend does not equal a long-term trend.
Every recession, including the great depression, had short periods of rising indicators that then fell to lower levels. So let me ask you, how likely is it that this would be the only recession in history to have only a leg down and then a leg up with no sawtooth-like variations? Simple logic suffices, no?
Let's look at your numbers.
1. Unemployment is still rising. There is no *increase* in employment, only a slowing of the rate of decrease. The wise realize this is a normal thing to happen in a complex system; they are never linear.
2. Stock markets are *sometimes* leading indicators. Again, you need to be honest. Go take a look at the stock market over the course of the Great Depression and you'll see that there were many instances where the market went against the trend for extended periods - to both the up and down side.
3. Retail sales? I already covered that. First, I think the number is bogus. Second, if accurate, it is primarily due to auto sales. Back those out and get back to me.
3. Hubris is not an economic fundamental and that is all you are seeing on retail sales - along with holiday, vacation and back-to-school spending. None of those will be continuing.
4. Foreclosures are still rising in gross, not rate, but even rate will be picking up again since we have entered the beginning of the next wave of resets and RE is in the process of imploding. Also, I read recently that 40% or some such of all existing home sales are from distressed sales. All that represents is a LOSS of capital, as well as a flow of capital into the hands of a much smaller group of people. That's not useful economic activity. It's not previously dispossessed people getting back on their feet, it's investors adding to the already gross imbalance of wealth.
5. What fundamentals can you point to? You have cited none. Why will manufacturing increase in the next six months? Why will new businesses get off the ground in the next six months? Why will new stores outpace closing stores in the next six months?
Give us a reason for us to think your stats - and they are only stats, which is something only economists trust/voodoo - have any heft to them. What is underlying this recovery?
Nothing, is what underlies it. Absolutely nothing.
As you note, moving forward the energy will not be there to sustain growth. How, then, do you define this situation as positive when you admit that any "recovery" is already doomed to failure? If you accept that as true then the best that could be said for the economic situation as we speak is that it is a dead cat bounce.
I tend to write in the declarative and allow context to clarify what is opinion, so let me make a general statement that anything not verifiable fact (much of the above is) is my opinion.
Cheers
I have to agree with ccpo here - the indicators are not good despite the rise in markets.
Just form a very big picture persepctive, the growth from 2001-2007 was built on a foundation of cheap debt which fuelled consumer speanding in the developed world. That debt would recirculate as CHina saved their surplus and spoent it on US Treasuries, keeping debt down. The feedback loop grew and grew until consumers realised they carried unsustainable levels of debt and they had to de-leverage. We've only just begun that process. Subprime was a trigger for a mini-collapse in an unsustainable system built on high debt levels. If not that it would have been something else.
The result is that China now has excess capacity and the ability to make goods the West is no longer buying. They cannot increase doemstic demand quickly enough to offset the loss of export markets. They are now spending to keep the system afloat, but it appears they are blowing their very own creidt bubble.
In short, the West is not buying anymore and will not be buying for some time. We're going to be paying back debt for years - the export model of growth for devleoping economies cannot be sustained and soon enough they will find out there are going to be consequences.
So without looking at the data "noise" we get that drives markets, I beleive the macro trend is far from promising. There's more trouble to come...
And even aside from the smack-down that any nascent recovery will get from decline oil production, the diseases that have plagued our financial system have not left:
Banks that are too big to fail--the biggest banks are now even bigger, having swallowed the failing ones or absorbed the business they lost.
The opacity in the system that kept anyone from knowing what banks had the most toxic assets is still just as opaque.
The urge to create risky instruments has if anything been encouraged by the bailouts--yes, the moral hazard created when you bail out businesses that make monumentally bad decisions is very real and growing.
More ARMs are coming due, and the commercial real estate bubble is just beginning to burst.
Trust in the system is very low, and ultimately the whole thing floats on trust.
There are a couple of problematic data points going here:
1. The current primary unemployment measure is one that simply did not exist before the Great Depression. Estimates using the measure of unemployment that was used then have us in the 16-19% unemployment range (and still rising) last time I saw, compared to a peak of ~25% in the '30s. This is within a comparable range.
2. The economy is still heavily leveraged, which means that a lot of people and companies are vulnerable to money flow disruptions (like unemployment).
3. The mortgage crisis and accompanying housing value decline haven't finished running their course yet. There is still trouble in the commercial market and a worrying number of ARM resets within the next 18 months.
In short, while we may well be turning the corner on this recession, it is more likely to be a turn for the worse than you would get from opinions on CNBC.
The watcher said "every time there is a recession there is a call that it is a new Depression."
Um. I disagree. Completely.
I've lived through about 4 or 5 recessions now. Never before did I even hear the guy on the corner with the "end of the world" sandwich boards say it was going to be a depression.
This one is different. IS different.
And I'm stunned that anybody who is aware of peak oil doesn't agree.
Andrew, I agree with you. I am 71 and remember every recession since WW2. No one that I can remember ever speculated that another great depression was at hand. I remember the recession of 59. Everyone knew the cause, it was the longest steel strike in history. The economy was crippled but once the strike was over, it recovered just as everyone expected it would.
Likewise we have had the Arab oil embargo and later the Iranian revolution and all that resulted from that. This is the first time ever that so many people are discussing another Great Depression. And the problem here is there is no steel strike to recover from. There is OPEC but this recession started when they were all producing flat out. Only the collapse in demand forced them to cut production in order to prop up prices.
And this time we have peak oil. Spare capacity will be gone by 2012 and nothing can prevent the downward slide in oil production. High oil prices will keep us in a perpetual recession until the lack of growth throws us into another Great Depression. The problem is, this time there is nothing that will ever pull us out of it.
Ron P.
Not only do we have peak oil, we have a completely corrupt system that has been (partly) exposed, and nothing substantial has been done to reign in the worst actors. On the contrary, we the people have opener our purses and dumped about everything in them into the pockets of the malefactors.
That outa teach 'em!
The problem with the US economy is not peak oil, it's the increasing number of left wing anti-growth anti-business policies. The back of the US economy has finally been broken with the election of a socialist president. Case in point is the recent plan to extend unemployment benefits (again). This will only make the unemployment problem worse. Anti-growth policies are what kept communist countries from keeping pace with the west. Now there appears to be a reversal of roles with China leading, and the US in decline. How can China be continuing with growth and development if peak oil is the real culprit?
Are you being wilfully dense, or am I missing some good comedy here?
You're missing 14.9% growth. That's pretty good for being "past peak" wouldn't you say?
http://www.cnbc.com/id/32913458
And what shall they do with all that income? Perhaps invest in North American oil resources?
http://www.wnd.com/index.php?fa=PAGE.view&pageId=109541
Left wing loonies in the US don't want the oil anyway.
You're missing 14.9% growth. That's pretty good for being "past peak" wouldn't you say?
A good red blooded American commie hater is quoting numbers from 'Red' China's central bank, now that is rich.
That OECD consumption chart is a real eye opener-I would guess current consumption would be at 1998 levels or less.
BrainT,
1993 actually. According to BP stats, OCED used 43mbd in 1993.
Meanwhile...
Non-OECD Asia (China India ++), South and Central America, Africa, Middle East, and Non-OECD Europe used 19mbd in 1993 which has grown to 33mbd in 2008 !
The dragon has awoken, and they just built a brand new highway system.
Wow-the MSM won't even admit that OECD consumption has peaked, and it is at levels of 16 years ago.
OCED vs Emerging Market Economies Oil use from 1993 to present. As noted above, China has just completed a 60,000 km national highway system which ironically started construction in 1993! Source: BP OECD population = 1.1 B
If we save oil, China will grab it. The US must redirect $400B in annual oil expenditure to productive economic development. That adds up to $4T over 10 years. Bigger than any stimulus package can do. Which ever company can figure this out will unseat Exxon as the largest company.
I hope you are correct-IMO the USA will not escape the choke hold applied on the country by the Fed, GS and JPM and other powerful players. The productive economic development is occurring elsewhere.
Assuming we actually had that much money to spend and were not just borrowing it...
realist -- it's not so much that China "will grab it" but they have been grabbing it for at least the last ten years. I'm just guess at the number but I'll say they've spent well over $200 billion in recent time securing oil resources. It's been done around the globe by production acquisition, financing drilling operations and refinery/LNG expansions. As an example I believe I've heard that China is now the largest oil produces in offshore Angola (one of the new hot plays). They've also offered Brazil $200+ million in loans to help them develop their Deep Water play. No details but such trades usually include the right of first refusal: though China might not own the Bz. oil they can be at the head of the line to buy it at market price. They're even going after the lower quality crude. They cut a deal ith Venezuela last year: China will build 3 speciality tankers to transport Vz heavy crude to new Chinese refineries designed to handle that crud. Until now Gulf Coast refiners thought they had a lock on that source.
From folks that deal with the Chinese in such matter the profitability of these ventures is not the priority. It's all about securing the commodity. Their gain is fueling their economic growth and not a rate of return on the investment. In that sense they have a big advantage over free enterprise operations.
And there is no madness in their method. They know exactly what they are doing. In times hence the Chinese outmaneuvering of the US as the world went past Peak will be the stuff of legend. And will reshape the geo-socio-politcal map.
Cheers
"Reshape the geopolitical map" is putting it very mildly indeed.
I challenge anybody who thinks of himself as a realist to read a few books about he history of empires and not conclude that the odds are very high that there will be a REAL(NOT A POLICE ACTION SUCH AS THE CURRENT OCCUPATION OF THE MIDDDLE EAST)resource war WITHIN THE FORSEEABLE FUTURE.
There are only three basic reasons why such a war might not come-a positive Black Swan on the energy front;fear of MAD,and wishful thinking.
Mutual Assured Destruction is the only one that seems that it might work.
It may lead to powerful countries such as the US currently doing pretty much as they please so long as they do not directly attack another powerful country.I doubt that anyone will ever attack China directly if she decides to invade another country.
We did not dare attack the USSR.They did not attack us.
As some very capable but unpolished confederate general said during the American Civil War when asked about his remarkable success(early on ) the secret is simple-"jist git thar fustest with the mostest".
How many here really think we are going to pull our troops out of the middle east?
I understand you're a reader, Mac. You might enjoy Rupert Smith's "The Utility of Force", for a non-American perspective on recent history.
The essence of success in battle is firepower and movement, as your Confederate general said. But two of Gen. Smith's contentions are that battles are no longer fought to win, and wars aren't won in a series of battles - unless your enemy is stupid, like Saddam Hussein.
That said, I agree that resource war seems very likely. I don't know about the foreseeable future, though. Ten years ago, I could see ten years into the future. Now, I can't see even one year ahead.
Greg ,
Thanks I 'll put it on my shopping list.Yes I'm a reader-I have hardly ever done anything else unless it HAD to be done or I ran out of money.But my needs and desires are simple and I have never needed a lot of money.
I used to do a lot of hunting and fishing but I always had a good book in one back pocket.
Exception-I spend way too much time here hogging bandwidth but this is the only place I know of that has the quality of relevant articles and the discussion forum with lots of very perceptive people in it and hardly any idiots at all.
If I could type faster they would probably have to throw me off the site.
Well put Mac. My vision is a world split between the US, China and Russia. Thanks to MAD China and the US will likely have control of most resources outside Soviet influence IMO. How they arrange the division will be very interesting. Some might think of a geographical split. But consider the deal where China now has long term contracts with Venezuela. Trying to usurp such nearby oil that belongs to China (at least on paper) would obviously be very dangerous. As long as Russia can retain a exporter status they have the potential to be a one member OPEC if ME oil is eventually confiscated for the most part. Given this consideration the EU may the truly big looser in this transition: China/USA will usurp ME and Africa resources and Russia will hold them hostage with the only readily available FF.
Makes one wonder if DC's plan to drop the missle defense shield for the EU (which some folks say essentially gives Russia the keys to the EU) is a smart move with such a future vision. Or it may just be political/economic expediancy. Either way it's easy to see us gving up the EU (but maybe helping the Brits a bit) if that's what it takes to keep BAU to some degree.
I believe the future for China in petroleum is actually extremely bleak.
First, we are already past peak, so the oil industry must contract.
Second they have little access to oil outside the international market.
There is 951 Gb of conventional oil in the world per the USGS plus 434 Gb of heavy oil and 651 Gb of bitumen.
Of the 951 Gb, 800 Gb is in the Eastern Hemisphere and at least 80% of that is in Middle East countries who don't need the kind of items China makes.
http://pubs.usgs.gov/fs/fs070-03/fs070-03.html
http://pubs.usgs.gov/of/2007/1084/OF2007-1084v1.pdf
That leaves 434 Gboe of heavy oil and 651 Gboe of bitumen.
2/3 of heavy oil is in Venezuela which is being developed slowly
and 10% is in Mexico. Despite Chavez, a majority of exports from both sources will probably end up in the US, which can afford to
process it. The Eastern Hemisphere's heavy oil is mainly in Saudi Arabia and Iraq and will go to the old customers--Europe, the US and Japan.
Here's my scenario(FWIW) for oil production based on 2.5% annual decline in conventional oil and 3.5% annual increase in heavy oil/bitumen production.
After conventional oil drops to less then 50% of current production some kind of regimen will put a cap on oil production.
After 2040 more heavy oil will be produced than conventional oil
and oil production in the Western Hemisphere will over take the Eastern Hemisphere for good. By 2100 AD, I would guess world oil production will fall to around ~36 mbpd of which 90% will be heavy oil/bitumen. If oil shale is developed, costs will limit it to only several mbpds, almost all coming from the US which has 75% of world shale oil reserves.
JMHO
So you believe we'll be at about 50% of current production of crude in 90 years?
Hmmm.
My best guess is that we'll be at 50% of current production by 2020.
At least one of us is going to be 80 years off if one of us is right.
You think we'll be at 1/2 production in 90 years? Seriously, right?
Seriously.
I expect that by 2020 world total oil production will drop by 12.5% not 50%.
We haven't any choice but to develop every last drop of oil.
There is a lot more oil than most here think and great efforts will be made to increase heavy oil production and to
use more sophisticated methods to recover more oil from existing reserves but the trend is clearly down.
But it will be a different world after 2040. OPEC and the Middle East will be much less important as more heavy oil will be produced than conventional oil.
That is what you would expect if the production curve is a symmetric bell shape. It took us 150 years to get to this point, and it will take us 150 years to get back to zero. However, the peak of it is the traumatic part for people who thought oil consumption could keep increasing forever.
T.S. Eliot
Not exactly symmetric but the time interval is about right in my view.
I think the oil industry is more important now than ever but it is about to contract. The bad news is there is no reasonable substitute for petroleum.
I expect long term prices will rise.
In order to meet my scenario it is essential that prices are stable. That means removing all market instability probably by government guaranteed pricing and ending oil speculation.
Assuming oil contracts from 27 Gb to 23.6 Gb over the next ~10 years and assuming the long term price elasticity of demand for oil is -.2, I expect prices will rise from $70 per barrel today to $140 in 10 years( in 2009 dollars);
(x-70)/(x+70)*.5 =(27-23.6)/(27+23.6)*.5*(-.2), x = ~$140.
This will provide stability to maximize development of problematic heavy oil resources.
As far as environmental concerns go I would say insitu methods could avoid many glaring problems and use of CO2-EOR could make
oil more acceptable in terms of CO2 emissions.
"In order to meet my scenario it is essential that prices are stable. That means removing all market instability probably by government guaranteed pricing and ending oil speculation."
I've long thought something like this was necessary. It couldn't be completely static, but I think businesses and individuals would be able to plan more effectively if they knew that basic energy prices were going to be high and get steadily higher.
Socialists!!!
Seriously, though, it is socialism as most people think of it. I wonder if you two are 1. just making observations rather than advocating and, 2. if advocating would you do the same for other key resources, such as food, water, etc? The Commons and all....
Cheers
As has been emphasized many times, oil is different from other commodities. People make long-term decisions based on the short term, current price of oil (see the article about car-buying decisions in todays oildrum). Wild fluctuations in price send confusing messages to consumers and businesses that encourage long term decisions that are bad financially for the buyers, bad for conserving society's limited gas supplies, and bad for limiting ghg emissions.
A best estimate of available supplies should allow for a reasonably accurate estimate of the long term trend in oil prices. Setting prices a bit ahead of this curve would be one way to keep us ahead of the curve.
The problem of course is that this kind of planning likely would never fly politically, especially as the rabid right and most everyone else has not yet recognized that capitalism as we have known it has now been shown to be a miserable failure at any number of levels and must be largely replaced by other strategies.
Really, this was my thinking a number of years ago. Now I think we have to go straight to rationing and curtailment. This of course is even less likely to happen politically. We will and do have rationing and curtailment, it just doesn't happen in anything close to a rational way, just based on who has been the most successful in making money, which these days seems to be mostly equivalent to whoever has been most successful at profiting off of the misery of others and the destruction of stability.
Might go the way you see Maj. But that assumes a somewhat fair and moral world. But check my reply to Mac above and you'll see I have a much darker vision of the future. There is more then enough FF in the world for China/USA to carry on BAU to some degree. All it takes in denying FF access to many of the other consuming nations. As I say, a very dark view and just my opinion. But given the hundreds of millions who died in the 20th century over what amounted to economic/resource issues there is a valid model hanging out there IMO.
I think the world will have to behave rationally in current circumstances once Peak Oil is admitted.
World leaders should be discussing a world oil production rationing protocol(Campbell), not war.
China is nervously watched by nuclear India (which is growing about as fast) and its other neighbors. I doubt India
will let China seize the Middle East and MENA countries have lots of high tech weapons anyways.
I think China has taken 'soft power' Japan's postwar un-nationalistic policies as a model and those are dependent on a viable international trade system. Having said that I believe the Chinese are capable of extreme nationalism if pressed.
One scenario is Iran pulling a Saddam or just blocking the PG stopping 6.2 Gb/yr, about half the 13 Gb/yr export trade in oil.
http://www.gulf-daily-news.com/NewsDetails.aspx?storyid=227158
I'm sure that would backfire with the Arabs big time.
Obviously that system is dependent on oil flowing, so it is really critical that unconventional oil be developed and 70% of that is in the Western Hemisphere.
The joker is as always is Comrade Hugo Chavez(Shut up you idiot) who is sitting on top of 40% of the world's unconventional oil. Venezuela produces 2.4 mbpd of heavy sour and 50% goes to the US mainly thru PDVSA owned refineries(1.6 mbpd) located in the US, US Virgin Islands and Netherlands Antillies.
Venezuela's home refineries are .6 mbpd extra heavy crude operations and .7 mbpd conventional refineries. IMO, China is only using Chavez as a bargaining chip to be traded away. That oil will go to the US or Europe.
I don't think Russia is going to be a major producer of heavy oil and bitumen so they will fade along with the rest of the Eastern Hemisphere in the next 40 years. Their vaunted NG is really overrated as 1600 Tcf of natural gas is really only 300 Gboe and Yamal/Stohkman are simply not being developed because of corruption. It is quite amazing that Russia cannot be regarded as a dependable source of gas.
Conventional oil development is almost irrelevant as we are post Peak IMO.
The situation today is much different than in the 1930s.
Nationalism is not the force it was, military dictatorships are not as popular, the British Empire which Hitler and Japan tried to emulate is a failed model.
It's actually more similar to WWI where the war was in part caused by the perceived need for colonies, but the world is not so militarized today.
I also think the chances of the US-Nato seeking to seize oil resources unlikely as it is doubtful it could be held on to for any amount of time. Bush's unilateralism looks like a huge mistake in hindsight(Iraq-Afghanistan looks like a big money loser).
IMO.
maj -- I very much hope you're right and I'm wrong.
CCPO -- Simply and very well stated. The Chinese game plan has been legend within the oil patch for some time. With all the lip service I hear from DC regarding national security it always seems as though resource security is a secondary concern: all verbage but little action. The only action I've heard of lately is the Feds offering a small loan to Petrobras. Don't have all the details but I'd bet lunch the Chinese have outplayed us by a wide margin with Bazil. I've also seen bits and pieces about China buying up potential farmlands in S America. It's so easy to see the synergy the Chinese can construct with other economies around the world.
There are certainly times when having a single political party is a great advantage. While our R's and D's waste precious time and keep pointing fingers at each other the Chinese just keep forwarding their agenda.
Perhaps the Chinese will use these resources to blow their bubble just a little bit bigger. Doesn't winning the current game guarantee increased suffering once it ends?
And what Chinese gov't over the eons has ever shown limiting suffering is on the agenda, let alone high on it? Pragmatic, they are. I've several times here described their maneuvering with regard to North Korea.
The key metric is not how much their people suffer, but which country ends up least damaged and best poised to seize lone superpower (or sputtering power) status. They've got a lot of leeway with 1.3 billion to use as cannon fodder. They could burn through a billion and still have as many as we do now.
Cheers
We all enjoy bashing the intelligence of the military types but with the exceptions of the politicians and gererals who are shall we say deluded but still capable enough to get to the very top,most of them in my estimation would rather win w/o actually fighting and are quite as well informed as any body else-you can bet the farm that every major military in the worls has dozens of reasearch papers involving peak oil,etc, (within thirty seconds delivery time) available to all the senior staff.
China almost certainly does not believe that she ever will have the oil necessary to build out an American style economy.
The way an intelligent single party counrty such as China will see this problem is that first they need to build themselves up to the maximum possible extent.If oil is a temporary expedient,they will burn it -but you will notice that they are very aggressively pursueing renewables and coal.
When push comes to shove my guess is that they will be father along on the path towards an oil free economy than any other major power,meaning that they will be able to project power as well as anyone.UNLESS someone else has a new technology that can stop them- I will come back to this in a minute.
From reading berween the lines it seems to me that the ptb in the US and Europe long ago -left and right,across the board- realized that the only thing keeeping the world more or less at peace so far as tge major powers are concerned is the American military industrial complex-this has not of course stopped the political left from hypocritically milking this situatuion for every possible drop of political milk and it is replayed for the niave(in my humble opinion) at every election.
There were no sea changes in our policies during the Clinton years,and there will be none during the OBama years.
The peaceful leftists in Europe will protest our policies while either fully aware of the fact that we will in the last resort defend them although they are too cheap to defend themselves OR else so niave as to believe they need no defense.
The price of our nonnegotiable life style is that we continue to be on the ground firstest with the mostest where it matters and that we continue to have a navy that can control the seas.
OF COURSE THIS IS EXPENSIVE-but its not as expensive as the alternative-watching our economy fall apart if we lose control of the oil.Since we are a somewhat softer and more civilized empire than most past examples we may actually continue to PAY for the oil.
Of course I recognize that this situation is inheritently unstable and over the long term unsustainable.The generals and thier staff and the committee chairmen in the house and the senate realize it too.The real ptb everywhere realize the truth of what I am saying.
But thier job is just to keep the old ship safe from the shoals and the storms and the pirates and the enemy for as long as possible or until retirement.If somebody can come up with long term answers most of them will listen-but they will also demand a very high standard of proof.
Inso far as new weapons systems go, there is a very real incentive to develop them-they can be many times CHEAPER in the long run for two reasons that cannot be reasoned away so long as we live in an us versus them world.
One is that if some body ever really gets the jump on you in this respect ,you are at thier mercy,with the possible exception of your being able to visit MAD upon them.We are enviably situated in this respect at the moment in rsspect to our conventional forces partly because they are generally superior to other countries but more so simply since we have so many of them and are still able to deploy them all over the world.
But there is avery real possibility,actually a strong PROBABILITY,that this will change and that we may have to draw in our claws and horns to some extent before too long.
But if you have a few dozen bombers that can go anywhere and come home and go back until your enemy is without highway bridges,electrical generation plants,railroads,or whatever else you decide enables HIM to trouble YOU.....well that's expensive up front but dirt cheap if these occasion to actually use them arises,and once you have them,you might feel a little safer if you cannot afford so many of the men and cheaper machines as in former times.
Personally my practical position is that since this is reality ,I'm glad I'm lucky enough to be on the side with the mostest.
I wish things were different.
There is at least one mountian saying that I have never seen in print.Wish in one hand.Sxxt in the other.See which one gets full fastest.
Thanks, RM.
Yes, a conundrum. If the traitorous were called on their selfish actions for their selfish ends at high levels and held to account, a much more accurate view of the world could emerge and more common ground found. At least, in theory. Those claiming PO and CC don't exist, but who clearly know otherwise, should be treated as traitors, imo. Honest differences of opinion one can abide ( even if it causes one to consider crawling in a cave and waiting it all out), but actually lying and working to obfuscate when the truth is known? They may as well be selling A-bombs to terrorists.
Cheers
Word is really starting to get out. Nuclear power is the answer. More is being written about this all the time, and I find new literature on this topic absolutely fascinating.
http://www.marketwatch.com/story/author-zachary-moitozas-the-nuclear-eco...
Sure, now they have solved the waste problem - just dump it in the mediterranean:
http://www.telegraph.co.uk/news/worldnews/europe/italy/6198228/Mafia-acc...
Let's see, we dig up radioactive material use it, then put in back in the ground. Question is do we really increase the health and environmental danger? Could it be that we put it back into the ground in a safer condition that the natural ores?
If nuclear power is the answer, it's a very slow question.
As usual I'll supply the details what's under the curves. They show: Russia at plateau, Saudi Arabia could not produce more oil in the first half of the boom year 2008 than in 2005. The spare capacities shown above are exaggerated. Everyone including the Saudis knew that oil prices higher then $100 would kill the economy. They couldn't pump more. And the hitherto growing group shapes up its own peak.
Visit my new site for more graphs
http://www.crudeoilpeak.com
Looking at the top of the graph, EIA data crude oil data gives the impression of even a continuing trend downward, considering the propensity of recent EIA crude oil numbers to "develop" down rather than up.
Particular countries that are doing badly include Mexico (that everyone is aware of):
But two other Western Hemisphere countries that aren't doing well are Venezuela (with financial problems, besides everything else):
Also, Canadian production is not really holding its own, even with the small increase one might expect from oil sands production. Oil Sands production for 2008 averaged 1.2 million bpd. Based on data from Canada's National Energy Board, oils sands production for the first four months of the year (all that is available on an "actual" basis") is down a bit from the average for 2008. With luck Canadian oil sands production will average 1.3 million bpd for 2009--not much of an increase to offset decreases elsewhere.
Canada depends on imports to its east coast from various oil exporters for much of its own energy needs. If Canadian oil production is trending downward, even a bit, and imports are not holding their own, exports to the US are likely to be squeezed.
Matt,
What did you show by year for total world net oil exports for 2000-2008, based on EIA data?
Thanks.
In Country Energy Profiles http://tonto.eia.doe.gov/country/index.cfm
I went through the list of major oil exporters, used the option "View History" and then "Download full series" of XLS files.
@Matt
>The spare capacities shown above are exaggerated. <
Do you have any information/data to support this hypothesis besides speculation?
The above incremental crude oil graph clearly shows that Saudi Arabia failed to increase production in 2006-2007. The 2nd peak in 2007/2008 must have come from spare capacity because in that period no new field and/or work-over of old fields came on-stream. Khurais came later. (A lot of that oil goes into domestic power generation for desalination and to run all those newly-built skyscrapers)
If you download chapter 1 of my submission to the Australian Energy White Paper team
http://www.ret.gov.au/energy/facts/white_paper/list_of_sub/mm/Pages/defa...
you will find a graph on page 6 depicting what I call the "Oilympic peak". Saudi Arabia delivered most of that extra oil to China.
The detailed report shows that crude oil production is now at the level of 2004, any increase in production is from Natural Gas Liquids. Can anyone tell me what this means for energy prices? Are NGL directly substitutable for oil? I don't think so. Doesn't this mean the total production statistics are misleading?
Yep.
Here's the reddit links for this post (we appreciate your helping us spread our work around, both in this post and any of our other work--if you want to submit something yourself to another site, etc., that isn't already here--feel free, just leave it as a reply to this comment, please so folks can find it.):
http://www.reddit.com/r/reddit.com/comments/9licx/oilwatch_monthly_septe...
http://www.reddit.com/r/energy/comments/9licn/oilwatch_monthly_september...
http://www.reddit.com/r/environment/comments/9licp/oilwatch_monthly_sept...
http://www.reddit.com/r/collapse/comments/9licr/oilwatch_monthly_septemb...
http://www.reddit.com/r/Economics/comments/9lict/oilwatch_monthly_septem...
Find us on twitter:
http://twitter.com/theoildrum
http://friendfeed.com/theoildrum
Find us on facebook and linkedin as well:
http://www.facebook.com/group.php?gid=14778313964
http://www.linkedin.com/groups?gid=138274&trk=hb_side_g
Thanks again. Feel free to submit things yourself using the share this button on our articles as well to places like stumbleupon, metafilter, or other link farms yourself--we appreciate it!
I come back to this every month.
Are we not simply Plato's cave prisoners?
The only numbers we can see are what has already been produced.
That, however, is not the critical info. It simply is a shadow of the critical info.
The critical info is known by only a relative few.
The critical info is - - - what is the state of the OPEC oil fields?
How many people would have predicted Cantarell's morbid decline a few years ago?
With Saudi Arabia, we don't have the critical information.
We can read shadows - they didn't produce more during the price spike. Their water cut seems to be high. They are tapping Ghawar higher in the reservoir and capping lower lying wells.
But.
What does all that mean?
This talk of "surplus capacity" going forward is HIGHLY speculative.
Based on the above noted knowns, and my impression of how a Sultanate would choose to husband or squander its reserves, my best guess is that the KSA is entering or has already entered a period of Cantarell-like decline. I guess that they were holding on by the skin of their teeth in 08 - obviously, a cut in production during the summer spike of 08 would have been devastating to the confidence of the world that they have what they say they have.
My guess is that we're going off a 10% a year cliff.
My guess is that the pessimistic Colin Campbell is more likely to be right at a 1.6% a year decline rate. Time will tell.
Add to that AndrewB a recent article posted on TOD stating that oil consumption costs exceeding 4% of GDP have always caused recessions in the past, would occur again at just 80 dollars a barrel! Looks like the writing is on the wall for another economic bubble bursting drop off.
Well the trick is to really question production in 2008 for a host of reason mostly political one can imagine that Countries esp OPEC will be unwilling to admit declining production. But this issue holds since about 2003 or so. Basically any production number since prices started climbing have X amount of political taint. How but X is well thats hard to determine.
Now given that and given the price history pretty safe to say we have been at peak if you will for about seven years or so. Given the measurement vagaries and also political etc etc its simply not that important 2 mbd out of 70mbd is about 3% a error term of 3% or so reasonable. A 5% error term is probably more realistic.
If you throw this error term on then you need to zoom out to the bigger view and look at the fact we have had 7 years of very tight oil supplies with many producers publicly acknowledging declines.
Now can we be declining at 10% net a year now sure why not I don't see given the price action that we have not been in and accelerating decline rate for some time. Lest say it started at 1% in 2003 and doubled every year.
2003 1%
2004 2%
2005 4%
2006 8%
2007 16%
2008 32%
Well obviously its not that bad but you can take other slower acceleration rates and regardless after 7 years or so 10% is not out of the question it depends on how the decline rate is changing. But a 8-10% real net decline rate in 2008-2009 is not impossible. If we are on a shark fin curve we would see something like this albiet a slower start.
Something like say.
2003 1%
2004 1%
2005 2%
2006 4%
2007 6%
2008 8%
2009 12%
2010 15%
2011 20%
2012 15%
2013 12%
2014 8%
2015 6%
Etc...
You can of course play with the numbers but if you think that we have extracted to the limits of technology all the way up and that post peak we see a steep decline its really hard to not come with with sequences like this that put very steep decline rates greater than 8% in the 2008 time frame. And less and it more sense to model as a much gentler traditional symmetric decline.
However :)
If we where really seeing a much smoother decline rate then one can read about the technical advances since the 1990's esp and could readily argue that we need only throw more technology at the problem and we should actually get a very long multi decade plateau at least. Thus if we have not made the production profile asymmetric then we should be able to with ease. So one would conclude if we where not on and asymmetric curve by now we are on one but its hard to see where this would result in a peak in the short term i.e the transition should push peak production both height and out by many years at least five if not ten. And the world should at a minimum be swimming in oil at the moment give the sharp economic collapse.
Also the price curve on the way up should have looked different undulating more with a much slower climb as the real peak kept getting pushed out.
Last if you decided to keep the symmetric model then you would still expect similar price action however climbing a bit faster but conservation should have been able to balance supply and demand once a price point warranted it. In stead of seeing the rise and fall of the transition case above one would have expected prices to move more like a sort of step like function with a certain price point inducing a continued wave of conservation stabilizing prices then eventually moving higher as demand growth started even against the higher price point. Its difficult to not add in increased extraction but to try and keep the the classic model we assume this slow decline. Basically it should have been a slow squeeze stronger than the transition case but quite similar.
What we actually saw was a price curve indicative of and accelerated decline rate which itself signals a shark fin like production pattern. And rapid economic collapse rivaling the Great Depression resulted in prices falling for only five months. Plenty of factors play a role in how low they went and the rate of rebounding but the fact they start rising again quickly and have retraced significantly again suggests that we are dealing with and underlying accelerated rate in production decline. The ability of the economy to withstand another rapid collapse to cause prices to lower is questionable I think most people would agree we would not survive another 2008 style economic collapse.
However if we really are facing a accelerated decline rate then it makes sense that the effects of the recent collapse will be rapidly overwhelmed by the relentless decline in production so you don't really have to argue the details of the collapse just not that prices started climbing shortly after the collapse and if we are in a fast decline of say 10% or so its tough to see how we cannot make new price highs within 12 months.
How we actually trace the curve is determined by the market but if its a fast decline its pretty much a sure bet we will see 140 or higher again by next summer. In fact if we don't return fairly quickly to exponential price increases then its also pretty clear we are not on and exponential curve.
At the moment its still and open issue. Right now to many approaches and set of assumptions could be used to justify history. The only one thats either proven or dis-proven quickly is the exponential one.
If its not the right one then it would be nice to see a very long plateau in prices are strong dip or some signature indicative of the other curves.
My opinion is it looks like the Market is slowly testing each theory it tried the dip in prices indicating we we swimming in oil earlier this summer that failed to hold thus for now at least a future peak has been discounted by the market.
At the moment its testing the slow decline symmetric model with a long plateau step function in prices.
If this fails then it has no choice but to go exponential.
I think if you look you will see its doing this and if so then its probably just a matter of a fairly short period of time before it gives up and excepts rapid decline if thats whats really happening.
I'll have to ponder if the market does stick with slow decline as its really hard to see a sort of transition from asymmetric production to symmetric. Its not impossible but its really hard to fathom how it would work.
You would need to pull production down by a huge mount to role a say 8% decline rate back down to say 2%.
And your production can't increase from this new low level. And its hard to say if you can even maintain it since its not clear what the production rate would be to give you the lower decline rate for any length of time off hand I'd say a 15% cut or so it probably required to transition.
Thats actually my suggested solution to peak oil you rapidly cut production at twice the natural decline rate until production rates stabilize take the pain up front and get your economy moving off oil yet still have the oil you need to transition. Maximum pain without destroying the system. It could have happened but I tend to think it would have been a lot more painful.
In any case the market will decide and its time to make a decision is not unlimited esp in the fast collapse case. In fact if we are really in the fast collapse case then oil is already massively undervalued. The market has been slow to respond because the the sting of the recent price collapse but in doing so its also allowed a lot of oil to be burned without the economy making a transition of oil so if its moved slow then the pain will be worse later. A year of low prices will eventually prove to have taken a heavy toll.
Time will tell and the Market will always eventually tell the truth :)
Memmel, my impression of the market price for oil is it is seems to be fluctuating with the DOW. As the market has rebounded, so has the price of oil. Here is a link for oil price:
http://www.oil-price.net/
Oil pricing and Dow fluctuations seem to move together on a daily basis. Almost as if oil price has stablized as high as the economy can handle it without causing a contraction.
E.g. when oil went up to 75, the Dow started to retrace, then when oil hit 67 the Dow started back up. Now oil price is stablized at 72 and the Dow has stablized about 170 below 10,000. If the Dow goes over 10k, it will be interesting to see how the price of oil responds. I would suspect it will test at 75-79.
Or, maybe I'm concluding too much a connection between the two. I just know from watching both for some time now they seem to move together. That doesn't fit the usual supply and demand price dynamic, but maybe the game has changed as peak oil has passed. Maybe now they're just trying to get as much for oil as the economy will support.
Sorry for the late reply I saw your post earlier.
When oil was going up to its last peak the stock market had been heading up for a while but the dollar also started weakening thus it was correllated last time with the weakening dollar and also to some extent with the rising stock market.
Now many people claim the price is being driven by the stock market.
The key is to recognize that oil and money are not different entities and oil or more correctly lack of oil behaves in a sense like anti-gold. Gold also often correlates with the stock market.
Now oil and money are like momentum and position in quantum mechanics they are dependent variables you can split them and you can't measure one and assume the value of the other. In fact you have a sort of uncertainty principle at play what you do notice is if the price of oil is rising or falling one financial variable will be highly correlated other have other correlations some inverse.
It may prove shocking but as the price of oil changes it impact the financial world and this impacts the price of oil.
Now if we used a store of wealth like gold as money the correlations are different and simpler oil behaves more like a simple commodity since its interaction with debt and growth does not impact the money supply.
Now the correlation thats important is when oil becomes correlated with the interest rate i.e if the interest rates fall then the price of oil skyrockets.
Since I think this is the important one if you look back in the past when it hit 140 the price increase was correlated with interest rate changes. Of course there are some time lags here since changing interest rates by the CB does not result in immediate quickening of the feedback loops between interest rates and oil but its the one that matters.
And the reason is again simple since lowering interest rates generally spurs borrowing it leads to higher demand for oil and more debt.
However the end if you will of our civilization occurs when this coupling gets tight i.e the CB is forced to raise interest rates to curb demand and pull in debt as the price of oil sky rockets or to monetize failed debt either you get forced debt deflation with hight interest rates are hyper inflation with relative interest rates to low. You have a choice collapse because of financial games or collapse because oil.
Right now for the moment at least interest rates are still far lower than they should be so the real end game feedback loop has not started. However at some point I suspect in the near future the CB's will be forced to increase interest rates and slow their economies or print beyond reason to cover far more debt defaults then we have had. At some point say if the US is printing 10 or more trillion a year the game is up and interest rates will go up rapidly.
However I think they will never be able to increase them fast enough to quench the use of debt to buy oil. And thats the real underlying problem which is using financial debt to purchase a commodity since once your bankrupt the debt is not paid and the commodity is gone. Any asset you used for the loan is itself devalued since everyone is borrowing to but oil and can't afford the former asset price which has deflated.
The simplest case is buying gasoline with and unsecured credit card then once you can no longer service the debt you default. You got to burn a lot of gasoline and paid very little. Now of course your future access to debt has been cut off but it would have been anyway because you can no longer service the debt you have much less take on more. Any assets you purchased will generally be sold or you stop buying more junk and this devalues all manner of assets used in collateral for loans from the manufactures beyond eventually causing debt defaults to happen far from the central problem which is using debt to purchase commodities esp oil and food.
Eventually you have no choice but to increase interest rates as defaulting on debt used to purchase commodities takes more and more value out of the market.
In general its food and oil that are the critical ones.
But of course increasing interest rates as debt defaults rise simply increases the rate of default and thus the party is over and fractional banking no longer works which was the real reason for fiat and the real problem.
Rising interest rates with rising defaults simply causes money to disappear in a black hole steadily reducing the money supply and attempting to balance oil and money. But oil supply is going down quick no way the money supply can be reduced to match so ...
During the next big price spike a lot more people will default on debt after maxing out the cards buying gasoline if they can. If they are maxed out already then they default representing not paying for gasoline bought years ago.
Companies will of course try to layoff even more workers but they also need people to stay in business and cutting salaries does not help esp as workers are experiencing inflation. Of course consumer spending is dropping so demand is falling also. However what most companies will be forced to do is borrow to cover you guessed it ...
Rising oil costs :)
So again whats really important crops up which is borrowing to buy commodities.
And this the real problem as business themselves begin to default. No one with credit is actually using cash to buy oil !!!!!
And of course as the business go bankrupt the collateral they used for loans rapidly becomes worthless again leading to defaults elsewhere in the system.
The key is that as long is credit is available the financial system will lag the real situation with oil and demand will remain artificially high. In reality the system has passed the point of being able to support much credit at all a long time ago.
Note that oil prices only finally went down when the financial system was collapsed rising interest rates and the resulting deflation was unable to stave off rising oil prices. Certainly keeping rates low will make matters even worse one oil prices start to increase sharply again.
Regardless its rising interest rates and rising oil prices thats important. All the debt default stuff is the sideshow.
And finally since interest rates are not rising and oil is slowly rising and the dollar is falling what your seeing is the multi-national effect. Most of the big companies are global but report earnings in dollars so they look healthy. And rising oil prices is being taken as demand returning and causing the velocity of money to increase. At the end of the day anything that increases money velocity including rising oil prices coupled with a falling dollar will cause the stock market to go up simply as more transactions happen with a devalued currency.
I don't find it all that important whats important is that the real underlying flight to safety in US treasuries has stalled interest rates and its going to get really interesting ( pun intended ) soon.
Thank you for your thoughts Mike. Very interesting read.
So a small extrapolation:
(please correct me and set me straight on my assumptions, extrapolations, and math)
1. the IEA in their 2008 global report says we will need 27MBD new production by 2015 simply to keep things flat. I assume that means that global production will shrink by that amount
2. the gospel of ELM says all of that shrinkage will come out of the hide of global export capacity, which today stands at 44 MBD
To be conservative, I say the IEA is wrong, and we will only need 20 MBD by 2015. the Yet To Find will come thru big time, and we will in fact find another saudi arabia
so we only have to fill 20 MBD not 27 MBD
if you apply some simple arithmetic it is a nice smooth 10% per year shrinkage in global exports
2009 44 MBD
2010 39.6 MBD
2011 35.6
2012 32
2013 28.8
2014 26
2015 23.4
so the only question left is one of timing: when does the break point come? when does the frog in the pot realize the water is getting hotter, then too hot...
See liquid fuel production graphs. NOTE ESPECIALLY:
Declining Exports by Post Peak Countries
Chart 47 showing Mexico's exports dropping 11%/year.
Chart 49 showing Norway's exports dropping 6%/year.
Chart 48 showing UK's exports declining 7%/year.
(averaged over decline)
Peaked countries
Chart 15 showing Non-OPEC crude oil peaked in 2005;
Chart 115 showing Mexico peaked in 2005;
Chart 78 showing Norway peaked in 2000;
Chart 79 showing UK peaked in 1999;
Chart 113 showing Indonesia peaked in 1991;
Chart 113 showing US peaked in 1970.
We must develop alternative fuels ASAP!
Rembrandt
Recommend following graphs:
Imports by oil importing countries
Exports by oil exporting countries
Further detail see:
Imports of Post Peak Countries
Exports of Post Peak countries
Exports of Pre Peak countries
When there's offshore rigs in the middle of the pacific ocean that can no longer produce, then I might believe that oil production has peaked.
First of all, Peak Oil is about declining production rates, not about "rigs that can't produce". Second, the only justification for building oil rigs in the middle of the Pacific, far off the continental shelf, would be if a hitherto unknown non-fossil source of oil were to be discovered. I think you will find that TODers generally prefer to deal with energy sources about which empirical evidence is available, so you are unlikely to encounter anything in the way of support for your views. Never fear: a google of the expression "abiotic oil" will reveal a world in which your ideas will receive many admirers