| "Peak Civilization": The Fall of the Roman Empire | The Oil Drum: Europe | Offshore wind finance: 3 for 3 |
Oil price: where next?
Posted by Euan Mearns on July 24, 2009 - 10:10am in The Oil Drum: Europe
A reduction in global oil production capacity will mean that higher future oil price will be attained at a lower level of demand than in 2008. Is another oil price spike on the way?
One thing that was anticipated in the run up to peak oil was that the oil price would become volatile. Volatility leads to uncertainty creating difficulties for national governments, economic planning agencies and oil companies to plan ahead. One consequence of this has been the postponement of many large new oil field developments creating concern that future supplies may be insufficient to meet demand leading to a new oil price crunch in the years ahead.
So what is the right price for oil? To what extent can market mechanisms be relied upon to strike the right price? Is it possible to make sense of the volatile price signal shown in Figure 1?

Figure 1 Global total liquids from the IEA, data compilation kindly provided by Rembrandt Koppelaar. Oil price data from Economagic. All data are month averages.
Last year Phil Hart provided us with a model to explain the relationship between oil supply, demand and price (Figure 2). Put simply, demand is inelastic in that it does not vary much owing to price variations alone - we still drive our cars even though it gets more expensive to do so. Supply used to be elastic (the flat part of the supply curve), higher prices easily translating to higher supply. In the real world this meant OPEC opening the taps on spare capacity. But then in 2004 the supply rules changed. OPEC spare capacity effectively fell to zero (Figure 1) and new supply became inelastic (steep part of the curve), i.e. higher prices did not lead to a ready flow of new oil since new capacity had to be built, at great expense, using expensive energy. The result was escalating prices and the spike of 2008.
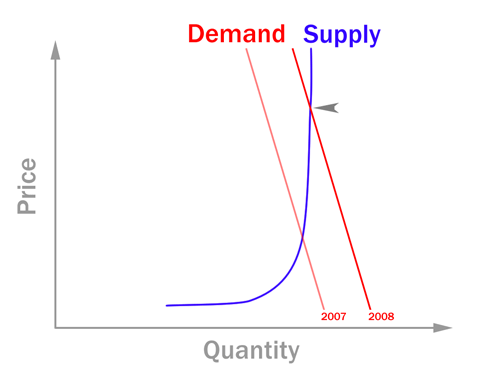
Figure 2 Phil Hart's oil price, supply, demand model.
Somewhat surprisingly (for me at least) cross plotting the data from Figure 1, provides a picture that is still consistent with Phil's simple model (Figure 3). To understand Figure 3, the blue line is a time line, charting the evolution of supply / demand and price since January 2002 through to June 2009. Once production hit 84 mmbpd (million barrels per day) the plateau was effectively reached and expanding capacity in the face of 4.5% annual decline became an arduous task. Prices rose to keep supply and demand in balance until the peak in July 2008 when the economic crisis took hold leading to a collapse in demand.
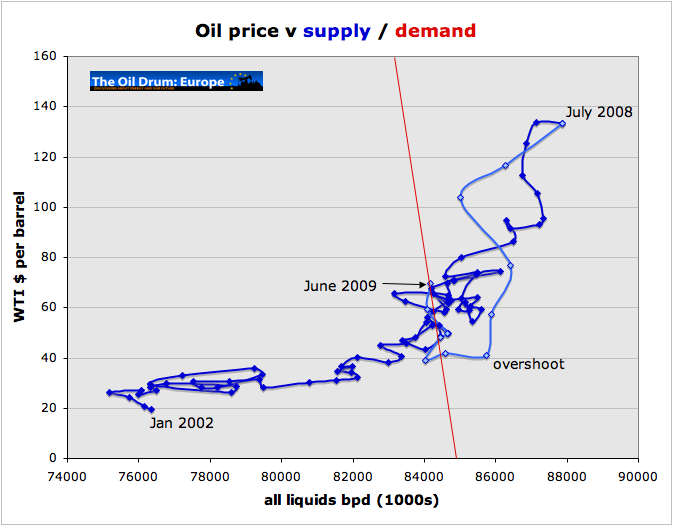
Figure 3 Monthly oil production data (from the IEA provided by Rembrandt Koppelaar) and monthly average oil price data from economagic fit Phil Hart's simple model. The return path since July 2008 is shown in light blue. Marks at one month intervals.
Following the time line down from the July 2008 peak, the oil price overshot its mark by about $40, but since then it seems to have been correcting back towards the trend set during the ascent. First, the price stabilised at $40, tracking left as demand continued to fall. And then demand stabilised at about 84 mmbpd and the price rose from 40 to over $70 per barrel. The June 2009 position is within the trend set during the price ascent of 2006 and 2007, and on this basis I'd conclude that we have seen a correction back towards market equilibrium rather than a "dead cat bounce" in oil price.
The integrity of this trend from January 2002 to June 2009 is surprising since there have been large movements in OPEC spare capacity, which is adjusted to maintain supply in balance with demand. I suspect the fundamental reason to explain this is that global production capacity has remained fairly constant throughout this period. If there was to be a dramatic increase or decrease in productive capacity then this trend would break down
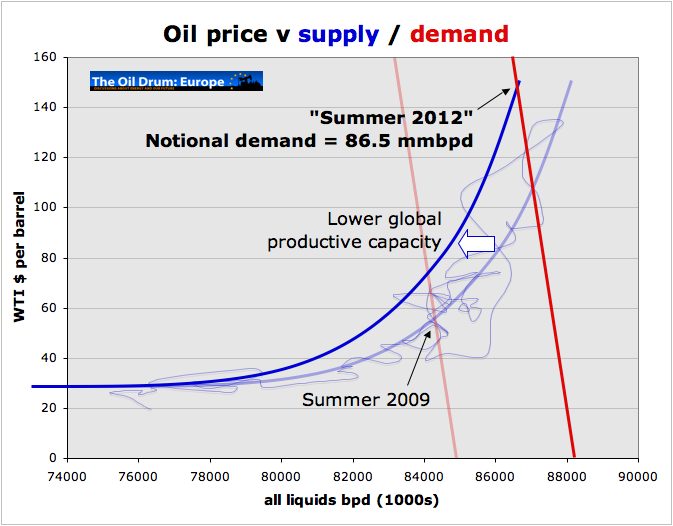
So that leaves the $60,000 question. Where next for the oil price? I believe that plateau supply of 84 to 88 mmbpd are secure for a couple of years as this summary of mega-projects compiled by Tony suggests (Figure 4). Therefore, the near term price will be controlled by demand. If the trend of Figure 3 holds good, then we could expect prices to rise towards $80 / bbl if demand rises by 2 mmbpd (likely spiking higher than that) or conversely falling to below $40 / bbl if demand drops a further 2 mmbpd, which is the scenario considered by Rune last month.

Figure 4 TOD megaprojects production capacity forecast compiled by Tony Erikson.
Longer term, productive capacity will begin to play a role and one can envisage how a fall in capacity of around 1 mmbpd may shift the supply demand relationship to the left. Combined with marginal growth in demand will result in a new price spike as shown in Figure 5. It is impossible to be precise on timing, but my best guess would be 2012±2 years, subject to the global banking system surviving the current crisis and the global economy resuming growth in 2010.
Figure 5 Scenario showing how a drop in productive capacity of around 1 mmbpd may move the supply curve to the left, combined with an increase in demand from 84 to 86.5 mmbpd, may result in a new oil price spike in excess of that seen in July 2008. Squiggly line is real data from Figure 3.
In a recent post I argued that there was a limit to the oil price that the global economy can bear. Any new price spike, as the name suggests, will be short lived as high price will kill demand and we will likely see a repeat performance of the 2008 crisis. At some point global leaders need to awaken to the prospect of that supply curve marching to the left, always.
Personnel
Editors
Contributors
Peak Oil Primers
Archives
- November 2010 (3)
- October 2010 (6)
- September 2010 (4)
- August 2010 (7)
- July 2010 (6)
- June 2010 (7)
- May 2010 (2)
- April 2010 (8)
- March 2010 (4)
- February 2010 (6)
- January 2010 (3)
- December 2009 (5)
- November 2009 (8)
- October 2009 (12)
- September 2009 (6)
- August 2009 (5)
- July 2009 (11)
- June 2009 (8)
- May 2009 (16)
- April 2009 (10)
- March 2009 (7)
- February 2009 (10)
- January 2009 (15)
- December 2008 (9)
- November 2008 (9)
- October 2008 (9)
- September 2008 (13)
- August 2008 (10)
- July 2008 (14)
- June 2008 (23)
- May 2008 (16)
- April 2008 (12)
- March 2008 (16)
- February 2008 (9)
- January 2008 (13)
- December 2007 (13)
- November 2007 (16)
- October 2007 (22)
- September 2007 (8)
- August 2007 (9)
- July 2007 (16)
- June 2007 (8)
- May 2007 (7)
- April 2007 (7)
- March 2007 (10)
- February 2007 (10)
- January 2007 (12)
- December 2006 (9)
- November 2006 (15)
- October 2006 (4)
- September 2006 (5)
- August 2006 (5)
- July 2006 (9)
- June 2006 (5)
- May 2006 (10)
- April 2006 (9)
- March 2006 (13)
Vital Trivia
License

This work is licensed under a Creative Commons Attribution-Share Alike 3.0 United States License.
I think peak oilers generally underestimate the ability of the demand curve to rotate counter clockwise to become a more shallow slope.
As someone with no formal education in economics I hesitate to criticise, but it does seem to me that the demand curve for 2009 should be shallower than that for 2008, reflecting the fact that in the hard times we find ourselves in fuel is more of a luxury (greater elasticity of demand) than in the recent past. The two curves would intersect the x axis at the same point. You would still get an intersection of supply and demand at a lower price.
Don't worry, even economists have no formal education in economics. I took a class in college where the teacher wrote a long equation on the chalkboard, stepped back, and then quickly erased it, saying that is the last bit of math that we would see.
The difficulty with supply/demand curves for people to grasp is that they are one of the best examples of implicit mathematical formulations that you will run across. My theory is that since math teachers do not understand implicit equations themselves, no one else really gets these either.
The math behind economics has a huge learning curve. Just look at the squiggly line that Euan has in that figure, as it has multiple multi-valued points. There is no gradual build-up in working economics out, its like you learn to add currency in explicit terms, and then bang!, you have the implicit supply-demand curves.
So the fact that peak-oilers fail to see how these supply-demand curves work, I would contend that no one really can see how this works. It is not how we have been trained in mathematics.
Nicely stated. One can never abuse economists too much. They are all fair game.
excellent , thats going into my sig - if you don't mind!
cheers
Forbin
Don't be surprised if you get replies online from people like me--an economist who's run a site about peak oil and climate chaos for over five years and gives public presentations on those topics--calling you very rude names for painting with such a broad, willfully ignorant brush.
After all, anyone who does something that counterproductive is fair game.
thanks for your concern, lou.
I have no troubles with this one, though....
"Oil - anyone who thinks you can continue to use finite resources indefinitely is either a mad man or an economist."
I'll refrain from the other one then, might be pushing my luck!
Cheers
Forbin
Did anyone else see the cover of the recent Economist magazine?
http://www.economist.com/printedition/displayCover.cfm?url=/images/20090...
Then there's the cover of the most recent Adbusters mag.
https://www.adbusters.org/magazine/85
Are those supposed to be economist beating someone up or a gang beating up an economist?
Any good ideas on solving the explicit equations as shown in Phil Hart's Figure 3? Doing it graphically is one thing, but I imagine there is some other way to do it. Shouldn't be too bad with an implicit equation solver and an interpolation scheme..
For those wanting to know more about how flawed neo-classical economic theory is, you might try following Steve Keen:
http://www.debtdeflation.com/blogs
I agree that the demand curves do not need to be straight or have same gradient over time, but this is a simple model. One also needs to recall that this is a global model, and not one exclusively for the US or OECD.
True, hardship may reduce the slope, whilst lower price is fighting to steepen it.
Never underestimate the power if explicit and implicit subsidies. Assume oil went to 200 and Obama introduced a 2000 per person economic stimulus check etc.
Or other less obvious subsidies. And of course China has cash to underwrite subsidies.
Given economic contraction is economic suicide for fiat currencies one has to imagine that they will print until it does not work.
Gotta move to Oregon so later.
A couple of points. All currencies that are fiat given that they are worth what people believe they are worth. If the belief disappears then the value of the currency drops according to that belief. So the term "fiat currency" is redundant.
For the government to issue $2,000 stimulus would mean the economy was in far, far worse a state than it is now. For that to happen unemployment would likely be in the 25% range. There is no way we can gauge what such a desperate measure would have on the price of oil... or other commodities for that matter.
What is the maximum price of oil before a total economic collapse? I believe that is the question even though the word "before" is only implied. And to what extent does is the supply and price of oil responsible for the state of the economy. That is, how high can the price of oil go without causing the economy to collapse.
Everything in the economy is tied together, interwoven in a very complex economy. To what extent did the housing and then the banking collapse cause the economic crisis? And to what extent was the high price of oil responsible for the housing and banking collapse?
That is where most of us made our mistake last year. Most of us simply assumed that demand was largely inelastic and the price would eventually hit $200, then $300 and higher as demand stayed static while the supply declined. It never dawned on us that a the economy was about to suffer a near meltdown. And we were all shocked at the dramatic effect this had on the price of oil.
There is no doubt that the price of oil has had, and will continue to have, a strong effect on the health of the economy. And that effect will determine just how high the price of oil can go.
Ron P.
"To what extent did the housing and then the banking collapse cause the economic crisis?"
90%
"to what extent was the high price of oil responsible for the housing and banking collapse?"
10%
On the contrary, 0% and 100%. The housing and banking collapse were (very) arguably caused by rising oil prices.
The collapse was inevitable.
147 Oil was the trigger event.
The housing collapse was caused by a huge departure of housing prices from historical ratios of housing affordability. Housing was a classic bubble. Oil prices certainly helped it pop and oil prices helped it pop more dramatically in the exurbs. But the prices were unrealistic and would have popped eventually anyhow.
This is easy to see by googling on ratios for housing costs to income and other similar ratios. You can find housing affordability indexes and ratios that stretch back over decades. Starting in the mid 90s those indexes and ratios started on an unsustainable bubble path.
Do let this site's oil obsession blind you to other causes of historical events. I say that as someone who writes on my own blogs about the approach of Peak Oil and about how our lives will be disrupted by Peak Oil.
The housing bubble was starkly obvious as it was being inflated.
The metrics you refer to are both simple and intuitive.
Makes you wonder if Greenspan et al are idiots or criminals.
porge, Yes, the housing bubble was extremely easy to see in a graph over time. Glaringly obvious. The departure of the US from a historical ratio of buying a house about 3 times yearly inncome wasn't caused by Peak Oil.
Lenders raised allowable debt-to-income ratios above the historic 28% (28% of income going to housing debt service, home insurance, and other ownership expenses) and this caused the housing bubble. Historic percentages of home ownership departed from trend in 1995. It took all the way until 2006 before the bubble started to burst and it is still bursting.
Peak Oil helped pop the bubble. But it was going to pop anyway. All bubbles come to an end.
Not so coincidentally, guess what other "charts" departed from historic trends in 1995?
Put any of the major Stock averages on a log chart and you will see the line up-tilt starting in 1995.
The NASDAQ of course being the most ridiculous.
It was explained away as the "peace dividend" because of the reduction in military spending after the cold war ended.
All this nonsense is a result of America tuning into a nation of paper pushers and gamblers for lack of real work. Between technological advancment making many occupations obsolete and off-shoring anything that could be people just turned to grabbing whatever they could grab.
Speaking in "isms"
America has gone from capitalism => financialism=> swindlism=> I guess next is collapsism??
The 700B stimulus package (which isn't including the bank or auto bailouts) works out to $2300 per US citizen.
EIT!
Darwinian,
you wrote "All currencies that are fiat...." - this implies that there are currencies that are not fiat, i.e. have constant value. I think this is not true,
a l l c u r r e n c i e s a r e f i a t
While the gold bugs are howling, think about it: you cannot eat gold, and it does not keep you warm. In a real crisis, people will sell their gold and try to buy wheat and fuel - poof goes the value of gold. Anybody who thinks a real (Western Roman Empire, 3rd or 5th century AD style) collapse is coming, should not buy any currency, but only real value (canned food, seeds, guns, ammo, fire wood, diesel fuel etc.)
or, reading further down your post, was this exactly what you meant?
Biologist, that was a typo on my part. I meant "All currencies are fiat". Sorry for the typo.
Ron P.
currency is too hard to define.
Fiat means "by decree".
So if we used say something of utility like salt as currency than it would be barter right?
If it is a marker you are correct about the confidence game but if the "currency" actually has another real use to me then it has value separate from the function of money.
Energy/resourced based economics solves everything.
"While the gold bugs are howling, think about it: you cannot eat gold, and it does not keep you warm. In a real crisis, people will sell their gold and try to buy wheat and fuel - poof goes the value of gold"
Biologist, Why would anyone want to eat money? Because that's what gold is, money. Or do you think we will go back to bartering? It's easy to forget just how useful an invention money was, e.g. for those occasions when the person with the cow didn't want to trade it for your beans. And gold has, over centuries, proven itself the perfect money. Not for any abstract reasons but because it has all the properties that make it perfect for the job - divisibility, durability, scarcity, portability, hard-to-forgeability etc. Can't say the same for paper currency or its electronic equivalent with which trust is implicit and required. When that trust breaks down what form of money will people turn to? Interesting that Zimbabweans have been panning for small amounts of gold to buy bread with.
Don't confuse arguments about what should best be used as money with the underlying usefullnes of money.
TW
"food's so high today it's durn near cheaper to eat money," quipped Dick Gregory Monday as he spoke to a packed in audience at Evans Auditorium. ..."
http://news.google.com/newspapers?nid=1065&dat=19740221&id=IbUMAAAAIBAJ&...
Ron wrote:
"There is no doubt that the price of oil has had, and will continue to have, a strong effect on the health of the economy. And that effect will determine just how high the price of oil can go."
Another possibility is that oil goes to the highest bidder AND there are still players that can afford oil while an increasingly large number of people cannot.
Demand is likely to be very fragmented across economic social status and across local, state, and nation-state boundaries. It is more complex to think of it this way and the 'supply & demand' curves become infinite and fractal in nature.
To clarify my previous comment, the aggregate demand/supply intersection for global oil may be deceptive about what is really happening--changing 'access' to oil in a probable scenario where the price continues to rise, particularly in the long run--regardless of the economy, say, of the United States, a debt-ridden nation state whose primary user of oil is the military-industrial complex which will continue to use its share despite the poverty of its citizens.
Thank you for this insightful data plotting Euan.
Euan,
"Put simply, demand is inelastic in that it does not vary much owing to price variations alone"
This is true short term, but we have evidence that over a longer time period( several years) structural changes are made in response to high prices. For example in US after 1980, a big reduction of oil used for electricity generation and heating oil replaced by NG and electricity.
On the 5 year horizon, we should see a shift to higher fuel economy vehicles and PHEV's, perhaps some conversion of light trucks to CNG, further replacement of heating oil, a reduction in jet fuel and further replacement of gasoline by ethanol(10E to 15E). These changes could account for a 20% reduction in oil consumption in US.
I agree that time scales are important. There's a number of things going on - poorer folks simply doing without, others opting for more fuel efficient solutions and substitution - EVs, electric rail etc. All this to some extent balanced by expansion of car ownership etc in the developing world.
Euan,
If the demand curve is really that steep over a short time period, that would indicate that people don't give up driving if they have a car, after all fuel is only a small part of the budget. What I find surprising is that people don't seem to even moderate driving very much based on fuel prices, this may be because once you have a vehicle most of the costs are still there(payments, insurance) even if its parked, and alternatives such as taxi, public transport can be expensive alternatives compared to just fuel costs.
Will the curve actually become steeper in time as people who can use mass transit switch and vehicles become more efficient, the remaining lower consumption will be really non-responsive to prices, perhaps requiring rationing to stop ridiculously high prices.
I think your right about people's driving, especially in rich countries. Most people only make major changes in their behavior when they encounter a crisis. Not all people are this way, but most are.
I'm not sure you're right about the demand curve in the future. I'm skeptical that it can get meaningfully steeper in the US, anyway. OTOH, if volatility becomes the norm, people may get more adaptable, making for more elastic demand and a shallower curve. I wonder, for example, if Iraq might currently have a much shallower curve than many other places, given all the adaptability people have no doubt had to learn there in the last few years. I'm speculating, but it seems plausible to me. Cultural and political factors will play a role. It seems like there are various plausible scenarios.
As Euan said above, the demand curves shown in the graphs look like linear functions (not curves at all actually), but that's a simplification, too.
I think you are correct -- right now many people think of their energy use as inelastic because they "have to" drive 45 minutes each way to work, or "have to" drive to the supermarket down the street, or "have to" run their air conditioning during the summer and heating during the winter.
Just imagine how much less elastic it will become after people simply have to quit those jobs with a 45 minute drive and either telecommute, train, etc, because fuel is either prohibitively expensive or unavailable.
OTOH, once energy consumption collapses far enough, renewables will actually be able to produce a fairly large fraction of our actual energy "needs" (or at least so I hope).
I suspect we will simply redefine "inelastic" over time, until our energy use is forcibly no larger than that we can generate quasi-sustainably (I say quasi because I question humanity's ability to actually exercise the discipline to not consume all resources it can find regardless of the long-term cost).
My use is inelastic (because I have plenty of income to pay for gas) as long as I remain employed. I think this is key -- demand destruction will necessarily be driven by either fuel rationing or job/wage loss.
I think jobs will be the eternal focus -- people were go wherever the jobs are, and will do whatever they can be paid to do.
Unfortunately, as jobs go away and are slowly recreated, the new jobs will be lower-paying, so wages WILL go down. How can it be otherwise?
Euan, the best information presentation is that which describes complexity with a simple a gaze and is inspirational.
That Figure 3 is brilliant. That chart speaks volumes about the supply curve and demand destruction. Figure 4 is also excellent. Based on these two alone, this should be one of the posts of the year.
Is figure 4 NET (net of depletion) additional productive capacity?
In figure 4, how much of the NET additional productive capacuty is NGLs versus others (conventional etc.)?
Well said. I concur regarding Figure 3 in particular.
Thank you Mr Cagney. I'll let Tony answer your question. The megaprojects list includes C+C+NGL and syncrude (I believe) but I don't know the split. I think its time we had a megaprojects up-date.
Hi Buster,
Figure 4 represents gross capacity additions of crude, oil sands, condensate, NGL, GTL and CTL. Ethanol is excluded. To get forecast production additions, a discount factor of about 15% should be applied.
NGL capacity additions can be calculated by adding up NGL additions from each year of the megaprojects data. As an example, 2008 and 2009 NGL capacity additions are shown below.
From 2008, 310 kbd NGL from Saudi Arabia and 180 kbd from Iran.
http://en.wikipedia.org/wiki/Oil_megaprojects_(2008)
From 2009, Iran 80 kbd, Qatar about 300 kbd, and Saudi Arabia 280 kbd and UAE 135 kbd.
http://en.wikipedia.org/wiki/Oil_megaprojects_(2009)
Please note that these NGL capacity additions aren't having the expected impact of increasing world NGL production. To the contrary, world NGL production is decreasing. 2007 was 7,956 kbd, 2008 was 7,938 kbd and 2009 YTD average April was 7,878 kbd.
http://www.eia.doe.gov/emeu/ipsr/t13.xls
Nice work again Yoon. (you clearly has an Apple product to make those graphics..)
I think your Figure 3 is excellent, but may lead to false conclusion that high price in July 2008 created the downward light blue line that follows. There were many other impacts afoot that aren't encapsulated by price/production.
To wit, the US FED monetary base, (the blue line), which had been increasing at 45 degree angle for some 90+ years, went straight up after July 2008 in the below Federal Reserve Graph:
I.e. it was not oil price that caused the demand drop, (though it likely contributed), but a massive global margin call and subsequent (and ongoing) credit crisis. My guess is you could create similar monthly supply/price graphs like Figure 3 for most commodities and they would all peak in July 2008 and have a similar looking retracements - this would be interesting endeavor. (except gold and maybe a few others - pork bellies, etc.) But I suspect think mathematical formulations and correlations at this point can only get us so far - the degree that fiat instruments have pulled our system away from physical reality won't be graphically 'known' until years in the future.
Here is another chart showing how this is much more than oil supply problem:
If current estimates hold, Q3 2009 will be first quarter since data has been kept when SP500 earnings will be negative (they are down 98% from Q3 2007 peak currently)
In any case, the most important point of your post is the last sentence:
Rhetorical question: if we could PROVE that supply has hit a wall, and that demand would dictate price of oil from here on out, would it change anything? I.e. would indications of permanent leftward shift of supply curve suddenly make policymakers change to a better course? I suspect not but, as always, hope that I'm wrong.
Whilst agreeing that there were / are a multitude of reasons for the July 2008 correction, I do believe that energy prices / scarcity was a key issue. If oil supply could have risen easily to 95 mmbpd, $30 / bbl, I suspect that economic leveraging would have continued onto new tiers. I suspect this may be why the economists "didn't see it coming". Algorithms and policies that worked for decades suddenly broke down as folks were spending too much on energy and not enough on everything else.
precisely, the real keys are "why didn't we see it coming" and "why do we never learn from things we don't see coming". If one were looking for the next great insight it would be to look for the great contradictions that everyone ignores.
It's ridiculous that the 6 year commodities price spiral, only ending in the collapse of finance and demand, clearly conflicts with all the laws on economics on which the macro-economic models are based and no one noticed. Wouldn't one think such a thing would raise a vigorous discussion? Nope, no one's really interested, seeming to do with it pushing people beyond their comfort zones.
Nate--I can suggest and suspect that the sudden switch to downward oil prices-- the downward light blue line--was partly something to do with speculation (in the quazi-opposite direction to the Matt Simmons' hypothesis). But those two graphs you've put there, most interesting as they are, I fail to see how they would not be direct consequences of oil becoming too expensive, to a point of crossing some balance-sheet thresholds. Surely that would obviously make S&P earnings nosedive (along with airlines), and also cause the massive global margin call.
By the way, there's no such thing as a 45% gradient unless the x and y axes are in the same units of measurement. (And on my screen it looks more like 18% anyway. (Maybe trig isn't your hottest talent?!)
Figure 3 caught my eye as well. I'd like to think there's a definitive strange attractor buried in there.
I'm thinking that another illustrative graph would be instead of plotting oil production vs. price, plot oil production vs. the relative value of oil to other necessary goods. The WTI price divided by the price of a bushel of wheat and/or the price of copper. Maybe further expand by relating to the agricultural and commodities indexes.
If I can get motivated, maybe I'll try to throw something together.
I'm surprised that no one picked up on your comment, 710, because it's apparent that the USD is being manipulated and stressed at the same time, so our oil/$ plots are a convolution of two independent variables.
I'd like to see your WTI versus ag commodities alternative plots; graphing oil price versus other industrial commodities (like Cu) might be more meaningful to models of the developed world.
You could model it on a second order differential equation reacting to unit step unit of input as in control theory.
Price(t)=A*diff(x*x,t)+B*diff(x,t)+C*x(t)+ K1;
The step input K1 would be the sudden entry of the various BRIC/developing economies demand into the world oil trade(something that won't change IMO). The amount of overshoot would depend on the value of B/A.
If B/A=0, there will be an endless cycle of price spikes and crashes(not the case here).
The gradual onset of peak oil(-2% per year) effect of Peak Oil would have a much less dramatic effect on increase in prices than the entry of BRICs as it would resemble a unit ramp input.
Price(t)=A*diff(x*x,t)+B*diff(x,t)+C*x(t)+ K1 + K2*diff(x,t);
Unfortunately, it reduces B to B-K2 it suggests greater volatility in a tighter range(which is attractive to speculators--not investors).
Of course, all this presupposes some kind of consistent pricing model acting like a second order diffeq which is rather dubious.
Do you have any examples worked out?
Is diff(x,t) a delta/difference formulation?
If you like but I can't find freeweb posting anymore for results. Why doesn't TOD offer it?
diff(x,t) is Maple-speak for dx/dt.
The only reason I used a second order diffeq was that that function gives overshoot(so I manifest curve-fitting disease).
But I thought to give it a go after all the IPCC models the entire planet climate as a first order diffeq
LOL ;-)
One question is whether the forcing is a step function(actual upsurge in BRIC demand due to globalization) or dirac's impulse function(crazy doomer speculators).
What is interesting is what is the Peak oil forcing function?
I chose unit ramp for slow steady depletion cause slow stead increase in price. If so it also reduces the overall system dampening(very bad).
Based on this model, rather than see immediate skyrocketing oil prices(unit step) you would see greater price swings clobbering a manic world economy as prices inexorably rise(unit ramp).
All just fun mathematical speculation.
Try something, I'm interested but I am not a mind reader.
Okay-dokey WHT,
The base price is $50/barrel. The year to year per dollar increase based on 2.2% depletion is $1.1 per barrel(2.2% x $50), the effect of BRICs entering oil market is $50 per barrel step function--a one time disruption. Time is biannually, so 50 units is 25 years. It's an exercise in curve-fitting but at least it differentiates big events like globalization from incremental ones like a 2% depletion rate.
Too bad it isn't as wild as the usual models at TOD.
> ode := |-- y(x)| + 0.2 |--- y(x)| + y(x) = 50 Heaviside(x) + 1.1 x + 50
> ics := y(0) = 50, y(1) = 100
> serias := dsolve({ics, ode}, y(x))
>plot(rhs(serias), x = 0 .. 100, y = 0 .. 300)
Here is Figure 3 extended back to 1970, with Tony Eriksen's May price prediction plotted in green (zero-scaled, price inflation-adjusted, production as crude+lease rather than total liquids):

Tony's projection ought to plot a locus of supply / demand line intersections - i.e. a locus of the intersections of your red and blue curves as they vary over time. But it actually looks pretty much like a straight line at a slope much like one of your red demand lines.
Guess that means the demand curve is what governs price once supply becomes scarce ... which is what you said, of course. So we get a phase shift from predominantly supply controlled price to predominantly demand controlled price.
G.
Gergyl - great chart! Any chance you can plot and post the time series (like my Figure 1) for the 3 data series you have (including Tony's forecast). The circular group is quite intriguing - it would be interesting to try and understand the process of its formation.
Tony's negative gradient curves represent rising price with falling production - which I always had on my diagnostics list for peak oil. I think you'll find the data are plotting the locus of intersections of supply and demand - falling supply playing a key role. Whilst Tony has a bit of volatility in his model, I think the real world will be much more volatile.
Euan,
Thanks for the great post. You and Gergyl have identified the wall clearly.
Dave
Great chart which I will add to my collection to wake up people with.
However, you overlook that there is a time-factor hiding in there. Supply is vvvery inflexible in the short term. Arguably it's now becoming very inflexible in the anything-at-all term too. But you can see on that same chart how it has been flexed upwards by 10mbd since the opec crisis (and less short-term inflexible back then, due to spare cap "on tap").
The circle would reflect an oscillating condition with a 90 degree phase shift between supply and demand -- in other words 1/4 of the period - wouldn't it? I suspect that is a function of the real-world delay in funding new projects, overshooting production, then swinging back the other way, shutting down rigs, etc.
I had seen other comments postulating the rapid rise in oil price was due to a shift from marginal cost of supply (which is slowly going up now) to the marginal cost of demand (which was high when everybody felt rich, but is likely lower now). If this view is accurate then we're going to bang back and forth between these until they converge, and then there might be less volatility but still some nasty economic realities as the wall marches left.
Hi Gregyl,
This is an excellent graph. I wonder if you could color the upwards spikes of early and late 1970 separately so that we could see the run up and fall back pattern. I bet it looks very similar to the 2008 price spike and collapse, despite the lack of a banking system collapse, but it would be very interesting to see for real.
As prices are rising by monetary inflation, and whole US economy was changing structure, I wonder how the Y axis could be rescaled to get a better comparison? Perhaps size of energy sector as % of GDP? Such as Euan wrote for his piece on the maximum price of oil?
I posted this a couple days ago in another comment but it's worth adding here.
I remember this from last year. Is this now updated? Can you clarify what is going on with the two data clouds in the 50 to 60 mmbpd range? What is the time range for the plot?
This is updated to April of 2009 (goes all the way back to January 1973). The Upper Cloud in the 50-60 MMBPD range is the period from 1979 to 1985 where the oil production peaked and then fell and oil prices were "high" (and they would be if chained to any particular date). Finally, prices fell rather steeply in late 1985 and then returned back to the Lower Cloud.
You can see this on the left side of this graphic which includes the same data as the curve previously posted.
More likely the supply did not change simply the reported numbers change. In fact I suggest this is a pretty big smoking gun that indicates that nothing has really changed as far as real oil goes.
Is it not possible that as long as there was ANY spare capacity that pricing was driven by the marginal costs of production, and only in 2009 did the spare capacity drop to effectively zero, entering a demand-control phase?
Fear not! All will be well.
This return email from the CEO of a government institution a few hours ago...
"I share some of your concerns about the planet's capacity to absorb population growth and what strains that growth will place on our ability to meet the needs of the international community. However, I think we can take comfort from the ingenuity of the human species and its ability to meet the technological and material challenges that lie ahead. My advice to the younger generation is 'be concerned and be watchful, but also be optimistic about humankind's ability to overcome the challenges ahead'."
Regards, Matt B
PS. The institute's motto reads: "There are no limits"
Sounds like they probably have more "Economists" than physicists and "Real" mathematicians on staff.
It is precisely when I hear BS like that, that my optimism for humankind's ability to overcome the challenges ahead, tends to wane considerably.
On the other hand, there doesn't seem to be a limit for humanity's capacity for self delusion.
ah got it!
"There are no limits - for humanity's capacity for self delusion."
thats the bit missing.........
Forbin
I'm just about to walk past an office block whose door proclaims "Only enter with a can-do attitude". To which I think: A can-make-pigs-fly attitude? Can-turn-water-into-oil attitude?
PS--the business in question has gone bust.
I wonder if there would be a difference between this CEO's viewpoint and the CTO's? The thing that really strikes me is how passive his `advice' is: 'be concerned and be watchful, but also be optimistic'. If he was suggesting that he and everyone getting his advice were to start developing this future (rather than the nebulous "ingentuity of the human species"/"humankind" who are somehow always supposed to be dramatically more ingenious and inventive than the speaker is) I might start to take him seriously.
Great work Euan! Peak oil is defined here in historic terms:
"...in 2004 the supply rules changed. OPEC spare capacity effectively fell to zero (Figure 1) and new supply became inelastic (steep part of the curve), i.e. higher prices did not lead to a ready flow of new oil since new capacity had to be built, at great expense, using expensive energy. The result was escalating prices and the spike of 2008."
That's the crossover point from peak oil at 147 a barrel, to post peak. Volatility in price will now act a braking system on the world economy. As depletion of oil, along with temporary bursts in economic activity, followed by skyrocketing oil prices, then huge drops in economic activity causing massive drops in oil price, volatility will become the EKG warning signal that our economic blood pressure is out of whack, with the heart of our industrial acitivity lurching and lunging like a train screeching to the end of the line, into obsolesence.
Live under the veil of phantom capacity, by demanding and extracting ever greater flows of liquid energy, only to awaken to an all too nightmarish reality of post peak economic collapse.
US average annual oil prices rose at about +20%/year from 1998 to 2008. In response, US demand in 2008 was back to the same level as 1999, 19.5 mbpd. However, I was struck by the number of poorer developing countries that showed increasing consumption over this time period, which was somewhat contrary to what I had been expecting. For example, Kenya's oil consumption (EIA, total liquids):
Recently, I have reviewed the net export histories of four former net exporters and 12 net exporters showing lower production (relative to a recent peak). In all 16 cases, the net export decline rate exceeded the production decline rate (or rate of increase in production in the case of China). And the former net oil exporters, plus many declining exporters, show an accelerating rate of decline in net oil exports.
One of the criticisms of the export model is that exporters would reduce their consumption in order to maintain their net exports, or in order to at least reduce the rate of decline to the same rate as, or a lower rate than, the production decline rate. These 16 case histories plus the tendency for many developing countries to show higher consumption despite higher oil prices would seem to make this scenario very unlikely.
A link to the discussion of this topic:
http://www.theoildrum.com/node/5595#comment-521884
In summary, the export model suggests that: (1) The Net Export decline rate will tend to exceed the production decline rate; (2) The Net Export Decline rate will tend to accelerate with time and (3) Net Export declines are front-end loaded, e.g., Indonesia, after hitting a final production peak in 1996, shipped 44% of their post-1996 cumulative net oil exports in just two years, in 1997 and 1998, when they shipped one percent of post-1996 cumulative net oil exports about every 17 days. Sam's modeling work suggests that the top five net oil exporters are currently shipping one percent of their post-2005 cumulative net oil exports about every 50 days or so.
And US average annual oil prices (left scale) versus combined annual net oil exports from top five (EIA):
From 1992, the initial data point on the graph, it was 13 years to 2005. 13 years after 2005 would be 2018. Sam's best case is that the top five net oil exporters will be collectively down to 15 mbpd in 2018 (his middle case is 10 mbpd).
"We got 5 years, that's all we got..."
-David Bowie.
Actually less than 10 -coupled with the graphs above this implies that the price swings are going to decrease in period, so something like $150>$$40>$150 in 5>4>3>2 years, and given the fiat currency injections the lows will be higher and the highs will be higher....
$40>$147>$40>$180>$50>$225>$62...
Just a guess...
Nick.
WT
I was thinking about your previous post with the four sample cases of ELM and the decline in exports.
I thought - what if you treat the world as one ELM country i.e. total production (I was focusing on crude only) is 74MBD. Total exports are 44MBD (according to Rembrandt)
decline rate is 5%
assume no growth in consumption
its a pretty terrifying view of projected decline in available export capacity
and I realized that when you are taking the top five exporters (in your previous analysis), you are actually focusing on the end of the tail because these countries will last the longest - so it doesn't seem so bad
its all the other countries that will cause the steep drop in the first few years.
Im reading The Prize (actually very good) and Daniel Yergin has some good observations on the 1973 oil crisis. The embargo only reduced exports about 17% - 18% globally, and yet prices went up five fold.
Consider some smaller exporters. Canada, Mexico & Venezuela are major net oil exporters, and three of the four largest sources of imported oil into the US. Their combined net exports fell from 5.0 mbpd in 2004 to 4.0 mbpd in 2008.
And as I have noted before, high flow rates can be extremely misleading, e.g., Indonesia's net exports increased in 1998, relative to 1997, so that the 1998 net export rate was only 9% below the 1996 rate, so not much to worry about? Unfortunately, by the end of 1998 they had shipped 44% of their post-1996 cumulative net oil exports.
And BTW, China is a good example of the difference between Peak Oil and Peak Exports. They went from a recent net export peak of 620,000 bpd in 1985 to net importer status in 1993, even as their production increased.
EIA total liquids for China:
Four Former Net Oil Exporters
Production & Net Export Increases/Declines Per Year, Over the Referenced Time Frame, Are Respectively Shown (EIA, Total Liquids)
China (1985-1992)
+1.8%/year (Prod.) & -16.9%/year (Net Exports)
Indonesia (1996-2003)
-3.9%/year & -28.9%/year
UK (1999-2005)
-7.8%/year & -55.7%/year
Egypt (1996-2006)
-1.7%/year & -29.3%/year
And note the increase in consumption by Egypt, especially from 1998 to 2008, as oil prices increased at about +20%/year on average:
Clearly a product of some value...
So summing up when will people/Govts 'get it' and what's going to be the likely impact??
Nick.
(When are you publishing?)
I think that Sam is going to be crunching some numbers when he gets back from a trip. I'm probably going to do something in the mean time on the 16 case histories.
Regarding the first question, I don't know, but I frequently use the "Sixth Sense" analogy, as in the movie (many ghosts don't know they are dead, and they only see what they want to see), for most Americans our auto-centric suburban way of life is dead, but we don't know it yet, and we only see what we want to see.
I know Kenya did a lot of road work between 2002 and 2006. They worked on the Nairobi-Mombasa road which had gotten really bad. I never traveled the Mombasa road, but the other roads they worked on that I did travel, went from very poor quality to American quality. I can see how this would account for some increase in petrol usage since it makes it much easier to travel. The construction itself probably consumed a lot of fuel.
Aside from that I don't know what would account for the increase, other than just a general increase in economic activity.
Egypt is shown above, and some more examples:
Brazil:
http://tonto.eia.doe.gov/country/img/charts/BR_cons_large.png
China:
http://tonto.eia.doe.gov/country/img/charts/CH_cons_large.png
India:
http://tonto.eia.doe.gov/country/img/charts/IN_cons_large.png
Thanks Euan,
I couldn't agree more with the supply/demand model Phil Hart so nicely described for us. I work in the commodities trading world and during the March to mid July 2008 it seems to me a portion of the crude price rise was due to large players seeking an inflation hedge on a feared weakening of the US dollar. I believe the dominant factor was however supply and demand. Does anyone have any information that can tease apart how much was due to hedging and how much of the price rise was due to supply/demand?
The hedging involves many possible sources, investors running away from shaky assets elsewhere and getting into markets to ride up that are both in short supply and the system treats as necessities. The concurrence of the same basic pattern for all commodities, points to the whole divergence of the price structure being part of a natural reaction to hitting a "stuck point" in supply responding to demand. So, I'd say if you added in all the different hedges that pushed up the price in a completely uncharacteristic way, I'd say it was 100% due to hedging.
Something that I am afraid trips up many people: The published oil industry data labeled as "demand" is not exactly the same thing as what economists would call demand on a supply and demand graph.
I have found it best to think about the oil industry "demand" as actually being "withdrawals from inventory". Production is "additions to inventory". As long as there is inventory, it is possible for "demand" to exceed production - for a while, until inventory is drained down to MOL. Similarly, it is possible for production to exceed "demand" - for a while, until storage capacity is full.
It must be understood that as the system gets close to full capacity, there is considerable pressure to move the inventory out to consumers; producers really don't want to mess around with production flow rates if they can avoid it. Thus, pricing can become exceptionally flexible on the downside when inventories are maxing out (usually when demand - real economic demand - declines). Similarly, when inventories get really tight, producers have a lot more flexibility to raise prices. Thus, I am really wondering if a depiction of the economic supply curve might be more accurately depicted as a "S" curve than as a straight line?
It must be understood from this that oil industry "demand" thus appears to be relatively inelastic. "Demand" always seems to almost exactly match production, no matter what the price, with just a little bit of differential as inventories expand or contract a bit. This is misleading, though, as I suspect that actual economic demand is far more elastic than most people have been lead to assume. When oil prices go up, consumers do indeed cut back their consumption. However, it is a pecularity of the oil industry that there are very long lead times to bring new oil into production (even in the times when there was lots of new oil to be found), which tends to force prices up even more in the short term when demand exceeds supply, and that there are also inventory capacity constraints (it takes time to build tank farms, too) that tends to force prices down even more in the short term when supply exceeds demand. These forces very powerfully keep additions to and subtractions from inventory within a relatively narrow range, and can give the misleading impression that actual economic demand itself is actually inelastic. It is not economic demand itself which is inelastic, but rather storage capacity.
A correct understanding of these particulars, I believe, will go far toward a more correct understanding of the actual dynamics of oil prices.
Excellent point. Storage levels, especially if measured in "days of supply", should mediate the strength of the coupling between end user demand, producer supply, and price in the short term.
It occurred to me as I wrote the above that one of the main difficulties in measuring this is that we have partially decoupled numbers in multiple markets that need to be sorted out, so there are multiple curve sets to work out with different characteristics.
Refiner demand <=> Producer Supply
Octane fuel demand <=> Refiner supply
Decane fuel demand <=> Refiner supply
Bunker demand <=> Refiner supply
...
All loosely coupled across different world markets by the portability and margins of the various products.
So 4 years into this experiment, there is still a huge amount of analysis to do.
Put simply, demand is inelastic in that it does not vary much owing to price variations alone - we still drive our cars even though it gets more expensive to do so.
Put simply, you're wrong.
from 2008:
http://online.wsj.com/article/SB122728664289448183.html
The good news is that gasoline consumption has fallen compared with a year earlier in every month from March through September of this year, according to data from the Energy Information Administration. Vehicle miles traveled -- the wonky term for how much we drive -- have dropped for 11 straight months, and fell 4.4% in September, according to the Department of Transportation.
OK - the demand curves do have a gradient that shows demand will be curbed by high price. The demand curves are schematic since we don't really know how global demand is affected by price.
The lowering of VMT will be in part due to high price but perhaps in greater part due to rising unemployment.
high prices or unemployment doesn't matter to the barrel of oil not used. The point is, people DID drive less when the prices spiked.
There was also an article in the SF Examiner about 2 years ago talking about how the rural poor in northern california were radically trimming back their driving and having a hard time finding suitable vehicles: cheap cars that are good on gas but can clamber through the dirt and gravel roads. this is exacerbated by the retirees and second-home owners who have money to burn (compared to the locals).
What is also not part of your discussion are the limitations on short selling that have been installed to curb speculation on oil.
Mind telling us about these limitations on short selling to curb speculation on oil Stuart? Short selling is a term used in the stock market, not the commodities market. Sure, every futures contract has a long and a short side. But no limitations have been placed here whatsoever.
And as far as the stock market goes there is some talk of re-instituting the uptick rule but so far no action has been taken. SEC Weighs New Short-Selling Rules But again, this has absolutely nothing to do with the futures market.
Don't forget Stu, the futures market and the stock market, or equities market, are two entirely different things. In the futures market you can hold the short end of a contract but there is no such thing as short selling. Short selling is selling stock that you don't really own. You borrow it from your broker. You must repurchase it later and return it to your broker. Also there is such a thing as naked short selling, selling stock you don't own and don't borrow either. That is already against the SEC regulations but some still do it. They are cracking down on that however.
Ron P.
Demand elasticity has a time dimension. People can make more energy-reducing decisions for the long term than for the short term. If oil prices spike they can't immediatey change their job, move, or buy a more efficient car. All those changes take time and money to execute. Current oil prices are causing long term behavioral changes. The fear of another spike is also causing long term behavioral changes. Oil demand will decline in Western countries as a result.
Look at US oil consumption in the early 1980s. People got the message and for year after year oil consumption declined even as oil prices declined.
We are headed for further Western consumption declines even as demand grows in oil exporters, China, and India.
While the US consumption of gasoline dropped in 2008 to a level not seen since 2003, the daily average supply has been 9105, 9159, 9253, 9286 and 8989 thousand barrels per day from 2004-2008 inclusive. The consumption in 2008 is 98% of the 5-year average and 96.8% of the 2007 consumption. Consumption since May 2009 has been just about the same or slightly higher than their equivalent 2008 counterparts as reported by the weekly petroleum review.
That hardly constitutes elasticity. Now, if the consumption had dropped, say, 10-15% from the medium term average or from the previous year, then we might say that the conclusion about consumption/demand being inelastic is wrong.
Here's the reddit & digg links for this post (we appreciate your helping us spread our work around, both in this post and any of our other work...):
http://www.reddit.com/r/reddit.com/comments/947qc/oil_price_where_next/
http://www.reddit.com/r/energy/comments/947q2/oil_price_where_next/
http://www.reddit.com/r/collapse/comments/947q5/oil_price_where_next/
http://www.reddit.com/r/environment/comments/947q8/oil_price_where_next/
http://www.reddit.com/r/Economics/comments/947qa/oil_price_where_next/
Find us on twitter:
http://twitter.com/theoildrum
http://friendfeed.com/theoildrum
Find us on facebook and linkedin as well:
http://www.facebook.com/group.php?gid=14778313964
http://www.linkedin.com/groups?gid=138274&trk=hb_side_g
Thanks again. Feel free to submit things yourself using the share this button on our articles as well to places like stumbleupon or other link farms.
Would it be useful or even possible to add a supply curve and a demand line to Fig. 5 showing the 2008 peak price intersection?
JB
I love this post!
I tried making some graphs of oil production and price a while ago. What a path the point has taken! IMO there are a few really important conclusions we can obtain from this:
a.) It is amazing how much oil production DOES follow the laws of economics, whereas with the price drop in early 2009, production fell back almost exactly to pre-2008 production levels. Obviously production is responding to the price signal. That shows very clearly that oil production is a monotonically increasing function of price.
b.) It is amazing how much oil production DOES NOT follow the economics, whereas the flexibility of supply is almost nothing. A 75% change is price corresponds to a 5% change in production. This is the ultimate "oh s@*#" realization.
This is a matter of supply and demand, but it is more so a matter of price sensitivity. Price sensitivity is the fundamental assumption behind supply and demand, and well... economics itself. The problem IMO is point b. Lately, people have been talking about "the death of Economics", economics being wrong, and so on and so fourth. I intend to argue that one way or another, the behavior of the oil markets is showing that something is terribly terribly wrong with how economics plays out in the real world.
True, we hit physical production limits. Ok, I'll give you that. But what about the backside of that? The oil production system demonstrated not only the inability to increase production, but also the inability to curtail production. Economics, and society itself, isn't configured to factor in the concept of depletion. That makes no sense and that is why economics is broken. You could refine the concept of saving to include the concept of depletion and effectively the capital stored in oil - the saving power of oil left in the ground. The problem is that no company and no form of economics is effectively factoring this in. Not only did economics fail to include this into the fundamental supply and demand model, but Exxon failed to include it in its business model.
You'll notice that if you separate OPEC and non-OPEC oil production, almost all of the changes come from OPEC production. They are the only nations in the world apparently concerned with preserving oil-in-the-ground value, albeit only to a small extent. The ultimate fallacy of our world is thinking that the price of oil should be proportional to the marginal cost of extraction. It should not, but it is. When the price of oil was $35 per barrel, those with extraction costs of $5 should have stopped all production and written future contracts far enough out to satisfy their discount rate. But instead, those fields continued to pump world oil storage full and further exasperate the contango stalemate.
Those who decrease production by 5% with a 75% change in price signal are diluted numskulls. They are throwing economics to the wind and destroying investor value.
That's the other assumption of economics that has been broken: people act rationally. Our current use of oil is not rational. The premium for saving our natural petroleum riches for a rainy day is almost zero.
This is why I believe that the graphs above show that accurate economic models are not applicable to our society. And the reason is simple - we're kidding ourselves about the physical reality of our society.
I am a geologist, not an economist. I was very surprised plotting the data to see how simple the story is - I'm used to working with complexity. I think economics and our market system are alive and well. It's not possible to avoid seeing that the industries that are being hit the hardest are automobiles, airlines, house builders - all energy intensive. And the laws of supply, demand and price seem to be alive and well - its just that the relationship is exponential and not linear.
The media don't help in reporting daily / weekly movements in oil price related to "trivial" events - waiting for inventory news, insignificant pipeline in Nigeria blown up, expectations of hurricanes in the Gulf and most of all speculators driving the price. All this is captured by the noise in the data, while the overall structure is controlled by supply and demand.
Politicians are also doing untold harm by having their heads in the clouds and promoting that low energy prices are good. A year ago they were doing everything they could to get energy prices down - they certainly succeeded.
I'm more on the finance side of things. I don't know much about the geologic situation other than what I read here... but believe me, I get as much of the geologic picture as I need to. None of this is rocket science, or even difficult for that matter.
I completely agree. Worldwide human society is a very complex system. But yet oil production has very clearly followed the trend in Fig 2 - so simple you could teach to a middle school class. Inasmuch as economics predicts that price will be the marginal production cost, the data has hit the bulls eye.
Of course, my claims contend that people should wake up and realize that this is not a good pricing system for oil, requiring a more complicated game-theory type of model, but even the largest company in the world has apparently not advanced to this level of thought. For them it's "pump pump pump as long as there's a profit".
The mainstream thought on this matter would likely ostracize you and I along with the speculators because our analysis of the situation concludes in higher pricing.
But yet speculators could avert a serious crisis. An individual could buy a futures contract a few years out, and by economic theory, the system should work itself out. The producers should respond to that signal and take production offline. I don't think we ever see this. You can get a 30% annualized return right now by storing oil until the next month. And help save the world as a bonus!
http://finance.yahoo.com/q/fc?s=CLU09.NYM
But this doesn't happen due to a single real world factor: human stupidity. For one, USO and other funds only buy front month contracts, meaning that the majority of speculation does no production work in terms of intelligent resource allocating. Second, companies need to have access to that ever-important ability to either curtail production or store oil. They don't.
I look at storage as a 2 to 3 month "half life" in the price signal. The price can be whatever it feels like today, but by 3 months from now it must reflect genuine supply and demand. We need a longer half life, IMO. That pretty much sums up my thoughts on the matter.
----
I might disagree that politicians succeeded in getting oil prices down. The run up and fall in 2008 was "feeling" the edge of the economic oil cliff. The consistency in the data suggests that the driving factors are much bigger than any of us. The scale of this phenomena is something that no single institution can hope to match.
You've said it in a very clear and concise way, our steering mechanism is following a path a bit different from the physical world, which has been the problem all along.
"Those who decrease production by 5% with a 75% change in price signal are diluted numskulls."
Love it; would do Norm Crosby proud. ;)
I feel compelled to repost my previous thought.
The price of oil is substantially going to depend on supply.
We have very little information regarding the supply capacity of OPEC, which is the critical supplier.
ERGO - We are unable to account for the supply capacity for a critical portion of the oil supplying world.
ERGO - Price estimation is not wild guessing, but it's not too far from it.
Let me tour the KSA and see live production data, then ask me about price.
Two points: (1) Average annual US oil prices increased from $57 in 2005 to $100 in 2008 and (2) Saudi net exports were down for three straight years relative to their 2005 rate.
The only number that really counts to oil importers is the volume of (net) oil exports delivered to the market, and if Saudi Arabia had maintained their 2005 net export rate, they would have (net) exported 10.0 Gb from 2006-2008, inclusive. The actual volume was 9.1 Gb (EIA), a shortfall of 900,000 mb.
I think that 2005 was probably the final Saudi production peak, and I could of course be wrong, but I think that it is extremely unlikely that they will ever again match or exceed their 2005 net export rate of 9.1 mbpd.
Although all the pieces are there, the author fails to arrive at the correct conclusion.
He is incorrect in his argument that a "plateau supply of 84 to 88 mmbpd are secure for a couple of years," primarily because he completely fails to realize and isolate the impact that the exponentially growing Chinese economy had on the 2008 oil price spike due to their massive demand for oil, as well as the likely effect a revitalized Chinese economy would have on an OECD world already weakened by recession and which will not recover for the foreseeable future.
Although the author does insert a caveat about the global banking system surviving and the global economy resuming growth in 2010, he doesn't seem to understand the full implications of that caveat, which undercuts his entire argument. The Chinese economy is already ramping up in 2009 and the global banking system has indeed survived the current crisis and is expanding rapidly, providing plenty of capital to feed the enormous demand of the Chinese market.
He also incorrectly states that there is a limit to the oil price the global economy can bear, when it is actually China that will set the global price of oil by its demand and economic power. It is only the OECD countries (especially the US) that will experience a limit to the oil price that our economies can bear.
Finally, he argues that as a result, “any new price spike, as the name suggests, will be short lived as high prices kill demand and we are likely to see a repeat performance of the 2008 crisis." However, when oil spikes again they will not drop (even now the price is still hovering around $70.00 bbl - it did not drop back down to any kind of "normal" price as it did after the 1970's oil price spike), but find a new global equilibrium price determined solely by Chinese demand and control of natural resources worldwide that we cannot afford, and the US economy will crash hard into Great Depression II.
Gordon is not a common Chinese name.
;-)
Meaning what, exactly?
I interpret it as meaning he is sceptical of the claims about Chinese recovery, but does not have the time or means to challenge them. My own search failed to find any info particularly proving anything other than that the Chinese govt has done a stimulus package (which will perhaps give a few more months' illusion of success before the down returns).
Thanks for the interpretation, RobinPC, but I knew exactly what Nate meant.
He was being dismissive and patronizing, as in “who do you think you are to have an opinion that counts in my world?”
If he does not have the time or means to challenge me, then perhaps it would be better not to take cheap shots either.
If you or Nate can’t find anything other than the fact the Chinese government has provided a stimulus package to their economy (one that actually seems to be working to provide needed stimulus, as opposed to the joke we have), perhaps you should change news sources.
This will likely be my last comment on TOD for some time, but I seem to have offended you, a new user, so I will delay my departure to answer your comment. Re the Gordon/Chinese comment, I was being flip - you had just signed up and defended China as the future Conan of world growth and it seemed sort of funny.
1)The built capacity in China is designed to be a world exporter of products, not as an import substitution structure. China has major water issues, it is much more efficient for them to import soybeans and grains then use that water indirectly on food - they will be massive food importers for many years to come - in the end food (and oil) are more important than electronics and low utility consumer goods (as a generality)
2)China recently has had several failed treasury auctions. While this also has (negative) implications for US treasury auctions, it highlights the fact that their money supply has been growing in double digits, and the yuan is also a fiat currency (fiat being latin for 'faith'). Faith in a pseudo-communist government backs their currency, just as faith in our government backs ours. IMO, all fiat currencies in a global economic system are joined at the hip in the end.
3)As such, I am of the opinion there is no way China can have a viable thriving economy if the rest of OECD is in throes of depression. This current crisis will/must end with the renegotiation of credit or the issuance of a new global currency, of which China would likely play a role. Less likely, but possible is a major war (and US still has first strike capability vs ROW, a fact they use in foreign policy discussions as a matter of fact threat, not with intent to use.)
4)
That is a little strong, but is part of the reason I am taking a break here- it is difficult to rehash discussions with new folks on old topics over and over. I've not talked about China much on this site and your opinions on it may well be correct, though for the reasons above I disagree. If you took that comment as an insult, it was not intended as such and I apologize.
5)My opinion is that the 'economic empire' (basically capitalism), will borrow from all areas possible (foreign countries, new rules, public coffers, the future, thin air, etc.) to put off the reckoning that is due from disconnect of real vs abstract capital. As such, even though we are well into collapse, it won't appear like it until 11:59 pm metaphorically speaking. China is in bed with all the rest of us. If they somehow had Russias energy endowment, ample fresh water resources, a lower population density, and had a healthy environment, and they had built infrastructure specifically to account for a non-export reliant economy (no country has), then I would agree with you. It is possible that this all shakes out with an all out war between China and US - I think this is more plausible than China as world economic power and US in the tubes. In any case, I speak Mandarin and still have friends in high places in Beijing and count this as an insurance policy -I'd be a good candidate for foreman/translator if you end up being right...;-)
Just my 2 cents. Good luck Gordon.
Neil,
Thank you for taking the time to respond properly. The tone of your reply still leaves something to be desired, but “apology accepted” nevertheless.
Although I am a “new user” to your website, that fact alone has nothing to do with the relevance or the quality of my opinion about China. In reality, I have been following “The Oil Drum”, which I consider to be a somewhat narrow and biased but relatively useful news source, for a long time and am thoroughly familiar with the issues and views expressed on the website, as well as the background of many of the personalities contributing to the website. I have just never felt compelled to contribute to the discussion before.
To reply to your comments (unfortunately, I really must provide some background information in order to sustain my conclusions at the end, so please bear with me):
The Chinese economy was designed to be a world exporter of goods, just as you say, but the unexpected collapse of Capitalism in the OECD countries has forced them to become more self-sufficient, which is what China had intended all along, just not this soon. They are irritated at the US because they failed to properly take into consideration the fact that Capitalism in the US would fail so prematurely, so that they have a far larger investment in US dollars than they intended to have eventually. Their goal is to become the next world super-power. Anyone who doubts that fact is deluding themselves.
Their current intensive drive to secure natural resources around the world should be ample evidence of their intent. The Chinese leadership knows that there are not enough natural resources left in the world for them to achieve a standard of living anywhere near that of the OECD, and they intend to “lock up” (by whatever means) what is left of those resources for themselves as soon as possible. This is the threat the OECD countries must eventually face: the stark reality of 20% of the world’s population (historically pillaged and demeaned by the rise of the Western European powers) demanding, by military force or economic manipulation of the market system, their "fair share" of what is left of the world’s resources after the OECD countries have decimated and squandered them.
The Chinese rise to power began roughly around 1980 when the new progressive Chinese leadership came to power. Since then they have been systematically bleeding the OECD economies for their benefit in order to “jump-start” their economy, much as Japan did in the late 20th century. Even though China is often portrayed in the US media as moving toward or becoming a Capitalist nation (an arrogant notion of the wealthy class that the Chinese prefer not to dispute for their own reasons), they are steadily morphing from a Communist central controlled economy to what is now obviously a Mercantilist society. I wouldn’t hazard a guess at what they will eventually become because it depends on how the government and rising economic power of the social classes interact with each other in the future. The methodology they have been and are using to acquire, first economic and then military power, is really quite clever (the Chinese should rightly be proud of this accomplishment). They are using the natural greed of the OECD (especially those in the US) wealthy as a weapon against us. In other words, they are beating us at our own game.
The “fall” of Russian communism was an unexpected boon to China in that the US was free of cold war competition and could concentrate on expanding US trade in China, the “Holy Grail” of western trade for centuries. This fact unexpectedly allowed the Chinese economy to start growing exponentially with double-digit gains year after year, which brings us to where we are now. Recent developments in the US stock market indicate that the wealthy have “come off the sidelines” and are beginning to invest heavily in the Chinese economy again (there’s really nothing else left to invest in, now that the wealthy class has destroyed the Capitalist system through their insatiable greed). They believe the Chinese economic package is working, which by any means of reckoning it is, and are doing their level best to get access to that golden market without delay to beat others to the trough, so to speak.
I don’t know if China will be able to successfully “decouple” from the OECD countries, especially the US, but they seem to be making remarkable progress in that direction, far more than I would have ever thought possible in such a short time. If they are indeed successful, and I can’t see any reason why they wouldn’t be for a multitude of reasons, it would mean that your opinion that “there is no way China can have a viable thriving economy if the rest of OECD is in the throes of depression” is somewhat off the mark. Don’t get me wrong, I hope you are right because none of the alternative scenarios are good for the OECD (especially the US) countries, to say the least.
Yes, I agree with you on the following points: (1) that the “economic empire (basically Capitalism), will borrow from all areas possible to put off the reckoning that is due,” (2) that the US dollar is in its final death throes and will shortly be supplanted by some new global currency, probably the Yuan, and (3) that China has an incredible deficit of natural resources and infrastructure problems to overcome to match the economic power of the US, but the Chinese people have proven they are patient and resilient, perhaps most importantly they plan for events over the long haul, unlike the US which can’t seem to remember anything beyond the last “Survivor” winner on government-controlled TV.
No, I disagree with you on the following points: (1) China WAS in bed with the rest of us, but I think the recent strides they are making to improve their domestic economy and to reach out the other Asian nations to create a more “localized” or “selectively global” trading network (as in the artificially created Wall Street BRIC notion) prove that they won’t be “in bed” with the OECD much longer, or at least not on any terms we would like. (2) You said that “if they somehow had Russia’s energy endowment” that you would agree with me. Well, perhaps you should check on the current status of Russian-Chinese relations. In case you hadn’t heard, the cold war is over. They are presently holding joint military exercises (for internal security and to protect against terrorism, of course), are in the process of carving up Central Asian resources (the “stans”) for their mutual benefit, and are in the process of completing massive trade agreements between their two countries (that have historically been rivals and often bitter enemies). (3) As to the US having “first strike capability,” that is true, and ordinarily I would agree with you that China would be foolish to gamble that we don’t have the “stomach” to use them if push came to shove. However, with the recently developing close ties between Russia and China, I must disagree because it will soon become apparent that we are no longer dealing with China alone, but with a coalition of "Russia-China," whose combined military might (remember that Russia still have a formidable arsenal of ICBM’s ready for launch) could give us pause before we summarily “push the button” to punish a disobedient China. (I’m afraid that most people in the US have a really antiquated view of China and the Chinese people that doesn’t fit the present reality, which I am sure you are well aware of.) This is a completely new development in US-China relations that fundamentally alters both the geopolitical and economic environment of the world we live in, and so far at least, we seem to be completely oblivious to it. The “Great Game” continues, perhaps in its final installment, but the US will not be around to find out or care who wins. We will have been eliminated long before that, just as the Great Powers of Europe were destroyed previously, but perhaps not with as good an effect. I’m afraid our lot will likely be much worse this time around. There is a real hatred of the US economic juggernaut in the world today, not without ample reason, and we may not be allowed to simply collapse of our own greed as others have before us.
I could go on, but hopefully by this time you understand my objection to Mr. Mearns' conclusions. The “weighted effect” of the Chinese economy must be specifically and explicitly included in any analysis of “peak oil” or the conclusions are simply wrong.
I apologize for the length of this response and beg your indulgence for that fact. I agree with you that, “it is difficult to rehash discussions with new folks on old topics over and over.”
I want you to understand that I fervently hope you are right in your analysis. However, nothing you have said, nor anything that I have researched on this subject, even remotely leads me to the same conclusions as yours.
Please understand I have nothing against China or the Chinese people. I believe they are doing what is best for their country, especially since they seem to have finally freed themselves and their culture from the obscene dominance of western civilization. I only wish we would do the same for ours, not that I care one whit about this country, but if it goes down to ruin, it will take me and my family with it.
I firmly believe that Capitalism is the worst scourge to have ever been dreamt up by a perverted civilization in all of history. It has fatal flaws that cannot be overcome, certainly none of which can be overcome by the pathetic move of “Green Capitalism” to somehow make traditional Capitalism more eco-friendly (but that is another tirade, I’m afraid). The phrase, "like putting lipstick on a pig" comes to mind. Capitalism, in whatever form or guise it assumes, is near its end. Unfortunately, I happen to be here to witness that fact.
It is well that you speak Mandarin. You may prove useful to our new masters, most will not "make the cut" so to speak. If you believe what your “friends in high places in Beijing” are telling you to arrive at your conclusions and are “count(ing on) this as an insurance policy”, perhaps you had better check the expiration date of that policy, or possibly reread some of the fine print. You may be surprised when to try to collect on it.
Once again, thank you for responding to me and I apologize for the length of this reply.
Best of luck to both us, we are certainly going to need it.
Regards,
Gordon
Nate,
I just thought I would send you one final message. You apparently disagreed with my assessment that China was an emerging world power, so why take my word for it? This article is actually about economics, not oil, but there is enough here to substantiate my opinions about China that you rather contemptuously and arrogantly dismissed.
Of course, the main thrust of the article is an argument for maintaining the present Capitalist structure, about which you already know my feelings, but it will serve the purpose nonetheless. After all, you proclaimed yourself as an expert on China with “friends in high places” (By the way, it didn’t impress me. It made you sound like a sycophant and not very flattering.) Who am I to argue with that? So I just thought I would pass along someone else’s opinion for your edification.
Since I know something of your background, I feel it only fair to share some of mine. I am from poor, but humble origins so to speak, who has at last achieved the “American Dream.” I have a BS in Managerial Accounting and Finance (with a Computer Science minor) and an MBA. (All paid for by student loans and work, a claim which I doubt you can make.) I am a retired CPA, who has worked most of his career in US manufacturing, primarily in the high tech industry, as a Plant and Division Controller for several global corporations, but have held the position of Financial Planning Manager for a large high tech company with global operations, as well. I learned my distaste and revulsion for Capitalism the good, old fashioned way. I was exposed to it long enough to know the Devil for what it is. “Familiarity breeds contempt,” as they say.
While I don’t speak Mandarin, I was raised in a 100% bi-lingual family (French and English) by people who had lost literally everything in the Great Depression (no, they almost never talked about it because their experiences in losing their “Mom & Pop” grocery store through bankruptcy was not something they cared to relive, so it has not somehow “tainted” my opinions, or made me unduly prejudiced.)
Basically, I don’t like Capitalism and the wealthy people who run it because of what they are. My long experience shows them to be arrogant, greedy, selfish, deceitful, shallow – well, a whole dictionary full of words to describe their class, but you get the idea. The problem with the idea of Capitalism is that it accurately reflects its creators. Somehow I think you might take that personally, but don’t unless it fits.
Just so you know for future reference, don’t assume that the person you are addressing is ignorant, since it only exposes yours.
Well, you’ve wasted enough of my time and I am growing bored with this, so unless you antagonize me further, you have heard the last from me.
Regards,
Gordon
07:48 July 24th, 2009
China and the world economy
Post a comment (7)
By: Gerard Lyons
Tags: General, Africa, Australia, Brazil, Bretton Woods, canada, China, Middle East, The Great Debate, United Kingdom
Dr. Gerard Lyons is chief economist and group head of global research, Standard Chartered Bank. The views expressed are his own.
The world is witnessing a shift in the balance of power, from the West to the East. This shift will take place over decades, and the winners will be:
- Those economies that have financial clout, such as China
- Those economies that have natural resources, whether it be energy, commodities or water, and will include countries, some in the Middle East, some across Africa, Brazil, Australia, Canada and others in temperate climates across, for instance, northern Europe
- And the third set of winners will be countries that have the ability to adapt and change. Even though we are cautious about growth prospects in the U.S. and UK in the coming years, both of these have the ability to adapt and change.
China is at the center of this shift.
The scale and pace of change in China is breathtaking. Against this backdrop of dramatic change, let me look at China’s impact on the global economy, especially in the aftermath of the financial crisis.
It is now clear that the financial crisis was a result of three key factors: an imbalanced global economy; a systematic failure of the financial system in the West; and a failure to heed the many warning signs.
The world needs to move towards a more balanced economy. But that will take years. The imbalanced nature of the world economy led some to point the finger of blame at the savers, such as China. The 1944 Bretton Woods agreement placed no obligation on savers, countries with current account surpluses. The obligation to change was put on those countries with the deficits. This has to change.
Whilst China and other savers may not be the main source of the recent problem, they are part of the solution.
To move to a balanced global economy, the West, or at least countries like the U.S., the UK and Spain, need to spend less, save more. In contrast, regions like the Middle East and Asia need to save less and spend more. It sounds easy. It is not. It requires a fundamental shift in China and in Asia’s growth model.
At the recent Asian Development Bank (ADB) meeting in Bali, the President called for Asia to rebalance its economy by: expanding the social safety net; providing assistance to small and medium-sized enterprises; and deepening bond markets.
Amongst those present, I detected more enthusiasm for the social safety net than for further financial sector innovation. One of the lessons of the 1997-98 Asian economic crises was the need to open up the financial sector at a speed best suited to domestic needs. One speed does not fit at all. Yet, it is important that if Asia is to see a shift in its growth model it needs to see a reduction in savings and this will be achieved sooner by deepening and broadening its capital markets.
This involves many changes, such as increased personal finance and allowing people to borrow against future income. It requires deep and liquid corporate bond markets, shifting the region’s culture away from equities, and giving firms alternative sources to bank lending and, in China particularly, reducing corporate savings, possibly through higher dividends.
China will play an important role in this process. It has already helped regional integration, building on the Chiang Mai Initiative, and it has engaged in a number of bilateral swap arrangements with countries around the world.
Another important global impact is the importance of China in helping world trade, investment and financial flows. Over the last decade the three words seen most regularly were “Made in China”. Over the next decade the three most common words might be “Owned by China”. China’s stock of overseas direct investment is one-thirtieth of that of the USA. The stock of foreign direct investment in China far exceeds the total amount China has invested overseas. Last year, China’s investment overseas was $50 billion. Now this is changing. Chinese firms are taking advantage of a strong renminbi and of strategic backing from Beijing to expand overseas purchases.
The impact of China on global commodities is already evident. China’s rapid growth and its strategic needs saw it accumulating increasing amounts of commodities. For instance, it accounts for about one-third of global demand for aluminum and copper, and as much as 38 per cent for zinc. In the first half of this year there has been stockpiling by China of a range of commodities. This stockpiling could be explained by many factors, including the strength of the Chinese yuan and the weakness of commodity prices. In future years one would expect this to continue. And it will not just be metals. Demand for food and soft commodities will be important. As incomes rise, food tastes will change.
Furthermore, 28 per cent of Europe’s land is arable, while this figure is 19 per cent for the U.S., but for China it is only 10 per cent. As a result, China will not only buy commodities, but it will also invest in countries producing commodities. This will reinforce the new corridors of increasing trade and investment flows between China and Africa, Latin America and the Middle East.
China’s purchase of commodities has a direct link into the inflation outlook globally. In previous years, CPI figures around the world could have been renamed China Price Indices, as China exported deflation. In the next few years, if there is an inflation issue it is likely to be through higher commodity prices, with China’s demand exerting a key influence.
China will have a big bearing on the dollar. There is a slow burning fuse under the dollar. Even if the U.S.’s economic power were to wane, it is important to stress that the U.S. is still the world’s major economy. There are no credible alternatives to the dollar. Long after the UK ceased to be the world’s major economy a century ago, sterling remained the world’s reserve currency for some time. During this crisis it was noteworthy that, despite much negative sentiment towards the dollar, in the time of trouble the depth and liquidity of U.S. financial markets helped support the dollar as a safe haven.
Furthermore, it would not be a surprise if - as a result of this crisis – more countries learned the lesson of Asian economies after their crisis, and decided to accumulate foreign exchange reserves. During this crisis those countries with high FX reserves were afforded an additional degree of protection. Of course, not all reserves need be in dollars. Even now, countries with large reserve holdings do not actively want to sell the dollar. It is not in their interests to do so. Instead of this active diversification – or outright selling of U.S. assets - there is what I call “passive diversification”, whereby a smaller but still sizeable proportion of their net new reserves are allocated to dollars.
For its reserve currency status the dollar needs to retain its status as the medium of exchange and as a store of value. Interestingly, China and Brazil recently agreed to pay each other in their own currencies, not in dollars as is the norm, whilst the pressure China has put on America regarding the dollar’s value highlights the concern some have over its future value.
China still has a huge balance of payments: its surplus reached 9.6 per cent of GDP last year. The authorities have kept the yuan stable versus the dollar, although this has meant it has appreciated on a trade weighted basis. The Chinese are also, it seems, encouraging trade settlement in Chinese yuan. Yet the reality is the Chinese yuan needs to become fully convertible for it to challenge the dollar and that is not going to happen any time soon. In the future I would expect to see more countries manage their exchange rate against the currencies of the countries with which they trade. This, plus the new trade corridors I mentioned earlier, and the likelihood of increased investment flows into emerging economies with higher growth rates, may all suggest downward pressure on the dollar. But this is likely to be a slow process.
On the global stage, China’s rise is also leading to the rise of State Capitalism. A couple of years ago we looked at this in the context of Sovereign Wealth Funds. Add in large foreign exchange reserves, government pension funds and state owned enterprises, and the role of the state has become far more important.
Finally, China’s influence on global policy forum is important. Already this crisis has seen a shift, with the G20 (Group of Twenty) taking a prominent role. The Chinese took a pro-active role ahead of the London Summit, which was welcome, and is perhaps a sign of things to come. One wonders, however, whether it is the G2 of the US and China that might emerge as the real power. Earlier this year President Obama signaled a shift from the Strategic Economic Dialogue, to the Strategic and Economic Dialogue. This extra word “and” signals perhaps a significant change.
Gordon, it is quite absurd to imply that there is no limit to the oil price the global economy can bear. That price was reached last July. But according to your logic the global economy could bear prices of $5,000 a barrel or higher if there is no limit.
And the fact that China may or may not set global prices by its demand and economic power does not change the fact that there is a limit as to what the global economy can bear before it collapses. China may greatly influence the price of oil but it cannot set the limit the the global economy can bear.
Your claim there is "no limit" sheds doubt on anything else you may claim, regardless of its validity. When one makes one truly absurd claim it taints all other claims that person may make.
Ron P.
No one would be so absurd as to imply that there is no limit to the oil price the global economy can bear. I said that China will control world prices through its growing economic power. This will be a moot point, however, since the OECD countries will have long since collapsed before China reaches its limit.
If you are going to quote me, please include the entire thought. The rest of my point is contained in the next sentence. "It is only the OECD countries (especially the US) that will experience a limit to the oil price that our economies can bear."
Neil's comment below needs correction of a major typing bungle so I'll comment above it rather than below.
Neil's comparison with ww2 Sweden is questionable due to being so many years ago, a very different world and economy.
Darwinian,
"Gordon, it is quite absurd to imply that there is no limit to the oil price the global economy can bear." you have not read what Gordon said, especially the end of the sentence:
.....when it is actually China that will set the global price of oil by its demand and economic power.
Gordon is not saying there is no absolute limit but that the limit it will be set by China, not the world economy.
Gordon,
I might add that an economy doesn't have to collapse because of acute oil shortages, WWII Sweden showed that extreme rationing can allow an economy to function, perhaps not grow, but a recession is not a collapse, and that's all that happened in 1980 and in 2008.
One point worth making about China is that oil accounts for a much smaller part of the coal provides most energy, so coal prices are much more relevant than oil prices. No one at TOD seemed to notice that thermal coal prices doubled in 2008 and this probably caused the temporary slow down in China.
The US economy needs to plan to be able to function with >$200/barrel oil very soon. The CAFE 2015 standards need to be applied sooner and the 1million PHEV/EV by 2015 needs to be 5 million per year by 2015.
Darwinian,
Obviously, there are many causes for the collapse of any particular economy.
Your point that China's use of oil accounts for a much smaller portion of their energy needs than coal currently does, and may be more important than oil at the moment, is well taken. (I had not realized that the price of coal had doubled in 2008 and that may have contributed to China’s slowdown.)
However, the demand for oil in China has been growing steadily for decades as a result of the US (as well as the other OECD countries) shifting most of its manufacturing base to China. As a consequence, I do not believe global oil prices would have reached anywhere near their peak last year without oil demand from China being a significant factor in the global markets. If they did, then we are in worse trouble than I thought.
In any case, as the Chinese economy continues to undergo the transformation that the final phases of the Industrial Revolution is exerting on it, China's energy mix is likely to change as well, to become much more like that of the OECD countries, which either is already, or will shortly be a problem for the rest of the world.
Unfortunately, China has roughly 20% of the world’s population and is facing severe commodity shortages in the near future, primarily because they have come late to the world economy, much as Germany did prior to WWI, and for many industrial processes there simply is no relatively cheap substitute for oil. Equally unfortunate, there is also a finite amount of oil remaining in the world.
Under the circumstances, the Chinese government cannot afford to stop or even slow their economic development because it would probably cause the collapse of their society. A nation in desperate need of a very scarce commodity is not something the world is prepared to deal with at the moment, but unless we acknowledge this fact, we will shortly be in serious trouble.
I understand and share your concern that the US must be able to function with >$200 bbl oil soon, but I do not believe that the US economy, particularly as weakened as it is at the present time, can survive in any meaningful way at anything approaching >$200 bbl oil. When oil prices peak again, the economy will collapse, either through serious internal economic stresses or geopolitical events.
Gordon
Hell, that's been my point all along. That was why I replied to this line in your post:
Now I know now that is not what you really meant. But that is what you really wrote. And no matter what context you put it in, Euan was correct when he stated that there was a limit to the oil price the global economy can bear, not incorrect as you state. What Euan wrote was:
And that statement is absolutely correct!
Now I don't mean to nitpick Gordon, but I believe you wrongly criticized Euan's post. What happens in China does not change what price the rest of the world can bear before the world economy collapses. And if the world economy collapses it takes China down with it.
Ron P.
Darwinian,
Sorry, my answer was misdirected to you. I actually meant to answer Neil's reply to you (and me). My position is as I stated in my first email to you, which is as follows:
No one would be so absurd as to imply that there is no limit to the oil price the global economy can bear. I said that China will control world prices through its growing economic power. This will be a moot point, however, since the OECD countries will have long since collapsed before China reaches its limit.
If you are going to quote me, please include the entire thought. The rest of my point is contained in the next sentence. "It is only the OECD countries (especially the US) that will experience a limit to the oil price that our economies can bear."
China burns thru about 7 million barrels per day out of over 80 million barrels per day produced. So China's still not using even 10% of the world's oil.
Relative to the US China's energy usage certainly is more heavily tilted toward coal than oil. They use more coal than the US even as the US uses more than twice as much oil. Of course, that doesn't let the Chinese off the hook though unless their coal reserves are a lot bigger than public estimates for those reserves.
China and the US could both heavily build out replacement capital that uses electricity (from nukes and other sources that peak later than oil) rather than oil. My guess is that neither country's elites will accept the necessity of doing this until world oil production is unambiguously in decline. So far the evidence, while convincing enough to many of us, still hasn't changed Conventional Wisdom.
Neil,
Sorry, I misdirected this reply to Darwinian instead of you.
Obviously, there are many causes for the collapse of any particular economy.
Your point that China's use of oil accounts for a much smaller portion of their energy needs than coal currently does, and may be more important than oil at the moment, is well taken. (I had not realized that the price of coal had doubled in 2008 and that may have contributed to China’s slowdown.)
However, the demand for oil in China has been growing steadily for decades as a result of the US (as well as the other OECD countries) shifting most of its manufacturing base to China. As a consequence, I do not believe global oil prices would have reached anywhere near their peak last year without oil demand from China being a significant factor in the global markets. If they did, then we are in worse trouble than I thought.
In any case, as the Chinese economy continues to undergo the transformation that the final phases of the Industrial Revolution is exerting on it, China's energy mix is likely to change as well, to become much more like that of the OECD countries, which either is already, or will shortly be a problem for the rest of the world.
Unfortunately, China has roughly 20% of the world’s population and is facing severe commodity shortages in the near future, primarily because they have come late to the world economy, much as Germany did prior to WWI, and for many industrial processes there simply is no relatively cheap substitute for oil. Equally unfortunate, there is also a finite amount of oil remaining in the world.
Under the circumstances, the Chinese government cannot afford to stop or even slow their economic development because it would probably cause the collapse of their society. A nation in desperate need of a very scarce commodity is not something the world is prepared to deal with at the moment, but unless we acknowledge this fact, we will shortly be in serious trouble.
I understand and share your concern that the US must be able to function with >$200 bbl oil soon, but I do not believe that the US economy, particularly as weakened as it is at the present time, can survive in any meaningful way at anything approaching >$200 bbl oil. When oil prices peak again, the economy will collapse, either through serious internal economic stresses or geopolitical events.
Gordon
Gordon,
I agree with you that China is partly responsible for the big increase in all commodities last year, including oil.
As for the US economy, when oil was around >$120/barrel several large banks went under, and the world financial system almost collapsed, but it was only indirectly connected to oil being $120/barrel, I am sure it would have happened with oil at $70/barrel. In the UK petrol prices only increased slightly and very little oil is imported but they had a terrible financial collapse! Subprime mortgage derivatives were the trigger.
NEXT time it may be oil prices, but I think they are going to have to be a lot higher than $150/barrel. If you want proof, look at VMT the big drop came well after oil had peaked, and didn't return when oil was $35/barrel, which indicates people didn't reduce driving because of oil prices, but because of the economy.
Now consumers are saving 7% of income, whereas last year they were in negative territory, mortgage rates have declined, home prices are much lower and more affordable for the 140 Million with jobs, even if more are now without jobs. The world has avoided massive deflation, and government contraction that precipitated the 1930's depression. The government stimulus by China and Australia has worked on their economies and China is heading for 10% growth ( now the second largest economy). The US economy will be dragged out of recession by Chinese consumers instead of leading it as has occurred over the last 50 years.
China is not having trouble using 50% of many of the world's commodities( oil is an exception it uses a lot less than 50%). Chinese cities seem to be built for high density living more like NY, I doubt if they will ever use oil for 40% of their energy. They won't have to replace 250 Million ICE vehicles with EV, just a few tens of millions. They are rapidly building wind, solar, hydro and nuclear energy although not enough to stop the expansion of coal. The need to cut back on coal use seems the only likely economic brake.
More cars are now sold in China than in the US. Think about what that portends for future Chinese demand for oil. Right now the US has a far larger accumulated collection of cars. But that gap will narrow year after year.
It will take a long time because of better fuel efficiency, lower VMT, and soon many cars will be electric. I doubt that China will ever use 9 million boe of gasoline/day(>400 million ICE vehicles).
Neil, Gordon and all,
I think the slipperiness of the concept centers on what we mean by "bear" as in "what the economies will bear". The laws of economics are mostly address that as a matter of elastic relationships between different sources of supply and demand, all of which are distributed and exchangeable, and only need time to adjust to each other. The laws of nature also include the inelastic limits of whole systems and their networks which may exhaust their elasticity all at once and collapse as a whole.
That our economic system naturally develops toward those points where elastic adjustment and exchanges approach a zero tolerance and failure is something I've been studying for many years. "Hitting the wall" is a phrase in common use for just such impasses where the ability of whole networks of systems come to an impasse. “Bankruptcy” is another term for it. The model of that that I developed in 78 in my essay The Infinite Society still seems very valid and accurately descriptive of our present experience. The way I approached it then is in terms of crisis solutions leading to bigger and more unsolvable crises, where each resource substitution takes more effort and lasts less.
I have an economic model that is much more inclusive and determinant, but I found there’s another reason this is all hard to discuss. What seems to be the other problem with discussing it is that mathematical models actually can't represent natural systems or their inelastic limits. Natural systems and their inelastic limits depend on their complex scales of organization which mathematical models don't have.
That creates the problem that from a theoretical world view the physical world is only a "virtual reality" and from a physical world view the theoretical world is also, only a "virtual reality". It's figuring out how those two “virtual worlds” can recognize each other’s reality… you might say, that I've been focusing on lately. Models & Change
PF
I found it very difficult to read your 1978 article, but did my best to understand it.
I think you greatly underestimated technical advances in say solar cells, wind turbines since 1978. No economy needs exponential growth, they just need some growth, a big difference. The definition of what an economy can "bear" is defined in terms of GDP growth or GDP decline.
We have had lots of examples of one commodity supply "hitting the wall", leading to 1) short term price spikes and price rationing 2)longer term substitution 3) sometimes an increase in supply(usually long after the price spike has passed).
With oil, unlike say Nickle or soybeans or whale bone, the damage is not done because people cannot function with less oil it's the distortion of the economy when oil product prices become about 8-10% of GDP. This is what happened in 1979-80( I think oil rose to about 9% of GDP in US), with total energy about 14% of GDP.
If we accept that world oil and gas liquid production is never going to exceed 88Million boe/day, that doesn't mean prices are going to go to >8% of GDP or that GDP is going to continue to decline. In time oil can be substituted, and once the economy has substituted about 50% of oil use, the price can rise much further driving more substitution.
Can you imagine a growing economy with oil above $200/barrel(real terms) in say 20 years? I can if we substitute about 2/3 of present oil use with other energy or improved efficiency so that total energy use only accounts for 10% of GDP. Some claim that is impossible without FF's, I think that renewable energy together with greater fuel efficiency can provide that substitution.
Gordon, I don't know where to start...
Perhaps you could start by explaining how Chinese demand for oil affects global oil supplies in a two year time frame.
You need to note that I have speculatively shown an increase in demand over the next 1 to 5 years - much of that will come from East Asia.
Euan,
I must apologize if I have offended you. I became distracted and irritated by the fact that no one seemed to want to accept the undeniable fact of a massively growing Chinese economy, which I had assumed was common knowledge and was therefore a given, and its impact on when the next oil spike might occur. Or even more ridiculous, that I believed there was no such thing as a global limit to the price of oil. As a result, the issue that I was trying to bring up for discussion simply got lost in the noise of a pointless argument.
I agree with you that the lack of investment in oil capacity will result in another oil price spike relatively soon and that it will be at a much lower level of demand than in 2008. I think the main reason for this will be primarily because of the resumption of double-digit growth in the Chinese economy by next year. There is ample evidence that the Chinese economy has already hit bottom in 2009 and will grow at around 8% this year alone. The growth in consumer spending and infrastructure expansion has been phenomenal. Couple that with the huge movement of investment capital flowing into China, which will make available capital to provide unlimited financing for this expansion, and it seems highly likely that we could experience another oil price spike as early as 2010. My concern is that with the OECD countries, especially the US, still in severe recession next year, this could have a devastating effect on our economies, which is the point I wanted to address with you.
I am in basic agreement with everything in your analysis down to the line where you state that you “believe that plateau supply of 84 to 88 mmbpd are secure for a couple of years,” which leads me to believe you may have significantly understated the effect of renewed Chinese demand on global oil prices. I do not believe we have a couple of years of secure oil supply due to lack of global demand. Although you state in your reply to me that you “have speculatively shown an increase in demand over the next 1 to 5 years - much of that will come from East Asia,” I have examined your data and have been unable to ascertain how much of an increase you have allocated to China for that time period. I assume it is buried in the overall global data, but your conclusion leads me to believe it is not sufficient enough to account for the growth in the Chinese economy. For example, your graph in Figure 4 shows an oil crunch occurring in 2012, but I think it will occur much earlier than that.
In fact, you begin to allude to this possibility by stating that a fall in capacity may shift the supply demand relationship to the left, and that combined with marginal growth in demand, will result in a new price spike (Figure 5), stating “my best guess would be 2012 ±2 years, subject to the global banking system surviving the current crisis and the global economy resuming growth in 2010.” This “caveat” is correct only if you ignore the fact that China is already in recovery and will be the major driving force in the global economy for the foreseeable future, and that this will occur regardless of what the OECD economies do. (I understand if you do not agree with my assessment, but the possibility of this occurring should certainly be considered as part of your analysis. If nothing else, consider it a “worst case” scenario.) The fact that you seem to be aware of the possibility of an oil spike as early as 2010 in laying out the date range of probability, but do not pursue that line of reasoning, leaves me with the impression that the underlying data in the analysis is not correct. Is it possibly because you don't believe it is a likely scenario? If not, why not?
Finally, you state that “any new price spike, as the name suggests, will be short lived as high price will kill demand and we will likely see a repeat performance of the 2008 crisis,” which implies that we will survive the next oil price spike much as we have in 2009, with increased prices, but no real disastrous effect on the economy. If the Chinese economy is recovering as it seems to be, the next oil spike will lead to permanently, not temporarily, higher oil prices as the Chinese exercise their economic power to set global market prices for oil that are far beyond our ability to purchase oil on the open market. (Many people believe the Chinese, once recovery begins, will come to our aid, but I think this is a mistaken assumption, since they have more reasons not to come to our rescue than otherwise.) Perhaps, from the perspective of OECD countries, high prices will certainly kill demand (as well as their economies), but to even suggest that the OECD countries, particularly the US, could survive another significant oil spike and retain any semblance of normalcy is seriously misleading.
In summary, I believe that there will be another global oil price spike, but much sooner and much more severe than your analysis would seem to indicate, primarily because the effect of the massive Chinese economic recovery that is currently underway does not appear to be adequately represented in the underlying data. If, however, I am wrong and the Chinese economy does not recover as anticipated, I believe your scenario is probably accurate.
I hope this clears things up for you.
Gordon
Gordon - its nice to get an apology, but don't over do it, TOD by tradition is a rough place to hang out and your interjection rates only 1 on the offense scale.
The essence of your argument, which I can expand upon, is that Chinese demand for oil in the coming years will bury the OECD, they can afford to pay higher price. To that I can add that there is a relentless swing in oil production away from OECD towards OPEC + others. Add to that the prospect that we see a reduction in productive capacity and the stage is set for the OECD fighting for oil from far flung corners of the world - heaven forbid!
China consumed 8 mmbpd oil in 2008 (C+C+NGL), up 3.3.% yoy. That's about 10% of global demand, enough to cause a squeeze on oil supplies to the OECD - if China continues to grow even in the face of recession in the OECD.
I have been careful in this post to not make any forecasts but to merely point out where the oil price may head if demand rises or falls. Forecasting what will happen is very tricky. I need to weigh your belief that China will power ahead regardless against Nate's belief that growth in China is linked to OECD prosperity.
For now I believe the oil price is perhaps the best real real time indicator of what is going on. But I'm watching the monthly demand / production figures keenly.
Euan and Gordon,
Since we are not talking about an instantaneous increase in demand or price, its essential to consider adaptation of existing OECD consumers. The 2008 recession seems to be as deep as the 1980 recession so we might expect a similar drop in demand probably more than in 1980 if prices remain high. Remember, in 1980 interest rates were up to 20% because the world had a commodity price inflation, followed by a prolonged oil price collapse.
If OECD countries only have slow growth in next 5 years their oil consumption may continue to decline as increases in energy efficiency and substitution grows faster than the economy. China and other developing countries may take that extra capacity, but prices don't have to spike, just rise fast enough to drive continued reductions in oil intensity. In 1980-85 this was about 2% per year( twice the long term rate). It should be higher this time with dramatic technical changes( hybrids and PHEV's) giving potential 100-200% reductions in fuel use/VMT. We could see a big reduction in heating oil and jet fuel use, without the overall GDP declining, and if new auto sales have a much higher proportion of high mpg vehicles( and a higher destruction of low mpg vehicles) we could see continued reductions in gasoline consumption even with modest rises in VMT.
Euan,
I know Nate's belief is that China's growth is linked to OECD prosperity, but you may want to read my latest post regarding that same issue to Nate above. It contains an article that I think you should read.
Regardless of Nate's opinion, we are experiencing a paradigm shift in world economics and geopolitical power that needs to be recognized.
This will probably be my last post, so I have to say "it's been fun (?) and we should do this again some time (not!)."
Regards,
Gordon
As noted up the thread, China is a good example of the difference between Peak Oil and Peak Exports. If China were the sole source of exported oil for the world, worldwide net oil exports would have ceased in 1993, long before production peaked (which might be happening right now for China).
We saw the same pattern in the US, when we went from finding our largest Lower 48 oil field in 1930 to net importer status only 18 years later, in 1948, 22 years before US production peaked.
I don't have detailed data for the US in the Thirties and Forties, but China showed an accelerating net export decline rate, which I suspect that the US also showed.
I am inclined the think the quest to predict prices is a hopeless one, due to the complex causality involved. Price depends on supply and demand, "easy" so far.
Supply depends on previous prices and demand, via the effect on investment in production.
Demand depends on current prices not busting businesses, and also on previous prices and supply, due to the opportunities and obligations presented or denied by those previous conditions, or even destruction thereof.
Let's suppose that some clever person might arrange all such causal links into a computer model, somehow putting the correct values on the various parameters. And yet their efforts could still fall apart thanks to some change of government policy boosting/bursting economic activity, or some other "black swans" such as wars.
What looks more predictable, and yet quite useful enough, is that supply is now on the way down, and that demand is going to go down too, and that the ability of people to afford oil at any price is going to go down. And that airlines and auto-making are not smart areas to invest in. EnergyArks instead.
Price can't go much below 60 (and rising) because of production costs. And can't spend much time above 100 because of demand destruction. That's about it really as I see it.
If I read this correctly:
The supply curve is now almost vertical,meaning that no matter how high the price goes,there will be almost no new incremental production.
This is the result of the geological realities and the political and business realities of the oil business.The consensus here is that even if the political business realities were to be solved,new exploration and production investment takes a very long time to ramp up supply;and that any reasonably concievable amount of the new E AND P cannot outrun the decline of existing old dfecliming oil fields.
So the wall is real.
The demand curve shifts to the left as the economy declines.
The demand curve itself is very steep.
This means that, since both curves are so steep,even relatively minor changes in either readily available supply or demand can cause major price spikes or crashes,as the point of intersection of the two curves moves.
The supply curve is more or less fixed in the very short term,but the demand curve could move to the left fairly fast if the economy continues to decline.Oil prices crash.
Even a modest improvement in the economy in the short run will move demand to the right and the point of intersection of the curves moves way up,probably right into new record price territory,UNLESS the price spike causes a new economic down turn. Oil price spikes and then crashes.
This pattern may be expected to continue for some time.
It seems to be the consensus that the economy cannot grow much if at all without a corresponding increase in oil production,at least in the short term.There are knowledgeable people on both sides of the fence as to whether this is true in the long term.
Production apparently,probably definitely, cannot be significantly increased in the very short term,except for whatever the Saudis are holding back, and definitely will decline in the short term as the old giant fields play out.There is good evidence that this is already happening,and long term annual production is certain to staeadily decline.
The export land model pours salt into the open wound.Oil may be short but salt is plentiful.
So apparently the very best we can hope for over the short term is a seesawing up and down business cycle that almost certainly will not even at its high spots be comparable to the last ten years before 2008.
The peaks and valleys of this cycle will probably get progressively lower each time.
As available supplies dry up,demand destruction, will according to some observers, keep prices within a reasonable range due to economic cintraction.
I tend to agree with all this prognisticating right up until the last paragraph above.
My personal opinion is that demand will not likely contract as fast as supply falls,unless prices are astronomically high.If demand does contract that fast we are headed for the power down /Olduvia gorge scenario for real.
Even if gasoline goes to ten bucks we will still drive our pickup truck for essential work-we simply don't use it enough any more to justify a new one twice as fuel efficient-even if such a truck was available.Ditto the use of our now elderly Buick at twenty five miles per gallon.
People who serious good money can afford to commute,if they still have a job,even if gas is fifteen or twenty bucks.Lots of people aruond here continued to commute at four bucks who were earning only ten diollars an hour or less.They had no choice.
My guess is that frivilious demand-gas for ski boats and joyrides in muscle cars,fuel oil burned in uninsulated old houses,that sort of thing-can decline faster than the overall economy.As unnecessary uses are squeezed out by rising prices,consumption taxes,and falling purchasing power,the use to which each remaining barrel is put will become more important.
Air travel for visits and vacations and a lot of business travel will shrink dramatically as ticket prices rise and income falls.Winter roses and grapes will be real luxuries and air friegt of any sort,excepting the delivery of urgently needed repair parts,mail,and medicines will become a shadow of its former self.The air frieght business might shrink to the point that it closes up,with the remaining trade assumed by scheduled passenger liners.
But this process of demand destruction can go only so far.A retiree living in the country in a paid for house can cut his trips to town from maybe six or eight a month to one or two ,and share a ride to boot,but even if gas is twenty bucks,he will still drive to town.
Even at ten dollars a gallon I can keep an old car cheaper than I can take a taxi,if I need a taxi very often.
And public transportation barely exists in this country except in the largest cities.
(And even then it's not very very efficiently operated.I used to ride a sixty passenger city bus occasionally that never had over three or four passengers except durung the morning and evening rush hour,even though it ran hourly from six am to eleven pm..Any farmer or small business man would have bought a small bus and used it during the off peak hours,saving a huge amount of fuel and at least doubling the years of service obtained from the larger bus.)
So the question becomes essentially this:can we reorganize our economy and move to a less energy intensive transportation system,or just do away with the need for so much transportation,before the three or four percent(or is it going to be six or eight percent for us due to the elm?) annual decline in production strangles the life out of what's left of the first world economy?
The third world peasants just now moving up to tractors can pay twenty dollars for diesel-if they can obtain the cash-cheaper than they can work with draft animals.
It looks as if the party is over,sure enough.
it gets a little harder to be an optimist from one month to the next.
If I'm wrong,somebody PLEASE set me straight.
Well, one of the benefits of running at a stone wall over and over, only to bounce off again and again and be left with a horrendous headache, is the laughter of the once breathless crowds of onlookers watching you do it...
In the end it looks completely ridiculous. Then we get to scrape ourselves and dust our selves off and think better of it perhaps. The question is how many times will it take. This is only the second major energy crisis, and media thought it was something else entirely, so it seems to be having no more sobering effect than the last. My question is how many of them will we go through before we get the joke, that trying to go *through* the wall is the hard way.
Oldfarmer,
Even if gasoline goes to ten bucks we will still drive our pickup truck for essential work-we simply don't use it enough any more to justify a new one twice as fuel efficient-even if such a truck was available.Ditto the use of our now elderly Buick at twenty five miles per gallon.
People who serious good money can afford to commute,if they still have a job,even if gas is fifteen or twenty bucks.Lots of people around here continued to commute at four bucks who were earning only ten dollars an hour or less.They had no choice.
You are missing some of the responses available. For example the oil gas-guzzler truck can be replaced by a used older car and renting a truck for the rare occasions trucks are needed.
People with good jobs can afford $20 gasoline but they can also afford a Prius or Chevy Volt.
The lower income working commuters have three options, 1)buy a used high mpg vehicle( a 2002 Prius is $5,000 and I am sure many other smaller used cars are less,2) car pool with existing vehicle 3)buy a new fuel efficient vehicle and save money in other areas until it's paid off, fuel savings alone will go a long way towards this.
"So the question becomes essentially this:can we reorganize our economy and move to a less energy intensive transportation system,........."
Wrong question, should be "can we re-organize our economy to replace oil intensive transportation with other energy such as electricity, NG, wind, solar.... fast enough, or will be have to use gasoline rationing?"
If you think gasoline rationing is the end of the world then be gloomy or doomy, I don't think rationing if needed is going to be a big hardship compared with the alternatives, just in case my next car is going to be a PHEV as soon as they are available from GM or Toyota.
Niel,I haven't missed nearly as much as you seem to think.
But maybe you mean the rhetorical you.In that case your comments are very reasonable.
But I was using my actual family ciccumstances as an example of the difficulties we face.
We need the truck at least once a week for necessary business.Renting a truck would REQUIRE US TO DRIVE TO TOWN in order to get the truck ,drive it back to the farm ,and back to town to return it,wasting a half a day,DOUBLING OUR FUEL CONSUMPTION,plus paying out forty bucks more in rent-and thats if we can get the truck back the same day.
Our truck is only worth about two grand but it will last us another ten years.
We drive the Buick,which is not worth enough to pay for comprehensive insurance any more and costs next to nothing in property taxes to the doctors office,to funerals,and to town once a week or so to the drugstore,hardware store and supermarket,total about two hundred fifty miles a month.
I parked my Escort which gets close to ten mpg more than the Buick,because I was not driving it enough anymore to make it worth paying the insurance premium.It's cheaper to use the Buick an extra day now and then,and it's Daddy's car and he doesn't want to give up his car.
We probably won't live long enough to break even on trading the Buick.And since it is an older and relatively simple car,as newer cars go,I can usually repair it myself.
I'll bet that the scheduled routine maintainence on a new Volt will exceed over the first hundred thousand miles my entire cost of ownership ,excepting fuel,tags and insurance,for either my car or my truck,for five years.
Most people just can't work out a way to carpool to work in this country.The jobs are too scattered,the start and stop times are too different,and the xxxxing lawyers are so eager for lawsuits that most people won't even consider the possibility.Despite all this I do know a few people who carpool.
When you are making ten bucks an hour and have a paid for car,and spending anywhere from say twenty five to fifty bucks a week for gas,you can't save enough on gas to trade-your payment will exceed your savings-assuming you can get financed.And preople making ten bucks generally can only get financed at rip off used car lots charging rip off interest rates.
People making ten bucks are generally not getting thier cavities filled or taking vacations
or saving any money at all.
And of course people who make good money can trade for more fuel efficient cars but I see very little evidence ,judging from the ones I know, that they give a damn-unless they are head over heels in debt.
A local teacher(nieghbor) just bought a 4x4 Dodge Ram to commute sixty miles a day.
My point was that people who earn good money will still be ABLE to commute when gas is ten bucks or more.And when it does get that high,most of them will use thier big gas hogs a lot less and buy a more economical car to commute,I'm sure.
Personally I think gas rationing is among the least of the the things we have to worry about,and it doesn't bother me much.I'll probably get a larger allotment than you do,and I will have fresh fruit,veggies,and meat to trade for black market gas.
I'm worried a lot more about food rationing.But then again,I will probably be in a lot better shape than most people.
And about mobs trashing cities and spreading out thru the countryside.
About having to watch my back working in the orchard,about having to stand gaurd over my crops,such as they are,about having to kill somebody-and no doubt getting killed myself,sooner or later,if things fall totally apart.
And world war three- if the alternative technologies don't come along fast enough.
And I don't think they will.
I still hope we can squeak thru by dint of rationing food and energy in the US,Wastern Europe,Etc.
I don't think there is much hope for places that import a lot of food and pay for it with hair dryers and toasters.
oldfarmer,
It's been a few years since I lived in the US, but at least then most people lived in large towns and cities, and most pick-ups were owned by suburban dwellers and only used occasionally to haul furniture or fire-wood. I car pooled with two other neighbors when I lived in Oak Ridge Tennessee, and commuted to Knoxville. Lots of people working in shopping centers, or down town have near neighbors if they want to car pool. Your neighbor with a 4X4 Dodge ram commuting sixty miles a day would probably use 10gallons a week, $5,000 of gas at $10/gallon per year. Unless the teacher is in a one teacher school there are probably other teachers who live near-by, so that most of the trip can be shared.
The rationing plans in US are to have a white market for trading gas, so it will be down to price for those who need extra. I don't need to use a car for any of my traveling more than 20 miles/day, so I will would be selling all of mine anyway if I had a PHEV or use mass-transit.
You are fortunate to live in a country that has a massive food surplus a lot of which goes to feed animals. A lot of people can live on a few rail cars (100 tones/car) of corn, wheat or beans. Might be boring but no one has to starve. Not sure why mobs would be trashing cities with $10/gallon gas, they didn't in Europe last year. Most will be working just like the 140 Million in the US are now.
Alternative technologies are already here, but we don't have the oil shortage yet. I don't see how a WWIII is going to help anyone get more oil, most countries are pumping at maximum and will soon have almost none left worth fighting over..
She might carpool partway -but she won't.
You are right about most of the trucks in this country beinmg used for nonessential pirposes.
And the riots might not start just because we have ten dollar gas-but in this country It is concievable that ten dollar gas could create enough problems to act as the trigger.
Unemployment,crime due to unemployment,falling living standards,etc, have lead to riots in many countries,and I faer that this will be the case here if our economy continues to decline.Of course the price of gas is only one factor in this scenario, but here it is a big factor.
We already have an army capable of whipping any other conventional army in the world overseas now fighting over oil.Unfortunately it can't make people be nice to each other.(and since the coming of television ,we can't just kill them all for refusing to be nice- there are too many people around with consciences including me.this is partly sarcasm partly tongue in cheek.)
WW3 can start for lots of reasons,just as you can get sick for lots of reasons.You are much more likely to get sick when you are stressed out,and wars are much more likely to start when countries are stressed out.
And lots of countries are getting to be EXTREMELY STRESSED.
Neil,
Sort of a short repeat of my above comment...What I think everyone is missing is that principle of "profiting from scarcity", that the price tends to infinity for real necessities in short supply... until, they stop being real necessities as the functions that needed them collapse. Abandonment or collapse of the "unfit" is what lets the price drop back again as it did this year.
The economy breaks the back of any network of parts that requires parts it can't pay for and sheds them along with the whole chains of linked parts they once supported, if any. You can call it "hitting the wall" or "bankruptcy" or "systemic failure", but you find it hard to study scientifically because it's a feature of natural systems with multiple scales of parts and the equations of science can't represent that.
old farmer:
The one thing I would take some exception to is your comment about car pooling. I was working in Indianapolis in the late 1970s, and I can remember a LOT of carpooling going on. I participated in one myself - until I was able to relocate to a place on a bus route, then I took the bus to work. I remember that being packed during rush hour, too.
The thing about carpooling back then was that it was a problem finding other people that lived reasonably close to each other and also worked close to each other, and all on the same shifts. We now have something called the Internet, which we didn't have then. The tools should be online to help people link up with others.
Another concern is being stuck at work in an emergency and suddenly needing to get home. In the Asheville area, they have set up an emergency ride home program to cover just that contingency.
Not everyone will always be able to car pool. However, I suspect that there will be a lot more of it than you are thinking, once the incentives are substantial enough.
O bserver,
I'm with you-once things get really bad,people will carpool again,as they did here in the thirties.My grand parents told me many a time about picking up a carload of nieghbors along the way when they drove thier touring car-converted into a makeshift truck to town.
Most folks chipped in a dime once in a while for gas.
They actually made a firm habit of going at about the same time every Saturdy morning.
And my Uncle Scheafer-"sharp jaws" to every one in the community because of his bony visage and tart tongue-WALKED to town-a twenty mile plus round trip and put in ten on the line in a furniture plant for several years.
My Old Pa worked Sharp Jaw's orchard for him,part time, hour for hour,including the "commute",in order to get a little cash-whatever Schaefer was paid net for the day.This enabled Schaefer to keep up his little farm and hold the job in the furniture plant silmantaneously.
But I doubt if most Europeans comprehend just how spread out we are,and just how important it will be to hold onto a job in the hand in the future.
"once things get really bad,people will carpool again,as they did here in the thirties.,/i>"
Things don't have to get desperate for car pooling, just gasoline rationing or high gasoline prices, what observer and I were saying is that people car pool now, more can do it without "things getting really bad."
It's like saying if things get really really desperate, people may buy more fuel efficient cars!
But I doubt if most Europeans comprehend just how spread out we are
I live in Australia, the same land area as US, with 20 million people, but most people live in large cities, just like US, Canada and Europe. The difference is Europeans drive more fuel efficient cars because they pay 3 times as much for gas.
I think you have a fairly sober grasp of the situation. The problem is what to do with that view and how to get a system to mobilize to a different outcome other than crash reaction. It's difficult knowing "the end is coming" and you have some sense of just how fast things can go bad.
Let me throw a monkey wrench into your machine.
Take the average person's belief in religion, and apply it to economics. There are homeless people out there who believe in Scripture, and they just wait for their disability checks to get cigarettes and a place to sleep for a couple of weeks until the next check.
They aren't driving cars. Other, sane people have have begun to think things through and have become willing participants in ride sharing, so now we have a temporary over-supply of oil/gasoline. But try explaining to religious people that since Jesus said "Teach a man to fish", now the planet has no fish stocks left. Thanks Jesus. The fact that religious economics strip the planet of ecological morality is the problem, and until we cut out the religious cancer from Washington DC, we are not serious about addressing the real issues.
I vote for Oregon dollars. And California Dollars. Separate the economies and make states work for stability. We could have a solid state economy without the burdens of a Federal system. Oregon has the lead.
Nice work Euan.
I don't claim to be an expert in economics, but the simple model was my attempt to apply a rational, engineering mindset to the problem. I've no doubt it can be improved, but I'm glad it has at least got people thinking and debating, because there are a lot of issues with conventional economic theory that need to be exposed if we are ever to get ourselves out of this mess. As long as conventional economists are in charge, I'm not optimistic..