| Oilwatch Monthly December 2008 | The Oil Drum: Europe | How to keep on financing wind farms when banks have no money left. |
Will the UK Face a Natural Gas Crisis this Winter? (Part 2 of 2)
Posted by Rune Likvern on December 19, 2008 - 12:46am in The Oil Drum: Europe
This is the second part of a two part series about U.K. natural gas. In the first part of this series, I presented a historical look at natural gas supplies in Europe, with a focus on the United Kingdom’s (U.K.) sources of natural gas supplies.
In this second part, I present the results of simulations of the U.K. natural gas supply and demand situation for the remainder of this heating season. The results of these simulations are quite alarming: it appears that there is a significant chance that the U. K. will run short of natural gas in storage before the end of winter.

If the U. K should run short of natural gas in storage, the U. K. will need to get along with only its on-going sources of natural gas. These are gas pumped from the U. K. continental shelf, pipeline imports, and imported liquefied natural gas (LNG). Recently, these sources have totaled about 300 million cubic meters a day (Mcm/d). Cutting back to this level of consumption may be difficult, since the shortfall is likely to exceed interruptible supplies, especially during cold weather when demand may exceed 450 Mcm/d according to National Grid. There is still considerable uncertainty in precise amounts because demand may vary due to economic conditions and the weather, and supply may vary because of changes in production amounts or imports.
The primary reason for the likely shortfall in natural gas is the continued decline in production from the UK continental shelf. Production has declined in each of the last four years, and is expected to continue to decline in the future. Because of declining U. K. production, increased imports are needed each year. There is no clear path for obtaining increased imports, however. Pipeline imports are expected to remain flat or decline slightly, primarily because Norway's exports this winter seems to be at the maximum level. Liquefied natural gas (LNG) imports to date have been quite small, averaging less than 10 Mcm per day. LNG imports could theoretically ramp up with higher price or long-term contracts, but at this point show no sign of increase.
INTRODUCTION
NOTE: All diagrams are clickable and open in a larger version.
In this post, I present the results from what I now consider the most likely of several simulated scenarios. My previous experience with making predictions about U. K. natural gas (nat gas) supply and demand have taught me that there is a great deal of variability in predicted results because it is not possible to forecast weather conditions for the next several months accurately, and temperature has a significant impact on the amount of natural gas consumed. Economic conditions can also be expected to cause results to vary.
In some ways, making prediction of this type is comparable to standing on the bow of a small ship in a heavy storm taking aim for clay pigeon shooting while the ship is yawing, rolling, heaving, pitching and the gusts from everywhere tries to throw you off. I have chosen what I presently consider the most representative scenario. Actual results may be quite different. I plan to update this analysis in the second half of January 2009.
U.K. NATURAL GAS DEMAND
In the U. K., nat gas demand is high in the winter, when it is used for heating, and low in the summer, when it is used primarily for electricity production and industrial uses. Figure 01 shows a graph of U. K. nat gas consumption, split between electrical production and other uses.
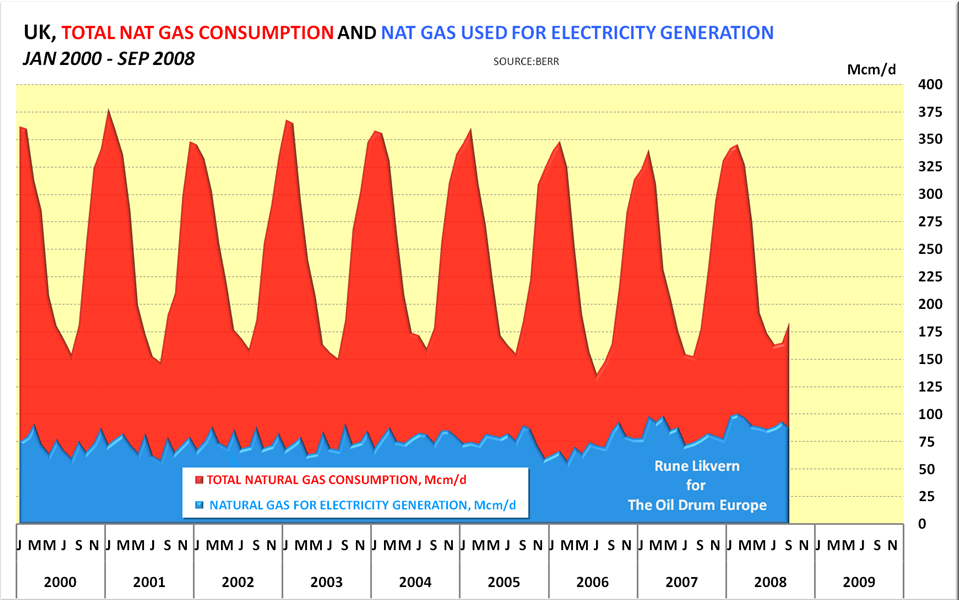
FIGURE 01 Total U. K. nat gas consumption, split between electricity generation (blue area) and other uses, based on BERR data. The portion used for electricity generation has recently been growing.
Figure 01 shows how U. K. nat gas consumption has varied in recent years. In the past year, U.K. nat gas consumption has been increasing, primarily because of an increase in nat gas use for electrical generation. For the months January through September 2008, total U.K. nat gas consumption increased by 3,9 % compared to the same period of 2007. Last year, National Grid forecast nat gas demand (SND) to be 97,3 Bcm (Gcm) for contract year 2007 (01. October 2007 to 30. September 2008). Actual data shows demand grew to 102,5 Bcm (Gcm), which is 5,3 % higher than forecast.
A major reason for the increase in natural gas demand is lower output of nuclear generated electricity. Nat gas consumption for electricity generation increased by close to 9 % during the first 3 quarters of 2008, compared to the same period of 2007. In the same time-period, total electricity consumption dropped by close to 4 %, most likely because of the economic slow down. 40 to 45 % of U.K. electricity is presently generated by nat gas.
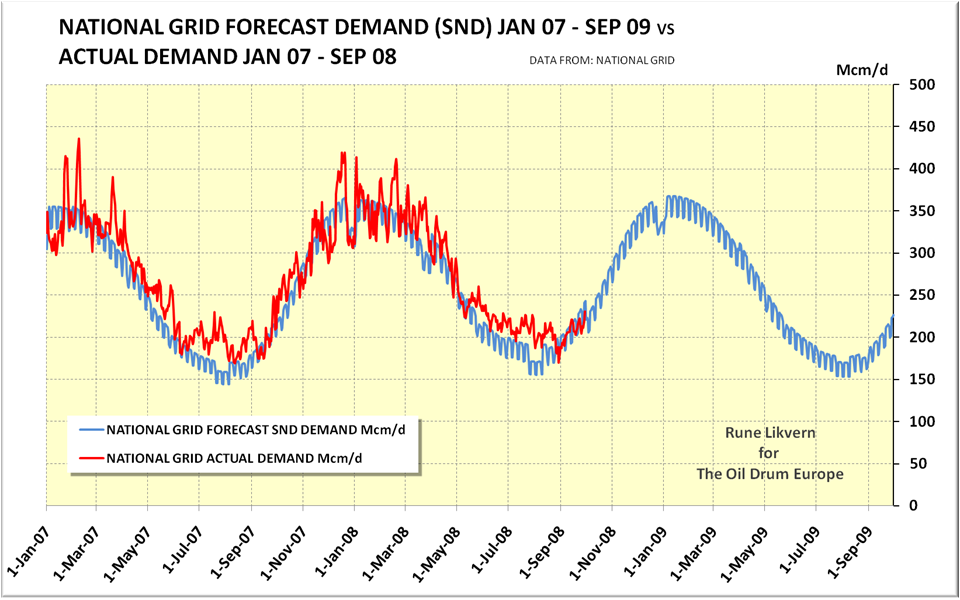
FIGURE 02 The diagram above shows the National Grid SND forecast demand (blue line), for the period January 2007 through September 2009 and actual demand (red line) from January 2007 through September 2008.
The SND forecast from National Grid for contract year 2008 (October 1, 2008 to September 30, 2009) shows a demand that is 1,2 % lower than the SND forecast for contract year 2007.
U.K. NATURAL GAS STORAGE FACILITIES
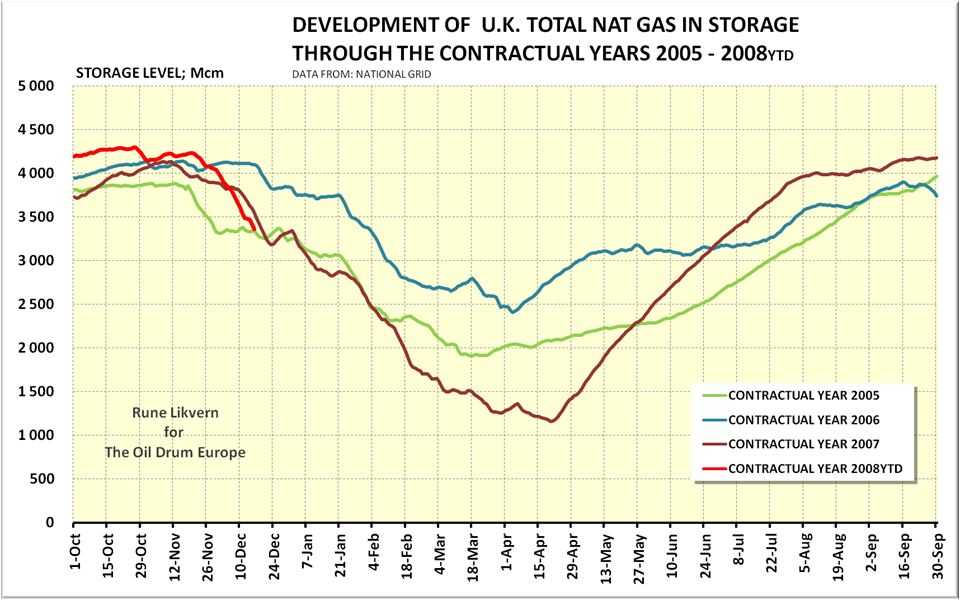
FIGURE 03 U.K. nat gas storage levels for all facilities combined, expressed in Mcm for contract years 2005 through 2008 YTD (Year to Date). The red line in the diagram is for this contract year 2008 (01. October 2008 to 30. September 2009). From National Grid.
Figure 03 shows that the amount of nat gas in storage for the 2008 contract year has been dropping relatively quickly (data is through 17.12.2008). While the amount in storage started above that for the prior three years, it is now on a path to drop below the other years.
U. K. has three types of storage facilities:
- Long Term (Rough, capacity of 3 340 Mcm and max flow rate of 42 Mcm/d),
- Medium Term (Hornsea, Hole House Farm, Hatfield Moor, Humbly Grove; total capacity of 767 - 837 Mcm and max total flow rate of 37 Mcm/d), and
- Short Term (Avonmouth, Dynevor Arms, Glenmavis, Partington; total capacity of 260 Mcm and max total flow rate of 48 Mcm/d).
The total storage capacity of these facilities at the end of May 2008 was 4 367 - 4 437 Mcm, according to data from BERR. This amount corresponds to about 4% to 5% of annual consumption.
Withdrawal of nat gas from storage is meant to complement locally produced and imported supplies when demand surges as during cold periods, or be a source of substitute supplies during unplanned shutdown(s) in the supply chain.
Normally for withdrawals of up to 42 Mcm/d, the long term storage facility is used. As demand dictates higher withdrawals, the medium and short term facilities are operated in tandem with the long term facilities. With all storage facilities operating in tandem, around 125 Mcm/d may be sustained for approximately 4 days. The long and medium term storage facilities can deliver approximately 80 Mcm/d when operated in tandem.
The following is a comparison of some vital natural gas statistics between Germany, UK and USA for 2007:
- Germany nat gas was 24 % of primary energy consumption, 83 % was imports, and storage capacities were 22 % of annual consumption.
- U.K. nat gas was 38 % of primary energy consumption, 21 % was imports, and storage capacities were just above 4 % of annual consumption.
- USA nat gas was 25 % of primary energy consumption, 16 % was imports, and storage capacities were just above 15 % of annual consumption.
The comparison above, showing the nat gas portion of U.K. primary energy consumption and forecast future growth in imports, suggests that total U.K. nat gas storage facilities need to expand by a factor of 4 to 5 to provide the same flexibility and security of supplies as some of the countries it is natural to compare the U.K. with.
In the USA and Germany, there is a wide consensus that the draw down of storage facilities should not go lower than 20 % of their working capacities as the heating season ends. This assures available spare capacity for potential spring cold snaps and/or supplemental supplies for unplanned losses from any supply source.
Nat gas storage facilities are expensive and take years to construct, so it is unlikely that the U. K. will be able to overcome its relative shortfall in storage capacity quickly. In the days when U. K.'s production was higher and was a net exporter, it could more easily meet surging winter demand and thus had less need for storage. Now that its nat gas production is rapidly declining, it needs more storage, but the storage is not available.
SUPPLY ASSUMPTIONS
The U. K.'s single largest source of supply is its own indigenous supply from the U. K. Continental Shelf. Production has been declining for four years, and is expected to continue to decline.
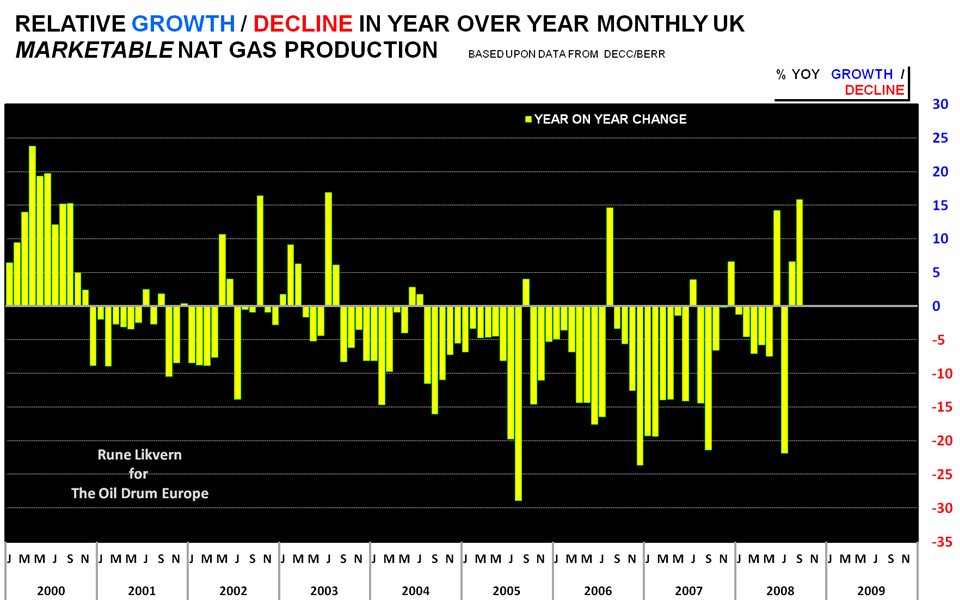
FIGURE 04 The diagram above shows year over year monthly decline rates for U.K. marketable nat gas supplies for the period January 2000 through September 2008.
Figure 04 shows the decline in natural gas production is something that goes on continuously and is hard to forecast. As natural gas fields deplete, their decline rates can increase dramatically. Natural gas decline rates are truly “The elephant in the room”. The figure illustrates why it is difficult to forecast changes in nat gas production which more becomes an art than science.
The simulation which is presented below uses National Grid forecasts of U.K. nat gas supplies for the rest of the winter as most recently documented by Operational Monthly Updates published by National Grid. Over the modeled period, production averages 190 Mcm/d. This corresponds to approximately a 10% decrease over the corresponding period a year ago. This assumption may prove to be optimistic, because the most recent National Grid update seems to indicate nat gas production during November below this level.
Net nat gas imports as modeled average 108 Mcm/d during the forecast period. This corresponds to a very slight (< 1%) increase in imports over a similar period a year ago. The modeled amount includes both pipeline and LNG imports.
In the summary at the beginning of this post, I noted that exports from Norway presently are maxed out. This is the case because nearly all of the production available for export is subject to long term contracts.
SIMULATION RESULTS
In the simplest form, the results of my simulations show how quickly the storage facilities are likely to deplete, given the estimates the National Grid has made with respect to demand and with respect to supply from U. K. production, and estimates I have made with respect to imports. These indications can be summarized in the graph I showed at the top of the post, and show again as Figure 05:
FIGURE 05 Expected depletion of U.K. long term (blue area) stacked on medium term (yellow area) nat gas storage levels based on simulation analysis.
Figure 05 indicates that based on my simulations, medium term storage (yellow) is forecast to be emptied by late January, and that long-term storage (blue) is forecast to be emptied by mid February. The amounts shown on Figure 05 are a combination of actual and forecast amounts. The darker shades represent development to date; the lighter shades represent the forecast period.
Figure 05 is only a summary exhibit. To understand better what is happening, it is helpful to view how the parts of the model work together, as illustrated in Figure 06. I start with the demand forecast by the National Grid, and fill in the portion underneath it with expected supply from various sources. During time-periods when the sum of production plus imports is expected to be less than what is required to meet supply, I draw down nat gas from storage. If there are periods with excess supply, I use the excess to refill storage. In this way, I simulate how the storage facilities are expected to deplete, and can estimate the extent of the shortfall.
It should be noted that even if Figure 06 shows a gap between demand and supplies, this should not be taken to mean that homeowners or electric power plants will see a nat gas shortfall. The operator of the grid uses models that identify potential shortfalls, and can minimise the effects by reducing flows to or cutting off low priority customers on interruptible contracts. If this is not enough to balance the system, additional customers can be cut off according to priority and/or criticality.
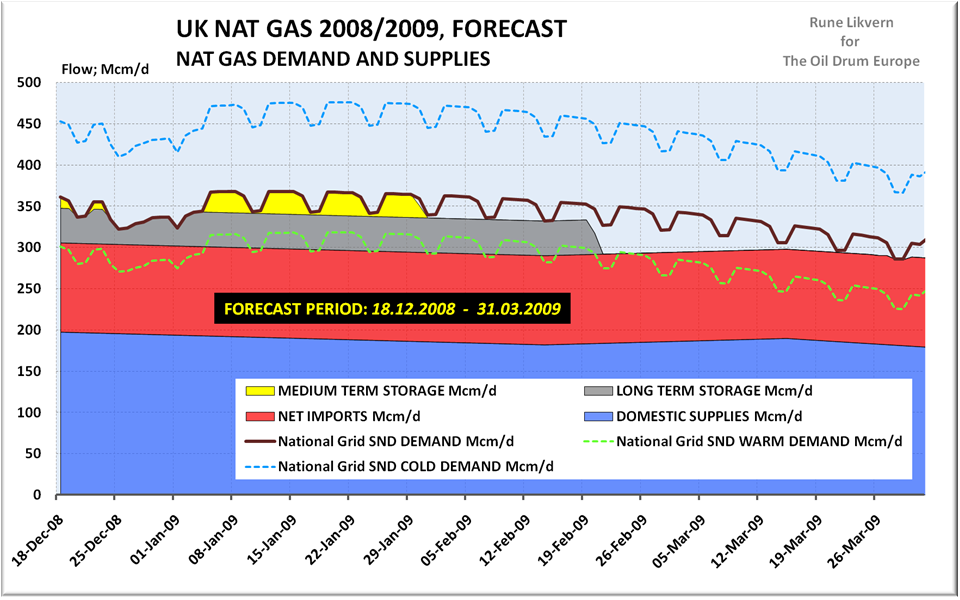
FIGURE 06 How demand can be expected to be filled, based on simulation results.
In Figure 06, the thick dark wavy line shows the forecast average demand (SND) by National Grid, and the amount filled in under this line represents the way this demand is expected to be filled from various sources (indigenous production, imports--pipelines or LNG, or storage withdrawals). The blue area represents UK's own production; the red area represents net imports (pipeline and LNG combined); the grey area represents withdrawals from long-term storage; and the yellow area withdrawals from medium term storage.
The dotted blue line (maximum demand) and the light green line (minimum demand) give an estimate of expected day to day variability in demand, reflecting changing weather conditions, based on National Grid forecasts. If total supply on any day runs higher than demand, the surplus will enter storage.
In making these forecasts, the simulation uses expected U. K. natural gas production, as most recently forecast by National Grid.
In the middle of February, demand is forecast to vary from as much as + 460 Mcm/d (See also Figure 07 below.) as suggested by the blue dotted line to as low as 300 Mcm/d, as suggested by the dotted light green line in the diagram, depending primarily on the weather. On days when demand is at the low end of this range, it may be possible to meet demand with virtually no draw-down from storage, since indigenous supplies plus imports are expected to be close to 300 Mcm/d.
The results from the simulation shows that there could be periods with a gap between supply and demand of + 60 Mcm/d. During cold spells, the gap could be even larger. Figure 06 also illustrates that less total natural gas is needed with the approach of spring and warmer weather.
In Germany and USA, there seems to be an understanding that storage facilities should not be completely depleted of working gas at the end of the heating season. Instead, storage is kept approximately 20 % filled with working gas, to handle late spring cold spells or outages of other types. For the U.K., 20 % would translate to 800 Mcm, which corresponds to approximately 4 - 5 full days demand during spring/summer (from storage only). In the USA, this corresponds to roughly 12 days of demand.
The simulation forecasts a need for additional supplies of approximately 2 300 Mcm between late January till the end of the heating season, assuming that 800 Mcm of natural gas is held in storage for late spring cold spells or other emergencies. For the simulated period of 18th December 2008 and 31st March 2009, National Grid forecasts a growth in U.K. nat gas demand of 1,8 % relative to the same period of last winter, when 2008 is adjusted for being a leap year. (This is the same demand I use in my forecast.)
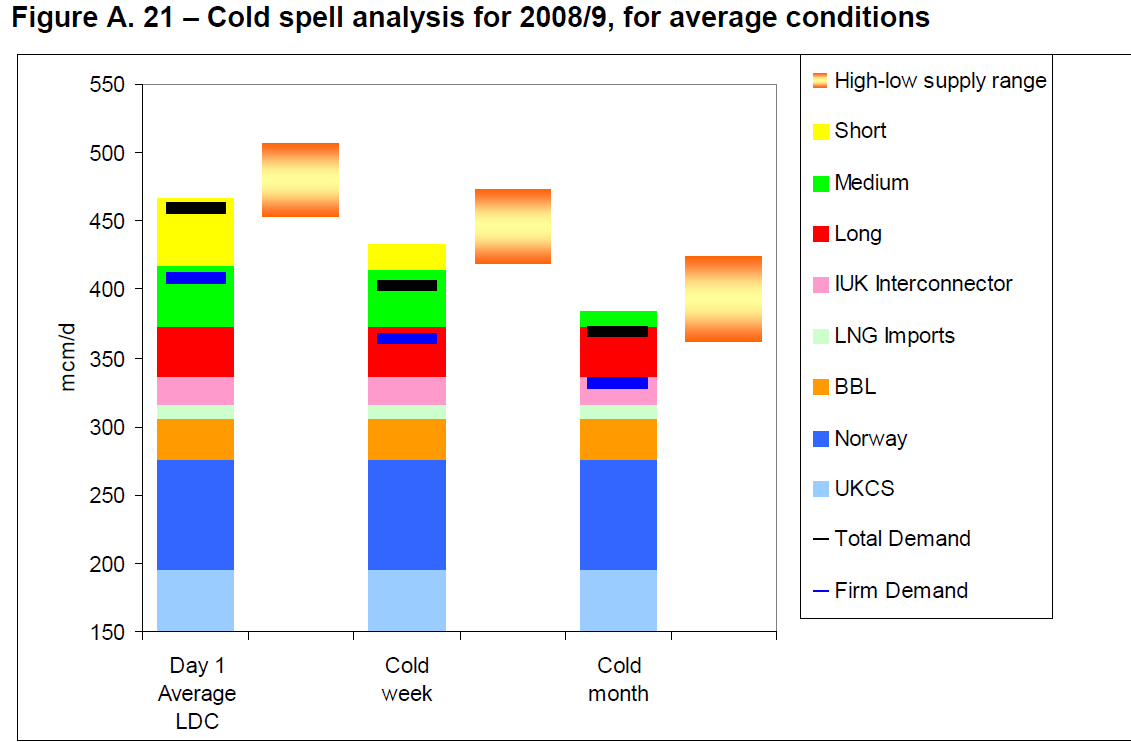
FIGURE 07 Figure A.21 from National Grid’s “Winter Outlook Report 2008/2009”, 2nd October 2008.
Figure 07 above from National Grid suggests daily peak demand during this heating season is projected to reach + 460 Mcm/d, and could be even higher during extreme weather conditions. The highest recorded so far is approximately 450 Mcm/d.
DEALING WITH A POTENTIAL SHORTFALL
There are several ways a potential shortfall might be met.
First, the evaluations in this post assumes that the end of the heating season allow the U.K. storage facilities to end at a comfortable level of 20 % of present total working gas capacities or around 800 Mcm. It would be possible to reduce or eliminate this margin.
A second option might be to increase LNG imports. This is the option assumed in National Grid forecasts, and underlying recent and planned additions to LNG infrastructure.
According to my calculations, if LNG alone were used to offset the shortfall, and additional LNG imports could begin the 20th of December, about 23 Mcm/d would be needed to bring supplies to fulfill modeled demand, and leave 800 Mcm in storage at the end of March. If imports do not begin until approximately the 20th of January, an additional 33 Mcm/d of LNG would be needed. The current amount of LNG imported is somewhat less than 10 Mcm/d. Increasing imports by this amount would amount to roughly tripling or quadrupling the amount of imported LNG, from its current level. An additional 33 Mcm/d of imports would equate to approximately 7% of world demand.
The Isle of Grain has recently expanded its LNG import facilities, so that imports of this level are theoretically possible. News reports indicate that additional supplies are being procured from Qatar, but it is not yet clear how much these new supplies will amount to and when they will start to arrive. Published reports do not yet show a significant increase in imported LNG.
A third option, if inadequate LNG is available, might be to do some fuel switching with respect to electrical supply. Natural gas used in electrical supply is expected to reach 100 Mcm/d (about 28% of total natural gas consumption) during early 2009. If another fuel could be substituted for portion of this 100 Mcm/d, this would reduce the storage draw-down.
The recent distribution of fuel used for electrical supply is as shown in Figure 08.
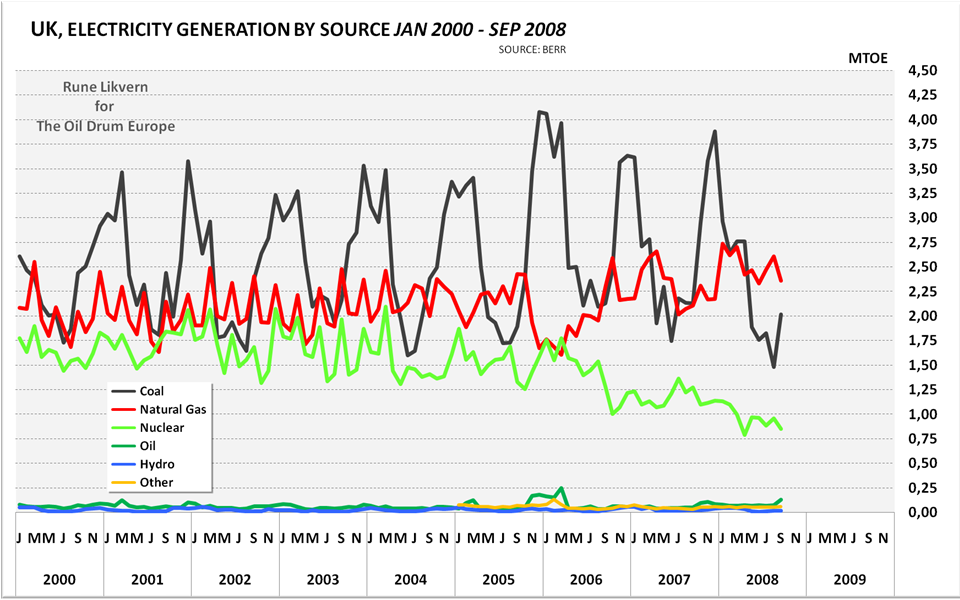
In the winter, coal is the single largest source of electrical power. Nuclear power has been declining due to plant closures. Natural gas consumption used for electrical power has been trending up. Natural gas consumption for U.K. electricity generation grew by 20 % between Q3 2007 and Q3 2008.
One fuel switching approach would be to replace some of the natural gas generation with oil. It takes around 0,1 million barrels per day (Mb/d) of distillates to substitute for 16 Mcm/d nat gas, so in theory, 0,625 mb/d of oil could substitute for 100 Mcm/d of natural gas, if all nat gas generating facilities are dual fuel and distillate is available.
It is doubtful this much oil generation capability exists, since Figure 08 shows little use of oil in the past several years. National Grid also seems to question the feasibility of much switching to oil. Point 24 on page 4 in National Grid’s “Winter Outlook Report 2008/2009” says:
We continue to believe that the switch to distillate would occur based on a gas price signal but there may be practical issues about how much switching would actually take place.
Another option, which would probably be considered unacceptable by most because of climate change issues, would be to import more coal, and use that to substitute for some of the natural gas used in electrical power generation. Coal fired generation is normally used only for a short period. If it were used for a little longer, it could permit more natural gas usage for other purposes. Based on Figure 08, this approach appears to have been used in early 2006.
If these options are insufficient, the only remaining option may be to cut off interruptible supplies, or to cut off other low priority supplies. From Figure 01 (above), it may be deduced that total U.K. industrial nat gas demand runs approximately at 60 - 80 Mcm/d. Most likely, this would be cut off, before electrical or residential production would be affected.
All of these approaches relate to total exhaustion of available working natural gas in storage over a several month period. There is also the issue of being able to meet natural gas demand on an individual cold day. The approach for an individual day would need to be similar. It is likely that some cut-off of interruptible power supplies would be needed on very cold days.
U.K. NAT GAS PRICES
The price of natural gas in U. K. is important, because it helps determine the amount of imported natural gas available, both as pipeline imports and as LNG imports. Presently U.K. nat gas is traded at around 60 p/therm (day ahead) at NBP.
At this price, it is unlikely that natural gas supplies can differentially be moved to the U. K. The necessary price to shift supply to the U. K. will change as prices for oil and natural gas change around the world. Based on prices as they are today, it seems to me that a price in excess of 100 p/therm will be needed to move additional supplies to the U. K. I talked about this in an earlier post.
In November 2008, Russian natural gas was trading in Germany at around 110 p/therm (US$ 16 - 17/Mcf) at present exchange rates. If this reflects nat gas prices at the margin from Continental Europe (plus transport and administrative costs etc.), this suggests that U.K nat gas day ahead prices need to exceed 120 p/therm this winter to attract any meaningful supplies from Continental Europe.
As I noted earlier, there is little possibility of increasing imports from Norway at any price, because nearly all of the production has been sold, and this winter there is little or none available for purchase.
The situation with LNG is less clear. Much of this is under long-term contract, and is not available on the spot market. With oil prices now relatively low, and most countries in recession, it is possible that there will be LNG available for a lower price than would otherwise be the case. A price higher than 60 p/therm would still seem to be necessary to obtain supplies, however.
One problem in planning for the future is that people assume that the future will be much like the past. If there was not a huge need for additional sources of natural gas supply in the past, the assumption is that there will also be little need in the future. One of the issues has to do with human nature and steep discount rates, which Nate Hagens has written much about, as in I am Human, I’m American and I’m Addicted to oil.
The article linked to above describes how we weight the present much more than the future when making decisions. In other words, if people experience cold during the winter, most will not care about the natural gas price at the time of the purchase, but when the bill arrives later in the spring then....... much may be changed.
BEYOND THIS WINTER
The results from the simulation of the remaining winter U.K. nat gas supply/demand show that there is a possibility that the U.K. storage facilities will become fully depleted by or before the end of this winter.
Next winter is likely to have similar, or even worse, problems. U.K. indigenous nat gas supplies are forecast to continue their decline. It is unlikely that any future increase in pipeline imports will fully compensate for these declines.
Two factors:
- increased need for refilling of the U.K. nat gas storage facilities and
- continued indigenous nat gas declines
are expected to further tighten European nat gas markets in the near future and thus support an upward pressure on U.K. nat gas (and electricity) prices. It is likely that this will also affect the nat gas markets in Continental Europe, inasmuch as less natural gas from the U.K. will become available for export to Continental Europe through the Interconnector.
As Continental Europe’s production of natural gas declines, their export potential towards UK will steadily weaken. This will increase demand for supplies to Continental Europe from sources like Norway, Russia, North Africa and LNG to maintain present or growing consumption.
More posts on U.K. nat gas supplies:
Will UK face a nat gas crisis during this winter (Part 1 of 2)
Why UK Natural Gas Prices Will Move North of 100p/Therm This Winter
Daddy, will the lights be on at Christmas?
SOURCES:
[1] BERR; ENERGY DATA, tables E T 4.2, 4.3, 4.4, 5.3
[2] National Grid; Winter Outlook Report 2008/2009
[3] National Grid, data from their webpages
[4] National Grid “Gas Transportation Ten Year Statement 2008” December 2008
Personnel
Editors
Contributors
Peak Oil Primers
Archives
- November 2010 (3)
- October 2010 (6)
- September 2010 (4)
- August 2010 (7)
- July 2010 (6)
- June 2010 (7)
- May 2010 (2)
- April 2010 (8)
- March 2010 (4)
- February 2010 (6)
- January 2010 (3)
- December 2009 (5)
- November 2009 (8)
- October 2009 (12)
- September 2009 (6)
- August 2009 (5)
- July 2009 (11)
- June 2009 (8)
- May 2009 (16)
- April 2009 (10)
- March 2009 (7)
- February 2009 (10)
- January 2009 (15)
- December 2008 (9)
- November 2008 (9)
- October 2008 (9)
- September 2008 (13)
- August 2008 (10)
- July 2008 (14)
- June 2008 (23)
- May 2008 (16)
- April 2008 (12)
- March 2008 (16)
- February 2008 (9)
- January 2008 (13)
- December 2007 (13)
- November 2007 (16)
- October 2007 (22)
- September 2007 (8)
- August 2007 (9)
- July 2007 (16)
- June 2007 (8)
- May 2007 (7)
- April 2007 (7)
- March 2007 (10)
- February 2007 (10)
- January 2007 (12)
- December 2006 (9)
- November 2006 (15)
- October 2006 (4)
- September 2006 (5)
- August 2006 (5)
- July 2006 (9)
- June 2006 (5)
- May 2006 (10)
- April 2006 (9)
- March 2006 (13)
Vital Trivia
License

This work is licensed under a Creative Commons Attribution-Share Alike 3.0 United States License.
Thanks for a very well researched post! Great work!
The issue possible natural gas shortages in the UK is one of great concern. If the UK is already in recession, and temporarily has to close down more production because of a lack of natural gas, it seems like the natural gas shortage could act to push the country a little deeper into recession.
Not to mention the UK Pound's collapse against the US$ and the Euro. I'm not sure what the TPTB are thinking as the pound collapses. When in severe overshoot, its not a good idea to destroy the link to the phantom carrying capacity that keeps the Country alive (ie. Imports).
The Pound has fallen circa 25% since the summer. If the UK needs to bid against members of the Euro zone for gas or electricity its going to hurt some.
What I would be interested in is the options the UK has to ramp up imports. What is the pipeline capacity, the LNG terminal capacity etc?
Ali - I wrote a huge post on UK gas last year and never got it finished, but here's an excerpt that details import capacity. In short, import capacity is no good unless you have gas to fill it:
Thanks for the further detail - that indeed does not sound as worrying as I initially thought. And surely enough the Dutch and Belgians and Norwegians will sell some of their own spare capacity. At least the coming few years.
It would be an interesting exercise to follow each import connection and see what the issues on the other side are. What assumptions need to hold for these connections to deliver their capacity? Of course the whole peak story, but are there other complicating factors?
Real time data on nat gas flows into National Grid may be found at Instantaneuos Flows report.
Norwegian nat gas exports is still set to grow for some years, but as of this winter there is little or no extra production capacity partly due to close down of the pipeline between Kvitebjørn and Kollsnes due to a pipeline leakage. However, this was the situation last year also.
Belgium has little indigenous nat gas production and is themselves net nat gas importers. As of now, it seems that the only additional pipelined nat gas may be purchased from Russia transited through Ukraine and Central Europe to enter the UK through the Interconnector between Zeebrugge (Belgium) and Bacton.
The Dutch have considerable nat gas reserves and their production is in decline and is forecast to continue its decline. So far, this year Dutch nat gas exports to UK are a little down. That does of course not necessarily mean that they are unable to increase exports later this winter. Dutch nat gas is presently shipped through (BBL).
Then there is the possibilities of increased LNG imports.
Dear Euan,
If we are rescued by a mild winter, then lower demand by what is left of our heavy industry may pull us through this time. I am more concerned about the next few winters coming up. I would suggest that If we are in a verifiable cooling trend, then each winter will more resemble those of my youth until even collapsing demand outstrips supply.
I would say that there is an increasing probability with each passing year of blackouts. This started in the winter of 2005-2006, and in each year after, the risk increases. We may stay lucky this year, but if luck is the only thing that underpins UK Energy strategy, then ultimately luck will run out.
Conoco in Aberdeen are believed to have sent out letters of intention of redundancy. That is today's big rumour. Where one starts, more usually follow. I suspect (but hope not) that 2009 may be as big a bloodbath in the oil industry as 1986.
Mr Brown must call an election by May 2010. If he does so any earlier (- and I doubt he will), there is a good chance it will be a candle-lit election. But I think it is probably too late now for base load security and I think we will be begging our mainland friends for help by 2010.
rgds and good luck
Dropstone
Hello Dropstone,
Conoco - a mere 5 minutes walk from where I live. The very real threat here in the North Sea is decommissioning - for many installations decommissioning was delayed with rising oil prices - I can't help feeling that if oil prices don't recover quickly then 2009 may see a flood of applications to shut down the rust belt - with Brent in front of the Q. UK oil production may take a sudden step down. But I do think we'll see 100p / therm for gas this winter which may provide some pause for reflection.
In a few years time as UK indigenous supply runs down we will become more heavily dependent upon storage. And herein lies a major problem in that we need to import gas the year round to fill storage. eventually summer and winter demand (and price?) differentials will disappear.
If the weather does get colder- returning to the pattern of the 1970s - then many will suffer living in sub-standard housing, unable to afford heating. Higher heating bills will cause more people to share flats and houses and I suspect we will not need new houses to be built in the UK for a very long time - maybe never - making it difficult to upgrade the quality of the stock.
Euan, from your excerpts of your drafted post above;
Bolding by me
That is what I consider vital to understand (as with many other things the devil is in the details) that annual supply/demand looking OK does not automatically translate into seasonal swings in demand/supplies as expressed in (Mcm/d or Bcf/d) are OK.
alig,
As Euan describes it is not lack of total UK pipeline and LNG import capacities, question is if the nat gas to fill up these capacities is there.
Rune,
Thanks for a very detailed post. From figure 08, it appears that coal fired electricity could replace more NG in spring and autumn, if LNG or European imports do not allow NG storage to be replaced. Are there limitations due to building stockpiles of thermal coal over summer or port facilities that would limit more coal fired electricity?
You have not mentioned possible domestic NG rationing. In the US in the late 1970's this occurred, and this winter in Western Australia there was also industrial rationing and voluntary domestic reductions of NG and electricity. In neither case was it a disaster to the economies. The population is willing to make big reductions if asked and if its a temporary measure, as long as politicians can demonstrate they are fixing the problem. It seems in the UK better home insulation and more efficient gas heaters or replacing NG with heat pumps would be a big help in reducing winter NG demand.
On figure 08 are all sources on the scale of Gwh electricity production or energy used? Thus is nuclear producing less Gwh of electricity than NG?
Some months ago I read a report outlining EU treaties with England which required the UK to shut down coal-fired electrical genration on some sort of a mutually agreeable time table. The speculation was that this could become impractical should NG supplies diminish. Any insight to how such agreements will effect the near term situation?
Dear Rockman,
During the next decade to 2018, A large proportion of our coal fired base load is scheduled to come offline in order to comply with EU directives. At the same time, about half of our ageing nuclear base load is due to be decomissioned. If no substitute is supplied in the form of new nuclear generation or alternatives, then we face at least 30% shortfall in base load by about 2015. EDF have recently suggested that the gap will be filled by gas turbine generation. Although the gas turbine solution is a relatively cheap solution as far as capital and plant is concerned It is unlikely to be secure regarding source of fuel. The credit crunch may even kill off these plans and quite possibley the plans for renewables.
Regrettably the UK has had an extreme free market philosphy to energy for over 20 years now. The strategic implications have never really been understood by our scientifically illiterate leadership, or actually, studiously ignored. This can be blamed on both ruling parties. Both are equally guilty.
The big question now for whoever is in power is whom do they fear most? The wrath of the electorate? or the wrath of Brussels? I would suggest that Brussels will come second to the electorate and these coal fired power stations will be retained and extended. A bargain will be struck before Brussels is blamed for switcching the lights off. However we will be rationed in the coming winters, especially if cooling takes us to the kinds of scenarios of the 1970's. I anticipate 'carbon foot print' rationing based on a national ID scheme to be used as the fig leaf and pretext and as a 'solution' to this self inflicted problem.
Rgds
Dropstone
Thanks for all the details dropstone. All I could remember from the report was a sense of potential conflict between the EU and the UK. Unfortunately we have suffered from the same political shortcomings you have. Perhaps it's our shared ancestral genes. Despite all the good reasons and grand expectations for alternative energy here we will no doubt become more dependent upon coal IMHO. Most here don't understand that coal has been the foundation of our industrial expansion for the last 20 years or so. Basically THE source of increased electrical generation. Though gasoline (via cheap oil) has allowed a very comfortable swing towards suburban expansion, coal has been an increasing basis of our economy. Certainly this does not bode well for those folks living along the world's seashores. To whatever effect man might be contributing to global warming I cannot see it abating anytime soon. Like it or not, coal is the next tool of economic expansion.
Unless, of course, the genes of our politicians suddenly mutate into a higher form of life. Yes...I know...wishful thinking.
Neil,
First thanks (it takes a lot of work to get insights into UK nat gas supplies/demand)
Presently I have no good data on stockpiles for thermal coal.
Diagram 08 leaves the impression that a lot of electricity generation may be switched from nat gas to coal thus freeing up nat gas capacities for other users.
Diagram 08 also illustrates how coal substituted for nat gas after the fire on the Rough storage facilities (long term) in February 2006. It also shows that oil (distillates) to some extent was used to (apparently) substitute for nat gas.
You are right that nat gas rationing is an option. The UK nat gas market is liberalised so it would appear a very dramatic step, as (physical) rationing as I see it would require the involvement of the UK Government.
It is of course possible with voluntary rationing, but then nat gas consumers need to be informed why and I guess this would also require the involvement of the Government.
It takes time and money to improve home insulation and/or install more efficient heaters, but these are truly steps helping reduce consumption.
The diagram shows fuel used for electricity generation in MTOE (Million Tons Oil Equivalent).
BP Statistical Review recommends a conversion factor of 12 000 kWh for 1 TOE.
Thank you Rune. This is a masterful post!
I'm curious as to how exactly one would physcially ration domestic natural gas ?
Even if your meter could somehow cut you off after a certain volume per time period there is the issue of safety with cutting off supply. The system would need flushing and pilots relit etc.
Ration by price, yes, tiered tariffs with punative use over a certain volume. But evem then how do you set that ? Per residence, per size of residence, number of occupants, income of occupants ? It's a minefield.
If the gas goes out in deep winter then the electricity grid will quickly follow as everyone plugs in their resistance heaters.
orbit,
I think you hit the nail on the head by describing rationing in a liberalized market as a minefield.
Moreover, from my understandings you are right about cutting supplies after a preset amount of nat gas has been supplied to a customer. If the nat gas system becomes fully depressurized it requires experts to flush, repressurize etc. and start it up again. This is a time-consuming effort. I have heard some numbers (based on studies carried out in/for UK) referred to as how long it would take to do this if a whole area was affected. Problem is available experts to carry out such a task.
What you describe in what I quoted above is what I envision as a very, very nasty scenario.
Rune
Rune & all,
thanks for the impressive post and interesting discussion. I would like to make a more general point first. We are heading towards a future in which societies will have to deal with situations of increasing scarcity. This becomes a "minefield" when the present situation is regulated by the market and the nature of the commodity makes it difficult to let market mechanism reach an equilibrium point via higher prices and demand destruction. The only alternative is a kind of centrally planned allocation, i.e. rationing. This is done via a process shaped by existing and emerging power structures, negotiating tables and simple decisions by default (e.g. upstream customers receive the commodity downstream don't). I see the concept of a "government" stepping in as a simplification, although possibly a useful one.
The example of natural gas appears in my eyes to be of great importance: due to its inelasticities and limited predictability, it is a market in which a situation of normality can turn into one of severe scarcity in few weeks.
Now some interesting questions arise:
- To what extent is it possible in the NG grid to produce "rolling blackouts" similar to those permitting to ration electricity among a population of consumers? From what has been said this is much less viable than with electricity.
- Are there (in UK and elsewhere) contingency plans such as orders of priority (which customer has to be served first) or planned procedures in order to empower decision makers, set up negotiating tables, and the like.
I should add that this is a line of research I would like to follow from the point of view of conflict management strategies. My technical understanding is limited but as far as I understand many industrialized countries rely on a steady NG supply in a free market environment under very naive assumptions that this is a reliable, safe state of affairs.
Thanks!
Thank you for bringing in an interesting perspective to the debate.
From what I understand, the physical nature of nat gas makes it more difficult to ration through methods like “rolling blackouts”, because it is difficult to be certain that everyone at the end of the day has kept a little overpressure in the system thus keeping air out. If the system becomes totally depressurized the chances are air will enter the system Air and nat gas is an explosive combination if ignited.
I have no firm information on plans for order of priority during an actual shortage. Politically I would assume households, hospitals and institutions highly vulnerable from shortfalls would get priority. (Just guessing here)
Then again, gas in a liberalized market flows to the highest bidder, and I guess it would be difficult for a government to intervene during such a situation.
What about customers who has contracted deliveries for a longer term should these be subject to rationing?
I can well understand that such a situation would become quite interesting from the view of conflict management.
How does a critical mass of people react when one of their vital support systems stops functioning?
“rolling blackouts” of ...Electricity.. will be the way to limit natural gas consumption.
No electricity no combiboilers working less nat gas consumption .
Rune,
A more realistic plot would be to compare the amount of electricity produced, thus wind power now accounts for 4% of electricity consumption and with another 12% under construction, approved or planned could replace some of the NG especially in winter months.
Neil1947,
The diagram below
has been lifted out of "ENERGY MARKETS OUTLOOK" December 2008 (made public today)
by DECC ( (UK) Department of Energy and Climate Change).
The document can be downloaded from here (large pdf).
The pie chart above lists wind as 1 % of UK electricity generated In 2007.
Chart 4.2 (page 23) in the "ENERGY MARKETS OUTLOOK" shows a pie chart of UK electricity generating capacity by technology and it also lists wind as 1 %.
Hydro pumped storage generated electricity? After accounting for the electricity it buys to run the pumps and some real world inefficiencies, it is a usually an electricity sink. If the plant is on a river or some other place that also produces conventional hydro power, then only the part that is generated as a result of water that was pumped, flowing back down should count as pumped storage, the rest, (the river flow,) should be counted as regular hydro.
Most likely, that chart is double counting it with something else, (probably the base load nuclear plants.)
Rune,
I looked at the new Energy Markets Outlook report that BERR made public today. In the I little I looked at it, I didn't see the natural gas problem highlighted. Instead, it seems to be relying on things that won't work.
These are some charts I found. Chart 5.11 shows LNG is expected to ramp up much more slowly that capacity, and 2009 is still expected to be low, even with the new capacity.
Chart 5.12 indicates that while quite a lot of storage has been proposed, very little of it is under construction. The National Grid base line indicates (according to the text) that the National Grid doesn't think that all of the proposed construction will be built.
In the next few years, Chart 5.14 indicates that the hope is that somehow, more pipeline gas will come from Norway, and a little from the Continent, which I suppose is ultimately Russia. Your post tells us this is not likely to happen.
Gail, thanks.
I have just been looking on the nat gas part of that document, and I have different expectations based upon the descriptions of the methods National Grid has used to forecast future Norwegian UK supplies. This because Norwegian sales are company based, that is each owner in a gas field is free to sell its gas into the market it prefers (which means the highest bidder), which may be UK, Belgium, France, Italy, Germany etc.. Germany by Chancellor Merkel asked (during a visit this spring to Norway) for more Norwegian nat gas.
However, in this post I will focus on supplies this winter. I take it as when the diagrams shows 08/09, 09/10 etc. that it means Contractual Years (which starts 01. Oct. and lasts till 30. Sep. the next year.)
I think it is important to bear in mind that The Energy Markets Outlook from DECC is used by, amongst others, many of the commercial actors to plan their investments and strategies. Chart 5.11 would tell all the commercial actors that most likely the UK market is adequately supplied with LNG this winter, so I doubt anyone would venture into LNG speculation based upon this Energy Outlook. The information in an official governmental publication bears much more weight (and it should do!) than a post on an excellent energy blog.
During the contractual year 2005 (01. Oct. 2005 till 30. Sep. 2006) total UK LNG imports were just above 2,7 Gcm (Bcm) according to data from BERR/DECC and it looks like they expect pretty much the same this contractual year (2008/2009).
Norwegian supplies for this contractual year on an annual basis could be quite accurate. However what counts is average daily supplies during the winter season, and last January and February Norwegian supplies was on average close to 90 Mcm/d (based upon data from BERR/DECC. I doubt the Norwegian supplies on average daily basis may go beyond 90 Mcm/d this winter. They could of course on a single day or two days in a row reach as high as 105 - 108 Mcm/d. What counts; are total deliveries during a month.
Chart 5.1.2 just expresses that there will not be a huge future expansion of UK nat gas storage capacities.
Chart 5.14, I will also expect Norwegian nat gas supplies to grow towards contractual year 2011 (this based upon decisions to tie in some of the Norwegian fields presently under development to UK gas systems like SAGE and FLAGS. For contractual year 2007 (ended September 2008) UK imports from Norway was 23,5 Gcm (Bcm) (data from DECC/BERR).
The forecast imports beyond contractual year 2011 could be or could not be, dependent on potential clauses to extend running contracts as these expires.
Regarding imports from Norway, do you mean that while imports from Norway are not going up this year, they may go up in the next two contract years? I am not familiar with SAGE and FLAGS.
I expect annual nat gas imports from Norway to increase this Contractual Year, but average daily deliveries (based on total monthly deliveries) this winter I expect to be close (at best) to last winter that is approximately 90 Mcm/d.
Yes, I now expect imports from Norway to UK to grow towards 2011, but beyond 2011 it becomes really difficult to tell, imports could remain level, but most likely they will decline as some of the running contracts expires.
FLAGS; Far North Liquids and Associated Gas System, pipeline system on UKCS gathering gas from several fields and landing it in St. Fergus, Scotland.
SAGE is also a UKCS pipeline system for wet gas terminating in St. Fergus.
Rune,
This is another graph from the new ENERGY MARKETS OUTLOOK report, showing National Grid ranges of annual demand and UK Continental Shelf production. Somehow, they are forecasting in their base case a year of non-decline. (Actually it looks like that is for last year, and we know that didn't happen!) It is strange how these forecasting agencies can so often make the near future look much better than the past!
Click for larger image.
Gail,
From Contractual year 2006 to Contractual Year 2007 (Gross withdrawals/production) minus operators own use (fuel gas and gas used for reinjection) there was a decline of around 1 % according to data from DECC/BERR. In other words the production was pretty level from Contractual Year 2006 to Contractual Year 2007.
What counts for this post is the decline from Contractual Year 2007 to Contractual Year 2008 (which started 01. October 2008).
The annual decline in Chart5.6, which you so kindly have copied in above, from Contractual Year 2007 (ended September 2008) to Contractual Year 2008 (ending September 2009) is measured to close to 10 % using Photoshop and Adobe Acrobat.
Next year by this time we will know the actual figure.
Yes, I have assumed an average 10 % decline in my simulations which this post also describes.
Great work Rune.
2 questions:
1) Yesterday in USA, Chrysler announced shutting down plants for a month. This causes all auto suppliers (which are large utilizers of natural gas for plastics), to be uncertain and there is a chain reaction drop in demand. Due to this I would be surprised to see more than a 120-125 bcf withdrawal this winter if temps are normal due to reduced industrial demand. How much 'demand elasticity' is there in UK/Europe? I.e. what is the resting pulse of natural gas demand? Can it drop more than your supply will?
2)As storage drops towards zero, isn't there a positive feedback loop as the amt of open space in storage allows the molecules to expand, etc? Basically is there a point where the remaining gas, although 'there' becomes unaccessable without extra technology and costs? Or in UK case, can it be drained dry like a gasoline tank on an automobile.
thank you
In the US, I know that Dow Chemical has reduced production at it's Freeport Complex (south of Houston) to ~35% in response to reduced demand for its products and to work off excess inventory. The auto industry is one of their biggest customers, so it seems likely that Chrysler shutdown may extend Dow's slowdown longer than they originally anticipated. I don't know how much gas they use running at capacity, but I am sure it's a lot.
Earlier this year Freeport LNG L.P. opened a new LNG terminal not far from Dow on Quintana Island. Due to the low price of gas, according to a relative who used to work there, they have only taken two shipments since March.
Thanks Nate,
Regarding your good questions:
Ad;
1) You are referring to weekly US withdrawals.
The same thing might happen in UK, and thus affect the demand side of the equation. People being affected by plant closures tend to stay home and needs to stay warm, which suggests that you may see reduced industrial demand and increased domestic (households) demand. Demand shifts from one sector to another. And then there is the weather.
Shut down plants also requires a minimum of heating to preserve equipment and prevent freezing of water pipes (to name a few) during periods of cold weather.
I have not seen any data on this elasticity for UK. This could create a situation where potential net demand decrease became more than the estimated shortfall presented in this post thereby balancing supplies and demand.
Both cases will affect the economy negatively, hard to say which one is worse.
2) Nat gas is compressible. In nat gas storage facilities there are two kinds of gas. The first one is often referred to as “cushion gas”, this is the gas that is required as a minimum to make the storage facility operational. I have never heard about situations that this “cushion gas” has been withdrawn to supply the market, but in theory, it could be possible.
The second kind of gas is “working gas”, and it is the amount of “working gas” in storage, which is reported by operators or official institutions. “Working gas” is estimated available to supply the market.
“Working gas” needs the “cushion gas” to become......“working gas”.
As “working gas” is withdrawn from storage, pressure drops and gas expands (which means the gas density decreases) so what is to expect as a critical amount of “working gas” is withdrawn, is that withdrawal capacities (expressed as Scf or Scm; i.e. under standard conditions) starts to decline.
Some of the storage facilities are leached out from salt formations (salt caverns) which are plastic elastic, meaning they tend to shrink a little over time and as pressure declines. To reduce this shrinkage the operators normally define a minimum operating pressure (i.e. the equivalent of “cushion gas” for salt caverns).
If pressure is let down beyond this minimum operating pressure for salt caverns (i.e withdrawing also some of the “cushion gas”) they tend to shrink faster, thus reducing volume and thus future “working gas” storage capacities.
Other nat gas storage facilities are previous gas fields (like Rough). This kind of gas fields are produced (pure pressure depletion) until the pressure in the reservoir declines to a level where it is not possible to push the gas from the reservoir to the surface, in other words the weight (pressure) of the gas column equals the pressure in the reservoir.
This point/minimum is often referred to as the storage facilities “cushion gas”.
Rune
Thanks for the hard work and worrying analysis!
Just one question:
If I understand this correctly, it'd be nice to see a line showing the 800 Mcm on Figure 05 (where it should end), rather than having it go to Zero.
It would be interesting to see if/when it gets to Zero in the early spring.
andybts,
Yes, you understand it the way it is intended. Ending the winter with 800 Mcm working gas in storage will allow the system some flexibility for a spring cold snap like there was last spring.
Thanks for the reply.
This may not help matters either: Russia's Gazprom threatens Ukraine cutoff over debt (again). From Leanan's BrumBeat post
EU will bail them out, IMHO.
If any Oil Drum readers have UK government or newspaper contacts, and could send a copy of this article to them, that would be good. I think it is a very important article for them to read.
Even US papers (NY Times, etc.) would be good.
Dear Gail.
This is a link to the House of Commons forum on peak oil.
http://www.appgopo.org.uk/
It is still probably regarded by most MPs as a forum for cranks, however much good work they do. It may take a severe winter (at least by current standards of severity) to tip us into rolling blackouts or load shedding as I understand the euphemism before they will be consulted.
This is why I fear cooling more than warming. But I do not wish to warp the direction of this very important post more than that statement of concern and so will not mention it again.
Rgds
Dropstone
Thanks for the information. I sent them a link to this post.
Rune,
This is excellent stuff. What I want to know is what are the relative costs of providing all these new pipelines and LNG terminals compared to insulating the building stock to get the winter gas demand down (and meet CO2 reduction targets).
Do you have costs for the pipelines and LNG terminals?
If I rummage hard enough I might find some projected costs for a national programme of insulation.
Thanks,
BobE
(must go and do my Christmas shopping now!)
BobE,
thanks for your praise.
The additional supplies as described in the post do not need any new import pipelines or LNG receiving terminals. These investments are already made or in their late stages of completion.
I don’t have any data readily available to post now, but the above suggests that there should not be a need.
I have no cost data for insulation, but from what I have seen earlier there are a lot of readers who can provide or refer to these kind of data.
Rune
(and BobE, .....happy shopping!)
Here is some of the info on insulation and heating you were looking for:
http://www.iea.org/Textbase/pm/?mode=cc&id=4240&action=detail
http://www.vincentcable.com/news/000483/warm_front_grant_event_hosted_by...
I’ve e-mailed Vince Cable MP, who is the economics spokesman for the Liberal Democrats and in the this link on the 'warm front' initiative shows that he is aware of the poor insulation standards in the UK.
I linked to the TOD article and outlined concerns for this winter and next.
Bob - you lack clear understanding of economics. Insulating houses cures a problem and therefore provides few opportunities for growth. Building LNG terminals and pipelines on the other hand provides many jobs in steel and construction industries and building LNG carriers also creates the need for aircraft carriers to protect them etc. And miserable living conditions at home may boost recruitment into the armed services - who from time to time need use of costly medical equipment and drugs etc.
The unused LNG carriers [no LNG to buy] could be useful, insulated emergency shelters/workhouses for the new UK homeless - surely a real growth area. The remaining reposessed houses can be used for housing the 1/3 mil immigrants arriving in the UK annually.
If much of UK housing is old and has never been retrofitted-as I have heard rumors, the cost will be enormous (as will the pay back) Materials alone-windows, doors, insulation-usually will run in the ten to twenty thousand dollar range for bringing a 1500 hundred square foot shoe box up to relatively tolerable late twentieth century standards (sorry about the lack of metric but I'm a lazy yank) Alaska recently initiated a major weatherization program requiring licensed pre and post work energy audits with the state paying a maximum of $10000 for the successful upgrade of a shoe box to a five star energy efficient home. Small frame boxes may be able to have a the major slice of their work paid for with this but most will be lucky to have it cover half the cost. Sorry these are just seat of the pants numbers but I have been in the industry for a while so they are a rough guide. Masonry buildings require more money yet. Of course it all depends on how bad your buildings are to start with and what the targeted final efficiency is to be. This is always price dependent with the projected price of heating fuel playing a huge part in the equation. This link provides more links to available weatherization programs in Alaska.
http://www.alaskacdc.org/WxInformation.htm
There was an immediate bottle neck even when a sizeable chunk of state change (seems like it was $100,000,000) was made available because there were very few licensed energy auditors and they were all booked for months. Qualification courses were quickly added and now, mid winter in the interior, there are enough auditors around to get the ball moving.
Residential construction was the industry that kept our overleveraged bubble of an economy running in the US for the last several years before the bust. Retrofitting all of Great Britain's buildings to become as efficient as is reasonably possible would be a huge undertaking and fire the economy for some time, if the money and will could be found to do it. Mind you now this state only has about 600,000 people. $100,000,000 doesn't go very far here.
See the links I have given above for the projected costs - up to about £2750 per house is budgeted for.
Of course, this will be for a much lower standard of insulation than you are talking about.
Two factors are important here.
The first is, of course, that Britain is nowhere near as cold as Alaska, and so getting to a reasonable standard is nowhere near as expensive when you do not typically have -20 or -40 temperatures.
The second is the 80-20 rule.
You can usually achieve 80% of the result for about 30% of the cost.
A good example of this would be the heat loss through uninsulated ceilings.
Out of 24 million homes in the UK, about 3 million have no insulation at all.
Putting in 270mm of insulation, and upgrading those with only 90mm to 270mm is very, very cost effective, and greatly reduces heat expenditure for a given temperature.
Sealing doors and eliminating drafts is also very cost effective - a bit of tape can save a fortune.
Obviously double glazing is fairly expensive, but you appear to be talking about perhaps upgrading to much more expensive, very high insulation windows, which is likely not worthwhile in the British climate.
As for masonry walls, there are still many in this country which are cavity walls, but have no insulation in the cavity.
Single skin masonry walls are more difficult.
The bottom line is that doing a really good job would be very expensive, but one heck of a lot could be done at relatively modest cost, starting with the worst properties first.
Conservation would be Britain's cheapest source of power, but interest has been sporadic and the tariff system discriminates against any attempt to conserve - you are charged the highest rate for the first units of power, then progressively less for using more.
There are grants available for insulation for the poor, but many poor people, strangely enough, do not have handy the several hundred or thousand pounds that would be their contribution.
Ain't capitalism wonderful!
Thanks Dave, It was three a.m. when I posted that and though I was aware of the bang for the buck being much greater on the worst insulated buildings the 80-20 rule was not on ready recall.
The tariff system certainly looks like the place start. Will it take rolling brownouts and empty storage facilities to bring the political will to change it.
For all the differences between Alaska and Britain, (I often have snow on the ground steady for seven months in my yard) the critical elements for making conservation a major source of 'new' fuel are the same. The plan must be comprehensive, continuous and properly monitored. You would never guess who put our most recent plan (the most comprehensive and best funded to date) in play. Sarah Palin. It did not hurt that the state's coffers were flush with oil royalty cash or that our construction industry was about to hit a downturn when it was implemented though.
I was a plant engineer for Eveready Battery Co in the 70's when the NG crisis hit the US. The Gas curtailment plan for manufacturing facilities was draconian. The instructions were to cease all use of Nat Gas except one small room (!) in the plant could be kept warm and all materials at risk of freezing could be placed in that one room and kept warm. This was impractical in the extreme and additionally NG was crucial for sealing the batteries. We developed alternate processes to allow us to seal batteries using fuel oil fired burners but this took a week or so of intense work. This was the only time in my career when I was given a blank signed purchase order and sent to the largest propane supplier in Ohio and told to buy anything that I thought could be used to augment our work! The emergency order was never enacted since everyone voluntarily cut usage and temperatures of homes, offices and factories were voluntarily cut drastically and the supply was just sufficient. The problem in Britain will be aggravated by an inability to fill the reserve since summer production is not in sufficient excess to be used to fill the storage.
One way for UK to get around it is to increase imports during the summer.
However, the summer is also the season for heavy maintenace on the nat gas supply chain.
Except the UK is still exporting gas daily in winter - if not on an annual average:
http://www.interconnector.com/onlineservices/historicflows.htm
You are right. It looks like the UK is still exporting gas in winter. This is the exhibit you link to:
UK also exports NAT GAS to Ireland ref the diagram below which was used in the first part of this series;
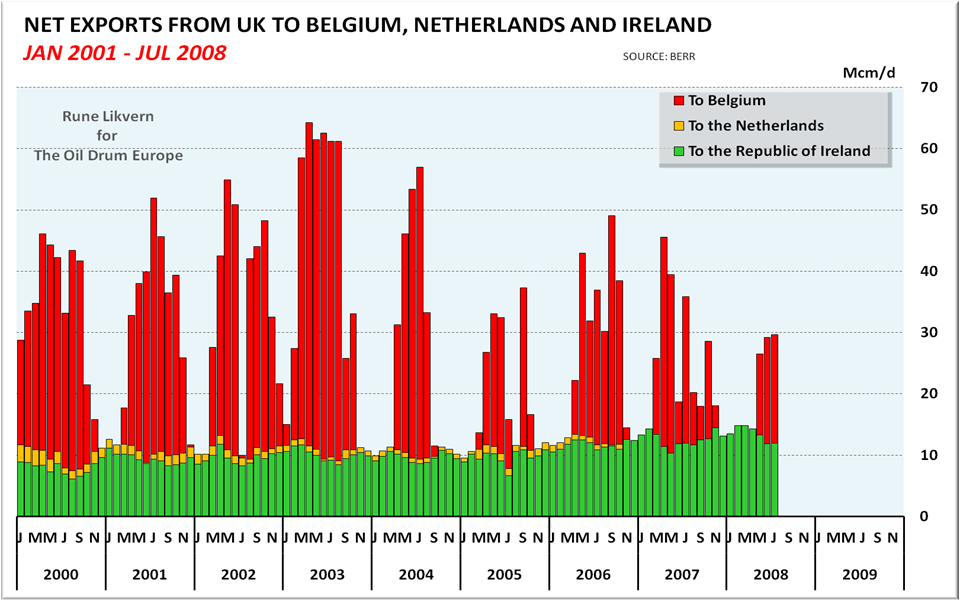
The diagram shows daily average exports to Ireland, the Netherlands and Belgium based on monthly data from DECC/BERR for the period January 2000 through July 2008.
The diagram Gail included above shows a small net flow from UK to Belgium during the last 30 days.
When looking on UK and making the simulations the gross imports are adjusted for the exports. (Another way is to take total UK marketable nat gas and adjust it for exports)
What Is not known is If there are UK commitments for deliveries to Continental Europe through the Interconnector, and further are these deliveries interruptible.
Thanks for reposting your nice graph. Exports to Ireland aren't a whole lot, but it looks like they were up last winter, and perhaps the winter before that.
This winter, I suppose it depends on a combination of the economy and the weather. If the economy is way down, these may be down. Cold weather would likely increase these exports.
Thanks Gail.
It should have been updated though.
Ireland uses a lot of nat gas for elctricity generation.
The Met Office expects warm weather for the next couple of days for UK, then it will become cooler and towards new years eve The Met Office expects colder than normal weather.
Great job Rune,
Abolish outside lighting and you can greatly extend natgas for I-NPK, heating, and inside lighting-->we are evolved to sit in the dark while admiring the stars. IMO, flashlights/torches and vehicle headlights are sufficient for movement after sunset. Consider the staggering amounts of pointless waste in this 'Earth at Night' photo:
http://apod.gsfc.nasa.gov/apod/ap001127.html
Photons are very, very, very heavy if one considers the megatons of FFs required. It boggles my mind that we continue, **every single night**, to try and make black asphalt reflect photons. My definition of societal insanity. :(
Bob Shaw in Phx,Az Are Humans Smarter than Yeast?
http://www.lightpollution.org.uk/index.php?pageId=4
--------------------------
Confusing our wildlife
Many animals depend on the regular rhythms of day and night to keep themselves regulated (called the circadian rhythm). Some are nocturnal and depend on the dark nights to allow them to hunt. Many moths and some insects only come out at night to mate and reproduce. In many areas the high levels of light pollution is confusing these animals and disrupting the patterns of their life. They are experiencing the 24 hour day! In millions of years of evolution there has been little or no night light except above or below the Arctic and Antarctic circles.
An American butterfly scientist has commented that with 24 hour daylight, caused by light pollution, the life cycle of diurnal butterflies are "compromised"! The actual expletive used has been deleted to protect the innocent! Those with forensic inclinations can take a clue from "****ed" being very close to the word which was actually used!
----------------------
Makes one wonder if our food chain will collapse even faster because we refuse to forbid outside lighting. Think of all the illuminated streetlights [not traffic lights], retail store signs, roadside billboards, Xmas lights, landscape lighting, parking lot lamps, car-dealership lamps, etc, that could be easily turned off.
This puts into perspective multibillion dollar offers by BG Group to buy into Queensland coal seam methane including CSM-LNG. The company line was to develop Pacific region markets but surely the hope was to send gas back to the UK.
I think an effort must be made to preserve the gas reticulation network since it is a sunk cost and it offers both efficient CHP and truck/bus depot CNG refuelling. Clearly biogas will never replace NG and I believe the Swedish railways are pinching gas from other users. That makes me wonder if a methane dominant syngas should be pursued even if the net energy is low. Approaches include plasma gasified-methanated garbage and Sabatier type reactions perhaps with nuclear assist.
Additionally I think the single warm room concept (where is DaveMart?) should be promoted by the government, perhaps in conjunction with a gas ration.
Hi Boof,
I know its good to have a laugh during adversity, but this is serious. And HOPE is all we (in UK) have got!
There is a reason why they changed their name to BP.
So BP sending Oz CBM/LNG to UK - only if they can make more than selling it in the Pacific region.
That said maybe they can as they would be both the exporter from OZ and the importer into UK - all the makings of a great scam with the UK gas customer picking up the tab.
Here's a link re Brit designs on our gas
http://www.businessspectator.com.au/bs.nsf/Article/Queensland-Gas-strike...
Something I find a bit spooky is that just after WW2 the Brits detonated A-bombs and air blast dirty bombs in two places in Australia, Maralinga and Albrolhos Islands. Like any good colony we couldn't say no. Within twenty years the first area revealed large uranium deposits (Olympic Dam) and the second became a hub for the major Northwest Shelf gas development. Like some kind of magic wand with the pixie dust still settling.
This gets far too spooky Boof....
read on....
If you draw lines from Maralinga and the Montebello (Abrolhos?) Islands through the centre of the earth the core causes them to 'bend' and you will never guess where they come out....
The North Sea and Milton Keynes....
So within ten years of the A-tests the first revealed large oil and gas deposits responsible for the North Sea Oil and Gas boom and the second, 21 years after the tests, witnessed a still unexplained phenomenon where cows were petrified instantaneously into concrete....
Spooky or what?
So the question that has to be asked is "Did the Oz A-tests cause North Sea oil and The Concrete Cows or did the British Government use them as a distraction to carry out tests over mainland Britain and the North Sea?
Does anyone out there know the answer?
Goood,
I'll have you know I went to the opening of the Concrete Cows. They had a stall with lemonade and a guy playing a violin. It was the only day I attempted to walk across Milton Keynes. I took a taxi back and never did it again.
I moved back to London to live in a real walkabout city (and all without having read any Kunstler).
As for underlying causes of Concrete Cows or cities like Milton Keynes, I have no idea,
BobE
Right - back from shopping (3 hours, failed miserably to buy anything substantial!)
Thank you Euan. I'm glad to note that all the gas I will not be using in the future as a result of my new double glazing will be reducing the UK's future GDP.
Eaun's chart of where all this gas is going to come from is very important. I wish that something like it was in government reports. And, we need some careful analysis of whether there is actually any going to be any LNG to fill all those tanks.
The DECC Energy Market Report has a base case of rising gas demand to 2020. At first I found this a little odd, since Parliament has just passed the Climate Change Act which starts:
So I would have thought that all our fossil fuel projections ought to be going down. But it seems that there are a lot of policy options.
Another important report is that I would recommend to you is that from the UK Committee on Climate Change at
http://www.theccc.org.uk/reports/
This is very detailed and the various chapters are well worth reading.
Chapter 2 - 'Meeting a 2050 target' contains trajactories of reductions in energy use to get to 80% reduction.
Chapter 3 - 'The First Three Budgets' makes it clear that they are well aware of potentially high and volatile oil and gas and coal prices including 'a high high' gas price of 90p/therm.
Chapter 5 - Decarbonising Electricity Generation in this report is about boosting renewables and gas to boot coal off the system. The choice of technologies seems to have been done on price using Markal (Market Allocation) modelling. If you assume that gas is cheaper than coal with carbon sequestration, then you will get lots more gas plants and UK gas demand will go up. Yet earlier this year, when gas prices were high, I went to a talk about Markal modelling where coal CCS had suddenly become the preferred choice, so presumably in that scenario UK gas demand would be projected to fall. (Figure 2.28 in this chapter 2 of this report gives a nice diagram of all the potential places in the world that CO2 could be sequestered underground - there doesn't seem to be great shortage as indeed Rockman tells us.)
Chapter 6 - Energy use in Buildings and Industry is interesting. At present in the UK the utilities are pushing half price insulation, free insulation and free low energy light bulbs. Add in the past regulations on low energy fridges, and high efficiency gas boilers and things seem to be changing. UK domestic heating energy consumption may have peaked in 2005. Electricity use for lighting, cooking and cold and wet appliances is on the way down. It's just all these computers and people drooling over TOD and TAE all day that keep the electricity demand going up!
Chapter 7 - Reducing Domestic Transport Emissions is a good read for TODers.
Chapter 13 - 'Energy Security' has some words of wisdom on the benefits of energy efficiency and renewables rather than relying on all those price-volatile imported fossil fuels:
That's probably enough from me for the moment,
BobE
Bob - I find it hard to respond to any post on UK Energy policy since it is so confusing. I am set dead against the alignment of Energy and Climate in the newly formed DECC (Department for Energy and Climate Change) whilst I hasten to add that I firmly believe that energy policy should follow a precautionary principle and be as environmentally sustainable as possible - all aspects of environment including emissions.
The main guiding criteria I think should be followed are energy security and energy efficiency. In the latter case, some mechanism is needed to ensure that efficiency gains are delivered as energy savings and this I think ultimately leads to rationing - tradable energy quotas.
One day about a year ago I got a card through the letter box informing me of a parcel that could not be delivered. I had to drive about 3 kms to the post depot to pick up the surprise package - a free pack of energy saving light bulbs.
We have the Lewis wind farm where concerns over CO2 emissions from the peat was one raeson planning consent was denied.
We have green tinged public concern about nuclear power that has led to decade long delays in deploying a new, modern nuclear fleet. This i might add is very likely minority concern since it is quite likely the public would prefer to run the risk of nuclear if it means keeping the lights on.
We have a target to reduce energy consumption set along side plans to build CCS - an energy intensive strategy.
Liberalised markets have driven us down the dash to gas without any pause for thought about where the gas might actually come from. The DTI have reports on this which are very superficial based more on hope than any detailed analysis of reservoirs and international competition for scarce resources.
And so forth. Our energy policy as it stands is a shambles and looks set to get worse.
Euan,
The low energy light bulbs will be very cost-effective even taking into account that you have had to go and fetch them.
A 20 watt compact fluorescent will save around 640 kWh of electricity over its life compared to incandescent lamps. That's the equivalent of not burning 150 litres of fuel oil in a power station. And it reduces the need for power generation plant at peak times (like dark winter evenings). As a free gift it's a snip.
People don't need energy as such, they need the services that energy provides, warm homes, illumination, communication, etc.
I'll agree that UK energy policy is in a mess, but it has to be steered in a better direction. The 80% in CO2 emissions by 2050 comes in phases and is legally binding, so someone will have to sort out some policies.
After 1973, the Danes did a good job of getting out of an almost total reliance on imported oil by switching to coal, CHP and energy efficiency. The have done this and and it shows clearly in the national statistics. Similarly in California energy legislation and doling out the low energy lightbulbs has kept electricity demand down compared to other states since 1979.
Change is possible, but only if people understand the true dire situation, and its complexity, which is what TOD is supposed to be for,
BobE
BobE,
In other words these new light bulbs helps cure a problem.
Somewhere else in this post Euan wrote;
I will leave to Euan to do the explaining. ;-)
Rune,
The energy efficiency approach requires considerable feats of manufacturing too. We need to produce of the order of a cubic kilometre of insulation material to wrap round the UK building stock.
Not to mention a couple of hundred square kilometres of glass for all that extra double and triple glazing.
It all makes (GDP attributable) work for the working class to do and the ruling class to extract wealth from.
Also pages 86-90 on energy efficiency improvements to Abrams tanks and B52s in Amory Lovins' Winning the Oil End Game
http://www.oilendgame.com/ReadTheBook.html
have a certain dark humour.
BobE
Bob, thanks for the figures, which I was not aware of.
As a temporary measure, bubble wrap can be stuck to windows to increase insulation values.
It does not look pretty, but it is better than freezing and can simply be peeled off in the summer.
Other materials for insulation include processed denim and straw, although of course the small size of most British houses make it difficult to provide the space to allow for straw and the stud partitioning to hold it in.
Dave,
I have a whole set of books on my shelf back to the 70s on how to insulate existing houses (including one from the US).
It can be done cheaply and without losing too much space. My London flat has monster windows. For many years in my impecunious past I used temporary double glazing made out of thick mylar film mounted on wooden frames and screwed to the window frame during the winter. You can easily make triple glazing (I've still got this in my loo).
Insulating the walls doesn't have to sacrifice enormous amounts of space. An inch of polystyrene or polyisocyanurate foam will halve the heat loss through a solid brick wall. In 1986 I insulated my living room with 2 inches of rockwool mounted on wooden battens and covered with plasterboard. It was one of the best things I've ever done. It actually became possible to heat the room. The wall surface temperature in winter rose by 2 degrees centigrade and the temperature difference between the floor and ceiling decreased dramatically. Much more comfortable.
Last winter I did my bedroom wall with 3 inches of polyisocyanurate foam. I reckon this gives about a five-fold reduction in heat loss through the wall.
A few years ago, if you walked into a builder's yard and asked for sheet foam insulation, they would stare at you blankly. Now they will conduct you rooms full of the stuff in all grades and thicknesses.
Change does come eventually,
BobE
Bob, it seems that we are going to be very short of energy, under any reckoning.
In recent correspondence here with Paranoid, who is an MD, we established that there is an excess winter death toll in this country of around 25,000, mainly due to heart problems arising from blood pressure rising in the cold and to bronchitis, in which Brown can truly say we lead the world.
Preventing many, many tens of thousands of excess deaths therefore seems to rely on ad hoc measures to increase insulation in our current stock.
The problem, as you will be aware, is to increase insulation without creating dampness and mould.
Just based on one of my posts here I tried to throw something together:
http://energy-futures.blogspot.com/2008/09/one-warm-room.html
However it is 20 years since I have done any building at all, and as you know insulation has moved on a long way since then.
What all this is leading up to is that I am hopeful that in your busy schedule you can nevertheless be persuaded to build a site which has some of the needed information, adapted to a British climate.
This would be a major service if you were able to do so - or perhaps a project for your students?
Only if they're actually replacing incandescents. I got a free pack too, but since I already have all the lights that will take them fitted with CFLs, it's not going to displace anything. But British Gas will get to claim the carbon credit anyway, so they get out of displacing real CO2 emissions by emitting even more real CO2 to displace theoretical CO2 emissions which were never actually going to be emitted anyway.
"The low energy light bulbs will be very cost-effective ... And it reduces the need for power generation plant at peak times (like dark winter evenings)."
I don't think these sort of light bulbs are as cost effective as made out - particularly on dark winter evenings. The savings (if any) may not really justify the hazardous chemicals (mercury) involved. I've been in a room when one failed emmiting a noxious cloud.
If you have other heating on in winter, then the heat emitted by ordinary bulbs will reduce the heat required from this by the same amount if it is controlled on a themostat. And in the long summer evenings you don't use lights much (or I don't) anyway.
There is mercury in our coal in the US, so I know that people have done the math and pointed out that even if you eat the CFLs after they burn out, it is safer than using incandescent bulbs. Obviously, you shouldn't eat the CFLs, and you should be careful when they break, but the point is that compared to the amount of mercury emitted by most* coal plants while they burn coal, the CFLs are safer.
*A modern coal plant with a full compliment of scrubbers reduces the mercury emissions somewhat, but not completely. Also, some coal is cleaner than others. And I imagine with ccs the mercury would end up in the ground, (and hopefully, not in the ocean, at least for those of us who eat fish,) so that may become a non-issue, but the CFLs are still cleaner than most coal plants...
Earlier today I posted a graph showing forward strip of US vs UK futures diverging in the next few contract months. TOD reader "houlbt" pointed out it was wrong. I called the analyst that I got the graph from who asked that I delete it (as it indeed was incorrect). In deleting it I also deleted a few other comments and one especially good one from Rune with this graph showing that futures prices do not signal future scarcity:
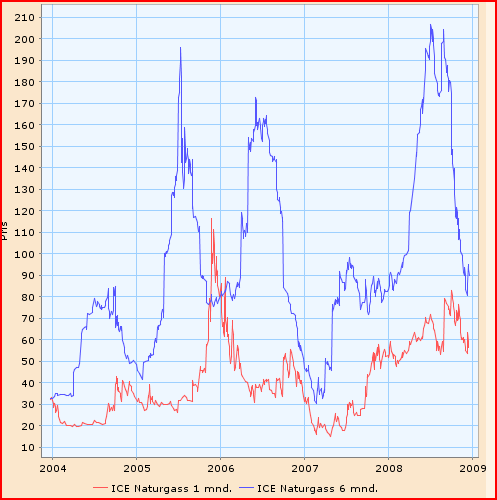
(From Rune:
The diagram above shows the price movements of 1 month and 6 month futures prices of UK nat gas, price in p/therm along the y-axis . Diagram lifted from dn.no graph center.
Apparently the Bloomberg link that my previous graph was based on no longer works. I'll try and post the correct prices tomorrow.
Sorry Rune et al.
There was a suggestion above to replace gas by electric heat pumps. This could well take us from a difficult problem with meeting peak gas demand to an extreme problem with meeting peak electricity demand. Today's UK gas demand peaks at over 200 GW and the electricity demand peaks at about 60 GW. If UK buildings were all to be heated electrically, several 100 GW of new power stations and transmission lines would have to be built.
We appear to need major investment in CHP plant (this plant is an interuptible gas load & helps to get around the storage problem) and heat mains in cities (UK gas and coal power stations throw away enough heat to displace all the domestic gas and most are within reach of city centres.) We also need to insulate buildings in cities and even more so in the countryside ASAP.
Power stations would not be built to cover peak load - some form of storage would be used, assuming no gas at all was available, so the number of plants needed would be much reduced, and could be further reduced by the installation of decent insulation.
France manages with 59 nuclear reactors, with little assistance from heat pumps, and a much smaller input from NG or coal, although of course they have peaking assistance from elsewhere in the European grid and also have some other energy resources.
Anyway, we are clear out of time and money to build whatever.
The costs and time needed to build CHP will not be trivial, in common with alternatives.
At this stage and in this economic environment patch and mend is the best that can be hoped for.
The Government appears to hope that reducing the currency to the same condition as that of a South American banana republic will make the climate comparably hot.
One thing I noticed is that the storage reports put out by the National Grid seem to be flashing warning signs. The Storage Monitor and Stock Level Data (Excel spreadsheet updated daily) shows the number of days of storage available based on average usage during the last week.
For long term gas storage, today's report is showing 68.4 days left; for medium term gas storage, today's report is showing 59.5 days left. This is not too different from what you are showing--only they are not saying anything publicly about it.
The diagram below shows UK total net storage nat gas withdrawals from 01. December until the end of the heating season 31. March, for some of the recent contractual years. The red line is net withdrawals this winter (contractual year 2008).
Withdrawals from storage may show great variations from one day to another. The diagram above also illustrates that storage facilities was topped up when gas was available last winter.
Still the winter has barely begun and most withdrawals happens during January and February.
I want to point out a couple of items without getting bogged down in the longer term 'peak gas', UK/European sustainability etc etc arguments. This is just my opinion but I see it like this...
1. We came into this winter with more gas in storage in both the UK and Europe than we have seen in recent years and secondly despite higher than seasonal norm withdrawals this gas year to date (as Runes chart illustrates) we remain at reasonable levels of gas in store for this time of year - i.e. If I showed (and sorry I cannot) you a pan European storage chart with this year and the past 5 year you certainly wouldn't be filled with fear and concern. To that extent I tihnk the chart above from Rune is a little misleading.
2. We have experienced a below seasonal norm cold spell in the UK and Europe and this has seen demand adjust up and hence increase the call for gas much of which has been met from storage. That said though with the current dire state of the economy y-oy demand is weak, very weak in fact and I think it will look even worse in the new year.
3. Contract buyers of gas are taking minimum on their oil-indexed formula based contracts becuase the curve is backwardated, i.e. (simplified) they have a certain amount of gas they need to take on contract this winter and with the way the formulas work they know that gas they take on these contracts in Q109 will be cheaper than if they took it now. So we're substitutuing with storage.
4. There is plenty of LNG floating about and with current fuel differentials Europe is the market of choice for much of this.
I don't think the rest of this winter will be super cheap gas, but equally I don't think we are likely to face a gas crisis this winter unless something signifcant breaks or this Ukraine situation escalates.
Hello houlbt,
1) The diagram above shows relative status of storage starting December 01 for the contractual years presented. The point was to illustrate the high withdrawals associated with the cold start of December.
Figure 03 in this post shows absolute developments for the same contractual years. It shows as you point out that this winter started with more nat gas in storage than the previous presented years.
Through this week end there was a net storage build of just above 30 Mcm, most probably due to unseasonal warm weather.
These things may change swiftly.
2) That demand may weaken due to an economical slow down is also expected and mentioned in the post. However, it was perceived as prudent to use the SND demand curve as published by National Grid to describe demand. A lowered demand due to an economical slow down will change the results from what has been presented in this post.
3) What you describe here is also my impression and as oil prices have dropped considerably since last summer I think those buyers who are on oil indexed contracts (which may have a delay of typically six months) will take less during Q4 08 and more the following quarters. For the UK market it seems as the UK buyers so far this winter have taken maximum from Norway so it will become interesting to follow the UK buyers take of Norwegian gas the rest of the winter. For gas from Holland (through BBL) it looks like the UK buyers have acted as described by you.
UK exports through the Interconnector are considerably up so far this contractual year.
4) The interesting thing with all this homeless LNG is that it doesn’t get attracted at present prices (presently in the high 50’s and equal to the same time last year) in the UK market. This suggests that prices still need to move perhaps as far north as 70 p/therm to start attracting these LNG cargoes.
Then there is Ukraine as you point out, declining Russian nat gas production and……….. weather (temperature).
Cheers and good morning Rune , you did it again.
Your analysis are always top notch and focuses timely questions. Obviously looking into UKs power future, it sort of points us in the direction of where Europe also will go (a preview for EU, so to speak)
The daily DrumBeats often link to British media-articles on UK energy (via the Guardian, Telegraph, Times online, BBC) – And my average impression after reading them gives me a sensation that paints a really grim energy future for them ….. and seemingly those devastating impacts may strike earlier than we all would like to think of .
Now, British journalists are not going easy on their energy coverage either, fat types were fat types belong. So the UK energy-prospects and knowledge thereof are obviously understood by many and TOD Europe contributors are brilliant standard bearers in that regard.
What puzzles me is: Do British politicians read the paper ?
Sarcanol /
Is the rest EU just waiting for the UK energy gloom to set in, so that the UK casestudy can be used as “a trial and error” for the rest-EU itself ? Just an ugly thought that struck my mind / snark off
And as for your post titled "IEA WEO 2008 - NGLs to the Rescue?"
I feel you did the case very clear to me, namely that NGLs will go more south towards the future.
(That Birol bloke does not impress me, but You do Rune :-)))
hi all , a question came to mind over the gas supplied to consumers as opposed to commercial customers. I pretty certain I read some where that consumers get the first dibs .
but can they sub propane , butane etc in the supply as well , can they do this now ? LNG I assume is methane or am I wrong ?
cheers
Forbin
I'll try and answer that without looking it up in Wikipedia. Most propane and butane is a byproduct of fractional distillation in oil refining, hence LPG = liquid petroleum gas. A smaller amount is separated along with condensates at natural gas plants where they may also try to separate undesirables like sulphur compounds. Propane and butane liquify much more easily than methane, ethane, ethylene etc and I believe also have slightly better energy density. The weight fraction of methane in natural gas I believe varies from about 80% to 98%.
I don't know about supply interrupt clauses for piped gas or how it would be controlled. Heating a hospital in winter is more important than running a bakery.
Many hospitals, (at least in the US,) have interruptable gas contracts because it is cheaper. They switch to electric heating when the gas company shuts them off. Of course, this causes huge grid problems, and so typically the grid goes into rolling blackouts, (which, as hospitals, they are exempt from.) I know in Portland, the electricity company has attempted to deal with this by hooking the backup diesel generators that the hospitals all have, into the grid, (with the right switchgear, so that the generator can still power the hospital if the grid goes down.) So now when the gas company contract interrupts their gas supply, they switch to electricity, and then the electricity company turns on their generators and we don't have to roll blackouts. (Although, I imagine a few days of cold weather in a row, and Portland will run out of diesel. But we did just have a 1 out of 5 year cold snap, and I haven't heard of a diesel shortage, so maybe things are better planned than I thought, I do know that the electricity company puts in bigger tanks on these generators when they connect them.)
The electricity company buys all the fuel for the generators, and maintains them, in exchange for the right to be able to turn them on whenever they want. It is a brilliant idea for dealing with super-peak loads.
The nat gas transported and delivered customers shall meet several specifications with regard to hydrocarbon dewpoint, water dewpoint, CO2 content, H2S content, Wobbe index to name a few.
It is possible to spike in heavier components like propane, butanes as long the nat gas delivered still meets these specifications.
LNG is methane.
In the summer I investigated the situation regarding power generation in UK for my own interest, looking at the effect of the planned nuclear and coal station closures and the expansion of wind generated power.
On a business as usual approach (i.e. demand remains much as now) the reliance on gas generated power to meet the demand peak (using the National Grid methodology based on assume availability) will rise from about 37% in 2008 to about 55% in 2016. This increase is fairly uniform year to year up to 2016, and should start to drop slowly after 2016 as more wind generation comes on line.
This represents an increase in demand for gas for power generation (to meet peak demand) of over 50%.
If the present financial crisis causes a slower build up of wind there would be even more reliance on gas (unless the coal station closures get reversed).
We may have the capacity to import this level of gas, but will it be available - and if available can the UK afford to import it?
As regards domestic gas rationing in UK, this would probably be done by rolling 3 hour electricity blackouts - as most central heating systems rely on a continuous electricity supply. The government has it all planned - see http://www.berr.gov.uk/files/file35360.pdf !
Do pilot lights stay lit, if a gas-fired unit is turned off because of a planned electricity outage? I would imagine so, because unplanned electricity outages are quite common, at least here in the USA.
Modern UK gas appliances do not have permanent pilot lights. They are lit only when they need to be. If the electric is cut off, my gas-powered boiler and central heating system will stop working because the ignition system is electronic. Not just that, though, the pump, valves, timer and control unit also need an electricity supply.
Only the gas fire in the living room would still work. It has no pilot light and uses some sort of manual spark ignition that usually takes two or three goes to work. If the gas supply is cut off, then we could still have hot running water thanks to an electric immersion heater in the hot water tank, if the electric is still on.
Presumably, if there are gas shortages, the main objective would be to stop people freezing in their homes and so domestic gas users would get priority. If this mean shutting down gas-fired power stations, then so be it. However, this could lead to electricity blackouts, which in turn would disable gas-fired central heating...
It might be worthwhile finding out how much electrical power the latter needs to see whether a battery-backup is possible.
Let me see if I get this right.
If electricity goes the gas powered boiler and central heating goes and the hot water.
If the gas goes the powered boiler, the central heating and the the gas fire in the living room goes.
40 - 45 % of UK electricity generation is based upon nat gas. Seems obvious that keeping people from freezing is given priority.
During a nat gas shortfall it seems electricity generation is shut before gas for households. Which means there is gas, but it cannot be used because of lack of electricity.
The story I have heard is that you cannot turn off residential natural gas, because to restart it would require that technicians go to each house, to relight the pilot lights (or perhaps just make sure there is no leakage when the gas is turned back on). There are not enough of these technicians to relight the pilots, so one cannot turn off residential gas. Because of this, the USA has made plans to disconnect everyone else before residential users. (Probably not correct, but that is the way I remember the story.)
One issue with heat going off in homes is that pipes freeze and break. This causes two types of damage: water damage, when the pipes thaw, and the need to replace the pipes.
Gail, freezing can happen, but in the UK maritime climate it is much less of a problem than in the continental USA.
In any case, the procedure for shutdown of facilities is well aware of those issues - these guys are seriously technically competent, they are just not backed up in the overall assessment of reliability.
Downtimes of industrial facilities would be the first thing, then electricity, and damage to the system is a long way away.
Rune,
Pretty much hits the nail on the head. Even boilers with a permanent pilot flame and a gravity fed hot water system require an electrical supply for the main gas valve to open, so no electricity no boiler. Oil fired heating requires a sturdy ac supply for the fuel pump/fan motor and a 250 VA ignition transformer, so there is no escape. A car battery/ inverter would not supply the 70W (output) burner motor and circulation pump for long.
Fires are a different matter, as some can be lit with a hand held ignitor and many are piezo crystal spark ignition. So fires are ok. If new fires have gone down the route of electronic ignition then it's tough luck and
God bless technology.
If the gas supply was to fail I don't see why it would be a problem, other than no heat. Pilot flames would go out and the flame failure solenoid (powered by a thermocouple placed within the pilot flame) would close off and fail safe. The system is fail safe and sealed so air could not get in the system. There may be an issue that most folk these days are unable to follow the ignition instructions, but that's another issue. Spark ignition boilers will also have flame failure detection and shut down safely.
Partypooper,
Thanks a lot for your insightful reply
One of the great things about TOD is that I continuously expand my own understandings.
If people have a gas cooker, the oven can double as a heater - even if it is electric start. Use a match, this lights a pilot light, then opens the main gasflow.
I would hope anyone in the UK had plenty matches and safe candles.
Keep looking in Lidl etc, for when they sometimes have fully enclosed lanterns for tea-lights.
You can use a gas cooker as a heater, but you have to be careful about CO as they're not ducted to outside and the manual for my cooker specifically states not to use it for this purpose. My reference above to hand held ingnitor was a complicated phrase to describe a match!
Rune,
I don't know if you are being sarcastic or not! But for additional information, the flame failure solenoid is actually powered direcly from the electric current generated by the thermocouple and no external powersupply is required for this to function. When I first stripped down a gas valve I was amased by this fact. The flame failure solenoid is a few turns of very thick wire in series with the thermocouple.
The main gas valve does require an external 240 volt supply, so as already stated no mains electricity no boiler.
The flame failure solenoid isn't perfect. Assuming it works 99.9% of the time, (which is probably high, I know one of my friend's doesn't work in his stove, and I've tried to get him to fix it, but he is a cheapskate and so just turns it off at the valve behind the stove,) in my city, that means that when the pressure returned to the gas system, roughly 500 houses would fill with gas, and about half of them would catch fire. But with only 31 fire stations, 250 fires in the city would be rather big problem, (and not just for the 250 people that lost their houses, but also for their neighbor's houses when they fire wasn't fought.)
The flame failure on a cooker may not as safe as that for a pilot light on a boiler. My gas cooker has a two stage valve which allows full gas flow only when the flame is established. I'm pretty confident the pre ignition gas flow exceeds that of a boiler pilot light. I doubt the gas flow from a pilot light on say a back boiler would allow enough gas flow to fill a house with an explosive mixture due to natural ventilation up the flue.
If natural gas was acetylene, life would be much more fun and the building trade would be busier!
The gas fire in the living room would still work. We could sit in front of it toasting bread in the candlelight, telling stories about the old days when the fire was a real one (and most of the heat went up the chimney). We could use a Primus stove for cooking and to fill hot water bottles at night. Without the sedative of TV, people would start to come round from their semicomatose state. Electricity is over-rated.
Priority is not to empty the gas pipelines, which is when things get seriously difficult to re-start.
So electric will be cut, which will have the side-effect of stopping the gas central heating.
This is after cut offs for industrial users, who have lower tariffs because they accept greater risk of supply interruption.
In rolling block-outs the hope is that power, and hence the alternative of turning on the NG heating, is restored quickly enough so that the house does not get seriously cold, say after 3 hours.
In the UK the plan is also to ration by price, so that shortages would lead to steeply escalating prices, and sod the poor.
DM
As you said above "ain't capitalism wonderful"
Nik G,
Everything else remaining the same that means an increase in nat gas used for electricity generation of 40 - 50 Mcm/d. Which translates in a total increase in demand towards 2015/2016 of 13 - 14 % during the winter.
Having read the most recent forecast from DECC and National Grid I start to wonder where shall the nat gas come from to meet the increase in UK demand.
This makes great material for a future TOD E post to go through the most recent forecasts from DECC and National Grid and make them subject to a reality check.
LNG seems to be the great hope. Now that Sterling is almost at parity with the Euro I really wonder if the UK will be able to outbid the rest of the world to get the LNG in the future.
That said, from a domestic viewpoint I think TPTB will do they can to prevent gas being turned off to homes (it would be a major crisis if this happened in the winter). An interesting option for personal resilience in one's home would be to install one of the new micro CHP boilers that run the cental heating and also generate 1 - 3KW. Some have a dark start capability I believe, but even if they don't a car battery and inverter would be able to start the system up (a transfer switch is needed to isolate the house from the grid). It might not be a cheap option, but it would keep you warm and reading TOD.
With respect to the interesting comment "In rolling block-outs the hope is that power, and hence the alternative of turning on the NG heating, is restored quickly enough so that the house does not get seriously cold, say after 3 hours."
what *is* the caliber of home insulation in the UK? I shall supply a few numbers, namely that we recently had a power outage here for three hours, external temperature 25 F, and the house was cooling at about 2 F per hour on the upper level, and not measurably yet on the lower level. The heat loss in fair part is the windows, though double glazing helps and the triple honeycomb blinds give an extra R-3 or R-4 over them.
Already planning for the above scenario.
House super insulated (500mm in the loft) plus cavity wall
Solar water heating producing 3200kwh per annum
Condensing boiler with 91% efficiency rating
In January I am installing a 5kw wood stove. Rapidly stocking wood as we speak. For the rest of this winter I will use pallet wood. Thereafter I aim to have about 3-5 tonnes in store from various sources. With an extremely well insulated house I estimate that to displace all gas for heating needs I would need to burn 2.1 tonnes of wood.
I thought about a stove with a boiler but feel this adds unnecessary complications - ie triple coil cylinder, pump, controls. If I need hot water in a power cut a pan on the stove will suffice!
Also pondering whether to replace my electric oven with a gas oven as I have no gas device that isnt reliant on electricity supplies.
As for back up electricity supply. I have 4 110a/h deep cycle telephone exchange batteries in the garage. Next job is to wire up and obtain an inverter. The power from this bank will be enough to provide power to my solar water heating pump and some basic lighting. To keep cost low I will not grid tie but run off an extension cable. Have a small solar panel for trickle charging otherwise charging will be via off peak when available.
No mention was made in the article re: Qatargas 2 that was to commence shipping to South Hook Terminal and deliver 7.8 mtpa.
Any update on this
The most recent I saw was the article dated 21. Dec. 2008 linked to below from Gulf Times;
LNG carriers idling on project delays in Qatar; rates decline