| Oil Prices Below $40 per Barrel | The Oil Drum: Europe | Will the UK Face a Natural Gas Crisis this Winter? (Part 2 of 2) |
Oilwatch Monthly December 2008
Posted by Rembrandt on December 17, 2008 - 10:47am in The Oil Drum: Europe
The December 2008 edition of Oilwatch Monthly can be downloaded at this weblink (PDF, 1.6 MB, 24 pp).
The Oilwatch Monthly is a newsletter that is available free of charge with the latest data on oil supply, demand, oil stocks, spare capacity and exports. Readers who want to receive the Oilwatch Monthly in their e-mail box each month can subscribe at this weblink, by filling in their first name, last name, email adress and selecting Oilwatch Monthly in the mailing list box. To finalize your subscription push the 'inschrijven' button below the form.
A summary and latest graphics below the fold.
Latest Developments:
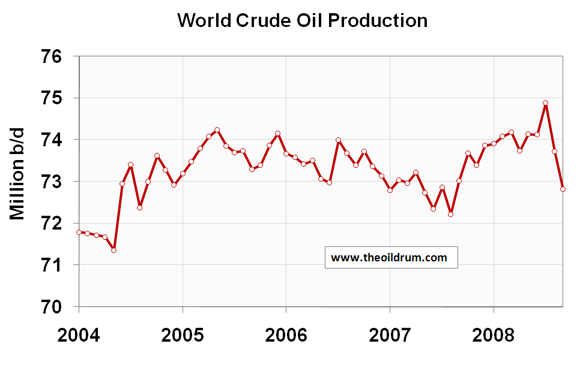
1) Conventional crude production - Latest available figures from the Energy Information Administration (EIA) show that crude oil production including lease condensates decreased by 907,000 b/d from August to September, resulting in a total production of crude oil including lease condensates of 73.80 million barrels per day. The all time high production record of crude oil stands at 74.86 million b/d reached in July 2008.
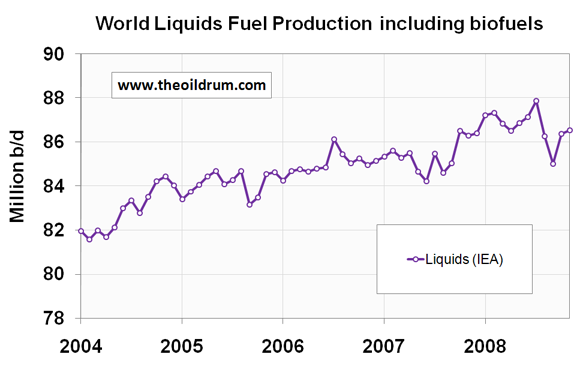
2) Total liquids production - In November world production of total liquids increased by 160,000 barrels per day from October, according to the latest figures of the International Energy Agency (IEA), resulting in total world liquids production of 86.53 million b/d. Average global production in 2007 was 85.41 million b/d according to the IEA. In 2008, an average of 86.73 million b/d has been produced from January to November. The US Energy Information Administration (EIA) in their International Petroleum Monthly puts average global 2007 production at 84.40 million b/d and average liquids production from January to September 2008 at 85.54 million b/d.
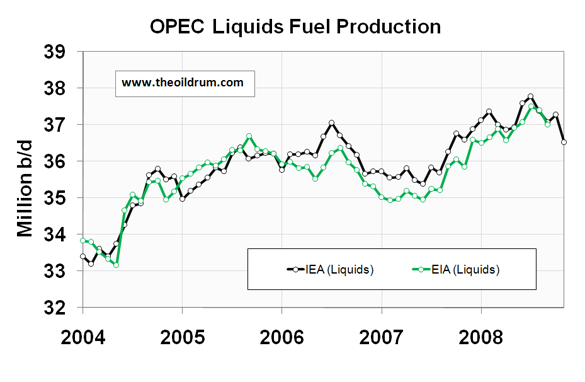
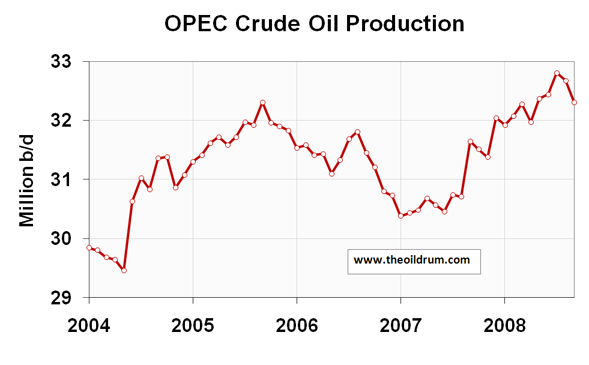
3) OPEC Production - Total crude oil production including lease condensates of the OPEC cartel decreased by 760,000 b/d to a level of 31.35 million b/d, from October to November, according to the latest available estimate of the IEA. Natural Gas Liquids production remained stable at 5.17 million b/d from October to November. From January to November, average total liquids production for OPEC countries in 2008 was 37.18 million b/d, versus 35.96 million b/d in 2007 and 35.71 million b/d in 2006.
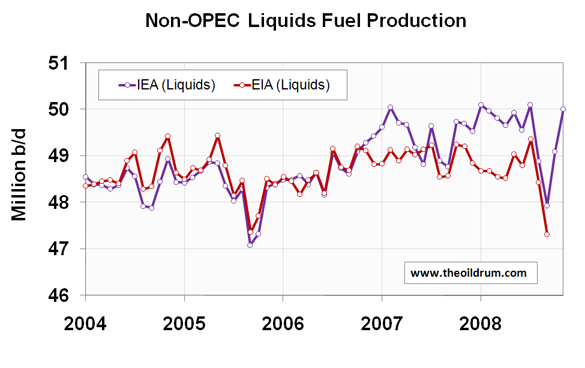
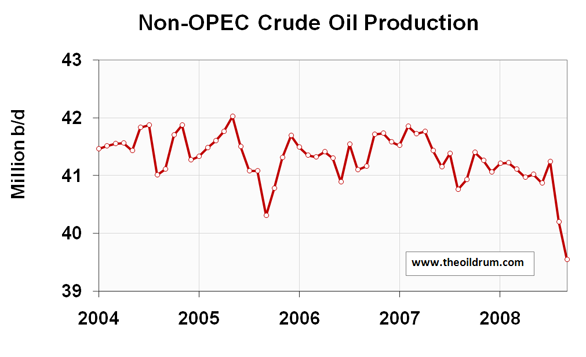
4) Non-OPEC Production - Total crude oil production including lease condensates of non-OPEC decreased by 653,000 b/d from August to September to a level of 39.55 million b/d, according to the latest available estimate of the EIA. Average crude oil production of Non-OPEC from January to September 2008 was 40.82 million b/d, versus 41.35 million b/d in 2007, and 41.41 million b/d in 2006. Total non-OPEC liquids production increased by 920,000 b/d to a level of 50.01 million b/d from October to November, according to the latest figures of the IEA. Average total liquids production of non-OPEC from January to November 2008 was 49.55 million b/d, versus 49.45 million b/d in 2007 and 48.75 million b/d in 2006.
5) OECD liquids demand - no new data available, hence no update
6) Chinese & Indian liquids demand - no new data available, hence no update
7) World Liquids exports - no new data available, hence no update
A selection of charts from this edition:

Personnel
Editors
Contributors
Peak Oil Primers
Archives
- November 2010 (3)
- October 2010 (6)
- September 2010 (4)
- August 2010 (7)
- July 2010 (6)
- June 2010 (7)
- May 2010 (2)
- April 2010 (8)
- March 2010 (4)
- February 2010 (6)
- January 2010 (3)
- December 2009 (5)
- November 2009 (8)
- October 2009 (12)
- September 2009 (6)
- August 2009 (5)
- July 2009 (11)
- June 2009 (8)
- May 2009 (16)
- April 2009 (10)
- March 2009 (7)
- February 2009 (10)
- January 2009 (15)
- December 2008 (9)
- November 2008 (9)
- October 2008 (9)
- September 2008 (13)
- August 2008 (10)
- July 2008 (14)
- June 2008 (23)
- May 2008 (16)
- April 2008 (12)
- March 2008 (16)
- February 2008 (9)
- January 2008 (13)
- December 2007 (13)
- November 2007 (16)
- October 2007 (22)
- September 2007 (8)
- August 2007 (9)
- July 2007 (16)
- June 2007 (8)
- May 2007 (7)
- April 2007 (7)
- March 2007 (10)
- February 2007 (10)
- January 2007 (12)
- December 2006 (9)
- November 2006 (15)
- October 2006 (4)
- September 2006 (5)
- August 2006 (5)
- July 2006 (9)
- June 2006 (5)
- May 2006 (10)
- April 2006 (9)
- March 2006 (13)
Vital Trivia
License

This work is licensed under a Creative Commons Attribution-Share Alike 3.0 United States License.
That's a pretty steep decline in the NON-OPEC production, is this all related to demand destruction or is there substantial supply destruction as well?
In August 2008, the fire in the BTC pipeline and then the Russian invasion of Georgia shut down crude oil flow from the area of the Caspian Sea. Hurricanes Gustav on September 1, 2008, and Ike on September 13, 2008, shut down oil refineries in the southern states reducing demand for crude oil.
Drop in crude on every graph is dramatic. IMVHO all the other graphs are fudging the numbers in a way. Including biofuels in total liquids is particularly deceptive. Given the massive inputs of other fossil fuels in producing these fuels, counting them in totals seems to be double dipping to me.
Even considering particular above-ground circumstances, it certainly looks as though we are slipping off the plateau for crude. At the very least, these data show that 2008 was no dramatic new peak, just a jagged point of the plateau, and probably the jagged edge of the cliff.
OECD demand went down by a whopping 1.2 mb/d from July 2008 to August 2008. That's why oil prices did not skyrocket when the BTC pipeline was attacked and the war in Georgia broke out. Total OECD demand destruction was 3.9 mb/d between November 2007 and August 2008. OPEC now cuts 4.2 mb/d, almost equal to the earlier drop in OECD demand. The turning point was really end of last year when the recession in the US started. In 2008 it was superimposed by a short-lived OIL-YMPIC boom pushing oil prices to $147 a barrel.
The way we have to look at peak oil (2005-2008) now is that the 1st wave of oil price shocks (plus the precondition of accumulated debt in the banking sector)damaged the system beyond repair, bringing it prematurely into decline mode with several negative feed back loops in place now. If banks had been informed about the approaching oil peak and therefore more prudent with their investments, the oil supply system could have bumped along on the plateau until the hitherto growing group of countries would have also peaked and until the OPEC rebound had run out of steam, perhaps within 1-2 years.
Strange thing shown by this data and charts: At the time when crude oil reached its all time high price ($147/bl), world liquids and crude+condensate also reached an all time high! Then as the price started to fall, production decreased almost in lockstep. Current world liquids production and demand are not down much but the price has fallen 65%.
I think this shows that a good part of the price rise in from early 2007 was not just supply trying to keep up with demand, but speculation pushing the price up. Prices above $80 to $100/barrel were not justified.
I doubt that the price will rise so fast again, but it will rise as new oil production is put on hold or deamed unprofitable at $40/bl, while the existing wells decline and fields deplete. I expect that demand will continue to drop keeping the price low for another 6 months, but then suppply drops even faster in 2010 as the lack of investment reduces production. I would also expect that OPEC (meant Saudi Arabia) will reduce supply early in the next year before non OPEC production falls due to non investment. KSA for a while can still control the price on the downside of production when the world is in recession. All IMO of course.
People continue to explain this the wrong way. There was not a crude oil bubble but a financial bubble - crude, copper, stocks, currencies, corn, etc. For those ONLY following the energy debate, it looked like a crude oil bubble. I'm sure farmers now say we were in a corn bubble and hedge fund managers are saying we were in a hedge fund bubble. The only way that $147 and $45 could BOTH be due to speculation, is if you broaden the term 'speculation' to include the easy credit and financial leverage of the last decade. Commodities have just hit 52 year lows. It's not just oil. It was the leverage and systemic risk in the overall system.
We do know for sure that price is not a valid measure of future scarcity. Look at natty gas prices now...
Another way of looking at it is that there wasn't a bubble in anything--there was a functioning, "growing" economy. Which is the way I see it.
I think the only way the whole shebang can be seen as a bubble is if we look at the economy as a whole as having outgrown the true source of wealth, which is energy. Everything in the economy is basically energy in another form. We "bubbled" in everything because we stopped getting more energy efficient at a time when it got too costly to produce more supply. (And I see virtually no improvement in efficiency happening now or in the immediate future.)
The fact that people still think in terms of a bubble in oil tells me that people will never understand what's going on. In fact, because many of the people talking about bubbles are at TOD, it tells me that people are incapable of understanding it. Which means that as the price of energy rises again, they're going to be screaming about bubbles again. This will lead to the political "solution" of crashing the economy again to bring down the oil price. And each time we crash the economy, we'll be taking out a bigger and bigger percentage of the population.
We've essentially decided to deal with peak oil by letting the richer part of the population continue to thrive at the expense of the poorer part.
From this point, you can pretty much map out your future based on where you are in the food chain right now. Sad.
"We've essentially decided to deal with peak oil by letting the richer part of the population continue to thrive at the expense of the poorer part."
You got it Moe.
The US used to be a net exporter of this situation but we are rapidly building our domestic version.
The problem is that no one believes it can happen to them, and if it does, well "shame on them".
It really can't be explained away so easily.
"It's an oil bubble" doesn't mean "oil and only oil"... it simply means "the current price of oil is in no way justified by the fundamentals and it will therefore likely collapse".
Of course this kind of statement was 100% correct.
Two other points:
1) It could easily have been a commodities bubble. Saying "other commodities went up too" doesn't mean oil wasn't in a bubble. Saying "XYZ.COM stock wasn't in a bubble because the NASDAQ fell overall" doesn't say much.
2) Similarly... how far does it get us to say "it wasn't an oil bubble... oil rose and collapsed due to an entirely different phenomenon that also wasn't worldwide scarcity of energy post peak?
The oil price hike of $147 in July 2008 was caused by China buying 80% of a 1 mb/d supply surge between May and July 2008. These were the most expensive Olympic games the world ever had. Most likely the last party on the Titanic.
The insiders basically knew that their markets were hedged using fraudulent practices. Knowing that they would trade commodities which had harder value. The commodities astronomical rise was not sustainable and neither is their crash. Who is going to extract oil, mine or whatever and sell it bellow the costs. This rapid decline and the ranting that goes with it will eventually backfire because once shut down, the ramping it up can be delayed for years. The Chinese are talking it down thinking they can buy all the mines and oil wells cheap but they wont be sold the stuff.
I do not see the logic in this from a pure supply-demand perspective. As demand increases, the price goes up. This makes more supply viable. When supply finally meets demand, the price will be at its peak and the production will be at its peak. That these two did in fact line up supports a supply-demand argument.
Suppose that there was a change in demand in August (Chinese and Olympics). The demand would drop and that high cost supply would be pulled back off the market.
I'm not saying that speculation or the financial bubble didn't play some role, especially in paper prices. What I am saying is that the price and production data are consistent with the thesis that supply-demand played a significant role in the price run-up. Some sort of demand data (other than paper pricing) would need to be analyzed in order to show that this was not the case.
Ultimately this is all too complex for simple models to explain, but the simple models can help to gain insight into aspects of the situation. Unfortunately, humans can't handle complexity very well and thus become heavily vested in a simple model when the reality is otherwise. This leads to endless bickering over simple models, none of which are entirely correct.
Well said.
This is true for just about everything that humans argue about.
Or is this just the case with models that look at too short a time scale and heaps of unimportant variables?
Looking longer term limits to growth style models, arent there emergent simplicities that make these price fluctuations make sense? as EROEI diminishes and limits are met shouldn't decreasing resilience in the system lead to these kind of fluctuations and instability?
We should realy have learned not to rely on short term market models like 'speculation' to understand the overall system. As we lose energy to power the system we'll also lose energy to smooth out its fluctuations, whatever form they take, whatever random time they appear.
But it does seem that people just have to keep up the futile activity of arguing about causes, and pretending that we could somehow use what we learn from the interaction to prevent future fluctuations! ('if only we had better regulations' etc etc.)
It could be wiser to spend the time disscussing the creation of resiliant systems that aren't affected...
http://finance.yahoo.com/news/Saudis-say-2-million-barrel-apf-13844213.html - 'Expectations that OPEC will slash oil production by as much as 2 million barrels a day firmed on Tuesday after Saudi Arabia suggested a reduction of that magnitude is likely.
...
Saudi oil minister Ali Naimi said "supply is still somewhat in excess of demand" and global stockpiles are higher than normal." '
Could someone produce an updated graph showing the "regular range of stockpiles + current stockpile"? -- eyeballing chart 22 (OECD Crude stocks) in the OWM shows that current stocks are near the middle of the range of values from 2005 until now, although chart 26 (OECD product stocks) is still near the high end of the range.
With the current rapid change in demand and price, would it be possible to estimate the current supply-demand curve, or is the resolution of consumption to low?
It looks like about half of the demand drop is from the US, and Europe has actually increased its demand over the last year - who else is decreasing usage?
also, if this 2MB/d cut comes through, could we estimate what that would do to the price?
sorry about more questions than answers,
Andrew
Rembrandt - thanks once again for this excellent publication which one day will assure your place in the history books.
Figure 1 is perhaps the most astonishing. From this it is near impossible to guess that the oil markets are in turmoil - so maybe they are not? As Bluetwilight points out, these figures mask a bounce in Azeri and US crude production. Its likely that UK and Norwegian production is also recovering from Summer maintenance.
With the last OPEC cut (November) yet to be fully implemented and what seems likely to be a 2+ mmbpd cut from OPEC and Russia today in the pipeline the supply situation looks set to tighten significantly going into the winter.
The UK has just had its coldest start to winter for 30 years (MET office) and as a forthcoming article from Rune will show, this means we have already eaten deeply into our gas storage levels with potential nat gas shortages on the horizon. Part of the UK's fall back position is oil fired power generation and so I wonder if we may not see a surge in oil demand if the uncommonly cold weather persists in W Europe.
True Euan, but that Met Office statement referred specifically to the first 2 weeks of December and the next two weeks are forecast to be above average.
Also, believe it or not, November in Scotland was actually above the long term average according to the Met Office. We've just had many exceptionally mild winters in recent years. I posted a longer version of this with links to Met Office data in the Drumbeat
However I do share your concerns that we seem to be gambling on mild winters for our energy security and will be very interested in Rune's post.
It annoys me that different kinds of liquid fuel are added together.
Things that are different can not be compared, added, subtracted, divided or multiplied. If they are anyway the result is silly nonsense.
What is the point of adding bio fuels to other liquid production? It does nothing to clarify the situation. Just tell what the production of each liquid fuel was and show a graph of each.
I suspect those who add different kinds of liquid fuel together are either the most obtuse thinkers around or are purposely trying to obfuscate what is going on.
Adding nonrenewable which is the problem to renewable which is the solution makes no sense. The energy content of each is different besides. All it does is befuddle the reader which evidently is the object.
@X,
If you would look in the Oilwatch PDF you can see the different types of liquids in separated production graphs (as far as separation is possible). Including a graph which looks at energy content.
Just open the PDF and your wish is granted.
I did so. Very good overview.
Would you venture a guess as to what you expect C&C production in 2009Q1 will be? (On average)
@eastender
Quick guess, between 72.5 and 73.0 million b/d.
Rembrandt
If the OPEC cuts just announced are kept to then it's going to be way, way below that. More like 70 - 71 mbpd surely? That's if OPEC announced cuts hold.
Rembrandt,
I'm confused.
I notice there are 8 Gb of natural gas liquids-pentane,hexane(2007) but that's really 7.3 Gboe.
Is barrels actual barrels equivalent?
EIA says a barrel is 42 gallons, strictly volumetric not boe. NGL do go into refining gasoline but it can't be as efficient as using crude oil.
I realize that this data is coming from IEA, EIA in a certain form(volumetric data) but could it conceal a boe Peak(Campbell uses boe)?
And does OPEC really produce 41 mbpd of liquid hydrocarbon 'products'? I thought they really only produced crude hydrocarbons. Most oil producers import
refined oil products, which suggests they may be more
dependent on world markets that they would like to think.
@Majorian
>I notice there are 8 Gb of natural gas liquids-pentane,hexane(2007) but that's really 7.3 Gboe.
Is barrels actual barrels equivalent?<
I don't understand your question as I don't know which piece of data you are referring to. Which chart, section of the report?
>And does OPEC really produce 41 mbpd of liquid hydrocarbon 'products'? I thought they really only produced crude hydrocarbons. Most oil producers import
refined oil products, which suggests they may be more
dependent on world markets that they would like to think.<
Where is it stated that we talk about liquid hydrocarbon products? Please look on page 1 at the definitions for crude oil and liquids:
Liquids, all forms of liquid fuels including conventional, heavy, and extra heavy oil, oil shale, oil sands, natural gas liquids, lease condensates, gas-to-liquids, coal-to-liquids, and biofuels.
Rembrandt
If I understand correctly, there is a bit of a "double counting" problem, in that it requires energy inputs (including some oil) to produce biofuels, and unless I am very much mistaken these inputs are not subtracted out.
You are not very much mistaken. This issue has been discussed for years on this site. One wonders if the new Secretary of Agriculture understands it. (I assume New Sec of Energy Chu does, but perhaps I should not)
Nate, you are right, you should not assume so. I've had discussions about biofuels and net energy in particular with Chu and a number of other physicists and energy scientists around the Lab, and there is a jaw-dropping lack of understanding of what it is and why it matters. Almost to a person, the only metric that matters is financial return. And forget scalability--as one leading physicist told me (and he lectures publicly on energy solutions), "If we just used the $700 billion in bailout money, we could solve all these problems!". Argh.
That is rather surprising to hear Sparaxis. I've made the point before that the oil patch could care less about net energy gain. For us it has always been, and will always be, payout and rate of return which determines a project's viability. I would have thought the Lab was so removed from the commercial world as to not be so influenced. OTOH, if the gov't expects the bulk of the progress to be made by private enterprise this will likely be the only metric applied. But gov't subsidies (like ethanol) can change the parameters somewhat.
It has been established by the USDA that for every seven gallons of ethanol you use a gallon of oil(diesel, fuel oil, etc.) in ethanol production.
http://www.ethanol-gec.org/corn_eth.htm
Since a gallon of ethanol has 2/3 of the energy of crude oil, you are 3.66 gallons ahead using ethanol;(7 x 2/3)-1 = 3.66 gallons.
Though this has been demagogued many times of this site, it has yet to be discussed in an objective way.
Hey, this could be the first time!
"Though this has been demagogued many times of this site, it has yet to be discussed in an objective way.
Hey, this could be the first time!"
I doubt it ;-)
Do you generally trust every bit of data that comes out of the US government? If not, why put trust in this one?
The problem is that most people and institutions putting out studies on this have vested interests one way or the other. I am skeptical of most claims, but particularly those put out by the gov and of course by the ethanol industry. How foolish would the gov look if after they invested so much money in corn-base ethanol they put out a study showing it provided no new energy?
What is and isn't included in the inputs for these studies has a huge effect on the outcomes, of course.
As far as I've seen, only some forms of bio-diesel show any real promise of long-term sustainability (there I did it, I used the dreaded s-word!).
I see that Illinois Governor, Rod Blagojevich leads the Governors' Ethanol Coalition. What a surprise.
Demagogue is not a verb. Mislead is a verb. It is what you do at every opportunity.
The fundamental thing that people should remember is that the net energy from the corn ethanol process is negative according to independent analysts, and very slightly positive according to industry aligned analysts.
The first questions are, what else can be accomplished with the energy consumed (not to mention the government subsidies) by the ethanol crew, and what else can be done with the land used to grow corn for fuel.
If you can't think better things than ethanol, then you haven't been paying attention.
There is, for example, an electrified rail transportation system, which could use the energy in the coal that is currently burned to generate electricity for the corn ethanol process. Such a transportation system would dramatically cut the consumption of liquid fuels used to maintain goods and labour markets. (See for example, "Electrification is the way to move Canada in the 1980's", Benjamin, L & Richards, D. [Summer 1981]Canadian Public Policy)
As for the land, if there is too much corn in the world and no need for other foodstuffs or fibres which might be produced therefrom, then leave it lie idle and let it slowly recuperate from the damage done from the years of industrial farming. At present rates of population growth, it will soon be needed for food production again. We'll all be better off, especially our progeny, to pay the farmer/landowner to count earthworms, than we are by paying them to misallocate resources such as coal, natural gas, and oil into the corn ethanol boondoggle.
post of day (my vote)
Not only is there too much corn, particularly in the U.S., but nearly all of it (#2 corn) is inedible by humans! Billions of bushels that we can't eat directly. #2 corn is all starch and no protein, unlike natural corn.
majorian -- Thus with the drastic reduction in their fuel costs and the continuation of the gov't subsidies, should we assume to be hearing about zooming profits from the ethanol plants this 4Q?
The current crash is bad for anyone who is in debt and the ethanol refiners surely are. However they do have
a guaranteed percentage of the declining gasoline market.
'Zooming profits' must be stinging sarcasm.
Ah he...
I don't think you got stung too hard majorian. You're a tough old bird who stands by your words. Yep...something of a cheap shot. But, as you say, having the gov't require folks to buy your product (and then give you a subsidy on top of that) should make for some pretty good economic headlines for this industry we've yet to see.
Which means that for every 7 gallons of ethanol in that all liquids graph, it should show 2.66 gal to be commensurate with pre-ethanol numbers (7 -> 3.66, less the gallon used to make it.)
About a month ago I had a discussion with Ron Patterson (darwinian), and I told him I expect January-February C&C production being at 70-71 mbpd. He told me I was insane and it will be closer to 73.
Well, the September number is 73.8 mbpd and there was at least a 1 mbpd cut since then. I think we will see December numbers at around 72.5 mbpd and February numbers below 71 mbpd.
Taking the way EOR works into account, the decline rates will definitely climb from 6.7% globally to the neighborhood of 8% in 2009. I just cannot see C&C production being more than 60 mbpd by 2015, but at the rate we are going I'd say 55 mbpd instead. With all liquids being at 70, if that.
So 2% separates the insane vs the sane (i.e. the non-insane) ?
Remember trends, people, trends. Fluctuations and noise can indeed drive you insane if you let it.
Not being sane was not my way of putting it. ;-)
Anyhow, I expect a minimum of 2 mbpd reduction in 2009 as a whole compared to 2008. We shall see.
55 mbpd in 2015? Where do you get all these figures from? The middle east would have to collapse for that to happen. Is that your assumption? Iraq is going to ramp up production now that the place is more peaceful. It can easily produce 6 mbpd. I think it is important to keep sane when predicting the future. Perhaps global C&C will decrease to 68-69 mbpd by 2015, but let us not get completely crazy here!
Considering that Iraq is producing about 2.3mbpd - a level that is still lower than prior to the US invasion - it's doubtful that it can "easily" more than double its production. Given the long lead-times for getting new production on stream, it's also doubtful that we'll see any substantial increases in Iraqi production for quite some time to come.
Currently, Iraq has no set OPEC quota - this isn't a situation that will last indefinitely. My current best guess is that Iraq will eventually be set a quota of around 3.5mbpd, and it will take at least 5 years for it to attain that production level.
55 mbpd in 2015 is pretty much in line with what Matt Simmons says the IEA expects in the true "secret" version of their latest energy outlook and he thinks even that might be optimistic.
Just a few points/observations...
1. It seems apparent, at this point, that the massive overall financial crash and continued slowing of the world economy is continuing to send out shock-waves of demand destruction across the commodities sector.
2. As long as this economic environment persists, I think it likely that both prices and overall worldwide production will be under very severe downward strain.
3. We won't know if peak oil happened until (if/when) the world economy recovers and begins demanding more oil, oil products, and alternatives.
4. Of course, with a nod to doomers, the other scenario is that the world economy never recovers and then it becomes an uproarious debate as to what sparked the collapse (oil prices, energy scarcity, woefully mismanaged finances, US economic decline, the unsustainability of the service economy, contraction in the real economy reaching a tipping point, and a million others).
As a side-note... I find it laughable that at the point that Yergin began predicting higher prices we have seen, perhaps, the greatest crash in oil prices since oil began trading as an energy source (or at least the worst collapse in 30 years). At this point, it becomes the imperative of someone with far more credentials than I to write a book/parody about Yergin as a contraindicator.
Best wishes and happy holidays to all.
Rob
Which oil producers are going to collapse then? Surely some of the big ones would have to collapse in a huge way for 55 mbpd to happen. Saudi and Russia producing half of what they produce today, is that the assumption?
Bracio,
Sorry to butt into the middle of the debate but are you postulating that that production capability won't drop to 55 mbpd or that demand won't drop that low?
Thanks in advance.
I'm talking about production yes. Perhaps production will drop to 68-69 mbpd by 2015 but 55 mbpd is really way out there, and should be followed up with some form of country analysis of the big producers.
Well, I'm not going to re-insert my model again. But I have one and it has proved to be in pretty good agreement with the facts in the last 2 years.
In case you are interested in the details, you can always do a search on this site.
After 2010, there will be a decline of 3 mbpd each year (on average). Unless production is cut by 10 mbpd in the next few years. In that case, there is your undulating plateau -- at 63-64 mbpd (C&C).
Freddy Hutter (Mr. Trends himself) guaranteed 90 mb/d post US President's Day 2009 last year, if you're interested in another non-rational missive. Posted at this site, too, before he got the boot.
Interesting jump in spare capacity, EIAIEA must be including Khursaniya now.
Schedule of OPEC Megaprojects for 2008:
What sticks out for me is the second-last graph displayed above, "OPEC Crude oil production". During the period when the price was on a serious runup, from mid-2005 to mid-2007, OPEC production did a smooth decine from 32 to 28.5 mmbpd. That got the rising price paradigm embedded, then (likely on demands from eg. USA), production started back up again..... so here we are.
For me, the only chart that matters is Chart 30 on page 9
World Liquids Exports. It is flat, so all is well.
when it drops definitively below 46, the end is near...
(definitively = consistent 6 month period)
Remember that the 3.5 mbpd cut that OPEC has made since Sept is not reflected in that chart.
So lets say that by the end of Jan 09 exports are down 3 mbpd from Sept. That would take it down to about 44 mbpd.
By Sept. the USA had already cut it's demand by over 1 mbpd (from 20.5 to 19.5) while exports where basicly flat at about 47 mbpd
That raise a question, who's going to lose that 3 mbpd of imports?
Remember that, if you live in an importing country, that Exports are the only thing that matters.
And I agree that this is a phenomenal report
We should put Rembrandt on the TOD Mount Rushmore
This goes right up there with Baltic Dry Index, LIBOR, Jeffries Commodity Index and a few other key economic indicators
I found this curious list from Reuters, June 25th 2008: AMERICAS- CRUDE/NEW | Markets | Reuters. It's a list of Megaprojects with date of first oil/type/flow rate, which often differs slightly from the TOD Wiki figures; I also notice the late 2008 "Foster Creek SAGD 2," at 30 kb/d, which doesn't seem to be in the Wiki at all. May be of interest.
Every one of those projects in Canada, save Encana's are canceled or on hold. The new production from Canada's oil sands will be delayed by 6 months...and counting
Could you include a monthly chart of total liquids for a longer period extending back to 2000 if possible?
@alan
Chart number 4 on page 2 denotes total liquids from 1937 until 2007. This chart will be updated in the January edition with the 2008 data.
There is no data available on monthly production prior to 2002 so I cannot go further back than that. In the older editions of the Oilwatch you can find these charts that go back to 2002.
Rembrandt
Hi Rembrandt,
EIA has monthly data for total liquids back to Jan 2001 at the link below:
http://www.eia.doe.gov/emeu/ipsr/t14.xls
There is also monthly data on crude + condensate oil output back to Jan 1973.
What America needs is to become energy independent As we do the happy dance around the lower prices at the pumps OPEC plans to cut production to raise prices again. This past year and the record gas prices played a huge part in our economic meltdown and seriously damaged our society.We keep planning to spend BILLIONS on bailouts and stimulus plans.Bail us out of our dependence on foreign oil. Make electric plug in car technology more affordable. It cost the equivalent of 60 cents a gallon to drive an electric plug in car. The electric could be generated from wind or solar.If all gasoline cars, trucks, and suv’s instead had plug-in electric drive trains, the amount of electricity needed to replace gasoline is about equal to the estimated wind energy potential of the state of North Dakota.Get with it! Utilize free sources such as wind and solar. Stop throwing away money on things that don't work. Invest in America and it's energy independence. Create cheap clean energy, create millions of badly needed green collar jobs. Put America back to work. It is a win-win situation. We have to become more poractive citizens, educate ourselves and demand our elected officials move this country forward into the era of energy independence. Jeff Wilson's new book The Manhattan Project of 2009 Energy Independence NOW outlines a plan for America to wean itself off oil. We need a plan and we need it now! http://www.themanhattanprojectof2009.com
Drop the commercial post please - stick to the rules mate.
I agree about the commercialism Segel. But post like this remind me how difficult it will be to get the public to understand the real problem and anticipate actual remedies. The commercial does a great job of offering a wonderful list of goals. Unfortunately many will take such goals as the solutions themselves. I'm sure most of us have been saddled with "goals" by management which didn't consider methods needed to reach those goals. Or, more to the point, if there were any practical way to meet those goals. Unfortunately this will often lead to inflated claims of success in order to provide cover for failing to truly reach those goals. I personally consider ethanol to be such a situation.
I agree in theory that we need to get away from BAU. But cornucopian dreams of green solutions serve us no better than cornucopian dreams of drilling ourselves out of the problem either. In the end it just confuses and divides the populace even more IMO.
"Britain's leading green commentator, George Monbiot, tackles the International Energy Authority's chief economist, who reveals for the first time a startling and worrying prediction for the date of peak oil."
Video Link: http://therealnews.com/t/index.php?option=com_content&task=view&id=31&It...
He also mentions the Hirsch report.
Cheers
Send this excellent video to everyone you know!