| IEA WEO 2008 - Fossil Fuel Ultimates and CO2 Emissions Scenarios | The Oil Drum: Europe | EU energy consensus - trending in the right direction |
IEA WEO 2008 - NGLs to the Rescue?
Posted by Rune Likvern on December 5, 2008 - 9:48am in The Oil Drum: Europe
According to the IEA World Energy Outlook 2008, p. 261:
Output of natural gas liquids — light hydrocarbons that exist in liquid form underground and that are produced together with natural gas and recovered in separation facilities or processing plants — is expected to grow rapidly over the Outlook period. Global NGL production is projected to almost double, from 10.5 mb/d in 2007 to just under 20 mb/d in 2030.
One can see from IEA's chart of World Oil Production by Source that the growth of natural gas liquids, or NGLs, is being depended on as a significant contributor to total world oil production:
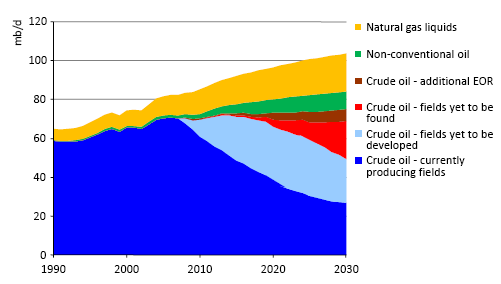
In this post, I will document that there is good reason to believe that the IEA WEO 2008 projections in the reference scenario overshoots the likely world production of NGLs by as much as 35 - 50 % by 2030.
One way of estimating expected NGLs is as a ratio to natural gas production, representing the wetness or dryness of gas. One would expect this ratio to decline over time, based on what normally has been observed from fields, areas and regions with good quality data. Instead, the IEA is forecasting that this ratio will increase in the future.
NOTE: All diagrams are clickable and open in a larger version.
INTRODUCTION
In the oil and gas industry, there is a broadly used parameter that expresses the “dryness/leanness” or “richness/wetness” of natural gas. In this post, I document that this parameter is expected to change to dryness/leanness over time, based on an extensive analysis of actual data on fields, areas and regions. I also show that the IEA WEO 2008 forecast to 2030 implies the opposite result--namely that the shift will be toward richness/wetness.
The parameter measures volumetric NGL’s content per volumetric unit Nat Gas produced, in this post expressed as barrels per standard cubic meter (Bbl/Scm).
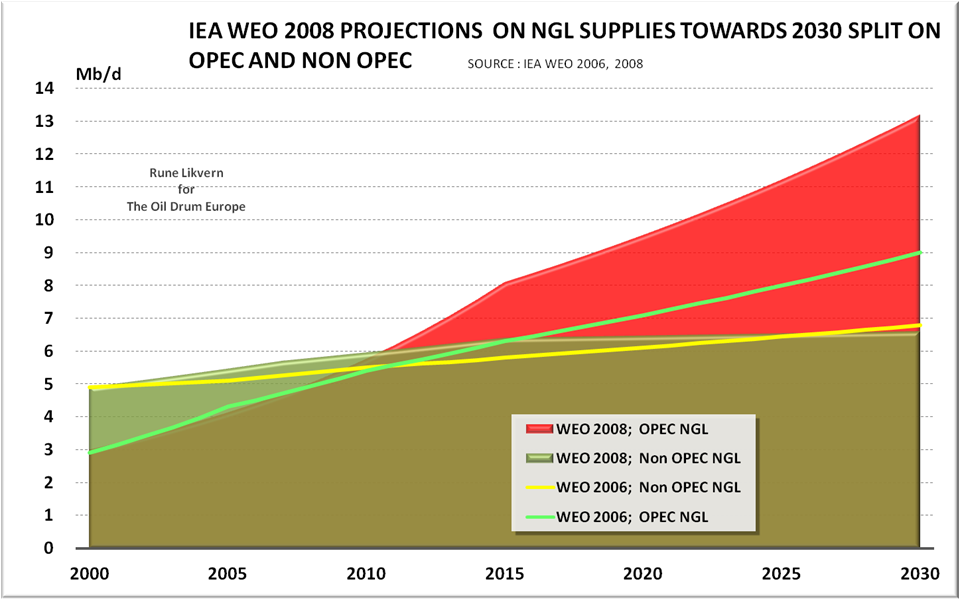
FIGURE 01 The diagram above shows the projections of NGLs production to 2030 split between Non OPEC (green area) and OPEC (red area) from IEA WEO 2008. The same diagram also shows the projections to 2030 from IEA WEO 2006 for Non OPEC (yellow line) and OPEC (light green line).
While projections on Non OPEC NGL production has literally remained unchanged from WEO 2006 to WEO 2008, OPEC production has been projected to grow an additional 4 Mb/d (an increase of close to 50 %) by 2030.
Normally the fields that are “richest/wettest” (that is requiring least Nat Gas to yield a barrel of NGL) are developed first from a portfolio within a region, inasmuch as these also normally give the highest return on investment. NGLs, depending on their composition, have a volumetric energy content that is 70 - 75 % of crude oil.
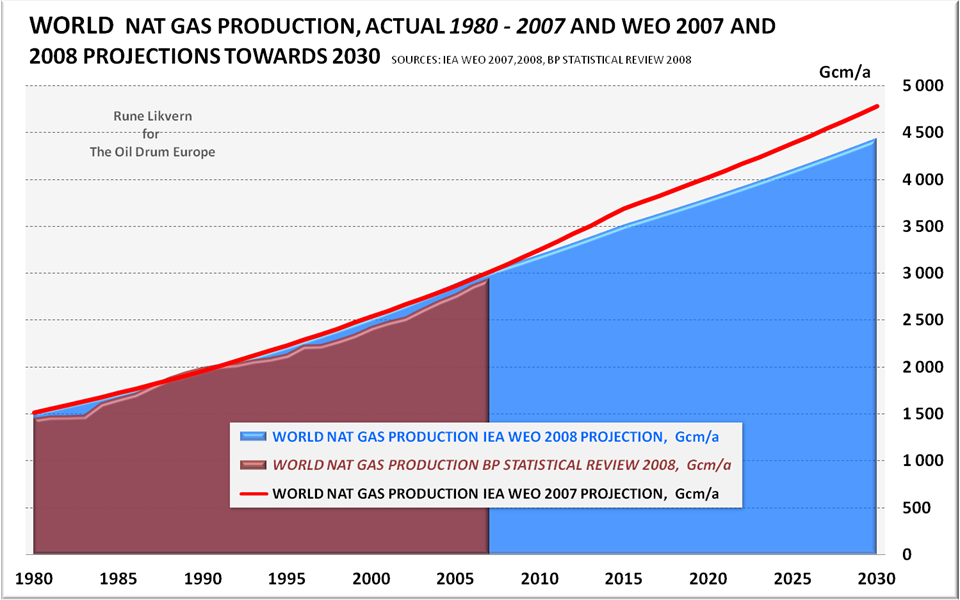
FIGURE 02 The diagram above shows the projections on World Nat Gas production (blue area) from IEA WEO 2008 towards 2030. The red line shows the projections from WEO 2007, and the dark red area is actual World Nat Gas production as reported by BP Statistical Review 2008.
The reason why the Nat Gas projections from WEO’s are shown is because NGLs are produced from Nat Gas. Thus, Nat Gas production and NGL production are strongly connected. NGLs, as defined by IEA, are exempt from the OPEC quota system. This is IEA's definition of NGLs, from page 544 of ANNEXES of WEO 2008:
Natural gas liquids (NGLs) are the liquid or liquefied hydrocarbons produced in the manufacture, purification and stabilization of natural gas. These are those portions of natural gas which are recovered as liquids in separators, field facilities or gas processing plants. NGLs include, but are not limited to, ethane, propane, butane, pentane, natural gasoline and condensates.
Regarding natural gas liquids (NGLs), the IEA says the following (Chapter 11, p. 261):
Output of natural gas liquids – light hydrocarbons that exist in liquid form underground and that are produced together with natural gas and recovered in separation facilities or processing plants – is expected to grow rapidly over the Outlook period. Global NGL production is projected to almost double, from 10.5 mb/d to just under 20 mb/d in 2030. This increase is driven by the steady rise in natural gas output (see Chapter 12). The bulk of the increase comes from OPEC countries, where gas production (to supply local markets and new LNG projects) is projected to expand quickest. OPEC NGL production almost triples, from 4.7 mb/d in 2007 to over 13 mb/d in 2030. The Middle East accounts for four-fifths of this increase. Non-OPEC NGL production increases by about 1 mb/d, to close to 7 mb/d in 2030 (Figure11.11). These projections assume that the average NGL content of gas production is constant over the projection period.
Figure 3, below, shows what happens when we compare the IEA's projections of NGLs (from Figure 01) with their projections of Nat Gas (from Figure 02).
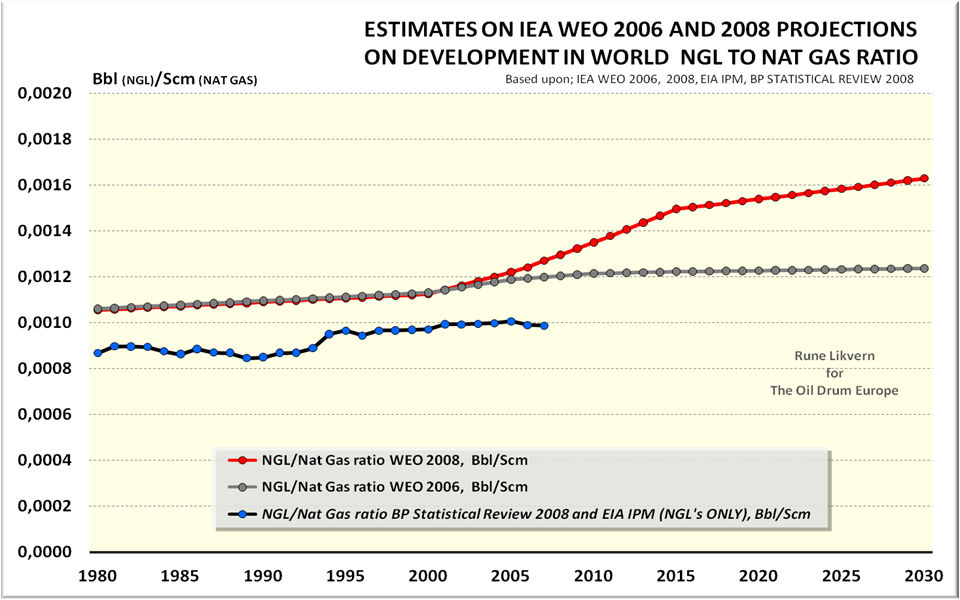
FIGURE 03 The diagram above shows the derived World NGL/Nat Gas (expressed as Bbl/Scm) ratio derived from IEA WEO 2006 (grey circles connected with a grey line) and IEA WEO 2008 (red circles connected with a red line).
Figure 3 indicates that the world average Nat Gas “richness/wetness” based on IEA WEO 2008 is expected to grow by approximately an additional 30 % relative to IEA WEO 2006, in the years to 2030.
The diagram also shows the development in the World’s NGLs (exclusive of Condensates) to Nat Gas ratio based upon data from the US Energy Information Administration's International Petroleum Monthly and British Petroleum's (BP) Statistical Review 2008. (Since this data is exclusive of condensates, it is on a slightly different basis than the IEA's forecast.) This ratio showed moderate growth until the mid 90s, but has remained flat in recent years.
WHAT HISTORICAL DATA SHOWS
In this section, I document how NGL/Nat Gas ratios have changed over time for areas and regions. I also provide a more detailed look at NGLs production in OPEC and what might reasonably be expected based on information in the public domain about current developments.
THE SLEIPNER AREA (Norway)
The Sleipner area consists of the following producing fields: Sleipner East and West, Gungne and Loke. The Sleipner area consists of several fields that are classified as Nat Gas/Condensate fields. Sleipner East started to flow in 1993 followed by Sleipner West in 1996. To increase liquid (NGLs and Condensates) recovery from the fields, some of the Nat Gas is recirculated. This technique is also applied on other Nat Gas/Condensate fields.
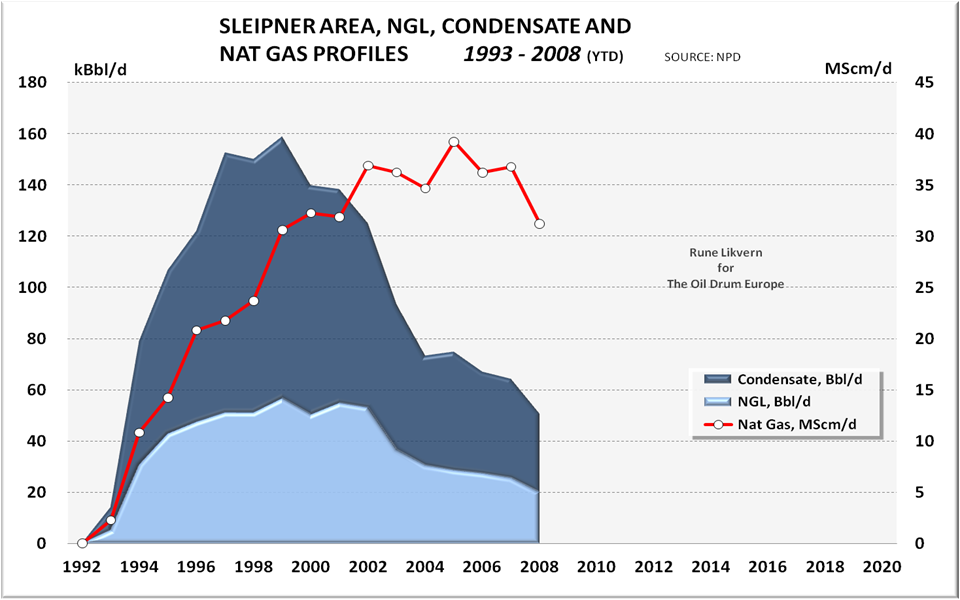
FIGURE 04 The diagram above shows the actual production of NGLs and Condensates (light blue and dark blue areas plotted against the left y-axis) and Nat Gas production (white circles connected by a red line plotted towards the right y-axis).
Figure 05 below illustrates that the NGLs production is now declining faster than Nat Gas production.
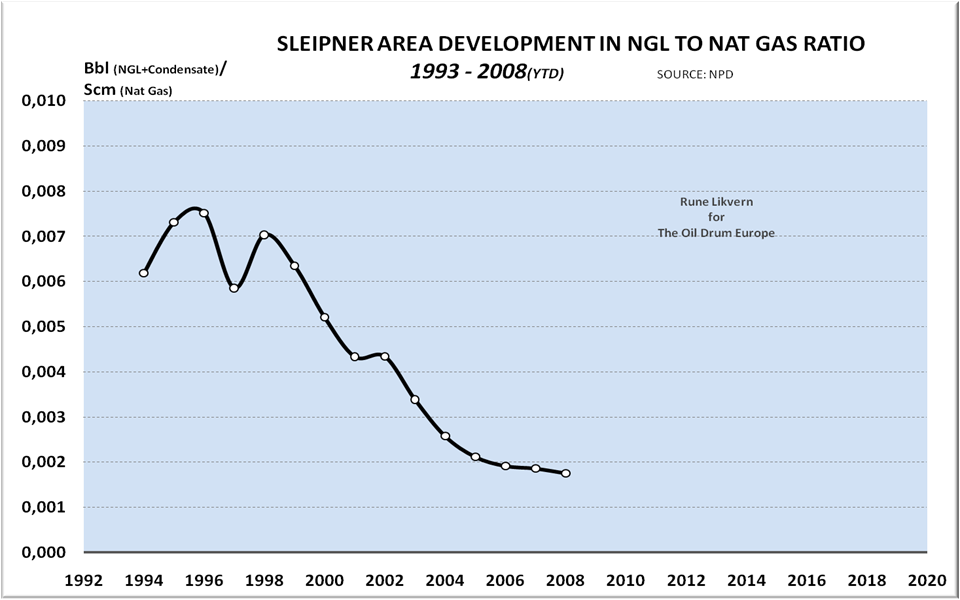
FIGURE 05 The diagram above shows the development of the NGL to Nat Gas ratio for the Sleipner area. It also illustrates the rebound of the NGL/Nat Gas ratio as Sleipner West started to flow in 1996. The Sleipner is made up of rich Nat Gas/Condensate fields.
Note how the NGL/Nat Gas ratio has declined with time. In other words, production has become dryer, or leaner, over time.
NPD data at year end 2007 gives the Sleipner area a Reserves divided by Production ratio or R/P of 4,0 for natural gas, and of 1,3 for NGLs. The low R/P ratio for Nat Gas suggests that Nat Gas production from the Sleipner area soon will enter into a steep decline. Inasmuch as the R/P ratio for Nat Gas is higher than the R/P ratio for NGLs, this suggests that the Nat Gas will become increasingly drier, i.e. yield less NGLs from each volumetric unit of Nat Gas produced. Another way to put it is that NGL production will fall more steeply than Nat Gas production in the future.
THE NGL STORY FROM NORWEGIAN CONTINENTAL SHELF (NCS)
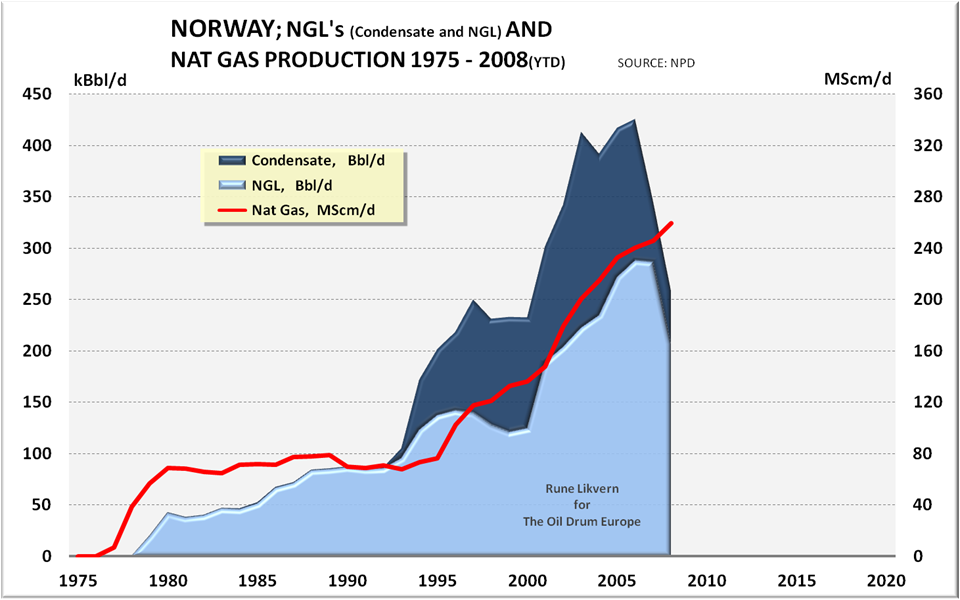
FIGURE 06 The diagram above shows the actual production of NGLs and Condensates (light blue and dark blue areas plotted against the left y-axis) and Nat Gas production (red line plotted towards the right y-axis) from NCS (Norwegian Continental Shelf).
Figure 6 illustrates that the NGLs production in NCS declines faster than the Nat Gas production, which is projected to grow in the years ahead.
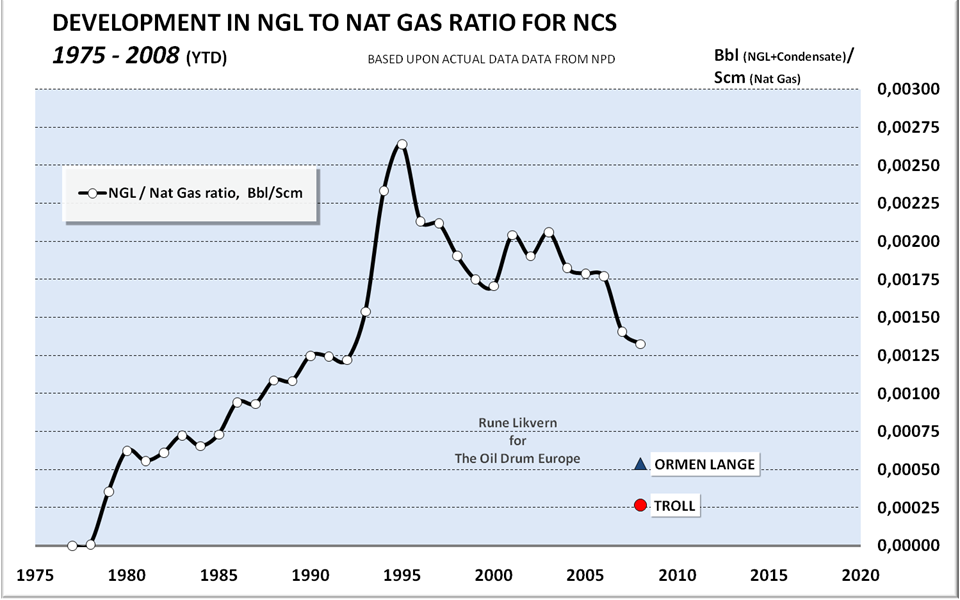
FIGURE 07 The diagram above shows the development of the NGL to Nat Gas ratio for NCS.
Figure 07 illustrates how the NGL/Nat Gas ratios increased as more fields were brought on stream, until it “peaked” in 1995 and has been in general decline since. This ratio may wobble around a little as more fields starts to flow, but the general trend with time is towards “dryer”/”leaner” Nat Gas. For NCS, this ratio rebounded again as the Åsgard and other fields in the Halten area were brought on stream earlier this decade.
What future development can be expected of the NGL/Nat Gas ratio for NCS?
NPD data on estimated remaining recoverable reserves from producing and sanctioned fields on NCS at end 2007 results in the following R/P numbers for NGLs and nat gas;
- NGLs; R/P = 14,3
- Nat Gas; R/P = 25,7
NGLs are produced mainly from fields classified as Nat Gas and Nat Gas/condensate fields, thus the above R/P numbers suggests that the NGL to Nat Gas ratio will decrease with time for NCS, i.e. the Nat Gas will become “drier”/”leaner”.
Figure 7 also shows the present NGL/Nat Gas ratios for the Troll and Ormen Lange fields. These fields are what are considered as “dry”/”lean” Nat Gas fields. With time, as the other fields deplete, the NGL/Nat Gas ratio for NCS can be expected to approach the ratios of Ormen Lange and Troll.
OPEC NAT GAS AND NGL PRODUCTION
Since the IEA WEO 2008 projects strong growth in NGLs between 2007 and 2030, I will take a closer look on NGLs and Nat Gas production within OPEC.
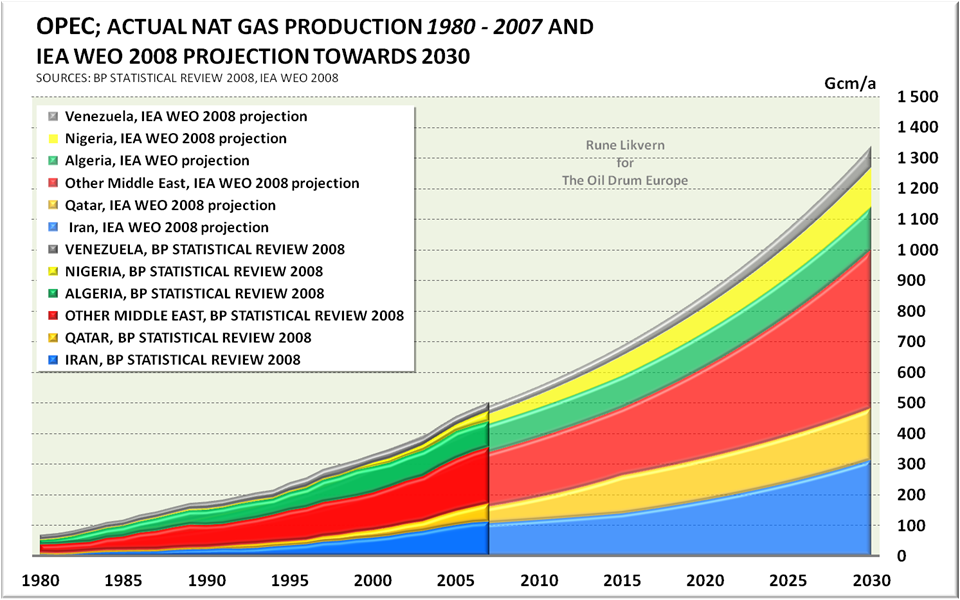
FIGURE 08 Actual and IEA WEO 2008 projected development of Nat Gas production for OPEC.
Note that the above chart uses an approximation to OPEC production, rather than the precise list of countries. The diagram does not include developments of Nat Gas production for Angola, Ecuador, Indonesia and Libya. Among these countries, Indonesia and Libya are listed in the BP Statistical Review 2008 with a total of 4,5 Tcm at end 2007. On the other hand, the chart includes data Middle Eastern countries which are not OPEC members. These differences should be small, and partially offset.
Figure 08 indicates that IEA WEO 2008 expects strong growth in Nat Gas production from OPEC. OPEC had more than 51 % of the World's proven Nat Gas reserves as of end 2007, and just above 18 % of the World's production.
Strong growth is forecast in the Middle East to come from Iran (South Pars) and Qatar (North Field), which now is estimated to hold approximately 35 Tcm combined or 20 % of the Worlds reserves. Reserves in the Middle East have a high H2S (above 100 ppm), CO2 (above 2 %) or a combination of these two nuisances. H2S and CO2 must be removed to meet buyer’s sales specifications which adds to development costs.
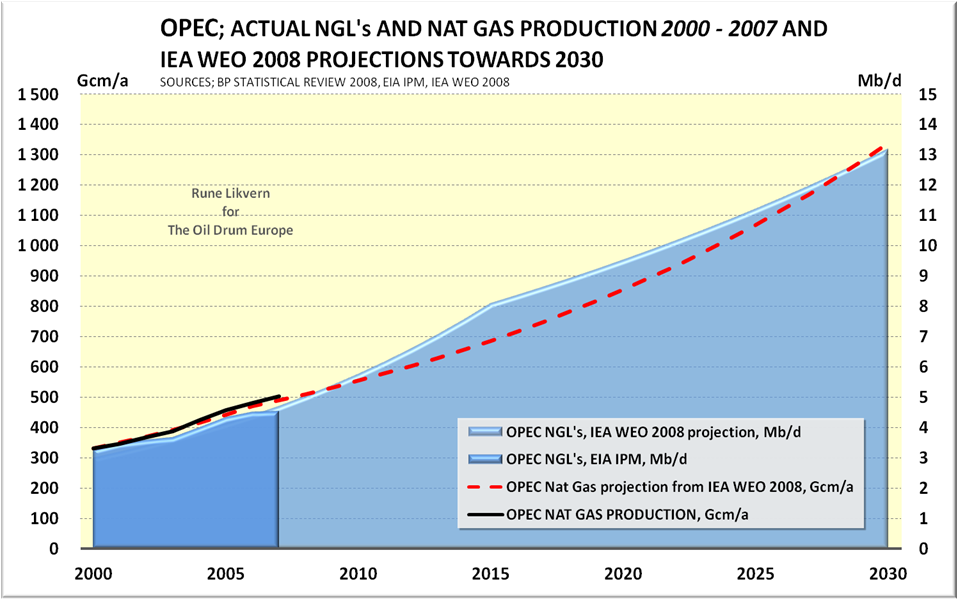
FIGURE 09 The diagram above shows OPEC actual NGL production together with IEA WEO 2008 NGL projection towards 2030 (blue areas) plotted towards the right y-axis. It also shows actual (black line) and IEA WEO 2008 projected development of Nat Gas production for OPEC (red dotted line) plotted towards the left y-axis.
In Fiugre 09, above, note that NGLs are forecast to grow faster than Nat Gas until 2015, and thereafter have a slower growth.
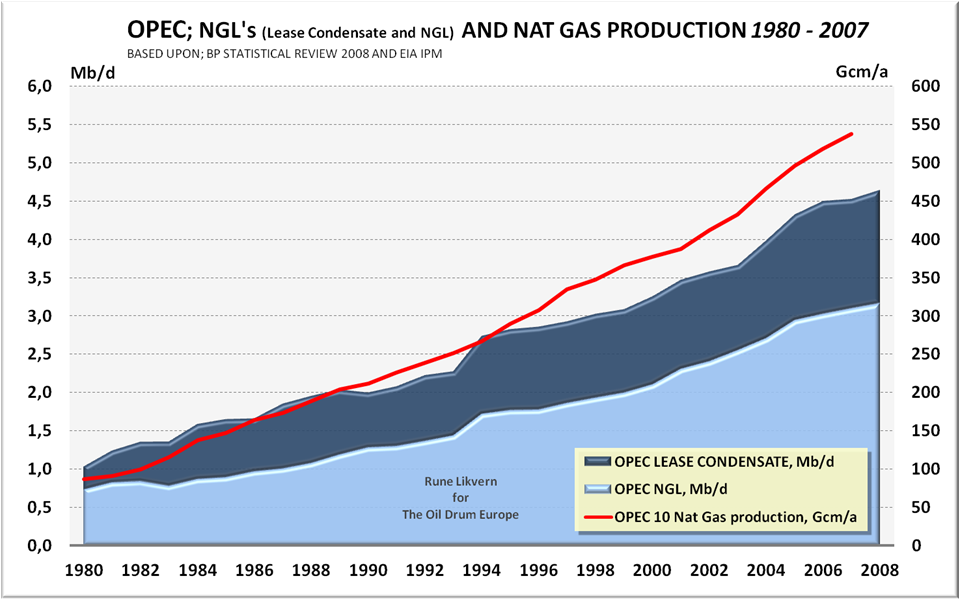
FIGURE 10 The diagram above shows OPEC actual NGL and Condensate production (plotted against the left y-axis) against actual Nat Gas production (red line) plotted against the right y-axis for the years 1980 to 2007.
In Figure 10, note how Nat Gas has grown faster than NGLs in recent years, suggesting that the average OPEC Nat Gas is becoming leaner/drier.
From 1979 to 1987, OPEC cut back total oil production of 11,8 Mb/d, due to recession and increased output from Alaska, the North Sea and Western Siberia. In the same years, output of NGLs within OPEC continued to grow. As NGLs are not part of the OPEC quota system, this would suggest that OPEC members had good incentive to develop fields yielding NGLs for additional income outside the quota system.
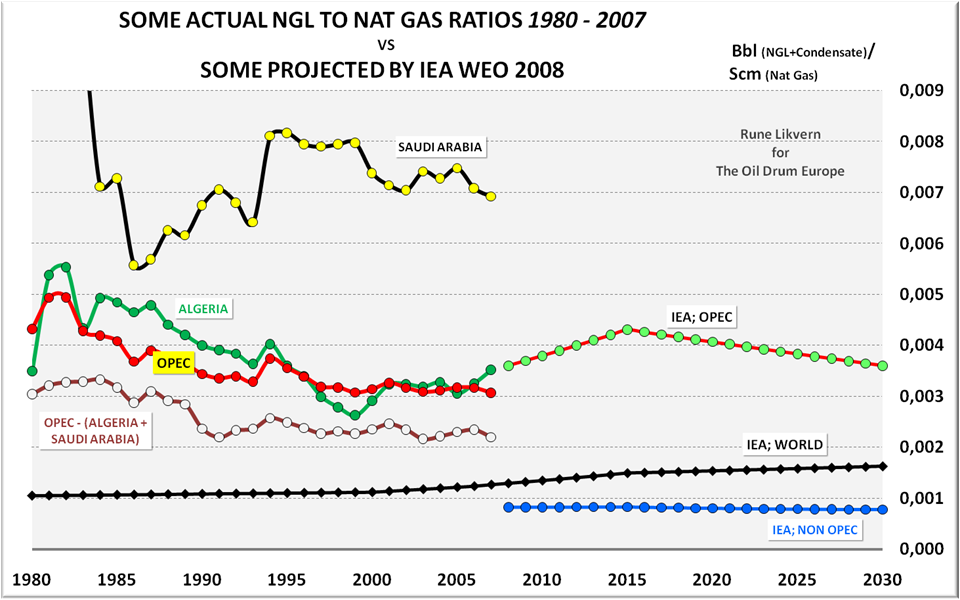
FIGURE 11 Additional NGL to Nat Gas ratios and further projections derived from IEA WEO 2008 for OPEC, Non OPEC and the World.
Note that IEA shows a decline in NGLs to Nat Gas ratios with time. The reason this ratio continues to grow for the World is that OPEC’s relative share in World Nat Gas production is projected to grow. The general trend for the NGL to Nat Gas ratio for Algeria (green line), Saudi Arabia (yellow circles connected with black line), OPEC (red circles connected with red line) and OPEC - (Algeria and Saudi Arabia) is downward with time, that is “drier”/”leaner” Nat Gas.
As of 2007 Algeria and Saudi Arabia had around 30 % of OPEC’s Nat Gas production and close to 50 % of OPEC’s NGL production. For Saudi Arabia the high NGL to Nat Gas ratio suggests a high portion of associated Nat Gas. For Algeria, the recent uptick in the NGL to Nat Gas ratio seems to be associated with the start up of Algeria’s third and fourth largest Nat Gas/Condensate fields In Salah and In Amenas.
It is in this context that the derived projected increase in the NGL to Nat Gas ratio for OPEC (light green circles connected with red line) from IEA WEO 2008 becomes interesting. A closer look on projected growth in OPEC’s near future Nat Gas production reveals that much will come from North Field in Qatar and South Pars in Iran. Data on the website to StatoilHydro, who is partner in South Pars 6 - 8 (South Pars is listed to have 28 phases), suggests an initial NGL/Nat Gas ratio of 0,0011 Bbl/Scm. Data from SHELL’s Pearl GTL, project which is fed from North Field, suggests a NGL/Nat Gas ratio of 0,0024 Bbl/Scm. The GTL process is fed almost pure methane, which is also true for the LNG plants for Qatargas. Other sources list South Pars to have a NGL/ Nat Gas ratio of 0,0015 Bbl/Scm.
This data suggests that an average NGL/Nat Gas ratio of 0,002 Bbl/Scm can be expected for North Field/South Pars. This ratio is close to the current ratio for OPEC - (Algeria and Saudi Arabia), based on Figure 11.
In Figure 12, below, I show the IEA estimate of future NGL production together with my estimate of future NGL production. My estimate assumes that IEA's estimates of future Nat Gas production are correct--a rather large assumption. In making my forecast, I also assume the NGL/Nat Gas ratio for OPEC current Nat Gas production will remain unchanged at its current level of 0,003 Bbl/Scm until 2030. I also assume an average of 0,002 Bbl/Scm for new Nat Gas from OPEC, based on the discussion above and the IEA WEO 2008 projection on Nat Gas until 2030. I will leave to the readers to decide if the assumptions used above should be considered conservative or about right given the documentation provided earlier in this post.
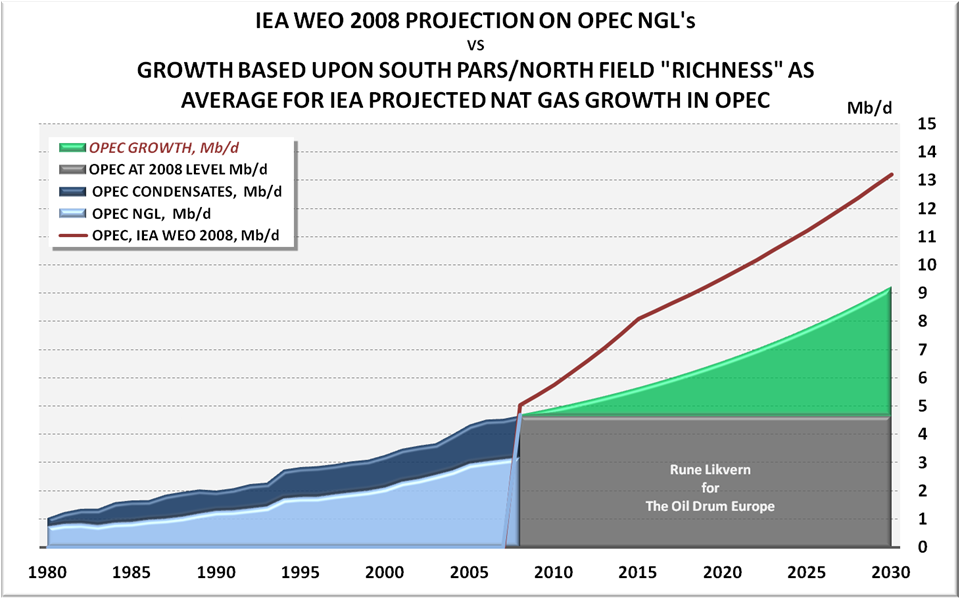
FIGURE 12 The diagram above shows actual production of NGL (light blue area) and Condensates (dark blue area) for OPEC, as this has been reported by EIA in International Petroleum Monthly. The dark red line shows the IEA WEO 2008 projection (from the reference case). The grey area shows production at 2008 levels, while the green area shows the growth in NGL’s from OPEC applying the assumptions prior to this diagram.
As the diagram illustrates, my forecast using the stated assumptions comes close to the NGL projections for OPEC made in the IEA WEO 2006 reference case.
The question is: What made IEA revise the NGL/Nat Gas ratio in their WEO 2008 ?
WHAT DOES IT TAKE TO MEET THE IEA WEO 2008 PROJECTION IN 2015?
Between 2007 and 2015, half of the growth in OPEC Nat Gas production is projected by IEA to come from Iran and Qatar (South Pars and North Field) which suggests an average NGL/Nat Gas ratio of 0,002 Bbl/Scm, based upon data from several of the companies that are involved in these developments.
In order for IEA's forecast to be accurate, this would require that the other half in Nat Gas production growth from OPEC between 2007 and 2015 come from fields with an average NGL/Nat Gas ratio of 0,012 Bbl/Scm, which is 6 times “richer”/”wetter” than Nat Gas from North Field/South Pars. 0,012 Bbl/Scm is close to double the “richness” of present Saudi Arabian production, ref Figure 11 above. Anyone in the oil industry would testify that Nat Gas/Condensate fields with such a high liquid ratio, (0,012 Bbl/Scm), would be fantastic.
As NGLs (inclusive Condensates) are not part of the OPEC quota system, there would be a huge incentive within OPEC to develop such Nat Gas fields as quickly as possible.
FOR THOSE OF YOU THAT WANTS MORE DATA ON NGL/Nat Gas RATIOS
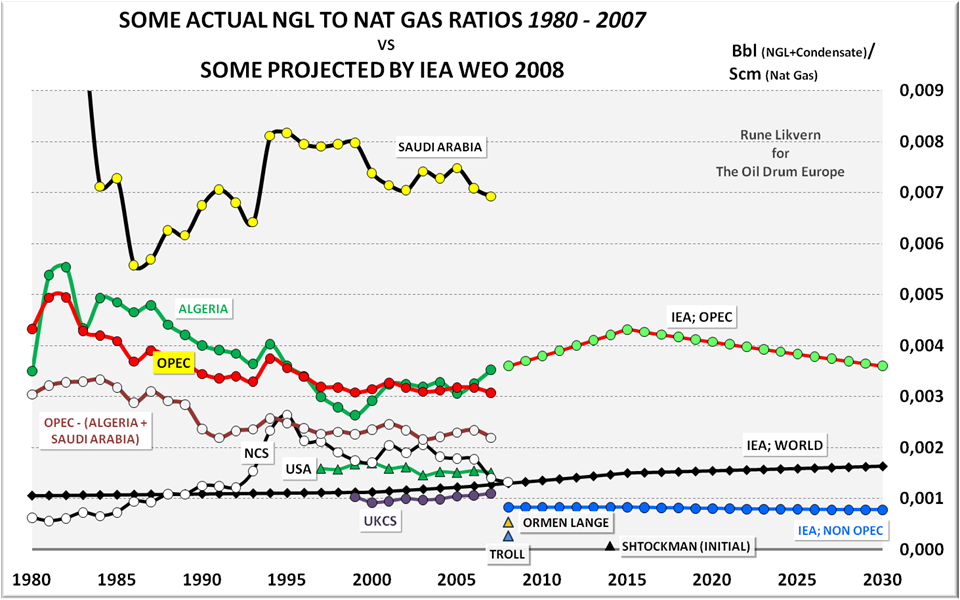
FIGURE 13 The diagram above shows some more developments on NGL to Nat Gas ratios.
Note that the ratio for NCS is presently at about the world average; further the US ratio has remained almost flat throughout the last ten years. Data from EIA for the USA at the end of 2007 gave an R/P ratio for Nat Gas of 12,2 and NGL of 11,0 suggesting a slight decline to be expected in the future. For the United Kingdom Continental Shelf (UKCS), the ratio has been below the world average, but recently shown a little growth, now believed to be due to increased exports of “rich gas” from NCS.
The diagram suggests that Nat Gas outside OPEC, USA and the North Sea is much drier/leaner than the world average derived from IEA WEO 2008. Note that the Russian giant Shtockman field (presently scheduled to start to flow in 2013) is a very dry gas field.
Methodology
The analysis presented in this post has strictly adhered the IEA WEO’s definition (ref. above) of NGL’s, if not otherwise stated. It has also used the IEA WEO 2008 projections of growth in Nat Gas production for the world and groups of countries. This analysis has not considered the possibility that the IEA WEO 2008 Nat Gas projections, to which the ratios are applied, may be inaccurate.
From here, I will leave it to the readers to add comments and/or suggestions.
SOURCES:
[1] IEA WEO’s 2006, 2007 and 2008
[2] EIA International Petroleum
[3] EIA, U.S. Crude Oil, Natural Gas, and Natural Gas Liquids Reserves. 2007 Annual report, October 2008.
[4] BP Statistical Review 2008
[5] DTI/BERR/DECC, Energy Statistics, Oil and Gas
[6] NPD, Annual resource accounting and Production Data
[7] SHELL, webpage data on PEARL GTL project
[8] Qatargas, webpage and various annual reports on LNG projects
[9] StatoilHydro, webpage on data for South Pars and In Salah, In Amenas
[10] Wikipedia on data for North Field and South Pars
Personnel
Editors
Contributors
Peak Oil Primers
Archives
- November 2010 (3)
- October 2010 (6)
- September 2010 (4)
- August 2010 (7)
- July 2010 (6)
- June 2010 (7)
- May 2010 (2)
- April 2010 (8)
- March 2010 (4)
- February 2010 (6)
- January 2010 (3)
- December 2009 (5)
- November 2009 (8)
- October 2009 (12)
- September 2009 (6)
- August 2009 (5)
- July 2009 (11)
- June 2009 (8)
- May 2009 (16)
- April 2009 (10)
- March 2009 (7)
- February 2009 (10)
- January 2009 (15)
- December 2008 (9)
- November 2008 (9)
- October 2008 (9)
- September 2008 (13)
- August 2008 (10)
- July 2008 (14)
- June 2008 (23)
- May 2008 (16)
- April 2008 (12)
- March 2008 (16)
- February 2008 (9)
- January 2008 (13)
- December 2007 (13)
- November 2007 (16)
- October 2007 (22)
- September 2007 (8)
- August 2007 (9)
- July 2007 (16)
- June 2007 (8)
- May 2007 (7)
- April 2007 (7)
- March 2007 (10)
- February 2007 (10)
- January 2007 (12)
- December 2006 (9)
- November 2006 (15)
- October 2006 (4)
- September 2006 (5)
- August 2006 (5)
- July 2006 (9)
- June 2006 (5)
- May 2006 (10)
- April 2006 (9)
- March 2006 (13)
Vital Trivia
License

This work is licensed under a Creative Commons Attribution-Share Alike 3.0 United States License.
"light hydrocarbons that exist in liquid form underground and that are produced together with natural gas and recovered in separation facilities or processing plants —..."
the iea should check their facts.
gas reservoirs exists in the gas phase underground. ngls can be liquified by processing at the surface.
the exception would be a retrograde condensate, because of the unique combination of composition, temperature and pressure in the reservoir, intermediate h-c components condense in the reservoir upon pressure depletion.
ngls are composed of intermediate h-c components(h2 - h6).
"gas reservoirs exists in the gas phase underground"
Is this 'by definition', or is the gas from gas wells truly a gas before extraction? It would seem that any gas associated with oil will be at least partially dissolved/adsorbed in the condensed phase.
Another question...are there any alkenes in the ngl mix?
-dr
So far in my career I have seen some characterisations of reservoir fluids, but cannot remember that anyone included alkenes.
Normally cracking of hydrocarbons is the method of producing alkenes.
gas reservoirs by the petroleum reservoir engineering definition exist in the gas phase in their native state, i.e. pressure and temperature. and we know this from a laboratory study of the reservoir fluid at reservoir temperature commonly called a pvt(pressure-volume-temperature) study. the fluid is studied at constant temperature to determine its physical properties with depleting pressure. a pvt study will normally include a separator test, or series of separator tests to model production through surface equipment and determine (at least) initial liquids yield. the other important results of such a study are the composition of the separator gas and liquid.
gas which is produced from an oil reservoir under pressure depletion will have largely the same characteristics. gas produced from an oil reservoir was originally disolved in a liquid phase with the smaller c through c6 molecules occupying intersticies between the larger liquid hc molecules.
and wrt alkenes, we dont normally analyse any h-c components heavier than c6 as individual components, they are usually lumped as one fraction.
20 mbpd for NGLs seems a bit optimistic. I think with the arrival of cyclone-proof floating platforms we can decide in advance the gas/liquid output of some deepwater wells. The platform can house separation facilities, Fischer-Tropsch gas-to-liquids and LNG liquefaction. The appropriate tankers can moor alongside, maybe 200km out to sea, and take away the specialty product. In some cases scrubbed CO2 can be re-injected into old wells. I believe Fischer-Tropsch GTL throws away a lot of the energy (50%?) as well as high CO2 due to partial combustion within the process.
This could all be a bit premature because they only showed wave tank testing of the giant platforms on TV this week. A surprise twist is that the small nation East Timor claims it will be shafted on royalties since the platforms will be over the horizon.
In the long term aircraft and range extended plug-in hybrids will need fuel that is liquid at ambient temperature and pressure. They will use some NGLs like pentane in liquid blends as well as ethanol. Demand for autogas, LPG or propane-butane in pressure tanks also seems assured. As oil refineries close whether enough can be separated from NG seems to be an open question. A major development could be compressed natural gas injected with separate liquids plus turbocharging such as a new Opel Zafira van. Then there is straight CNG like the Honda Civic NGV as well as various buses and trucks.
Therefore there may be a wholesale shift away from liquids or there could be a core demand from aviation and multifuel ICE vehicles. I believe GM has bet on the wrong horse with the Volt as people will want highway cruisers like cheaper CNG cars. If this is right save NGLs and cellulosic ethanol for the minority of vehicles still using them in the future. That won't be as much as 20 mbpd.
I think the really big issue is that it is a stretch to classify NGL (mainly C2s, C3s, c4s, C5s, perhaps some C6+ ) as crude! They are obviously very different to a conventional crude such as Arab Light and of limited value for producing conventional refined fuels in existing facilities. They require either significant investments in GTLs or cars with a big trunk for the LPG cylinder and associated infrastructure.
I thought this peak oil stuff was about crude oil.
sot - some crudes have a significant intermediate fraction (c2 - c6), these are volitile oils. i havent seen a compositional analysis on ghawar, but i wouldnt be surprised if it has a significant fraction of intermediates.
The C1 to C5 content of a barrel of Arab Light is ~4wt%.
intermediate fraction (c2 -c6), by the reservoir engineering definition, refers to the composition of the reservoir fluid, not just the stock tank oil. we usually work with mole %, so i can't really relate to ~4 wt% c1 -c5.
the reason i suspect that ghawar may have a significant fraction of intermediate is based on the reported api gravity, gas/oil ratio and the reservoir temperature (~ 230 degrees F as far as i know).
One wonders if the reason the IEA showed NGLs as increasing is because they are not as often analyzed, so people don't know as much about them. Adding a lot of very-wet NGLs would almost have to imply adding a lot of oil as well, since the very-wet NGLs seem to come from natural gas "associated" with oil. The IEA is not showing much oil being added, and in fact, Tony Eriksen and Sam Foucher showed that oil production is likely to decline.
If oil production is declining, it would seem like the amount of associated natural gas would also be declining. (There could be a temporary burst of natural gas from the gas capon a well, but on average, the dryness of wells is likely to increase in the future as Rune has shown.) This effect would tend to also make natural gas dryer over time, making the expected trend in the ratio of NGLs to Natural Gas downward over time.
Natural gas is likely to be hit hard by the credit crisis, since there are many small companies producing natural gas, especially in the US. This is likely to be another factor holding down production of both Natural Gas and NGLs.
I want to thank Rune for a very fine analysis.
I have some basic questions about Natural Gas Liquids production. Can someone please answer these?
1. Are "natural gas liquids" (NGLs) the same as "liquified natural gas?" (LNG) The article implies they are different when it says that NGL condensates "are removed from" the natural gas. This suggests that the natural gas can still be sold on the market after the these condensates are removed and made into liquids.
2. If my understanding above is correct, then which is more profitable? To sell the natural gas alone, or to remove the condensates and sell both the natural gas and the removed liquids?
3. How much volume of NG is lost when the condensates are removed in the process of making NGLs?
4. What percentage of NG today is being processed to remove the condensates and make NGLs?
5. Questions 3 and 4 suggest my last question: Does producing NGLs reduce the amount of NG available on the market?
I know these are very basic questions, but if someome could answer them I would be very appreciative.
Thanks!
Emanuel
emanuel,
I will try to answer your questions;
NGL’s (Natural Gas Liquids) are extracted from the natural gas flow to meet transport (pipeline) and sales gas specifications. This is both to avoid liquid fall out (due to changes in pressure and temperature) and to ensure as good combustion as possible at the burner tip.
After NGLs are extracted (separated) the Nat Gas and the NGL’s are sold separately.
1) NGLs are ethane (C2), propane (C3), butanes (C4), pentane (C5) and perhaps come C6.
During standard atmospheric conditions ethane, propane and butane are gaseous and normally kept in liquid form under pressure.
LNG (Liquefied Natural Gas) is methane (C1) cooled down to approx. minus 163 centigrade for liquefaction and transport to the market.
2) This depends on your customer/market, but normally NGL’s are extracted and sold separately.
3) What you refer to is called “Shrinkage”, that is as NGLs are removed from the feed the total volume of Nat Gas is reduced at the outlet. The “shrinkage” is dependent of the composition of the feed, but roughly it takes 250 Scm (Standard cubic meters) of C2, C3, C4 in gaseous form to make 1 Scm of NGLs in liquid form.
To answer your question more directly you may normally expect to lose anything from 0 - 10 % of your volumetric gaseous feed during extraction.
4) Normally all Nat Gas is processed to extract liquid components. There are exceptions where a richer feed is mixed untreated with a leaner feed as long the resulting mixture meets transport and buyers specifications.
5) No, the extraction process does not reduce the total amount of Nat Gas made available to the market (except from fuel used in the extraction process). The extraction process just splits the components into gaseous (Nat Gas) and liquid (NGL) states.
I hope the above clarifies a little.
Yes. Thanks Rune. This answers all my questions.
Emanuel
I've got my own basic (maybe stupid?) question:
I know that at many fields, gas is still having to be flared - it is "stranded", with no cost-effective way to transport it to consumers. This is a tragedy, but I understand why it is done.
My question is: are producers at least separating out all of the NGLs prior to flaring? It would seem to me that even if some NG is stranded, NO NGLs should be - it shouldn't be that much harder to transport NGLs than it is to transport crude oil or any other liquid petroleum products.
If there are places where NGLs are still not being separated out prior to flaring, then this would suggest to me one of the few remaining opportunities to harvest some "low hanging fruit", and should be taken into account in these analyses. Is it?
WNC,
Good questions!
Upstream of the flare there is normally what is called a liquid “Knock Out”/flare “Knock Out” drum that takes out liquid components from the Nat Gas before flaring. This is to avoid “burning rain” from the flare.
To what extent these liquids are stored for later shipment and sale I don’t know. If the right infrastructure is available, like pipelines, this would certainly be handled at downstream extraction facilities.
To keep these NGLs in a liquid state it requires a pressurized vessel and for stranded gas specialised transport vehicles (ships, railway or road tanks) (where adequate pipelines are not readily available).
WNC -- Unfortunately even the NGL's are flared also at times. It's a function of facility access and costs. Last year I worked off the west coast of Africa and watched 20+ million cf of NG+NGL's flared from the platform. There was neither the room nor economics to allow separation. I don't know what the NGL yield was but it did produce a significant smoke cloud often from horizon to horizon. The operator had offered to lay a line and transport it ashore for free. But the dictator didn't want to spend the monies needed for a LDS to supply his impoverished people.
Yes...a very sad sight I viewed every day from my office window.
There is an article in this weeks MoneyWeek regarding 'Coal Bed Methane".
"Merrill Lynch estimates that there are 30 trillion cubic metres of methane -the equivalent of 1.35 billion barrels of oil -trapped in China's coal seams"
How does CBM fit in? Is it classed as an NGL?
Nick.
CBM (Coal Bed Methane) is to my best understanding pure methane (CH4) which is not classified as NGL.
Methane could be used as feed for LNG (Liquefied Natural Gas) or for GTL (Gas To Liquids; Fischer-Tropsch) process. In Fischer-Tropsch the output is 60 – 70 % of what is fed into the process.
This problem is baffling as liquid fuels are both a natural byproduct and a possible converted form of natural gas production. The desired liquid/gas mix is determined by user preferences which may change rapidly due to price and other factors.
If liquids injected gas trucks and cars like this one are the way of the future that would suggest an optimum supply ratio of liquids to gas. I tip such cars to outsell plug-in hybrids. On a weight or energy basis the ratio could be say 1:8. Thus to replicate today's happy motoring that might be 10 mbpd of liquids and 80 mbpd equivalent of gas.
Whether that is physically possible I'm not sure, even including coal seam methane with NG. It might require more liquids GTL, NGL and ethanol once oil based fuels are critically low. Industrial demand for piped NG and shipped LNG may deny supplies to the transport sector. Then again we have to get around. The only thing that seems right is the Pickens line that we should not be burning NG in power stations.
This post and comments remind me why I visit TOD almost every day.
Thank-you, Rune.
The more critiques I read of the IEA WEO 2008 the more I'm inclined to disregard it as a political document first and foremost.
It is sort of a strange coincidence that the errors seem to be all in one direction.
I have been very impressed with the analysis on the IEAs World Energy Outlook 2008. It confirms my suspicions that we are more than likely to face a near term peak in global oil production, if it is not already passed.
I have two comments I would like to make:
1. It would be a great idea, when all of the individual analysis pieces have been completed if a summary could be put together. For people like me and others on this site who read TOD daily, it is easy to develop a good understanding about the WEO2008. However I think it is important that we communicate the weaknesses in the WEO2008 to audience's who have limited understanding of peak oil and a list of a dozen or so articles does not really do that. The summary probably needs to be written in non technical (as possible) terms.
2. The IEA states that significant investment is required to meet oil demand out to 2030, yet the current level of investment is significantly less than required. A post on what current investment levels would mean to future oil production would be great.
Cheers
Cameron Leckie
Rune
Does your data show how the ratios: NGL/Crude, NG/Crude and NGL/NG vary as a function of oil field API? My gut feeling is as API decreases, so will NGL and NG solubility. If this is the case, then one would expect NGL production to decline over time rather than increase as future crude is expected to be heavier and have a lower API and it would also cast further doubt on the IEA's optimistic forecast. One could also make projections for future NGP production, based on the Oil Megaproject database and field API.
Pragmatic,
Presently I have not developed the ratios of NGL/Crude, Nat Gas/Crude (which is possible for those countries with good quality data).
NGLs and most of the condensates are associated with nat gas. There are several fields that reports Nat Gas, Condensate and/or NGL production and no (zero) Crude Oil why a NGL/Crude oil ratio would be a poor indicator for future developments in NGL extraction.
Looking at the numbers for the NGL/Crude ratio for some countries (Algeria, Norway and Saudi Arabia) shows that this ratio bounces around with time. This suggests that they are poor parameters to use for predicting future trends for both Crude Oil and NGL production..
NGL/Nat gas (NGL including condensates) is presented in the post. For Saudi Arabia EIA does not list condensates and IIRC Aramco includes condensates with NGL’s (or NGLP’s).
As API decreases (which it clearly will with time) I would also tend to expect a volumetric decline in NGLs for this reason, however there are few fields where all these data are readily available which could enable the development of such documentation.
to add rune's comments:
gas oil ratio or it's inverse, yield is mainly a function of composition of the reservoir fluid and reservoir temperature and to a lesser extent, the separation process.
a "black oil" (by definition) consists of a heavy liquid phase ,c7+, and primarily methane gas with a minor intermediate, c2 -c6, fraction.
a volitile oil has a significant intermediate fraction.
wrt black oil, there is a general correlation between api and gor related mainly to the permeability or lack of permeability of the cap rock. and there is an upper limit to how many gas molecules can fit between the larger liquid oil molecules, and if there is an excess of gas molecules, there will be a primary gas cap. but an infinite number of combinations can exist. and dont forget reservoir temperature is a factor also.
reservoir management is also important, because an oil reservoir operated below the bubble point will see an increasing gor. a black oil reservoir will see a maximum gor which will eventually decrease, if the pressure can be depleted to a low enough level. and with a volitile oil, a maximum gor may never be reached, i.e. the oil reservoir turns into a gas reservoir.
as wells are drilled deeper, we will probably see an increase in gas reservoirs and volitile oil reservoir. that will offset to some extent, the trend toward heavier oils.
and if i were to choose between ethanol will save us or ngl will save us, i would pick the latter.
Figure 8 is absurd. It is predicting a clean exponential increase in gas production from OPEC. They really should put the crack pipe down. The part of the figure based on observations is already showing a tendency towards a peak in the near future. Saudi Arabia does not have a gas Ghawar in mothballs waiting to be developed. Qatar and Iran will not be able to crank out a trillion cubic meters of gas per year. The country with the biggest natural gas reserves, Russia, cannot produce more than 600 billion cubic meters per year. Iran and Qatar combined have about 20% more reserves than Russia and reserves do not stay constant once production increases.
Figure 8 replicates the projections for the reference scenario from IEA WEO 2008.
The reason why I chose to represent it with a diagram was that the readers themselves could judge about the likelihood of the projections.
The diagram above has been lifted out of IEA WEO 2008, figure 11.14, showing IEA WEO 2008 projections on change in oil, NGL (Natural Gas Liquids) and Non conventional production by country for the period 2007 to 2030.
Note that for Saudi Arabia IEA WEO 2008 expects an increase in the NGLs production from Saudi Arabia with roughly 3 Mb/d, that is an increase of 200 % from present levels, and as you state;" Saudi Arabia does not have a gas Ghawar in mothballs waiting to be developed."
Present data suggests a larger decline in Norwegian NGL production, and I don’t know what to believe about the IEA projection on growth in NGL production from Nigeria, just to name a few.
That figure says that Saudi Arabia will have more NGL production in 2030 than Iran and Qatar combined. I guess the IEA is assuming there will be lots of gas to be found in Saudi Arabia between now and then. Based on what? I am under the impression that the gas reserve potential of Saudi Arabia has been constrained and it will never outclass Iran and Qatar. As noted by a poster above this report is nothing but political fluff.
I can't understand even that figure of 10.5 mb/d in 2007.
The EIA has in its file t13.xls
Table 1.3 World Natural Gas Plant Liquids Production, 1997-Present
a figure of around 8 mb/d
Do IEA and EIA have different definitions of NGL?
IEA’s definition of NGLs
EIA reports 8,04 Mb/d of NGLs (NGLPs) as of 2008YTD. OPEC has now approximately 40 % of the Worlds reported NGLs production.
EIA further reported 1,47 Mb/d of condensates for OPEC.
From the above IEA totals NGLs and condensates.
EIA have separate reporting on NGLs and condensates.