| The IEA WEO 2008: Will coal usage be phased out? | The Oil Drum: Europe | IEA WEO 2008 - NGLs to the Rescue? |
IEA WEO 2008 - Fossil Fuel Ultimates and CO2 Emissions Scenarios
Posted by Luis de Sousa on December 2, 2008 - 10:25am in The Oil Drum: Europe
Report authors: Luís de Sousa and Euan Mearns
Part 3 of IEA WEO 2008 analyzes the expected impact of fossil fuel combustion upon climate change.
Page 382: As emissions of greenhouse gases build up in the atmosphere faster than natural processes can remove them, their concentrations rise. The Reference Scenario puts us on a path to doubling the aggregate concentration in CO2 equivalent terms by the end of this century, entailing an eventual global average temperature increase up to 6 ºC.
Rather surprisingly, IEA WEO 2008 does not provide any data on fossil fuel reserves and production forecasts to 2100 to back up this claim. Instead, it chooses to rely upon fossil fuel reserve figures underlying the Intergovernmental Panel on Climate Change (IPCC) models. Furthermore, using MAGICC (climate temperature model), and the default climate sensitivity constants, we are unable to reproduce the outcome of as much as a 6 ºC increase.
Using a CO2 emissions scenario based on our 2008 Olduvai Assessment combined with MAGICC, we estimate that global average temperatures may peak at around 1.6ºC above 1990 values toward the end of this century. Other climate models may produce temperature outcomes higher or lower than this.
CO2 emissions from Energy in the overall emissions panorama
Part 3 of the IEA WEO 2008 report starts by characterizing the expected increase in CO2 emissions from energy usage from now until 2030. This is apparently done based on demand forecasts, without any adjustment for fossil fuel reserves and/or production constraints. CO2 emissions from energy usage are thus projected to grow from 28 Gt in 2006 to 41 Gt in 2030-–an increase of 45%. The outlook for the complete greenhouse emissions scenario is given as follows (page 381):
World greenhouse-gas emissions, including non-energy CO2 and all other gases, are projected to grow from 44 Gt CO2-equivalent in 2005 to 60 Gt CO2-eq in 2030, an increase of 35% over 2005. The share of energy related CO2 emissions in total greenhouse-gas emissions increases from 61% in 2005 to 68% in 2030.
The growth in energy related emissions is projected to come mainly from outside the OECD, with coal accounting for the bulk of the growth. CO2 emissions from energy usage in the OECD are projected to remain flat until 2030. Worldwide CO2 emissions per capita are forecast to grow, with the non-OECD countries increasing toward OECD levels.
Non-energy related emissions are expected to increase more slowly than those related to energy usage. Industry and land-use represent the lion's share of these emissions, with gas flaring and cement production the next in importance. In the period to 2030, non-energy related emissions are forecast to grow mainly because of methane from wastewater, ruminants, coal mines and leaking pipelines.
Long-term CO2 emission scenarios
After a characterization of CO2 emissions by sector, the report goes on to forecast long term overall emissions of greenhouse gases and their impact on climate, something included for the first time in the report. To forecast long term overall emissions, the IEA used the latest version of MAGICC to model the carbon cycle until 2100. The atmospheric concentration of greenhouse gases is expressed in two ways: CO2 in parts per million (ppm) and total gases in ppm of CO2-equivalent. Today's concentrations are given as 385 ppm for CO2 and 445 ppm CO2-eq.
The report describes the emissions Reference Scenario on page 401:
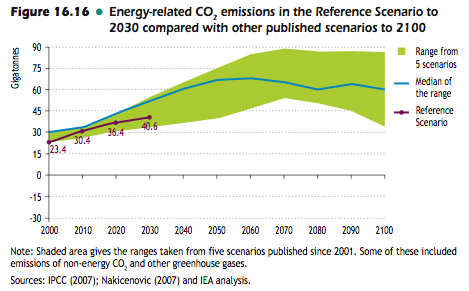
Our projected increase in energy-related CO2 emissions to 2030 lies in the middle of the range of CO2-equivalent emissions scenarios that have been modelled, assuming an absence of new climate policies (IPCC, 2007), with respect to both emissions and concentrations (Figure 16.16). Most of these scenarios project emissions to continue to rise during this century. The projected CO2 emissions are also consistent with model outputs of concentrations from MAGICC (Version 5.3). Atmospheric CO2 concentrations by around the end of next century are in line with the 660 to 790 ppm CO2 (855 to 1 130 ppm CO2-eq) ranges assessed from the five scenarios considered (IPCC, 2007). This leads to a temperature rise above pre-industrial levels of about 6ºC.
The fossil fuel consumption underlying the emissions reference scenario is not provided either graphically or numerically; the only projections presented are those shown in Figure 16.16. This shows the IEA reference case scenario to 2030 and the IPCC (2007) scenarios range. One might expect that the International Energy Agency would have provided the IPCC an energy scenario to work with. Instead, very surprisingly, the reverse has happened. The IPCC, a body that has little expertise in energy matters, has selected energy scenarios to use in its models, and the IEA has accepted without question the scenarios used by the IPCC.
The IEA Ultimate Recoverable Reserves
The emissions range presented (Figure 16.16) has been converted into annual fossil fuel consumption figures and is compared in Figure 1 with the data gathered for the Olduvai Assessment presented on The Oil Drum in February 2008.
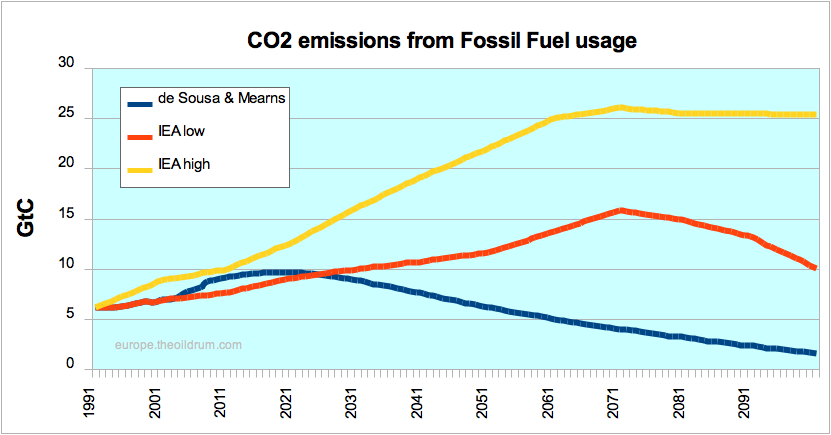
Figure 1 – Carbon emissions from energy consumption (expressed as giga tonnes carbon). The blue line in all charts is de Sousa and Mearns' 2008 Olduvai Assessment.
The energy scenarios range used by the IPCC and copied by the IEA are represented here as a low case and a high case, corresponding to the boundaries of the range. While the Olduvai scenario remains within the range up to 2025, it afterwards evolves below the IPCC / IEA's forecasts. The low case scenario peaks by 2070. At that time, the cumulative fossil fuel production is 1200 Gtoe; it surpasses 1600 Gtoe by 2100. The high case scenario enters a plateau that implies yearly fossil fuels production of 30 Gtoe (triple of today) with cumulative production exceeding 2600 Gtoe by 2100.
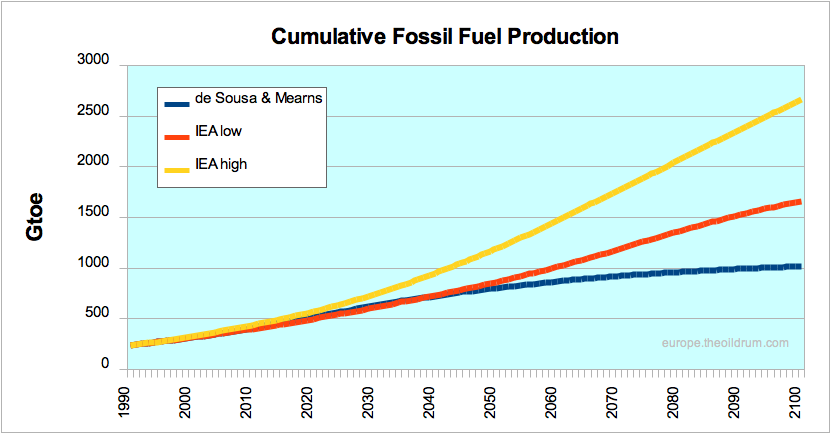
Figure 2 – Cumulative fossil fuel production associated with various CO2 estimates.
The ultimate recoverable reserves (URR) used for these scenarios can be calculated to be around 2400 Gtoe for the low case (considering a mid-point of depletion at the peak in 2070) and at least 4400 Gtoe for the high case (considering immediate decline after 2100). These numbers are higher than fossil fuel reserve assessments based on geological data, dwarfing for instance those presented in the Olduvai assessment (1050 Gtoe) or those published by BP in its annual Statistical Review of World Energy.

Figure 3 – Ultimate Recoverable Reserves from the IEA's scenarios compared with other estimates. Note that the IEA estimates are based upon the CO2 emissions scenarios of the IPCC.
In 2001, Jean Laherrère delivered a report at a conference of International Institute for Applied Systems Analysis calling for a serious review of oil reserves by climate modellers working for the IPCC. So far, that call has been left unanswered. Last year Professor Kjell Aleklett wrote an article, once more stressing that the fossil fuel reserve estimates used by the IPCC are not realistic, even when compared with the industry's numbers.
Impacts on climate
MAGICC was used to assess the expected temperature increase arising from the production of fossil fuels at the rates identified in the Olduvai Assessment. The program was run with the default climate sensitivity parameters. Non-energy related emissions were based on Tom Wigley's latest WRE profiles (kindly provided by Professor David Rutledge). Two other runs were performed, one for each of the energy emissions' boundary scenarios presented by the IPCC /IEA. The results are presented in Table 1.
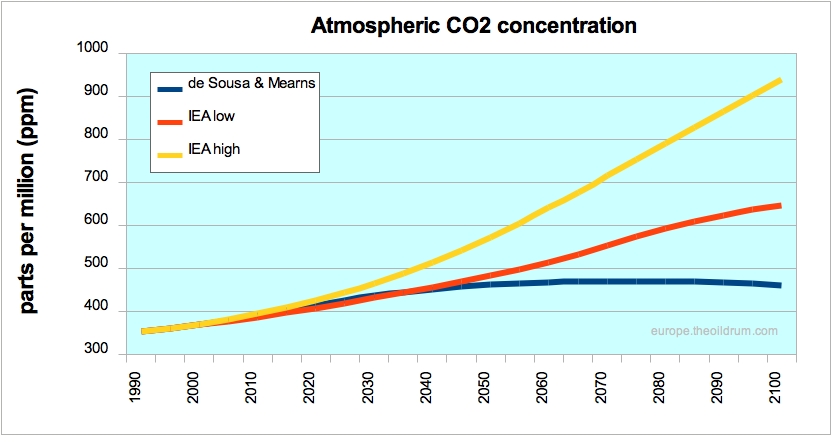
Table 1 – Atmospheric CO2 concentrations and temperature increases by 2100 for each scenario according to MAGICC.
| CO2 (ppm) | Temp. (ºC) | |
| de Sousa & Mearns | (*) 460 | 1.6 |
| IEA low | 645 | 2.5 |
| IEA high | 940 | 3.5 |
| (*) after peaking at 470 ppm by 2075. | ||
Using geology-based fossil fuel resource data, the atmospheric concentration of CO2 peaks before the end of the century, while both of the IPCC/IEA scenarios show concentrations still increasing until 2100. The range resulting from the IPCC/ IEA's boundaries is relativity large and matches the 700 ppm figure pointed out at the opening of Chapter 16.
Figure 4 – Atmospheric CO2 concentrations throughout the 21st century for the emissions scenarios in Figure 1, as calculated by MAGICC 5.3.
As for temperatures, the picture is not as clear. The output of MAGICC 5.3 indicates an increase of 2.5 ºC to 3.5 ºC over 1990 levels by 2100, quite far from the 6 ºC indicated in the WEO 2008 report. Using the data from the Olduvai assessment, temperatures stabilize at 1.6 ºC above 1990 levels after 2085.
| Note that in order to compare the fossil fuel emissions scenario of the Olduvai Assessment with those presented by the IEA, we have used the default sensitivity constants used in MAGICC. This does not mean that we agree with these constants. It should also be noted that modeling global average temperature change based on variations in CO2 is imprecise and that a number of different climate models exist that produce different results. MAGICC has been used by the IPCC in its reports and tends to produce results towards the mid of this range. |

Figure 5 – Temperatures increases during the 21st century for the emissions scenarios in Figure 1, as calculated by MAGICC 5.3.
How does the discrepancy arise between the IEA projected temperature described in the report and the indications reported here using their data and the MAGICC simulation? Given that the CO2 concentrations in the report and the simulation seem to match, we can propose two hypotheses:
- The 6 ºC refers to a later date, in a simulation where large amounts of fossil fuels continue to be available unconstrained throughout the 22nd century and maybe beyond;
- The climate sensitivity parameters used by the IEA were different from those used by default in MAGGIC.
MAGGIC incorporates a logarithmic temperature response function to CO2 concentrations. With this function, each doubling of CO2 increases temperature by a fixed amount. This amount is by default 2.6 ºC, taken from the IPCC's Third Assessment Report. Because of this relationship, in order to increase temperatures 2.6 ºC above pre-industrial levels atmospheric CO2, concentrations have to reach circa 560 ppm; for an increase of 6 ºC, close to 1500 ppm are needed.
Figure 17.3 on page 414 shows a CO2 concentration graph that extends to 2200. It shows stabilization of CO2 around 775 ppm for the reference scenario after 2175. In order for this scenario to produce an increase of 6 ºC, the climate sensitivity parameter used must have been around 4.1 ºC per doubling of CO2. Were that the case, the CO2 concentration increase of 70 ppm during the 20th century would have resulted in a temperature increase of 1.3 ºC, almost double that observed so far.

The Policy Scenarios
In Chapter 17, the report lays down two policy scenarios intended to reduce the long term atmospheric CO2 concentrations resulting from the emissions projected by the Reference Scenario. The objectives of such scenarios are explained in page 410:
There is no international consensus as yet on a long-term stabilization or emissions objective, or on the emissions trajectory to its attainment. Nonetheless, international discussions are increasingly centred on a stabilization level that ranges between 450 and 550 CO2-eq. According to the IPCC's Fourth Assessment Report, stabilization at 450 pp CO2-eq corresponds to a 50% chance of restriciting the increase in global average temperature to around 2 ºC, while stabilization at 550 ppm yields a rise of around 3 ºC (compared with 1 000 ppm and up to 6 ºC in the Reference Scenario). This Outlook analyses the implications for the energy sector of international and national policy action to achieve these stabilisation levels in a 450 Policy Scenario and a 550 Policy Scenario.
Again, these relations between projected temperature and CO2 allude to a climate sensitivity parameter much higher than what the IPCC used in its assessment reports and that used as default in MAGICC.
The report goes on to consider the “transformation” the energy sector should undergo to support such scenarios. More efficient energy sources usually take long periods of time to enter the market, because the sector has a slow rate of capital replacement. This is especially the case in the electricity sector, where fossil fuel power plants require large upfront investments. Policies to reduce CO2 emissions would result in costly early retirement of infrastructure.
Page 414 notes that these two scenarios would require global participation, including both OECD and non-OECD countries. This is justified by the expected energy consumption growth outside the OECD, especially in Asia. Energy related emissions from non-OECD countries already surpass those from within the OECD, making any policy scenario without global participation pointless.
In the 550 Policy Scenario, emissions are required to level out around 2020 and start declining after 2030. The 450 Policy Scenario requires an immediate and sharp decline in emissions after 2020. In the later scenario, CO2 concentrations are actually allowed to temporarily surpass the 450 ppm target, stabilizing at that level only in the 22nd century. According to the IEA, any scenario preventing concentrations from reaching those levels is unlikely, because the infrastructure needed to comply with it couldn't be deployed in time.
As in the previous chapter, the energy related CO2 emissions underlying the Policy Scenarios are not made available beyond 2030, and once again the IEA report uses the energy scenario ranges from the IPCC instead (figure 17.4 from page 415). The following figures compare these scenarios with the data assessed for the Olduvai Assessment.
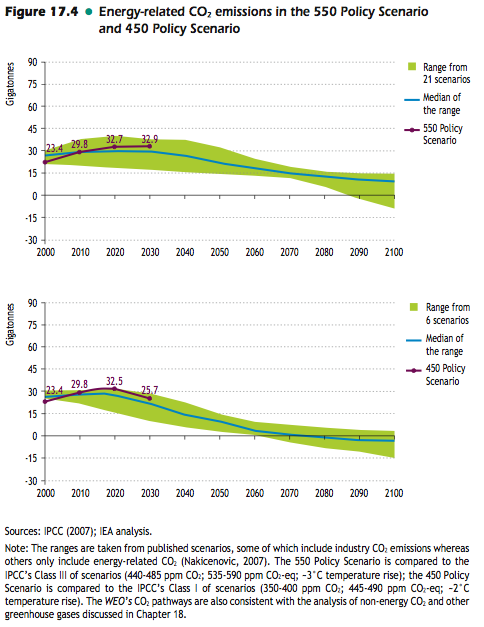
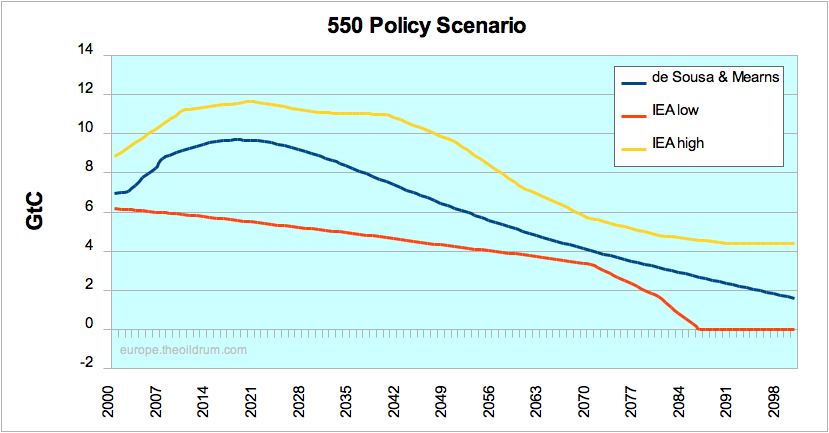
Figure 6 – The IEA's 550 Policy Scenario compared with the emissions based on the Olduvai Assessment. Click for large version.
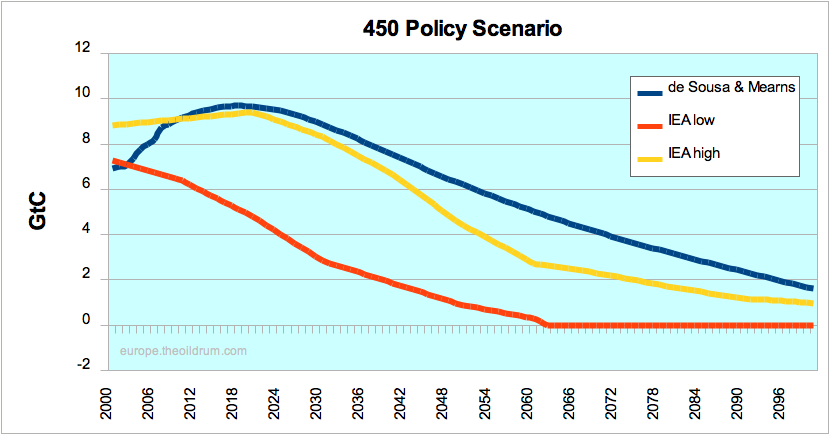
Figure 7 – The IEA's 450 Policy Scenario compared with the emissions based on the Olduvai Assessment. Click for large version.
It is interesting to note how the Olduvai scenario falls right in the middle of the 550 Policy Scenario range, with emissions going into decline visibly earlier than the high boundary curve. Comparing to the 450 Policy Scenario range, the Olduvai curve stays close to the high range up to 2030, diverging afterwards. But these graphs which extend only to 2100 do not show the complete picture. By end of the 22nd century, with the data used in the Olduvai assessment, CO2 concentrations (from all emitting sources) decline to 410 ppm, which is actually below what the report depicts in Figure 17.3 (page 414).
The main difference between the IEA 450 Policy Scenario and what should be expected from the unconstrained use of fossil fuels reserves in the Olduvai Assessment is the length of time CO2 concentrations stay above 450 ppm. Earlier work on The Oil Drum indicates that different patterns in coal reduction can be obtained by differing energy policies. (See end notes). Since coal is the fossil fuel farthest away from production decline, an approach of this type may help keep CO2 within desired parameters.
Conclusions
The IEA presents a scenario for future fossil fuel use, based on doubtful reserves and production estimates that are significantly higher than the figures both the energy industry and independent researchers have assessed. This cheerful view of Man's energy future is never set forth by the IEA in clear numbers or graphs. Instead, it is hidden behind scenarios provided by a third party (the IPCC) whose object of study is not energy.
Throughout these chapters, the IEA refers to potential climate impacts that imply a CO2 sensitivity parameter that is higher than that assessed by the IPCC and used by default in the temperature modelling software used. Such high sensitivity is incompatible with the empirical relationship between global temperatures and CO2 concentrations in recent decades.
These inconsistencies undermine much, if not all, the recommendations implicit in the 450 and 550 ppm policy scenarios. Our 2008 Olduvai Assessment suggests that CO2 emissions will fall this century with the exhaustion of fossil fuel reserves. This alone will provide the desired outcomes of the 450 and 550 ppm scenarios, without burdening the OECD and non-OECD countries with artificial constraints on their energy use.
The fossil fuel reserves and production estimates underlying our Olduvai Assessment are those produced in good faith by third parties (Samuel Foucher, Jean Laherrere, the Energy Watch Group and David Rutledge). We would be the first to agree that there are significant uncertainties in these data, and that these alone should not be used uncritically to plan the future energy supplies and CO2 emissions of mankind. The IEA should provide to us - their OECD clients - with their verifiable data on earth's oil, natural gas and coal reserves so that mankind's energy future and environmental impact can be properly modeled and forecast. WEO 2008 falls well short of this basic requirement, choosing instead to recycle dubious fossil fuel reserve estimates, and to draw similarly dubious conclusions about climate change from these, when their focus should be firmly fixed upon energy decline and growing energy poverty within the OECD.
Acknowledgement
The authors would like to thank Professor David Rutledge, California Institute of Technology, for data and advice provided during the preparation of this report.
Previous work at TheOilDrum
The Coal Question and Climate Change
Implications of "Peak Oil" for Atmospheric CO2 and Climate
Appendix
The files used to run the MAGICC simulations can be downloaded from the following links:
To be used by MAGICC the files' extension have to be changed to “.gas”.
Personnel
Editors
Contributors
Peak Oil Primers
Archives
- November 2010 (3)
- October 2010 (6)
- September 2010 (4)
- August 2010 (7)
- July 2010 (6)
- June 2010 (7)
- May 2010 (2)
- April 2010 (8)
- March 2010 (4)
- February 2010 (6)
- January 2010 (3)
- December 2009 (5)
- November 2009 (8)
- October 2009 (12)
- September 2009 (6)
- August 2009 (5)
- July 2009 (11)
- June 2009 (8)
- May 2009 (16)
- April 2009 (10)
- March 2009 (7)
- February 2009 (10)
- January 2009 (15)
- December 2008 (9)
- November 2008 (9)
- October 2008 (9)
- September 2008 (13)
- August 2008 (10)
- July 2008 (14)
- June 2008 (23)
- May 2008 (16)
- April 2008 (12)
- March 2008 (16)
- February 2008 (9)
- January 2008 (13)
- December 2007 (13)
- November 2007 (16)
- October 2007 (22)
- September 2007 (8)
- August 2007 (9)
- July 2007 (16)
- June 2007 (8)
- May 2007 (7)
- April 2007 (7)
- March 2007 (10)
- February 2007 (10)
- January 2007 (12)
- December 2006 (9)
- November 2006 (15)
- October 2006 (4)
- September 2006 (5)
- August 2006 (5)
- July 2006 (9)
- June 2006 (5)
- May 2006 (10)
- April 2006 (9)
- March 2006 (13)
Vital Trivia
License

This work is licensed under a Creative Commons Attribution-Share Alike 3.0 United States License.
Regarding the temperature sensitivity of MAGICC, the crux of the issue is whether warming will trigger any significant feedback mechanisms.
I'm not a climate scientist, but I do follow climate change science, and it looks like feedback mechanisms are going to be both important and positive. That's very, very bad news.
Since we can't correct any mistakes once we've spewed the CO2 into the atmosphere, I would argue the MAGICC sensitivity should be taken as a lower bound on how much warming the earth will experience for a given emission scenario.
Even the case you cite here, with 1.6 degrees of warming, looks very dangerous to my eyes.
Hi
The climate sensitivity actually takens into account the feedbacks. However, as the authors say, in the conclusion: "because it is incomaptible with the observations the last decades", is to interpret a bit too much confidence in the instrumental record. Because:
The climate sensitivity is the response of a change, to when the earth is again at equilibrium. This takes centuries. Thus we only have data from temperature from the last 100 years, and no excellent record of the driving forces, more than say the last 20-40 years. Thus we are not sure of how these drivers have forced the climate, and where it will land later on.
IPCC actually says: likely to be in the range 2 to 4.5 °C with a best estimate of about 3°C. For doubling of CO2 equivalent.
I want to point out that the authors scenario (Olduvai) correspond very well to the "low" scenario, all the way to 2050. That is very good, no big deal to discuss. After 2050, in my opinion, all predictions are guesses, and kind of philosophical discussions.
Say if we put 2 ppm CO2 per year until 2050, then we will be at 450 ppm = 1,7 more = about 1 ° warmer
than today. We will see what happens.
All the best.
Which feedbacks does it take into account, exactly? As I understand it, the IPCC only included "fast feedbacks," but since it's recent publication (and even before to some) it has become clear that so called "slow feedbacks" are not all that slow and will play a major roll.
You need to address the major voice on climate change in America, James Hansen, who has been saying that the target must be 350 ppm or less. This is backed up by the careful work over at www.carbonequity.info who give a range from 300-350 as the target. It was after we got into this range that the Arctic ice cap started on its path toward total disappearance, something that the IPCC report didn't consider likely till very late in this century, but which now seems inevitable in the next few years. Humans evolved on a planet where concentrations ranged from about 200-300. Going much beyond that seems unwise at best.
Beyond the albedo (loss of reflectivity from snow and ice) that seems to be a major feedback driving the current rapid rise in Arctic temperatures, the melting of the tundra and now apparently of methane hydrates frozen on the ocean floor represents a huge new feedback currently underway--new vast sources of powerful greenhouse gases (in the near term, methane is over a hundred times more powerful than CO2 as a ghg) now being unleashed in a process we may not be able to stop.
We need to right now do everything we can to reduce the one forcing we do still have some ability to control--CO2 emissions--before these and other powerful feedbacks kick in and drive the planet to a much hotter and less hospitable climate. Waiting around for PO to do the work for us strikes me as the height of irresponsibility.
Targets in the range of 450 to 550 are more the result of political and economic considerations than conclusions drawn purely from looking at the science.
Remember that about half the CO2 we've emitted has been absorbed by the oceans, acidifying them in the process and disrupting basic systems that sustain life in the oceans and on earth (and that sequester CO2). The oceans may be reaching saturation point, at which they start becoming net contributors rather than sinks. That is why recently scientists have been saying that our emissions will continue to overheat the planet for tens of thousands of years, at least.
Also remember that about two degrees of warming are being blocked by the aerosols from coal plants, aerosols that drop out of the atmosphere within days. When we shut down these dirty coal plants, as we must eventually, the planet is going to suddenly warm by two degrees. In other words, we are already past your projections.
I will look further at your links about coal and GW, but this dirty ff still seems to me and others to pose a particularly powerful threat even (especially?) in a post-PO world. I do think that it may be because he has read the stats on peak oil that Hansen has been focused mostly on minimizing coal use as a central strategy to bring down CO2 emissions.
And of course as others have pointed out, even if we were to accept your contention that there are low probabilities that temperatures will increase beyond two degrees with concentrations topping out at 450 ppm, low odds are not much comfort when the stakes are this high. Russian Roulette is a game that most non-suicidal people would not care to play, whether the odds are one in six or one in a hundred. And this is playing RR with the viability of the only viable planet we know.
Hi dohboi. Could you elaborate more on your comment above? Sounds like a huge dilemma. Leave them online and increase CO2 over the long term. Or shut them down with immediate consequences. No winners here by the sound of it.
Sorry to be so long in responding. There has been some discussion of this over at realclimate and in books like George Monbiot's _Heat_. I'll see if I can dig up some article-length sources on this for you (but others should please feel free to do so, too).
Yes, it is scary. It is the kind of thing that is driving otherwise sober minds to think about strategies that look like global engineering--artificially injecting aerosols into the upper atmosphere (continually) while we close down coal plants....
Moral hazard and other human and non-human unintended consequences are great concerns with any such approach, of course.
Excellent post Dohboi!
"Targets in the range of 450 to 550 are more the result of political and economic considerations than conclusions drawn purely from looking at the science."
That's it in a nutshell. If you listen to those opposed to the idea of CO2 emissions being reduced or elminated, they will conjure up every conceivable notion to dissuade people from believing there is even enough CO2 in the remaining fossil fuels reserves to have any impact beyond a slight warming effect, when in fact the CO2 emitted to date may have already initiated a runaway global warming effect.
It takes 30-40 years for increases in atmospheric temp. to penetrate the oceans, so there is a lag, called thermal inertia. So even though the Arctic is melting far faster than predictions, methane is releasing from the arctic ocean, Siberian tundra is thawing releasing more methane, and acidification of the oceans is accelerating 10 times faster than originally projected, we are all suppose to feel completely at ease spewing as much CO2 as we'd like with negligable projected repercussions.
I met someone that had been in the Air Force, and he tried to convince me that people have a much greater ability to absorb radiation than is generally understood. He made the stuff seem like silly putty, an inert almost meaningless substance. But then I thought about it later and realized that while serving his country he was probably exposed to high levels of radiation and was told those lies to put him at ease.
There's an old saying, consider the source. Always be vigilant to reject a source if it in any way benefits from such proclamations.
Its like Al Gore said, "95% of peer group papers within the science community are in agreement on global warming. It is only non-peer group papers that are evenly split on the topic."
Why don't you take those concerns to those responsible for MAGICC?
Luis,
You cannot use a tool while being fully aware of its limits then claim it's all the tool's fault if you screw up. I.e., your conclusions are made as declarative, unequivocal statements. If you had doubt, you needed to address that, and not just in your disclaimer that is not actually a disclaimer. (See my post below.)
Cheers
So far I haven't emitted any opinion on MAGICC.
Your vernacular is unnecessary.
Luis,
You used it. You made definitive conclusions based upon it. You have made a de facto statement of opinion about it: It suffices for your needs.
If your sole purpose was to compare your findings in Olduvai vs. the IEA WEO, then what the heck was the point? "Here are two studies, both wide of the mark - by a lot - but let's critique those idiots over there!" Is that supposed to make sense to your readers? A mental exercise just for the heck of it? No. It would be analogous to writing a paper on whether the Edsel or the Torpedo was the bigger failure: irrelevant, and who cares?
You excuse your use of MAGICC as needing to use the equivalent of what the IPCC and IEA relied on. OK. Understandable. You want a fair comparison. But that did not require you to accept the program's assumptions. If anything, exploring them would have strengthened your argument as you could have quite fairly done as I have and shown that the assumptions and data they used rendered their analysis nearly useless (as science. As public relations, it did its job). Then you could have, as I have with your presentation, dismissed it outright. Then you could have produced a better analysis not hobbled by bad data and poor assumptions. That would have only highlighted how poor their report was.
What you have done instead is repeat their errors, then compound them with even more egregious errors. They, at least, don't dismiss reality. When you and Euan say 1.6C by centuries end you turn the entire discussion into a joke. Again: That much warming is already going to happen just with the carbon that is already in the system.
So, in the end, you were bound to the MAGICC and its assumptions because to update them would have left you with no axe to grind with the IEA on the climate angle because you would have reached the same conclusions. Couldn't have that, now, eh?
You two should have limited yourselves to the energy issues. Might have been a fine paper.
Cheers
Well said zeroworker. We're taking a mighty big risk with the only atmosphere we've got.
That said, the IEA data and processes should be more transparent. It shouldn't be hard to repeat their experiment and get the same result.
The other point on which I agree with Luis is that the IEA should be looking at production scenarios well beyond 2030. 20 odd years is not long when you're deciding what infrastructure to start building.
Large scale infrastructure which we conceive of today, might be agreed on in five years, designed in another five, take ten years to build and last for fifty years. If the International Energy Agency is not going to prepare oil production scenarios for more than 20 years ahead, who will?
Yes, 1.6 is getting dangerously close to the 2 degree 'tipping point' touted by many in the Climate Science field. A key component of the Feedbacks is just how the Tundra reacts to warming conditions ie does it thaw dry or wet.
Note that the 2 degree tipping point is measured from 1900, not from the higher 1990 reading.
You are refering to which page of the report?
I was referring to the previous comment.
By default MAGICC runs with the Carbon Cycle Feedbacks parameter turned on. Where's the content of the Help file on this:
Kudos to Luis and Euan for a factual, well-researched article. In terms of the feedbacks associated with Abrupt Climate Change (ACC), such as the "Clathrate Gun" feedback, it doesn't appear that MAGICC covers these feedbacks . Some findings indicate an additional 1.5C - 2.5C warming from clathrate methane emissions alone.
The climatic response to a massive methane release from gas hydrates: Numerical experiments with a coupled climate model
- Hans Renssen, Kay Beets, Dick Kroon, Earth and Life Sciences, Vrije Universiteit Amsterdam, The Netherlands
- Thierry Fichefet, Hugues Goosse, Institut d'Astronomie et de Géophysique G. Lemaitre, Belgium
And to our chagrin, it appears the "Gun" is going off.
Other reading;
Global inventory of methane clathrate: sensitivity to changes in the deep ocean
- Bruce Buffett, David Archer, Department of Geophysical Sciences, The University of Chicago
Methane Climate Forcing and Methane Release in the Siberian Fresh-Water Systems and Marine Ecosystems
- Shakhova, N.; Semiletov, I.; Romanovsky, V., American Geophysical Union, abstract #B13C-0246
Indeed, and in addition, very recent research has found that the permafrost carbon store is much larger than previously thought, on the order of twice the total atmospheric store (> 1 teraton).
Global warming time bomb trapped in Arctic soil: study
Vulberability of permafrost carbon to climate change: implications for the global carbon cycle
Very interesting analysis Luis & Euan.
I was wondering about this bit: "Were that the case, the CO2 concentration increase of 70 ppm during the 20th century would have resulted in a temperature increase of 1.3 ºC, almost double that observed so far."
If we are talking about feedbacks, this is not much more then an indicator is it for what is going to happen in the future? I.E. CO2 could have a vastly different effect on temperature as more CO2 is accumulated in the atmosphere as in the pas decades?
The effect of atmospheric CO2 on temperature is logaritmic. Hence the need of a doubling of concentrations for a linear rise in temperatures. I.e. if x is the temperature rise per doubling of CO2 concentrations and t0 the temperature in 1990, we would need about 700 ppm to reach t0 + x; but to reach t0 + 2x then 1400 ppm are needed.
I don't see how this answers Rembrandt's question. The "logaritmic" effect of atmospheric CO2 is the effect without feedbacks. Maybe I'm missing something?
Check this comment.
Thanks. I did see that, but I'm afraid I don't see it as very illuminating either. It sounds like basically you're saying that feedbacks are hard to model (which they certainly are) and that in your scenario you are minimizing their impact.
You still haven't distinguished the various feedbacks or even major categories of feedbacks (fast, slow...), nor explained why or how you have included or excluded each.
Don't get me wrong. I realize they are complicated and that you are by no means alone in dealing with this uncertainty by minimizing it. And it is certainly very important to base models on realistic expectations as far as ff production goes.
But feedbacks are already kicking in--especially albedo in the Arctic and now methane release from the tundra and from seabed clathrates--and they are playing havoc with models accepted just last year in the IPCC report. It long past time to include a full range of feedbacks in models at least to know what the range of uncertainty might be. Is it because these uncertainties aren't very comforting?
I think those questions should be directed to MAGICC's programmers and not to me.
I think you've highlighted the difficulties of attempting to run advanced scientific models with a very limited understanding of the assumptions, configurations, and settings that such simulations employ. It would be helpful if we knew the settings that the IEA and IPCC researchers used.
Knowing that both used MAGICC narrows considerably the options. The main question goes arround the sensitivity parameter - the temperature increase per doubling of CO2. In the SAR the IPCC used 2.5 ºC and in the TAR 2.6 ºC. As for the IEA I can speculate it was 4.1 ºC, but without either graphs or numbers showing exactly what their reference scenario is I can't be certain.
The IPPC have this to say on sensitivity, page 64-65 of AR4 WG1 Technical Summary:
With the key chart being:
I'm not at all convinced by this - is there a reference I can look at?
Looks like over extrapolation of an extremely simple model to me..
In any case, it's not 'The temperature in 1990', it's 'The temperature that the Earth would have equlibriated at has GHG concentrations been kept at 1990 levels, with questions on weather aerosols should be kept or discarded, ice-albedo feedbacks, etc.'. There is an absolute minimum of a decade's worth of equlibriation to consider. If - as we probably have to - we take out aerosols, then we add even more to the temperatures.
You can start by reading MAGICC's manual.
I just had a skim of it, I was wondering whether it took into account the "global dimming" effect which may be masking part of what would be a larger temperature rise to date. Looks like the model incorporates the major gasses and particulates, but I think the jury's still out on the exact mechanisms of observed global dimming.
Thanks for this post, it’s very important to question emission scenarios and climate implications that aren’t reliably associated with realistic fossil fuel reserves and production profiles.
I don’t think we can’t take MAGICC’s result of 460-470ppm and 1.6C as any kind of definitive answer though.
There was a paper published last month in which climate policy with respect to recent advances in quantifying climate and carbon cycle uncertainties is discussed. Sure some aspects are ridiculous in that it doesn't consider finite reserves but it is interesting in that they compare the outputs of eleven state-of-the-art global climate models that participated in AR4 and their climate-carbon feedback in the Coupled Climate–Carbon Cycle Model Intercomparison Project(C4MIP). The value isn’t in it’s scenarios but the glimpse it gives us of state-of-the art model behaviour. Paper’s available here: Environ. Res. Lett. 3 044002
This is one of the scenarios from the paper:
The scenario is based on Stern’s 80% cut in global emissions, 25% by 2050, continuing down to 80% at the same rate.
Ignoring the portion after 2100 then the scenario is quite similar to the Olduvai Assessment (similar peak, similar rate of decline, similar emissions by 2100). It shows there is large uncertainty on the resulting atmosphere CO2 concentrations from the emission scenario and even larger uncertainty on the resulting temperature rise.
In contrast to MAGICC we have (reading from the chart in PhotoShop) concentrations of ~480-520ppm with temperature increases from 1990 of ~1.1-2.8C, (1.5-3.5C since pre-industrial).
Olduvai Assessment emissions are similar to the 450-550ppm policy scenarios however I don’t see this as a reason to jettison such policies, in fact the opposite.
Isn't it better to reduce our energy use within a policy framework than by the harsh market faced with shortages? Aren't we in the peak oil community looking for a policy framework to powerdown without hardship caused by undressed shortage?
Cutting CO2 emissions 80% by 2050 is about as close we as are going to get any time soon to a policy on reducing our economy's fossil fuel reliance to this century's fuel availability (slightly faster than Olduvai in fact, which is the right side of the curve to be). Would the ideal fossil fuel depletion policy framework actually be very different from the current climate change policy of 80% cuts in CO2?
I think it’s a positive thing that Europe (and recently Obama?) is taking the 80% cut figure seriously – this is pretty much what the Olduvai Assessment calls for.
Luis, where do you see the uncertainties in the Olduvai Assessment? It seems to be that with a peak not much more than a decade away there can’t be much uncertainty on the downside so how much uncertainty do you think there is on the upside? What of unconventional oil or methane hydrates exploitation decades from now?
On the House paper, while up to 2100 their scenario seems to be only slightly higher than the Olduvai assessment, on the overall it is quite different. In 300 years atmospheric CO2 concentrations never peak according to House, while our assessment leads to a concentrations peak still in this century. To my view this is just another flat-earth study where non-renewable resources are taken as infinite.
Whereas I feel obliged to criticize the IPCC's and the IEA's usage of fossil fuels reserve estimates I think that criticizing the carbon cycle models on which they work is beyond TheOilDrum's mission and even more outside the scope of this article. I agree that the sensitivity parameter may be missing important things (especially when considering Tropical temperature and its relation to other variables) but from there to proposing a model alternative to the IPCC's (that has been touted as the result of a consensus) goes a big leap.
There is a world of a difference between a policy to reduce CO2 emissions and an energy policy envisioned to address depletion. While the former is based on flat-earth assumptions of infinite energy resources the later is based on net energy decisions and tactics. This is the fundamental of our critics towards the Commission's policy.
Figure 3 gives a good idea of where present estimates of fossil fuels ultimates are today, from 1000 Gtoe by Dave Rutledge to 1200-1300 Gtoe by Jean Laherrère. This interval is a good band to work with given the markedly different assessments that fall within it. According to Jean Laherrère Unconventional Oil represents about 150 Gtoe of that pool. When using Jean Laherrère's larger estimate for Coal the fossil fuel peak moves from 2018 to 2020.
As for Methane Hydrates I recommend this post. If this wasn't just a dream TheOilDrum wouldn't exist.
I accept the flat-earth nature of the paper, that's not why I quote it. The interesting aspect is that here we have a plausible emission scenario (ignore data past 2100) being run through the best climate models available. This is the first time I've seen this done. Sure, their motivation might be different to ours but the data is similar, that's where its value lies.
There is a world of a difference between a policy to reduce CO2 emissions and an energy policy envisioned to address depletion.
I would offer that there can be an immense overlap, though each have differing priorities and implementation milestones. The shift to electric transportation, walkable/bikable urban areas, renewable energy and/or nuclear power (many variant scenarios), net-zero carbon buildings, etc are just some of the common areas.
That's the problem Will, while what you say is conceptually right, the overlap is in my view not that big. What if Nuclear really has a low EROEI? We have to rule it out of near term policies due to it's high up front energy costs. And energies like wave/tidal? Are they ready?
We also have the problem of present day politicians preferring the policy strategies outside this overlap area, e.g. agro-fuels.
I see more opportunities than problems. Nuclear EROEI is for others to define, though analyses I've seen in the past show it to be acceptable. Solar and Wind EROEI numbers I've seen are more than acceptable. Agro-fuels may collapse under their own weight before long, unless some breakthrough comes along (I don't see it as an overlap area, which is drifting from the point).
There could be a number of measures that are taken to mitigate resource decline as well as address GHG; increased carpooling/transit, as well as the other options I mentioned above. Surely you aren't claiming they are not overlapping measures? Or are you approaching this from a doomer perspective?
That is same attitude that brought us the mess of agro-fuels, leave net energy to others. Net energy has to be the basis of your decisions not an outcome.
I specifically addressed EROEI in the prior post, so don't just thrust agro-fuels into the forefront of every discussion of renewable energy and say "There, renewables won't work". There are a number of factors that should drive energy planning decisions; EROEI, while critical, is but one of them. Other factors include cost (internal AND external), emissions, sustainability, and technology maturity risk (i.e., fusion, "clean coal", etc).
Link to where I wrote that or retract your statement.
That is same attitude that brought us the mess of agro-fuels is how you responded to my comment about wind and solar EROEI. So either you miscommunicated your thoughts, or I misunderstood. I've been saying that a mix renewables such as wind and solar can work towards addressing both AGW and oil depletion. Do you agree that positive EROEI renewable energy sources CAN address both problems, leaving agro-fuels out of that mix as we both agree that they do not address either topic? If so, I'll retract my statement. If you can provide a better succinct estimation of the potential contribution of renewables with regard to both AGW and resource depletion, please share it with us.
Chris, in fact there is surprisingly little range in CO2 forecasts - 9 of 11 forming a very tight group. UK Hadley is a clear outlier - what do you think?
So most of the uncertainty lies in the temperature estimates - and this no doubt reflects diverse views among the experts on the role of feedbacks that are theoretical possibilities.
Are there not parallels in your line of reasoning here and the Iraq War? The public and parliament are misled to believe that Sadam has WMD's. We go to war, thousands die, and no WMD's are found. The public turn against the government - and perhaps unwisely become skeptical about the whole war on terror. We end up with one of the biggest policy failures in recent history that has achieved less than nothing. Too late to say that our main objective was to remove Sadam and secure oil supplies. In the midst of all the lies, rational thought goes out the window and we lose site of the fact that Sadam was our best bet for securing oil supplies from Iraq and its hinterland.
My god. Are you seriously saying the work of scientists and activists with regard to AGW is analogous to the disinformation and lies used by the Bush administration to get us into Iraq?
We need to buildt coal-to-liquids plants on a big scale to ease the pain from the downward slope though. And I really doubt that the Venezuelan bitumen will stay in the ground in the next couple of decades. The pressure to develop it will be immense. There is still ample of coal left, and China, Indonesia and India will use every bit of what they have to develop the economy. China will double coal production by 2020, already producing almost 3 times as much as the US. It is a carbon bomb of epic proportions, more important than oil. The cement production in India, Indonesia and China is just getting started. Over the next decades, massively polluting cement production will be ramped up to unbelievable figures as industrialization and urbanization picks up pace.
The Olduvai Assessment is based on the Energy Watch Group's coal assessment which sees a global production plateau roughly from 2020 to 2040 at maybe 15% higher than today. If coal production does end up being more than this then Olduvai is low and we clearly can't rely on depletion to address climate change. Apparently the data on coal is worse than oil so there has to be large uncertainty on this.
As I stated before, using Jean Laherrère's higher Coal ultimate of 600 Gtoe the fossil fuel peak moves forward by just 2 years. The scenarios contamplated here by the IEA are beyond imagination.
The recent debate on the quality of Coal reserve figures is centered on bringing them down, not up.
What is the Olduvai scenario regarding Venezuelan bitumen? Stay in the ground?
The Chinese seem to believe that the coal is there, and they are rapidly ramping up production, they have the best data about the coal situation and they know what they are doing. China is clear: there will be massive expansion of coal production in the years ahead and cement production as well. China producing 6 times as much coal as the US seems likely looking at their expansion plans for the next decade. I really dont think we can count on coal production not expanding much beyond today's level. Coal is the elephant in the room, and CCS on most coal-fired plants is more of a pipedream than anything else.
Perhaps difficult to see form this, but the Olduvai scenario has coal consumption growing strongly until 2047. Of the 3 coal scenarios available to us - Rutledge, EWG and Laherrere - we used the latter since it contained the largest amount of coal reserves ( or maybe it was the central EWG estimate we used?)
We useg the EWG, but shifting to Laherrère's the peak moves forward just 2 years.
Some great points. Few realize how poluting conventional cement production is. Monbiot has a good chapter on this in his book _Heat_.
But coals to liquids is no way to go.
It may be possible to do better than present cement production methods, at least for part of production:
http://www.abc.net.au/catalyst/stories/2244816.htm
There are other ideas about too.
Cement production is something which every environmentalist should put on the top of the agenda.
Why do you say that CTL is no way to go? The pressure for CTL plants will be immense once the squeeze on people really starts to take hold.
I agree that the pressure for CTL plants will be immense as we start the slide down the other side of the curve. But about the only positive thing about peak oil is that, as the post above suggests, it has the potential to reduce our headlong drive toward higher atmospheric CO2 levels and the consequent global warming associated with that rise.
If, instead of responding to PO by learning to live within our ecological limits, we turn massively to coal, un-sequestering yet more of the safely sequestered carbon that we, in our un-wisdom, have been liberating to the air, then our goose (and our planet) will truly be cooked.
Euan,
I am not a scientific illiterate, I subscribe to global warming. However, the Fringe-Goons have presented just enough evidence of lowering sea levels, impending ice ages and natural cycles to make me question the conventional wisdom.
You guys hurt me badly when all of you absolutely said that the oil price of $147 was based on fundamentals and not speculators and manipulators. I am now a skeptic of all opinions here.
Historically we believe that in the Primordial forest (coal and oil precursor) age, that CO2 was much higher than now, and that the global forests were the sink.
I was a greenhouse specialist and we would pump up to 1500ppm CO2 into a greenhouse for increased yield.
In my opinion all the CO2 we are releasing, being a heavy gas, will readily find its way into vegetation. The assertion that it will remain suspended above the vegetation is not credible. I suspect that the ocean too will increase its sink capacity.
The Fringe-Goons have presented just enough evidence to make me doubt the conventional wisdom of Y2K.
I really suspect that the "CO2 Fad" will come to nothing and yet again the Fringe-Goons will make us look like the sheep we are for subscribing to anything that "The Establishment" want.
We are still denying - US recession, never mind Depression. We are still saying how robust the world economy is.
Global warming/Ice Age, revolution in Congo, Pirates in Somalia, "Bush Terrorists" in Mumbai, I believe it all. Sure it is a "problem", but not mine.
Graham.
Yup, and in my opinion pink unicorns will frolic under the palm trees on the beaches... anyways, thanks for the laugh, oh and I now want a T shirt with Fringe Goon on it!
Graham - what you been smokin today?
Of the three major catastrophes facing mankind in the 21st Century - financial meltdown, climate change and energy decline - which ones do you believe in?
Well the first one seems to be a done deal. We have just had the coldest November here in Aberdeen I can ever recall and we have snow on the ground today - and UK day ahead nat gas costs 58p / therm compared with 45 p a year ago.
Will the lights be on this Christmas? In Scotland they wont be on for many families hit by unemployment, cold weather and rising energy costs.
Still dreaming about getting a bike and joining you on a tour round the Philippines though.
Euan
Euan, in my mind I am labelling this the 'last Christmas', as I feel that this will be the last one that is recognisable compared to the ones we have known.
People are spending on their credit cards, but know deep down that it is coming apart.
The bankers are continuing their looting operations, whilst not performing any banking functions of safeguarding savings and capitalising business - see the 'Automatic Earth' today.
For the future of Scotland, go to Kelso, where the power is out.
I posted a desperate ploy on to the thread on Geothermal energy, suggesting that perhaps we could build 'virtual power stations', whereby we build air source heat pumps and install some in France, and some in the UK, so that with an efficiency of 2.5 in existing builds you would get to power a British home and a bit for every French one and leverage French nuclear power - you would need more transmission, of course.
What do you think?
The £20 billion wasted on the VAT reduction could have financed the insulation of the 12 million out of 24 million worst insulated homes in the country, the ones in the lowest two bands, and put some restraint on the gaping hole that is our balance of payments.
Dave - agree entirely that the £20 billion VAT give away is a total waste and a sop to the lets consume as much as we possibly can mentality of our government. As you point out ot could have been spent on insulating houses, or building CO2 EOR pilot projects to get more oil out of the North Sea.
As for "virtual power stations" - you should write to Blue Peter and see if they can't rustle something up out of toilet rolls and detergent bottles.
Heard Lord Turner on the News last night with his plans to shut down coal fired power generation in the UK, admitting that we likely lack the skills to build new nukes, but awash with electricity in 2020 we will all be driving electric cars.
Hmm...I must admit I find it difficult to understand your dismissal of ideas to increase the efficiency of electricity use in France and so make more available for export.
We already have a 2GW link which imports power, and when gas supplies get tighter can only heat homes and offices via electricity.
Doing it as efficiently as possible would seem to be common sense, and a multiple of 2.5 is readily available by the use of heat pump technology.
Of course the process would be more indirect than I have outlined, but the basic idea of using power as efficiently as possible in both France and elsewhere so that the existing nuclear capacity is most useful is surely correct.
Do you consider this an intelligent and cogent point to make wrt climate change?
It's on a line with 'Diesel has come down 30p a liter in the past couple of months, so there's clearly no shortage of oil in sight..
Absolutely yes. One of the key climatic variables (that is poorly understood but is well documented) that controls cyclic climatic variations in W Europe is The North Atlantic Oscillation (NAO). In +ve mode, the NAO leads to strong westerlies across NW Europe, wet summers, wet mild winters.
In -ve mode, changes in atmospheric pressure distribution block the westerlies and result in W Europe being drawn into northerly (or southerly) air streams that in winter time can suck in masses of Arctic air leading to extreme cold weather, especially during November to April. So when I look out the window and see lots of snow (in November) - that has been totally lacking for a good number of winters, I tend to wonder if this is due to the NAO -ve mode establishing itself. And since our winter nat gas consumption is closely linked to ambient temperatures - as is the Russian's - I'm left wondering if nat gas supplies might fail in January and February next year.
The NAO -ve mode - can last for decade time scales, so there is a possibility that W Europe, may be in for a series of cold winters.
http://en.wikipedia.org/wiki/North_Atlantic_Oscillation
Climate change is defined by the IPCC:
The Met Office say:
Does the NAO timescale fit? The chart on Wikipedia suggests the frequency is a bit too high. I totally agree that NAO and our supply (or lack) of gas is of critical importance to us in Western Europe.
Chris - here's what the MET office web site says about NAO:
http://www.metoffice.gov.uk/science/creating/monthsahead/seasonal/resear...
But I take your point - the article also mentions weather. The main and serious point here is about natural climate fluctuations that may have influenced temperature variations over the past 30 years - and the last 1000 years and so on.
If the NAO switches to "cold mode" David Cameron may have a serious problem explaining to voters why he is spending so much money (and energy) combating global warming whilst thousands of pensioners are suffering dreadfully from the cold.
And if AGW continues to snowball, then people will wonder why so many have dragged their feet for so long, and the deniers will be in hiding.
Let me see if I'm reading you right:
1. There is warming.
2. It's not man-made, or is only partially man-made, what we are seeing all around us is primarily the reflectio0n of natural processes. Thatis, your statements above could be stated thus: "It ain't AGW, it's just the NAO?"
3. Since we cannot possibly burn enough fossil fuels to tip past 1.6C above 1990, it's all a bunch of alarmist crap to say we may be tipping the planet into massive warming.
Does that about cover it?
That is still local and not global climate. After all, I believe that a -ve NAO means a warmer Greenland, which may not be entirely desirable from a climate change point of view.
We have had a series of freakishly warm winters recently, so even an 'average' winter would seem cold now (with the consequent effects on NG demand).
Just out of interest, this guy post on global warming and stastitics and on an analysis of *global* trends came up with this prediction:
http://tamino.wordpress.com/2007/08/14/impure-speculation/
There's a significant cycle of around 3.6 years and a near-significant one around 7.8 years; currently these are both at their low points, so a couple of colder-than-trend years are expected - subject to the usual caveats. This is all in the grey area between weather and climate, where effects like ENSO and NAO come in.
Hi Euan,
No disrespect here. I drew a minus 9. That is pretty bad and extremely profound.
Believe me I am totally in favour of the world doing whatever is "Right" regardless of what it entails. As I see it the world is fudging all the issues. We are cutting it pretty fine if the "Establishment Scientists" are correct
We, the supposed intellectuals of the world try our best to keep some sanity.
Unfortunately about half the world seem to have differing opinions and some even produce credible evidence of it.
I like the issues cut and dried. It unnerves me when I have taken an altruistic position and then I turn out to be wrong.
Luckily I am only on a 5 year pla, so I will not be around to see what finally spins out.
How and why, exactly? It is an incontrovertible fact that the solubility of CO2 in water is inversely proportional to temperature.
Gases do not separate out in layers for more than very short periods of time. If they did, you'd be sucking pure N2 right now.
If 460 ppm and +1.6C could be guaranteed as the worst outcome I'd almost be prepared to say 'burn the friggin' lot'. But no need since that is what they are actually doing.
I wonder how MAGICC would have predicted atmospheric changes on the planet Venus. You just hope it handles the runaway feedback case. Meanwhile parts of the Southern Hemisphere have had an unusually cold spring. I take that as system instability not a trend, yet the deniers in the popular media regard it as the new climatic certainty.
Couple that with corporate cry-babyism over jobs supposedly lost to China and it's hard to see carbon caps or taxes having much effect. Just reading in today's media about Poland renouncing coal or Obama and the green New Deal it's hard to see them backing out of carbon cuts. Yet I think they will. Coal and tar sands will be mined until they are unprofitable, not because of carbon caps. It will be up to those who are still active circa 2030 to make a fresh start.
Hi
What are your assumptions in order to get the CO2 to stabilize around 2060?
The scenarios you have in the "olduvai" all seem to produce CO2 emissions
all the way to 2100? Shouldnt your CO2 increase all the way through then?
cheers
we all die by 2030, and nature stabilizez the co2 levels after about 30 years
just joking.... :P
You can read all about the Olduvai Assessment here. CO2 emitions peak before 2020, this results in a CO2 concentration peak of 470 ppm at 2075. This is all explained in the text.
Hehe. I have read through that page, as i said.
So, what ARE your assumptions that makes CO2 stable and even decreasing
around 2100? Although there is a net addition of CO2 in your scenario?
Could you shortly point that out.
It looks a bit unusual, considering that the lifetime is on the order
of 100 years plus for most of the CO2, and the general idea is that the sinks for CO2 are
less in the future than today?
Or, are you not open with how you make your calculations, and is it not clear
what data you are using? What was it now that you asked from the IEA... :)
My assumptions where:
a) Fossil Fuel Reserves and Production profiles are close to what we assessed earlier this year;
b) MAGICC is producing correct CO2 concentration scenarios.
The data is in the .gas files linked in the Annex.
More specifically;
b) Use of MAGICC with default parameters is producing correct CO2 concentration scenarios.
You know the IEA really doesn't deserve so many threads on this site.
Could we use different sources for data, please?
The IEA is the internationally recognized institution responsible for informing the public on the status of world energy supplies, forecasts, and energy investment planning, among other things. They made a big fanfare earlier in the year about the World Economic Outlook 2008 that was released last month. To their credit, it started by recognizing that we urgently need investments in energy (without saying these will need to be pulled from other areas), or face shortfalls in the not too distant future.
In a time when energy prices are making multi year lows, the real world still regards IEA as the premier authority on the future of energy. We decided to have a series of reviews on different aspects of the report. Since we only have one post a day, and many on staff volunteered to write/analyze various topics, the series may last a while. To my knowledge there is no formal body that reviews IEA information. Readers of the report are in a binary situation - they either use it/believe it or discard it/ignore it. Therefore it is still a very influential document. It is hoped that a review series here will encourage others to question some of the assumptions that underly our energy future, others both within and external to, the IEA. By writing these posts we are not saying the IEA 'deserves' so many threads, but that energy does.
Well there's your problem. The IEA is (perhaps politically) biased towards BAU, and as they're influential that will help stick the world to BAU. The good news is as you've mentioned that they've shown that business as usual is not sustainable, and major investment is required. So the IEA report is not a total loss. That doesn't take away the fact that the IEA reports are still shit full of assumptions, and IMHO they should have been much more explicit about this. You can make any point you want if you shop for the right statistics and filter out those that don't support your point.
As energy prices drop, a return to BAU is a temptation we need to resist. A typical energy crisis scenario: supply goes short, prices go up, issues get attention, then prices drop again, issues are forgotten, so they escalate again years later, and presto, another energy crisis, the cycle starts again.
Can't we see that energy requires continued and strong attention? Can't we transcend these cycles? If the IEA has it's way, then the answer is likely to be no.
Agreed. And you could argue that the IEA report is saying given emissions and CO-2, energy usage has to be reduced. It thus becomes a way of saying we have to reduce oil usage and to some extent it thereby allows them to continue avoid mentioning the words Peak Oil and yet have one created by managing reductions. Not certain whether this was one of their objectives though.
It was a bit odd that they relied on IPCC reserve for their climate models. The only problem is that they are still attached to the old stabilization values of 450ppm to 500ppm for CO-2, when the empirical data coming in from the Arctic (ice loss + CH4 emissions) and now acknowledged by Hansen say we need to go back to 350ppm
In my opinion, it's a very good paper and a very good initiative. My main concern is that there is a very large uncertainty about available reserves and related flow rates for the various fossil fuels. For instance, estimates for coal reserves fluctuate widely, my concern is that the Energy Watch Group forecast you considered for coal is maybe too low (their oil forecast is already too low). I think the best would be to encompass a range of reserve estimates and produce an uncertainty interval on your scenario, I'm pretty sure it's fairly large. In addition, if fossil fuel energy per capita does peak as predicted in the Olduvai scenario, to what energy substitute do you think people will turn to? I think massive deforestation is the most likely outcome, in this case CO2 emissions from land changes (currently around 1.5-2 GtC/year I believe) will probably increase rapidly.
It's worth noting that the terrestrial biosphere is and continues to be a net carbon sink, even with all the deforestation we have seen. It's still an open question as to exactly where this carbon is being stored but forests seem more likely than grasslands. The higher CO2 gets the greater sink the terrestrial biosphere becomes due to CO2 fertilization. However higher temperatures will reduce this so we can't count on the land being a sink forever.
Unfortunately there is evidence that sequestration itself becomes less effective as CO2 concentration rises.
The book "Climate Code Red" by Spratt and Sutton does a fine job reviewing the change in sink capacity going forward. Lot's of uncertainty around these numbers, but in general sinks are expected to weaken seriously, and in some cases reverse(?), in the future from saturation and ecosystem stress.
The ocean is actually the biggest "sink," according to what I have read. The dissolved CO2 combines with the H20 to form an acid (carbonic?), and the acidification from all that dissolved CO2 is already putting corals and plankton (themselves a carbon sink) at risk.
Don't underestimate grasslands. Many native grasses have 90% of their biomass below ground in their roots which can go down over 15 feet. As those decay, the carbon stays mostly underground (that's how the rich soils of the Midwest were formed).
And please don't overestimate "CO2 fertilization," which seems to work best at promoting the growth of plants like poison ivy.
Yes, I agree that there is a fair good amount of uncertainty in present fossil fuel reserves estimates, something in the order of 200 Gtoe around the overall Olduvai figure. But from there to a doubling or even quadrupling of realistic estimates goes a big leap. To put it in perspective, all the Oil consumed in the world equates today to less than 140 Gtoe - we simply can't be missing 10 times that figure.
As for the forests, once exponential growth ends, they will become probably the best way of storing wealth. They not only represent wealth as they pay interest on it. So I contend the outcome you envion will be as straightforward.
Sam - agreed that there is a large uncertainty, especially wrt coal reserves. The main point I would make is that there is actually very little excuse to have this uncertainty. I'd imagine that 90% of the world's easily mineable coal will lie in relatively few sedimentary basins and mapping those and making reasonable estimates of reserves versus resources should be little more than a years work for a competent geologist.
So why has the IEA not done this?
Agreed that deforestation is a major threat - just the shear environmental and ecological impact. Our Government is promoting greater use of wood burning stoves.
There may be promotion of wood stoves but within the UK, forestry is increasing and woodland management will be enhanced by a better price for forest products including firewood. (It's a different story in some other parts of teh world, of course.)
Dear Oildrum,
Your assessment regarding ultimate oil reserves and CO2 emissions might be correct but your assessment of temperature rise in 2008 terms probably is not due to the charney limit used by the IPCC (3C rise for 550 ppmv Co2) as opposed to James Hansen recent work which is offering a earth limit of 6C for 550 ppmv of CO2 due to long term feedbacks in the system which the charney limit does not take into consideration. Hansen is stating that the poles formed at around 400-600 ppmv (450 is not good) and the Arctic is in potential trouble at todays levels of 385 ppmv CO2 hence his statement about 350 ppmv resulting in a stable climate.
450 ppmv would mean 2C - 3C and GHG's do not only come from fossil fuels but from permafrost methane/co2 release, from land use changes especially deforestation and forest fires elsewhere. So the future is a little grim either with fossil fuel potentials.
On Real Climate they take the Charney limit as fact. They haven't mentioned Hansen disagreeing with them. Also they don't seem aware of the limit to fossil fuel reserves. They seem to accept the popular line that coal reserves will last for centuries. Perhaps someone should drop them a line.
I did just exactly that, I actually posted a link to this discussion and I got a few responses at least one from one of the PhD climate scientists that runs the blog. Obviously he doesn't exactly agree with that assessment.
What I find most interesting about this entire discussion is the extreme compartmentalization of knowledge by the experts. Since I am but a layman in both the fields of Climate Science and Peak Oil, interested in educating myself as much as possible about both of these issues, my personal opinion may not count for much. I do however get the impression that both the experts in Climate science and Peak Oil probably need to get over some of their differences and lack of knowledge about each others specialties and start a more productive dialogue with each other. The rest of us poor ignoramuses depend on all of you smart guys if we are to find a way out of this mess, so get to work already.
Well it seems I got Gavin Schmidt and Chris Vernon to exchange a few words, that might be a good start in that conversation ;-)
Link? Which topic?
Cheers
ccpo,
If you are still following this thread here is the link , Chris Vernon's comment is at #92 and Gavin's response is attached to it, there are a few other relevant comments throughout the thread.
I have done so a few times. Hard to tell if it has sunk in much.
But I am of the belief that anything above ca. 300 ppm of co2 for too long will do us in, so I don't get too upset when people argue over reserve size. We've gone way too far already so why not just find common ground on policies that aim get ahead of the Olduvai/net energy cliff and suck as much co2 out of the air while doing so.
Agreed!
Clearly, the IEA/IPCC estimates are way too high (your Figure 2). For example, here's something I recently graphed for oil.
Click to enlarge. Interpolated SRES data from here
Note that B1 Image is a low-end SRES estimate.
It's likely the case that keeping CO2 atmospheric levels below a peak of 450 ppmv is easily accomplished if (1) Rutledge is right about coal or (2) through policy if Rutledge is wrong, making some generous assumptions about renewables. And (3) since coal does not easily substitute for oil (directly through CTL conversion or indirectly through electric vehicles, excepting some industrial applications or when diesel fuel is used for power generation!) then I remain firm in my belief that oil is a primary driver of future emission scenarios.
A peak & decline in the oil supply (without prior mitigation, which is not happening) stifles economic growth which suppresses energy consumption of all sorts. For example, coal consumption in China has now fallen 4% year-over-year because of the economic slowdown there -- WSJ subscription required. This global recession was not caused by oil -- oil was not the major cause -- but economic effects would be the same in the future when oil becomes the driver.
As to climate change itself, when we look at feedbacks, the difference between the amount of fossil fuels we ultimately burn (Olduvai vs IEA/USGS/WEC/IPCC) is the difference between a bad outcome and a really bad outcome. For example, we find that Millions of Tons of Methane [Are] Bubbling Up from Melting Arctic Seabed as the northern hemisphere warms up faster than the mid-latitudes.
And I hope it is obvious that fast climate shifts (paleoclimate data indicated by Greenland ice cores) seem to be possible now. These radical shifts can occur on time scales of less than 10 years. So, the unhappy conclusion is...
Whether it is energy unavailability or climate, the news is bad one way or the other. The argument sometimes put forth is whether we are screwed for (exclusively) one of these reasons or the other. Sadly, it appears to be both even if Olduvai is too conservative or the IEA is too optimistic (which they certainly are).
Hope you're well, Euan.
Hello Dave, I'm very well thanks. And thanks for linking to that melting Arctic Sea bed article. So the theory is that global warming is causing the seabed to warm up and to melt gas hydrates?
This press release doesn't give enough detail but here's some food for thought:
1. The density of water (fresh) is highest at 4C, perhaps 2C for salt water. Colder than that then it "floats" and will eventually form surface ice - an essential characteristic that has enabled life in the oceans to evolve. So a stable water column is warm at top and gets progressively colder as you descend. This makes it pretty darned hard for warm surface layers to get down there to melt the clathrate. But it depends on the setting. Obviuosly a thermohaline sink may take warm salt laden water down. And in shallower shelf seas bottom waters may be affected by currents etc.
Pressure of course is an important variable for stability - falling sealevels may well destabalise methane hydrates on shelf seas - making it a bit of a mystery how we ever had any ice ages.
http://sepwww.stanford.edu/public/docs/sep92/christin1/Gif/phase.gif
2. Sub-surface oil and gas reservoirs are continuously leaking to surface. So is there any direct evidence that this is melting clathrate or is it a breached gas reservoir / gas cap of an oil reservoir? This is pretty darned important to establish before simply jumping to the conclusion this is methane hydrate. The d13C signature of the CH4 may help here. Gas and oil leaks of this sort often drive exploration efforts but their is a paradox here. Does a leak represent a good prospect to drill or does it mean all the oil and gas have already leaked to surface? The tar sands are one of the biggest and best examples of such leakage - being the residue left after bacteria have eaten all the light hydrocarbons.
On land, companies will lay out arrays of membrane collectors looking for leaking methane in order to develop drilling prospects.
Regarding your argument #2 (breached gas field or gas cap), the extent of this leaking methane is quite large --
I think this knocks out argument #2.
Regarding argument #1, I don't think anyone has an exact understanding of the physics of what is happening. It seems likely that leaking methane of this extent (area) would be somehow related to dramatic warming in the Arctic.
But my point was about potential positive feedbacks in climate change, not the anthropogenic forcing of climate. I sense that you think that because you can suggest possible alternative explanations for the methane leaks, then somehow this casts doubt on anthropogenic forcing, which it does not.
I am unable to understand your hostility to the climate science, nor a more general hostility that I've seen in the peak oil community over and over again.
Interestingly, the hostility is mutual. Climate scientists wave their hands over or deny peak fossil fuels. Just the other day I was talking to someone involved in the EdGCM software, and he got extremely hostile when I mentioned peak fossil fuels. He said "Fossil fuels supply is effectively infinite up to the end of this century". When I tried to distinguish between reserves and supply he got angry and abusive, the thread was locked and some comments deleted.
It really seems that we have two groups: those concerned most about peak oil (they seem less concerned about peak coal or gas), and those concerned about human-caused climate change.
Each group says that its area of interest is most important, and the other not so important. Some members, like Patrick Lee on the EdGCM project, or Euan Mearns here on TOD, actually deny that the other problem even exists.
We get similar things in other areas. Communists for example in the West are all about class warfare, if you talk about environmental problems they say that there are none, or that if there are really they're class problems. Some radical feminists are like that, as a some greenies.
It's very strange. It's as though they think only genuinely global problem can possibly exist in the world at once. It's like a Pauli Exclusion Principle, but for problems instead of electrons.
Maybe we could call it the Schuant Exclusion Principle - "no two global problems may be acknowledged simultaneously by a person. If one is acknowledged, all others must be downplayed or denied." [Edit: I just wrote an article about the Problem Exclusion Principle which talks more about this.]
This seems a rather vast generalization, apparently based primarily on one interaction with someone who apparently had a bit too much coffee that day.
I am concerned about both PO and GW and I interact daily with hundreds of others--here, at PO forums, and locally--who are similarly concerned about both. Sure, most people have special reasons from their background or inclination to obsess more about one than the other. But most enviros I know are aware of and concerned about PO, and many peakers (right term?) have been or have become very concerned about GW.
Again, sorry you had a run in with a surly jerk, but try not to draw large conclusions from limited data.
For the record, I didn't see anything very hostile in the original post by Euan, just the kind of probing questions we should always be asking.
Cheers,
Dohboi
The examples I've given should not be taken as exhaustive. There are a lot of people like that. For example this commie thinks that it's all part of the class war.
It's very common for people to think that their pet issue is the only one of importance.
And yes, not everyone is prey to that. But even just a few individuals like that can have effect out of proportion to their numbers. Why do you think we see no more TOD articles from Stuart Staniford? He was concerned about human-caused climate change, two of his fellow writers insist it doesn't exist, or if it does it's not that important. This could be coincidence, but I doubt it. So out he goes, and TOD editorial balance swings in favour of CC denialism.
I didn't say Mearns was hostile, it was the one at EdGCM who was hostile. Mearns wrote an article stuffed with outright denialism, and got a strong negative reaction. Now he's co-authour of an article downplaying it.
"Human-caused global warming isn't real!"
"Nonsense. It is, and here are references."
"But... quibble... semantic argument... meaningless nitpick."
"No. Here are more references."
"Okay, let's say it's real, it's still not very important!"
Yes, there aren't a lot of people as bad as Euan Mearns or Patrick Lee, but those people are unfortunately influential out of proportion to their numbers. Lee helps create a climate model used by dozens of educational institutions; Mearns has an audience of tens of thousands or more.
In fairness, Euan is only editor of TOD:E, not TOD proper. Also, he's offset at least somewhat by the leanings of several other editors and contributors, including me (and I certainly don't have difficulty keeping more than one problem in mind at the same time).
This is not to say that I do not find it irritating. But I'm not about to quit TOD over it.
I agree, and have seen a lot of this. I've been to four ASPO conferences and seen that a sizeable proportion of ASPO are climate change sceptic. I also work with a lot of climate change scientists and not a single one is fully signed on to the peak oil message as expressed by organisations such as ASPO (or TOD).
My experience is that a lot of lay climate change people tend to get overexcited about the rapidity of warming and consequences.. and a lot of peak oil people are very quick to accept favourable conclusions without being sufficiently skeptical.
The recent stuff about methane is a case in point. We really don't have sufficient data on global sources and sinks of methane - or even historical observation of the relevant areas of possible melting - to declare that methane-feeedbacks are under way. So declarations of imminent doom are a big overstretch.
But equally, there have been a fair few declarations of peak oil already which don't seem to be true - and the declarations several years ago that the US was about to run out of natural gas have been massively confounded by the unexpected growth of non-conventional. And when the more dedicated peak oil people start telling me that oil is required to make fertilizers.. arrrghhh.. basic chemistry please, chaps and chapesses.
Funny thing is, both AGW advocates and Peak Oil advocates will tell me that peak uranium is just around the corner, despite an embarrasing paucity of evidence.
The problem can be expressed in two words: Confirmation Bias. It is a massive human trait to place a much greater weight on evidence that supports what we already think we know and disregard any conflicting evidence - even if that evidence is much stronger. Hence AGW advocates will tend to play down that fact that conventional oil and gas at least will be self-limiting. AGW-deniers, on the other hand, really will give more weight to an unreferenced propaganda piece in a daily newspaper than to a multi-year, multi-peer reviewed study by a major scientific organisation. That's the confirmation bias at work.
Indeed, perhaps the most important purpose of the scneitific method as a whole is to provide a way to screen for confirmation bias - individual scientists will give excessive weight to their own pet theories and overstate the evidence for them (even if only in their heads); it's up to peer review to filter for this. This is also why so many people rail against peer review when it stomps on something that they have convinced themselves of.
Both global warming and peak oil are manageable problems.. if we use the scientific method to analyse them, and let the engineers solve them. If we approach them with a rigid idea of that the problem is and an equally rigid idea of that the solution will be - and evidence to the contrary be dammed - then things could get tricky.
You are falling victim to your own criticism: a bias to the middle is as much a bias as a bias to the extreme. It also is dangerous when the outlier, black swan or highly improbable end up being the reality.
You need to be careful about confusing confirmation bias with legitimate and logical risk management. When the result of not doing enough can equal 6C+ warming over a time period too short for biological systems to adjust and/or evolve, and it has happened in the past, assigning concern about it a label of CB seems a little off.
Mind your bias, now, y' hear?
;)
Cheers
Dave - there certainly is a fair degree of hostility on this thread. I'm not aware that any of it is emanating from me.
Last time I checked, global atmospheric methane levels were actually falling (can't recall the source, I think it was Hansen). If this trend has been abruptly and significantly reversed then I would certainly take note.
Atmospheric methane concentrations plateaued for a few years, but they have been going up again over the last year or so. Sorry, I'm in a rush right now, but I'll get back with references. Anyone else can google it if they wish.
Wrong, says the CSIRO, who tell us,
This is like when you told us that the world had been cooling since 1998. It's just not true, and five minutes with google would tell you that.
This is why you get hostility, Mearns. You say things which are untrue, stuff you just plain made up, people give references to show they're untrue, but you'll go on saying them anyway. Being deliberately obtuse annoys people and makes them hostile.
Just imagine how you'd feel if there were people writing articles for TOD on how abiotic oil will save us from peak oil. And you kept demonstrating that they were wrong, but they kept writing articles and being puzzled at the hostility they got.
Seems strange this would be news to you since it 's been covered extensively on TOD and in the news since last summer. When writing on the climate do you not check your facts first?
BTW, it is simply silly to use pejorative terms, derision and sarcasm and then pretend there is no aggression in your words. Reminds me of a study done on the differences in aggression between men and women - with women assumed to be the less aggressive, of course. Turns out, when you count verbal and emotional aggression rather than just physical, they turn out about equal.
That's the equivalent of your dissembling above.
Cheers
With regards to Kjell Aleklett's article about the over estimates of the recoverable fossil fuel resources, then it should be noted that Kjell always seem to refer to oil and coal only. He do not seem to take into account tar/oil sands or oil shale into his accounts. I asked him in 2006 at a seminar about this. I asked what if we used tar/oil sand/shale to produce the required liquid fuels we need for transport when we run out of oil and coal? He responded "That would be insane!"
I think the problem here is that if we don't assume that tar/oil sand/shale is going to be used to quench the thirst for energy and take that into account when doing our CO2 emission calculations, then we are going to see this "insane" scenario actually happening. Arguing that we are going run out of recoverable oil and coal before the damage is done is not justification for doing nothing, when there are potential other fossil fuel resources. We can see the beginning of this already in Canada where substantial resources of oil sand exist and extraction is done with large emissions of CO2 as a result.
The ultimate range of 1000-1200 Gtoe is enough to cover heavy oils. As for Shale what ultimate do you suggest? And what production rate? And is the EROEI positive?
Also mind that TheOilDrum traks the production of these oils (see here and here) and up to now they do not show capable of changing the overall picture.
The 2007 report of the World Energy Council
gives a total of 2800 Gb for shale oil and 5800 Gb for bitumen and extra heavy oil.
A barrel of oil contains 118 kg of carbon so these two unconventional oils together equal (2800+5800)x118/1000=1014 G tons of carbon, almost double the carbon you propose for remaining fossil fuels in your report(450? G tons of carbon--half if we are at fossil peak as 1050 G tons of oil=900 Gt of carbon).
If 450 G tons of carbon used before 2006 is responsible for a 100 ppm rise(380ppm-280 ppm) in CO2 concentration( 1 degC= X * ln(380E-6)-ln(280E-6), X=3.14)--a 1 degree C rise in temperatures then another 450 G tons should drive us up another .73 degrees C=3.14 * ln(480E-6)-ln(380E-6).
Our current 6 GtC per year consumption over the next 80 years would finish off the last 450 GtC of fossil fuels in your peak.
If we use another 1014 (unconventional oil)+450 (your estimate)=1464 Gt carbon we would drive concentration up by 1464/450 x 100=325 ppm from 380ppm temperature base up by 2 degC (i.e. 3.14 * ln(705E-6)-ln(380E-6)=1.94 degrees C).
This is for the direct CO2 heating contribution only without feedbacks which the IPCC says magnifies the temperature rise.
How fast can we burn up 1464 G t of carbon? We are currently burning carbon at a rate of 6 GtC per year. If world population levels off at 9 billion people in 2070 then carbon might reach 9GtC and there would be another century of CO2 emissions before we burnt off those last unconventional oil resources.
The amount of carbon is MUCH larger than presented here.
The usual assumption at TOD is that unconventional oil (at least 1 trillion barrels) won't be fully developed (except in Canada). There are no technical barriers to producing oil from shale or super-heavy crude. Also Dave Rutledge's 'reserves' are merely 'trends' based on the switch from dirty coal to cleaner burning natural gas for new electricity in the US.
China and India has proven that you can burn as much coal as you can dig up.
The amount of all fuels produced is driven by demand not geology at this point. US coal production in the 1930s dropped by about a third from 600 Mt/a to 400 Mt/a(that's still a lot of coal) and then rose up to 1150 Mt/a today despite a taste for NG.
If today a world of 6.5 billion people uses 4 times the energy annually a world of 3 billion people used in the 1960s, what will a world(2050) of 9 billion people use?( at least another 25% more over current levels?) A decline of world energy use(CO2 emissions) without legal restraints is impossible and so carbon dioxide concentrations will accelerate. At that rate over the next 50 years we will emit something like an additional 400 Gt of carbon. The RATE of rise of CO2 concentration will continue to rise linearily. The RATE of the temperature rise per rise in CO2 concentration MAY have slight decrease over a many centuries if feedback effects are ignored.
But the reality is that the rate of CO2 concentration rise per decade today is twice what it was in the 1960s.
For fossil fuels in total I'd agree but there is a convincing argument that oil at least has switched from being demand side limited to being supply side limited. The near plateau from 2005 and increased prices should be a clue.
People can't use what isn't there. That the population is likely to increase can not be taken as evidence that fossil fuel production will increase.
We have been here many times before. "There's plenty of oil in the ground ... demand drives it ... but there's the unconventional sources." Of course anyone can quote CERA or the USGS and simply go away ignoring the endless times they have been wrong before.
Let's suppose that we add to our fossil fuel pool a further 140 Gtoe from that extra unconventional oil (we would still behind Jean Laherrère's estimate). How would that change the overall picture? Would it postpone the fossil fuel peak by how many years? One, two?
Is Mankind's incomprehension of exponential growth such a fatidic fate? Can't we just for once think with a bit more than our limbic brain?
The world has never seen such freezing heat
By Christopher Booker
Last Updated: 12:01am GMT 16/11/2008
The Telegraph
A surreal scientific blunder last week raised a huge question mark about the temperature records that underpin the worldwide alarm over global warming. On Monday, Nasa's Goddard Institute for Space Studies (GISS), which is run by Al Gore's chief scientific ally, Dr James Hansen, and is one of four bodies responsible for monitoring global temperatures, announced that last month was the hottest October on record.
This was startling. Across the world there were reports of unseasonal snow and plummeting temperatures last month, from the American Great Plains to China, and from the Alps to New Zealand. China's official news agency reported that Tibet had suffered its "worst snowstorm ever". In the US, the National Oceanic and Atmospheric Administration registered 63 local snowfall records and 115 lowest-ever temperatures for the month, and ranked it as only the 70th-warmest October in 114 years.
So what explained the anomaly? GISS's computerised temperature maps seemed to show readings across a large part of Russia had been up to 10 degrees higher than normal. But when expert readers of the two leading warming-sceptic blogs, Watts Up With That and Climate Audit, began detailed analysis of the GISS data they made an astonishing discovery. The reason for the freak figures was that scores of temperature records from Russia and elsewhere were not based on October readings at all. Figures from the previous month had simply been carried over and repeated two months running.
The error was so glaring that when it was reported on the two blogs - run by the US meteorologist Anthony Watts and Steve McIntyre, the Canadian computer analyst who won fame for his expert debunking of the notorious "hockey stick" graph - GISS began hastily revising its figures. This only made the confusion worse because, to compensate for the lowered temperatures in Russia, GISS claimed to have discovered a new "hotspot" in the Arctic - in a month when satellite images were showing Arctic sea-ice recovering so fast from its summer melt that three weeks ago it was 30 per cent more extensive than at the same time last year.
A GISS spokesman lamely explained that the reason for the error in the Russian figures was that they were obtained from another body, and that GISS did not have resources to exercise proper quality control over the data it was supplied with. This is an astonishing admission: the figures published by Dr Hansen's institute are not only one of the four data sets that the UN's Intergovernmental Panel on Climate Change (IPCC) relies on to promote its case for global warming, but they are the most widely quoted, since they consistently show higher temperatures than the others.
If there is one scientist more responsible than any other for the alarm over global warming it is Dr Hansen, who set the whole scare in train back in 1988 with his testimony to a US Senate committee chaired by Al Gore. Again and again, Dr Hansen has been to the fore in making extreme claims over the dangers of climate change. (He was recently in the news here for supporting the Greenpeace activists acquitted of criminally damaging a coal-fired power station in Kent, on the grounds that the harm done to the planet by a new power station would far outweigh any damage they had done themselves.)
Yet last week's latest episode is far from the first time Dr Hansen's methodology has been called in question. In 2007 he was forced by Mr Watts and Mr McIntyre to revise his published figures for US surface temperatures, to show that the hottest decade of the 20th century was not the 1990s, as he had claimed, but the 1930s.
Another of his close allies is Dr Rajendra Pachauri, chairman of the IPCC, who recently startled a university audience in Australia by claiming that global temperatures have recently been rising "very much faster" than ever, in front of a graph showing them rising sharply in the past decade. In fact, as many of his audience were aware, they have not been rising in recent years and since 2007 have dropped.
Dr Pachauri, a former railway engineer with no qualifications in climate science, may believe what Dr Hansen tells him. But whether, on the basis of such evidence, it is wise for the world's governments to embark on some of the most costly economic measures ever proposed, to remedy a problem which may actually not exist, is a question which should give us all pause for thought.
I am guessing that Solgundy agrees with this as it has been posted without comment. This is the kind of pseudo-scientific journalism that muddies the water and enables the world to stay on its suicidal path. It may be that the data were wrong for Siberia - people make mistakes. Does the article mention that instead of being the hottest October on record that the adjustment makes it the 2nd hottest year? This article is mainly attacking Hansen and Pachauri personally, not a scientific article. Watch out for that - the ad hominem attacks are a clear indication of a hit piece, not a serious scientific article.
Here are the questions that should be asked:
What are the consequences if we take action on climate change and the scientific consensus is wrong?
What are the consequences if we do nothing and the scientific consensus is right?
In the first case, we have changed the way we live to use less fossil fuels and take care of the environment. in the second case, we have pretty much destroyed the planet for future generations. To me it is obvious that we take action, becasue even if it is not as bad as we thought, almost all of our actions will have other positive benefits.
I think that Solgundy and the author of this article are going to get their way as it is so much easier to scare people about losing their jobs than it is to do the right thing. It's really sad though.
Raindog..
It's pointless to argue when something like Global Warming becomes a religion...is Dr Hansen making data fit his long held conclusions...never let an inconvenient fact get in your way...
someone had better write legislation to force the sun to create sun spots.......
http://www.solarcycle24.com/
http://personal.inet.fi/tiede/tilmari/sunspot5.html
The sunspot cycle does impact climate. Most people who have studied this seem to agree that periods of high sunspots might be 0.1C warmer than periods of low sunspots. We are supposed to be headed into a peak of sunspots in 2011. El Nino/La Nina variations probably have an even greater impact on climate from year to year. Just becasue these things influence climate does not mean that greenhosue gases do not also influence climate. The impact of other factors such as sunspots have been carefully teased out of the temperature data. What is left is that the primary driver toward higher temperatures in the last 150 yrs has been the increase in CO2, methane and other greenhouse gases in the atmosphere.
Look, I believe in science. Science will eventually get it right. To put too much faith in one scientist is a bad idea. That would go for Hanson or anyone else. Hanson has done a lot of good to raise awareness on this issue and he makes a lot of good points. Will he be right about everything? No. Will any scientist be right about everything? No. Does this mean that we should not pay attention to anything scientists say? NO! The scientific consensus is that a good chunk of the warming over the last 150 years can be attributed to buring of fossil fuels and deforestation. Might this be wrong? Yes. Is there a high probablility that it is completely wrong? No. Science will correct itself as it goes along.
Again watch out for ad hominem attacks such as those you are now making agains James Hanson. He might be right. Argue the science not personalities.
This is the right way to frame this problem - the emphasis then has to be on what action is taken. I'd note that Dr Hansen has been one of the main proponents of carbon capture and storage (CCS) which will lead to us using more coal and not less. And like it or not, Greens of one shade or another brought bio-fuels to the energy party and also fantasise about a mythical hydrogen economy.
Right now the AGW argument seems unwilling to accept that we may actually face a near term energy crisis - hence their enthusiasm for energy intensive ways to tackle AGW.
So what is required here is a series of energy efficient proposals that will act favorably to tackle both issues simultaneously and this boils down to energy efficient forms of energy use and production that will inevitably have to be combined with proposals to limit energy consumption and global population.
I completely agree Euan. Let's focus on actions that solve or work toward solving both problems.
I also agree Euan. Keep in mind that Hansen has a list of proposals and reasearch on CCS and 4th Gen Nuclear are among them, but he focuses more on energy efficiency and a high tech HVDC smart grid to enable renewable energy to be moved from high sun and wind areas throughout the U.S., as well as a carbon tax. I am mostly paraphrasing his letter to Obama. Link below.
http://www.columbia.edu/~jeh1/mailings/20081121_Obama.pdf
Hi Euan, Luis,
Thank you for a very interesting post. You do a great service by analyzing the relations between the publications of the IEA and the IPCC.
The only thing that I would add is that Tom Wigley deserves thanks for making his MAGICC program available, and updating it to keep it consistent with the IPCC's 4th Assessment Report.
Dave
My reading of Hansen is that he is not an advocate of CCS, but says that if you want to build a coal plant you better make sure it comes with full CCS. He seems agnostic about the technical hurdles regarding this and just makes his point as a climatologist.
like it or not, Greens of one shade or another brought bio-fuels to the energy party and also fantasise about a mythical hydrogen economy.
That's one particular perspective. Other perspectives take into account the lobbying by major agri-corporations such as ADM and Monsanto and farmers to significantly increase their profits. Also, it was Bush who uncritically promoted the hydrogen fuel cell "Freedom Car", using it as an excuse to kill the 80 mpg hybrid family car PNGV program that actually produced 80mpg 5 seater prototypes.
I think you have a different definition of 'Green' to me :-)
The Greens that I know promote conservation, efficiency and an end to the fundamentally unsustainable notion of economic growth. Some had early support for biofuels but most now realise the problems of that approach. Not many Greens I know think hydrogen is a good idea.
However, amongst the grey middle of the road parties, there's plenty of pandering to the public that in the long-term, CCS and Hydrogen are the 'green' solution to our problems.
Over the last few years, the message from the car companies, the coal industry, the grey dominant parties, has been this: We are working on a technological solution. It will happen, but it is a long way off. Economic growth must continue unabated until they are ready. In the meantime, please consume as normal.
That is the great fraud associated with CCS and Hydrogen. It is a message from the powerful, framed as 'green' but intended to delay any serious action. It is not even a remotely green philosophy!
"So what is required here is a series of energy efficient proposals that will act favorably to tackle both issues simultaneously and this boils down to energy efficient forms of energy use and production that will inevitably have to be combined with proposals to limit energy consumption and global population."
Very well put. This should be the motto of the generation, perhaps century.
It seems to me that we should also be asking the following question:
How do we create a system of production and distribution that has some other concept of economic health than “selling more stuff this year than we did last year”?
The fact that Luis sees a very small overlap between climate change mitigation actions and poverty mitigation actions is precisely because of the acceptance of private finance capitalism (and its structural committtment to ever increasing sales volumes) as an unchangeable social form. We need a socially agreed upon conception of enough in the realm of economic goods and services (The intellectual and artistic realms are a different matter.). If such an agreement could be reached, then the attempt to provide the agreed upon level of goods and services as efficiently as possible could simultaneously serve the purposes of saving us from economic collapse and reducing our ecological foot print.
Euan’s suggestions of emphasizing energy efficiency and controlling population are excellent, but if they are pursued within the context of an economic system which is structually committed to ever increasing sales volumes as a means of gaining status and security, then I see no hope that they can save us from an eventual civilizational disaster.
We'll have spent a lot of money and ended up with a cleaner environment.
We'll be somewhere between worse off and much, much worse off.
/simplified ;)
Hhmpfh. The Telegraph. Bird-cage liner.
If they keep repeating this blatant lie, people will start to believe it (most News LTD readers seem to already).
None, because we don't have an unconventional oil industry
program except Canada.
Let's assume a worldwide 'moonshot' project to replace oil with shale oil and tar sands at a rate of 1 Gb/yr every year. After 30 years, production would be equal to today's oil production and there would be a 30 year 'saggy' plateau
between them. Beyond that unconventional oil would decline
as about 1/2 of the 1000 Gb would be gone and conventional oil would already be exhausted.
Thirty years--a whole generation to prepare for the end of petroleum.
Our current energy demand mix is 40% oil, 25% coal and 7% natural gas for electricity and 16% for
non-electric natural gas.
The world fossil resource base without unconventional oil is 66% fossil electricity, 13% natural gas (non-electric) and 21% oil but with unconventional oil it is 56% electricity, 11% natural gas and 33% oil. This is closer to our ratio of energy needs.
If our resource base exactly matched our needs then we simply slow down as resources deplete with help from energy efficiency.
It's the mismatch leads to Liebigs Law of the minimum, which is your real Olduvai(falling off a cliff).
This what you should really worry about.
It should be pointed out there are above ground factors that may limit near term growth in coal use
1) the imminent volume peak in liquids
2) dividing the coal export pie.
Coal needs diesel to mine and send by rail. New homes and concrete shopping malls may not get built as retail falters. Air conditioners and gadgets powered by coal fired electricity may be turned down. Then again we could use more coal for PHEVs and syngas. That's the demand side. On the supply side I believe within a decade some major coal exporters will abruptly decide to conserve domestic reserves. Coal exporters Australia and the US may then decline to supply Chindia's shortfall in order to keep jobs at home and to be consistent with domestic carbon policies.
Thus it may require political intervention to keep coal demand and supply as high as it has been. There will be lots of yelling. The problem then becomes whether warming is more sensitive to recent CO2 release rates or accumulated levels. I understand the MAGICC model finds that warming is more dependent on levels. If that behaviour is true then it may not matter if the coal peak is 2030 or recession deferred to say 2045. Either way the coal phaseout will be smoother the earlier it starts.
IMO we have to shift coal from a centralised baseload energy supply, to a variable, distributed power provider. Micronised coal slurry can be moved in pipelines and used to power slow speed diesel engines (with around 50% efficiency) These units are sized around 200-500MWe and would ideally provide district heating for high density housing areas.
We could potentially remove CO2 from the atmosphere, provide energy and a source of O-NPK by farming large volumes of seaweed on floating platforms, putting it through a digester and making use of the digestate. In addition to this, fast growing biomass such as bamboo can be grown and turned into charcoal and returned to the soil. Also composite hemp composites can lock up carbon as building materials for vehicles / buildings.
I think we may have also seen the peak of global coal exports, the key factor is Australian coal exports (about 30% of global total exports) Oz has huge renewable energy potential, and would be an ideal country to develop solar assisted steam power plants, as the technology improves thermal storage can be added and the amount of coal used can be decreased.
Strictly speaking, it doesn't. Coal mining equipment is captive, and could be converted to electrical power fairly easily (even if there is a large up-front cost). Trains can run on pretty much anything, including slurried coal (with increased rebiuld frequency), electricity, NatGas, Ammonia etc. Diesel is used because it's cheap.
Since this is an area where I do have some expertise, I offer the following observations on the original posting.
There is a chicken/egg problem about who is relying upon what. When we reviewed the IPCC AR4 draft, one of the criticisms of the four major scenarios carried forth from the SAR and the TAR was that the scenarios were based upon consumption/production values that were not really tied to reserves rates or real rates of production associated with real reserves. Rather, they were assumed alternate energy scenarios that represented some variant of BAU (the "A" scenarios) or some reduced consumption growth (the "B" scenarios).
Never mind that there are a number of people (myself included) that don't think that growth rate of oil consumption (like the IEA has projected) or other fossil fuels can really persist into the future. Although the IPCC did consider the reserves issue in the AR4, it was not an all encompassing review. Essentially, it concluded that, given the paucity of data, that it was possible enough fossil fuel existed in the mix under consideration to extend the analysis well into the future under the 4 major emission scenarios.
Blaming the IPCC for providing data to the IEA as the basis for emission estimates is blaming the wrong group. The IEA are the "experts" in the energy area and if they did not believe the values used by the IPCC or if they are significantly different than the ones used in the WEA 2008 because of limits in production/consumption then that is something that they (the IEA) should have dealt with. Many, including myself, are critical of the projections made by both the IEA and the EIA in energy consumption noting that it is "wishful thinking" at best and disingenuous at least.
The AR4 does not use a single model to predict future temperature or climate profiles but a family of them to give a range of conditions with a central tendency. The best of them are Global Circulation Models (GCMs) with mutilayer atmospheric and oceanic representations of what is going on in energy and mass transfer. These models have long-spinup times from initial conditions. The atmosphric concentrations or more specifically the global balance of CO2 is an input file that are best described as bulk concentrations. The grid pattern is finally becoming fine enough (takes a lot of computation to deal with boundary issues in the array math) to have the models "spontaneously" spawn features we are familiar with (like hurricanes). And although the models are now computing in smaller temporal increments (the one I'm running now in the background is in 10 minute segments where previous ones computed on 30-minute increments) you could not use them to predict what the weather is going to be like on January 17, 2015 or what happens if you don't drive your car tommorrow.
At best they give possible trends consistent with physics.
The problem with most "simple" models with carbon dioxide or carbon equivalent is that they work by estimating from a bulk or slab model approach with an approximation of temperature effects from a ground level CO2 or equivalent concentration. This is one reason why people can't (with simple models) reproduce some of the IPCC predictions. The correct way is to compute a line-by-line (frequency) and layer by layer (temperature and pressure) "picket fence" or radiation effects associated with the various greenhouse gases in the atmosphere.
Are there uncertainties? Yes. You have a chaotic system that follow physical laws with multiple feedback (both positive and negative) loops, with time delay and with apparent hysteresis effects. As an engineer that spent two years focusing his studies on process control of these types of systems, it's the time delay of the positive feedback loops that worry me.
But more than temperature (which is what people focus on), it's what it does to the climate itself and the operation of other nested systems that should be of concern. By itself, an increased temperature over some baseline is no big deal. But if that temperature increase changed rain patterns so that it rarely rained over land and mostly rained over the oceans, we would be in deep, deep trouble.
An analogy I've used before around oil and fossil fuel reserves is worth mentioning here again. How can you have a drought on a planet that has 78% pof it's surface covered by water? But we know better (or at least some of us do) that if the climate changes just enough to wipe out the food chain, the argumant of whether there is enough fossil fuel reserve to produce some very high CO2 concentrations in the future really becomes a moot point.
Thanks for your comments. I not well versed in climate science but am involved in 2 projects on water used in energy production (and energy used in some water 'production' (irrigation, desal.. etc.). The 'EROWI' is something that should be evaluated going forward (Energy Return on Water Invested). Whether humans are 95% or 50% responsible for the climate changing is not the point (at least from my perspective). It's what do the intersecting source and sink problems leave us for limiting inputs and options. We conclude in a forthcoming paper that 65% of worlds population (by country), will be limited to ZERO water use for bioenergy by 2025 using UN population/water consumption trends and business as usual scenario. Once it is published, I will post excerpt and link here.
My own beef with IEA in this area, (though I agree with what I understand from Luis and Euan), that the IEA devoted 1/3 of their executive summary to 'environmental issues', and several chapters in the WEO. However the only 'environmental issue' addressed at all is CO2- not soil, not water, not biodiversity, not pollution, etc. So in yet another dichotomy, its VERY good that such an agency is considering externalities in their analysis, but considering only one is a bit narrow.
And a brief editorial note. We have a staff of 24 here, with disparate expertise, opinions and personalities, but with a unified goal of providing energy discussion and education not found elsewhere. The above post will be popular to those who think AGW is largely caused by other forcings or not as urgent as energy depletion. But it is certain to activate strong emotions from those working on the environment in the climate science areas. I think its clear we have entered the era where beliefs dominate facts, and without 'knowing' the final answer, we will gravitate towards the viewpoints we have become associated with. I will have a post on that next week. Neither the impacts from climate change nor peak oil nor the tradeoffs between the two will be 'provable' until many many years into the future. It seems that the precautionary principle should rule the day.
It's all about the pieces of the jigsaw puzzle now. Some people have 10 pieces and believe there are only 12 in the puzzle - others have 30 pieces but suspect there are probably over 100. The playing field will be dominated by the loudest most influential voices. The best role we can play, both at theoildrum, and in our individual circumstances, is in education and discussion, in hopes that we educate someone with a loud and influential voice with as many of the puzzle pieces as we are able to locate.
Though we don't intend on posting content on climate often, the credit crisis is making the circle of mutually exclusive policy trajectories between AGW and PO mitigation a little wider than it used to be. The only answer I know that addresses both problems is use less - and compete for lower energy (hence lower carbon and resource) social 'carrots'. Barring that I agree with Euans recommendations above for efficiency in production and consumption of energy.
In my own 35 years on the knife-edge of energy, environment, and regulations I have tended to be cautious and I can agree with you that we can gravitate towards viewpoints we associate with. However, as an engineer (a recovering one as I like to tell people), I like to see if the observations match up with the science (in this case, physics).
To paraphrase Rorty, the world does not line itself up in sentence-length chunks we call "facts." As he said (and I concur), that the descriptive vocabulary of Newton more accurately describes the world we observe than the vocabulary of Aristotle does not mean the world speaks Newtonian. It does not speak, only we do. And once programmed with a vocabulary, we can distinguish and describe an occurring world in that vocabulary. That is true for all of us and depends (as your personal example suggests) what vocabulary each of us is programmed with and whether different programming (a different vocabulary) comports more accurately with observation.
The issues of energy usage and specifically fossil fuels and the associated effect on atmospheric concentrations of CO2 (and other GHGs) is a matter of rather simple math and chemistry/ physics. I won't restate the 5 basic principles associated with AGW. I suggest that that two are very clearly linked because of the same physics that allow you and I to communicate through this computer medium.
Because they are linked and we have some choices (still) that we can make associated with our energy (and environmental) future we can endeavor to approach these issue holistically. For some, the old vices will die hard (Ref: The Doobie Brothers, "What were once vices are now habits").
Whether we can actually put as much GHG into the atmosphere as some of the scenarios suggest is questionable (but I also realize that we can end up with quite a bit more with some really poor choices) As I said, I'm worried about the time-delay effects that have positive feedback as part of the physical/physics process. Humanity in a Wylie Coyote moment would not be a pretty sight.
Here's a nice blog post I read today that gives a nice overview of things as they stand. It includes some info on time delay.
Andrew Glikson: 21st Century climate tipping points
http://climatechangepsychology.blogspot.com/2008/11/andrew-glikson-21st-...
Cheers
"It seems that the precautionary principle should rule the day."
Thank you as always for clear perspectives.
"Though we don't intend on posting content on climate often..."
In the process of my edification, I find PO and energy in general to be the hub of the wheel. It is impossible for me to separate interrelated systems. Climate-->energy-->food-->energy-->population-->energy-->water-->energy-->habitat-->energy-->money-->energy-->climate-->energy etc.
I am confident TOD will publish what's essential to challenge TPTB.
Thanks Euan and Luis for this excellent post. Awsome discussions.
How can you have a drought on a planet that has 78% of its surface covered by water? But we know better (or at least some of us do) that if the climate changes just enough to wipe out the food chain, the argument of whether there is enough fossil fuel reserve to produce some very high CO2 concentrations in the future really becomes a moot point.
Well said, and Australia seems to be taking the brunt of just this kind of climate shift, with "The Big Dry" causing widespread desertification in the Murray-Darling basin.
It's also worth considering the catastrophic effects of ocean acidification -- if we create the conditions for a new Canfield ocean, we can expect global civilization to fare poorly.
The idea was not to blame the IPCC, but to blame the IEA for not providing a comprehensive forecast of future fossil fuels availability and production rates. That's what they exist for and it seems they didn't even attempted at to do it. There is no real basis of comparison between the IEA's and the IPCC's scenarios.
Where I live more than 80% of the energy used comes from fossil fuels, all of it imported. Depletion can be all but a moot point to me.
Weatherman, it is real climates article which agrees with Hansens assessment.
http://www.realclimate.org/index.php/archives/2008/04/target-co2/langswi...
Its 425 ppmv in fact for Antarctica although there is some uncertainty.
Luis,
the web page for MAGICC at the link you gave says that they have a new version. It says MAGICC's default sensitivity has been lifted to 3.0 C from 2.6 per doubled CO2 amongst other changes.
Don't you hate it when they change things on you? :-)
As referenced in the text we used MAGICC 5.3, the same version used by the IEA. That would be the only way to replicate their scenarios.
So, if we assume that IPCC is overly conservative about climate and reality is more along the lines proposed by Hansen, rather like assuming IEA is overly conservative about oil and reality is more along the lines of Khebab et. al., then how pickled would we be?
If we end up at the upper end of the estimates (6C global mean temp rise), we'll turn Earth into a different planet. The most obvious feature would be euxinic, microbe-dominated seas that emit enormous quantities of H2S (the Canfield ocean).
So, we'd be pretty pickled.
I find it difficult to imagine a worse situation than the one we are in. It would be better if a giant asteroid was coming towards us, or some alien invader was threatening us. In the later cases we might pull our collective heads out of our own digestive systems and throw whatever resources it takes to deal with the obvious critical state of emergency.
Instead, I find presents arriving to my front door from far flung relatives who I've told all about peak oil, climate change, persistent organic pollutants, plastic oceans, rate of habitat destruction and species extinction...etc., and I've tried to explain how this is all connected to our over consumptive life styles and how I am trying to "get off the sauce" so to speak. I even discuss happiness and what is needed for it and not needed for it...the aspiration gap...cycles of addiction...effects of advertising on behavior...problems with the money system...on and on.
But still, the presents show up. Blenders and cookbooks. Subscriptions to consumer lifestyle magazines.
Oh how I wish some aliens would try to invade us so we can come to our senses and stop our madness. Better yet, they'd be benign aliens who'd set it all straight!
Hollywood's on it:
The worst scenario would be Peak Warming, e.g. Global Cooling in conjunction with Peak Oil ----> declining average annual temperatures in the face of declining fuels availability. We are lucky to be in a persistent warming phase. Hope it holds. Fairbridge's "solar inertial motion theory" of global warming forecasts we are now transitioning into a cooling phase for the next several decades. So, yes, things can get worse.
You're missing a couple of things.
In the IPCC-reviewed scenarios, the temperature change is the eventual temperature change, not the change by 2100. X amount of CO2 does not affect the climate immediately, it takes some time to warm up - just as if you leave your car in the sun on a hot day, it doesn't reach its maximum temperature after ten minutes. Our atmosphere and oceans and icesheets have a very large volume and mass, in most scenarios it takes a few centuries for things to reach a new equilibrium. "By 2100" is not long enough.
Whether the IEA is aware of this distinction I don't know. But the IPCC certainly is.
Second, while the IPCC-reviewed scenarios are typically ignorant of peak fossil fuel issues, as of 2005 only 55% of human-caused emissions were from burning fossil fuels. The rest is from deforestation, methane from livestock and rice paddies, nitrous oxides from manure and artificial nitrogen fertilisers, concrete manufacture, and a bit from CFCs.
Your posted scenario assumes all those things stay at their current levels while we burn as much fossil fuels as we can. But it's a bit hard to imagine a realistic scenario where part of the world is madly burning every last chunk of the world but they don't also eat more meat and build more cities.
In fact, in a fossil fuel constrained world, we can easily imagine that deforestation will increase rather than stay static or decline. If cooking fuel is unaffordable, people will cut down trees - this is the ultimate cause of Haiti's famine, after all. And if artificial fertilisers are too expensive, people will seek new and fertile land by cutting down more forests. As that land can only be used for a few years (the topsoil is shallow, and the sort of people who clearfell forests are the sort who are bad at building up soil fertility), after that it'll only be good for pasture - thus more livestock.
As world population reaches a peak 30-40% higher than today, we can also expect the use of manure and artificial fertilisers to increase, too.
So even accounting for peak fossil fuels, it's quite possible for us to have higher emissions than those in the de Sousa/Mearns scenario.
This is just another of an innumerable amount of comments criticizing the way MAGICC works, either be it for not including enough feedbacks in calculating future CO2 concentrations or for not correctly translating those concentrations into temperatures.
Once again I stress that it was never our intention to evaluate MAGICC but simply to assess the assumptions and implications of the IEA's scenarios. If you or anyone else as any concern about the way MAGICC operates please consider contacting the development team.
Hi
I disagree. The above is not critic about how MAGICC works. It's critic about how you interpret that the IEA scenario is wrong. According to you, IEA calculations (esps. sensitivity) look suspect. This is not necessarily the case:
You write (what I find slightly incorrect):
"As for temperatures, the picture is not as clear. The output of MAGICC 5.3 indicates an increase of 2.5 ºC to 3.5 ºC over 1990 levels by 2100, quite far from the 6 ºC indicated in the WEO 2008 report."
Example: Take 270 ppm CO2. double. and double again. That is 1080 ppm CO2 (as IEA scen.).
If we assume that as CO2 eq., then IEA is "correct", for their (uppper)
scenario, that the temperature increase (after long time) can be (3° x2) = around 6°. Do you agree on that?
The differences in "your assumptions" and "IEA" is:
* IEA probably think in terms of CO2 eq. from 1750 to 2100
* IEA probably compares temperature 1750 to "earth at equilibrium", say 2400+ AD
* You compare instead 1990 with 2100 -> smaller change in T only 3°.
Do you agree on that?
Your conclusion that the IEA value of 6° must indicate "some fiddling", is not necessarily true.
I agree with it if you point the page of the report where it says so.
No. The report never compares temperatures with 1750. In all scenarios where concentrations peak, so do temperatures, following the CO2 decline.
Thats page 401: "next century are in line with the 660 to 790 ppm CO2 (855 to 1 130 ppm CO2-eq) ranges assessed from the five scenarios considered (IPCC, 2007). This leads to a temperature rise above pre-industrial levels of about 6ºC."
They DO compare with 1750, pre-industrial. And that sentence can very well be that they mean "6ºC", AT EQUILIBRIUM! It is not clearly stated that it is NOT.
Looks to me that your critic of the IEA was a bit too fast, at least the part where you interpret that theirs result would be because they have "fiddled" with the climate sensitivity. This is not necessarily the case.
I didn't mention MAGICC once. I read your paper before responding to it, please do the same for my comment.
I said that the temperature change referred to in the IPCC-reviewed scenarios is the eventual change, not the change by 2100; I also said that in your scenario you are forgetting that fossil fuel burning is only about half of greenhouse gas emissions.
Those are important points which have absolutely nothing to do whether MAGICC is any good or not.
Yes they do have, because if you have read the article you would have realized that non-energy related emissions were part of the input to MAGICC in all scenarios. You would have also realized that energy-related emissions are now 61% of man-made emissions and their share will increase in coming years.
Yes, and those inputs are far removed from reality. 2.6 for sensitivity? No inclusion of sea ice dynamics, ice sheet dynamics, methane eruptions, huge revisions in total carbon in the Arctic, etc?
Do you accept the Gulf states 1980's revisions at face value? I don't think you do. If you don't accept GIGO with regard to energy reserves, why do you accept GIGO for climate models?
Cheers
Hi
I understand that you are saying: if your olduvai scenario is correct,
AND the carbon cycle in MAGICC is correct,
THEN we can burn through the fossil fuels without too high CO2 conc.,
from these fossil fuels...
Can you say anything on the probabilities on your olduvai scenario,
or errors in prediction? Or on the MAGICC carbon cycle? Or the error band that your
scenario and the MAGICC carbon cycle give together, in CO2 concentrations (from fossil fuels)?
I know, thats a tough one...
To me that's not tough, that's the kind of challenge I like :).
?
So thus can you give a serious estimate? What are the error estimates for your olduvai scenario??? Say a "standard deviation", a confidence interval for your estimates of C emissions? Or not?
Since I'm working at NASA, I sent the oil drum article to Jim Hansen and got a following reply from one of his co-workers, bottom line: 350 is the target NOT 450.
---------------------------------------------------------
Jim Hansen forwarded me your email as he's swamped with work at the moment. I assume you're aware of our own paper on this topic -- if not, it's available here:
http://pubs.giss.nasa.gov/abstracts/2008/Kharecha_Hansen.html
Although I haven't fully read the piece you're referring to, it looks like they've simply developed their own scenarios using differing reserve/resource estimates, policies, etc., than the IEA report that they're criticizing. This is of course perfectly fine -- anyone is free to devise whatever scenarios they wish, as long as they have some basis in reality. Where I strongly disagree with the authors is in the following statement (from the Conclusions):
There seems to be a major implicit assumption in that statement, namely that the outcomes of the 450/550 ppm scenarios are indeed acceptable from a climate standpoint. However, as we've argued in another recently published paper (available here: http://pubs.giss.nasa.gov/abstracts/2008/Hansen_etal.html), even 450 ppm is highly undesirable -- the target CO2 level needs to be at most 350 ppm, and this needs to be achieved as soon as possible. (More and more fellow climate scientists now seem to be realizing that even the current CO2 level is already into the dangerous zone.) The problem with these authors' analysis is that even assuming their very low fuel supply estimates, it's very clear that there is more than enough currently available fossil carbon to keep CO2 well above 350 for the rest of this century and beyond. Thus, contrary to what the authors conclude, we simply cannot take the enormous risk of assuming that diminishing fossil fuel supplies will effectively 'solve' the climate crisis without enacting appropriate energy policies that proactively restrict fossil fuel use (coal in particular).
So, as for peak oil/gas/coal and climate, the bottom line is this: It can really go both ways -- early supply peaks might indeed be a good thing for climate (as these authors imply), but only if it spurs the world to realize that we need to move beyond fossil energy asap. However, it can also make things much worse, if countries/industries insist on using alternatives like coal-to-liquids, methane hydrates, tar sands, petro-shale, etc, to replace dwindling conventional fuels.
Regards,
--
Pushker Kharecha, PhD
Climate Scientist, NASA GISS / Columbia Univ. Earth Institute
Fig. (6). (a) Fossil fuel CO2 emissions with coal phase-out by 2030 based on IPCC [2] and EIA energy outlook 2006 estimated fossil fuel reserves. (b) Resulting atmospheric CO2 based on use of a dynamic-sink pulse response function representation of the Bern carbon cycle model
References
- Joos F, Bruno M, Fink R, et al. An efficient and accurate representation of complex oceanic and biospheric models of anthropogenic carbon uptake. Tellus B 1996; 48: 397-17.
- Kharecha P, Hansen J. Implications of “peak oil” for atmospheric CO2 and climate. Global Biogeochem Cycles 2008; 22: GB3012.
Fig. (2). Global temperature (left scale) and GHG forcing (right scale) due to CO2, CH4 and N2O from the Vostok ice core [17, 18]. Time scale is expanded for the industrial era. Ratio of temperature and forcing scales is 1.5°C per W/m2, i.e., the temperature scale gives the expected equilibrium response to GHG change including (slow feedback) surface albedo change. Modern forcings include human-made aerosols, volcanic aerosols and solar irradiance [5]. GHG forcing zero point is the mean for 10-8 ky BP (Fig. S6). Zero point of modern temperature and net climate forcing was set at 1850 [5], but this is also the zero point for 10-8 ky BP, as shown by the absence of a trend in Fig. (S6) and by the discussion of that figure.
I just want to say thanks for bringing people who really know what they are doing into this. I was considering an e-mail to Hansen myself, but figured it would never be read. Much, much appreciated.
What is striking about that graph is how it shows clearly reaching the maximum and starting the downhill slide into the next Ice Age, then the jump back up. You see that happen at around 410ky BP with a double peak, but nothing even close to the huge jump we are in now.
How people can have any doubt about this issue being real or not is beyond me.
Cheers
ccpo.
If I am looking at this graph correctly then global temperature (pale grey) from 0 to 2000 is more or less what you would expect while emerging from a glacial phase. Certainly, it is no higher than the Eemian peak or the Holocene Thermal Optimum. It is perhaps at the upper limits, but does not exceed either.
Whatever the 'huge jumps' are, they do not appear consistent with the actual global temperatures shown in Pale Grey. These seem a little too flat.
rgds
tropical dropstone
I added a couple of lines to Hansen's chart:
Purple curve: actual temperatures.
Green curve: GHG forcing.
Black curve: modelled temperature including fast and slow feedbacks.
The 2C gap between today's temperature and the equilibrium temperature is due to the "slow feedbacks" of ocean thermal inertia, ice-sheet albedo and maybe some other things.
Hansen called this warming "in the pipeline" and said it shows how today's ~385ppm is already a threat and we should be aiming for a long term concentration of 350ppm.
The colours on my screen are not perfect, so forgive me if I am persistantly wrong here. The black and green curves representing modelled temperature and GHG Forcing appear black.(Are these the curves that accelerate from zero at the zero time line to plus 3.75 and also the curve that has two significant negative spikes before accelerating to 2 degrees?
On my screen, the pale bluish grey curve (taking over from the orange Vostok temperature curve) is what I assume to be actual global temperatures.
If so, there is a significant departure from modelled temperature and actual temperature. This delta temperature seems to increase toward 2000. Surely then , the model departs from actual (or I suppose proxy temperatures from AD 0 to AD 1850) should be regarded as suspect.
If I were to look for immediate correlations on this graph, I would probably ignore the modelled forcing and temperatures and draw one striking conclusion. And that would be that Warm Periods are dangerously few and far between (cycle peaks appear to be about 125k years apart, do not last very long, and are followed by a prolonged ice-house period.
Correct me if I am reading the chart in error.
rgds
tropical dropstone
Seems more a bit of reading what you want to read? Yes, yes, yes, another ice age is coming! But that is not what is striking. As I tried to point out, in the non-AGW past those spikes you describe are obvious and clear. And short and sharp. So what *is* striking is that the indicators are all starting to swing back up. That is *not* in the climate record of the last 400k+ years.
That is what you should realize. It's a huge anomaly.
Should be? Surely you are an honest, objective sceptic and meant to say "might be?"
The explanation given you was clear in stating the modeled temps might be considered "in the pipeline," i.e., they are expected to be showing up in the real record later than they did in the modeling.
I also noted that in only one [previous cycle was there a double peak pattern, and that was past the 400k yr mark. In that case, there was a peak, then a slightly higher peak over what appears to be less than 5k yrs. In the current case, temps peaked and started to fall, but over the last 2k yrs. have risen back up to the levels at the maximum... with more FF's to burn, more feedbacks yet to come, etc.
I wish people would stop making the illogical leap that climate model scenarios = definitive prediction.
Cheers
ccpo,
Thankyou for your comments.
I have concerns over the delta with time on this graph when compared with actual readings. If the forecast is to be accepted then the delta between actual and forecast temperatures should close or at least stay similar but trend in parallel to the forecast. That way, the actual global temperature readings would confirm the validity of the modelled curves used and present an indisputable case for the continued validity of the modelled curves with time.
The actual +(proxy) Global Temperature on this graph shows a down ward trend in the in the pre industrial era and a slight upward trend in the post Industrial era (lets say for sake of agreement that the Industrial Era commences at AD 1750). However, the prehistoric temperature (Vostock ) and the prehistoric GHG Forcing map almost perfectly, yet the GHG Forcing dramatically departs proxy and actual temperature from AD 0 to present.
I presume that this is because’ All Forcings’ are negating the impact of ‘GHG only Forcings’ and this is because there are negative components within ‘All Forcings’ acting as a brake on ‘GHG Only Forcings’. And that the negative components of ‘All Forcings’ are now completely over ridden by GHG forcing to such an extent that All Forcings now maps a parallel track to GHG forcings. Hence the temperature increase in very recent times . Is this correct?
If this is so, then it would be logical to expect (and observe) that the GHG Forcing is in lock step with the Global CO2 measurements and that these in turn are in lock step with a measured, corresponding and increasing global temperature reading. So, we should be seeing a measured increase in temperatures and this increase should be significant and above background noise. I would at least expect to see observed readings higher than the Holocene Thermal Optimum at this moment in time if the GHG Forcing curve is to be accepted. But that does not appear to be the case, and It would appear that we are still in normal limits for the previous 400k years before present.
Looking at this graph in its entirety, I am much more concerned about the probability of going into an ice-house phase, which seems to be the normal phase for the earth for at least 80% of the last 400k years, than going into a greenhouse phase.
Rgds
Dropstone
There's a difference between modeled temperature and forcing, which may not be apparent above (read the chart labels carefully). The former projects what the temperature should be (and is not shown on the chart), and the latter simply shows the influences on the climate. Since the oceans have a tremendously large thermal time constant (think of it like a giant flywheel), the temperature change lags behind the forcing, though will eventually catch up.
Will,
could you put a figure on the temperature change lag? is it in the order of years or decades?
That depends on whether one decides to focus on the atmosphere, the ocean, or wants to model them both together. The atmosphere has a smaller time constant, so it could change more rapidly, though the coupling between the two is a subject far above a simple posting here. I would direct you first to a basic examination of the subject;
Nicola Scafetta, Comment on “Heat capacity, time constant, and sensitivity of Earth’s climate system” by Schwartz, Geophysical Research Letters, DOI:10.1029, Physics Department, Duke University
Thanks for your more-skillful-than-mine-would-have-been answers, Will.
Dropstone, I would like to add that the peak and dip and rise asked about is essentially occurring on two different graphs. The peak is on the part of the graph dealing with 50k year increments, so the period from the peak to the low in the trough - where the graph chnages fro m50k yr increments to 100 yr. increments - is on the order of 10k+ years, but the period from the low in the trough to the rise back to the level of the peak covers a part of the graph in 100 yr increments, thus covers a period from about 1850 to present.
That is, it took thousands of years to fall from the peak, but a tiny fraction of that time to get back to it. And temps and GHGs are still rising...
What bothers me about the questions you asked is this: why does the very polite denialist ignore the huge spike in CO2 and treat it as if it isn't more important than the current temp level, especially considering lags in the system? (This is why even very polite denialists irritate the hell out of me.) Remember: you don't see the details of the movements in the 50k section. You see a very broad average of the changes only. If the entire graph were on a 100 year scale, you'd see these lags all over the place.
Cheers
ccpo.
thankyou for your reply. Further to your comments regarding the scale change, I am completely aware of the change of scale pre and post AD.
Obviously 100 year increments would be very difficult to actually plot on a computer screen. However,if the graph retained the pre AD scale throughout, then of course the current (actual global temperature graph) would be lost in the Holocene Thermal Optimum and thereby be very difficult to see any trend. The post industrial era temperature trend would simply look normal and certainly not look any more significant and remain within the limits set by the Holocene TO and the Eemian TO. In other words, the post industrial warming is nothing strange and warming has been seen in prehistorical times. All that has changed is the supposed driver and the rate of acceleration.
What is your position on the recent cooling trend?
rgds
dropstone
However,if the graph retained the pre AD scale throughout, then of course the current (actual global temperature graph) would be lost in the Holocene Thermal Optimum and thereby be very difficult to see any trend.
It would look like a sharp spike upward.
The post industrial era temperature trend would simply look normal and certainly not look any more significant and remain within the limits set by the Holocene TO and the Eemian TO.
"Normal" from the perspective you allude to above? Perhaps at that level of cursory examination, but note that the CO2 levels are far above where they were at the heights of those two periods.
In other words, the post industrial warming is nothing strange and warming has been seen in prehistorical times.
You are presuming that there will be no more effect from the current (and increasing) levels of GHG; I instead will side with the climatologists on this point.
What is your position on the recent cooling trend?
What recent cooling trend are you referring to? From 1996? 1997? 1999? Using any of these as a starting point, the temperature on average has risen. Some people want to look only at 1998 as a starting point, but anyone who has any background in statistics knows that's cherry-picking, cooking the books, etc. And note that climatology normally uses 30 years as a minimum to assess trends.
Will.
Thankyou for your reply.
The current global temperature does not appear to be any higher than that shown in the Holocene Thermal Maximum. I do note that current CO2 levels are far above where they were for the Eemian and Holocene. In the graph pre AD 0 the proxy temperatures (Vostock) and GHG Forcing map each other superbly. However post AD 0, temperature and GHG forcing depart remakably and temperature does not map this trend.
Why would this be? What has happened to make this so? What has changed the relationship? Surely if C02 is the principle driver now and the pre common era Vostock GHG trends are in lock step with each other then surely you would be able to map this in post common era? Since the vertical axis is common in the graph then it seems to me that there is a discrepency regarding the actual warming compared with the GHG Forcing? So it would appear that warming is still in the limits set by the Eeemian and Holocene and that any supposed effect is in the 'future'
If there is a a thermal lag either at a decadal time shift or , as Chris Vernon Suggests, a Century + long lag , then the Oceanic heat sink could mask the actual temperature readings since 1860 or thereabouts and explain the delta between actual temperature and the GHG spike. Again the inevitable and record breaking temperature rise would be at some point in the 'future'.
The recent (small and young ) cooling trend to which I refer does not as yet offer any evidence of a change in climate. However , All that I have read in relation to IPCC and the models used suggest that no prediction regarding cooling was ever made and that temperature would rise in lock step with CO2. Of course, oceanic system changes such as the MOC and PDO could now be offered up as explainations (now), but why were these not factored into the IPCC models and only now are suggested as reasons why the actual temperatures show nearly a decade of flat or down trending while the CO2 readings remain on an upward trend. Using a rolling 5 year average for temperatures is accepted practice, but it should be noted that doing so buys time and any new and developing cooling trend will not be apparent for some further 5 or 10 years. Again, this puts measurable activity some point into the 'future'.
I do note that Climate Science regards a 30 year interval for a minimum to assess trends. At least when it supports the hypothesis. I have also noticed that transient events such as hot summers and cyclonic activity are frequently presented as 'evidence' when it suits. So cherry picking data is not especially a hallmark of a skeptic. Though of course many climatologists cringe when they see such transients presented as evidence of warming by an alarmist press, very few coreections are made.
rgds
dropstone
If there is a a thermal lag either at a decadal time shift or , as Chris Vernon Suggests, a Century + long lag , then the Oceanic heat sink could mask the actual temperature readings since 1860 or thereabouts and explain the delta between actual temperature and the GHG spike.
You've answered your own question.
Again the inevitable and record breaking temperature rise would be at some point in the 'future'.
"record breaking temperature" depends on the context; it appears you are referring to the maximums of the Holocene and Eemian. That assumes that the current "natural" forcing level would have been at those maximums, which is not the case.
Let's look at the conditions on the Earth at the time when fossil fuels began to be used in quantity;
Of course, oceanic system changes such as the MOC and PDO could now be offered up as explainations (now), but why were these not factored into the IPCC models and only now are suggested as reasons why the actual temperatures show nearly a decade of flat or down trending while the CO2 readings remain on an upward trend.
First, you need to define what it is you are referring to; is it the last 12 years or so of global climate data? If so, then please explain what you mean by "a decade of flat or down trending" in statistical terms. Again, use the 30 year examination as a guide to the climatological definition of trend. Stop here first before doing so, though.
Will,
I am a little tied up at the moment but I hope to rejoin this discussion soon. However, I am impressed with the graph. It is the first time I have seen a hockey stick for a while that has not had the MWP and LIA intentionally removed.
rgds
dropstone.
Will,
since I am pushed for time, I can supply a link to a Reuters article.
Reuters is quite balanced and gives fair comment from both sides.
http://uk.reuters.com/article/environmentNews/idUKL0982254220080509?page...
I think there is some measure of doubt. And perhaps Oceanic negative forcing plays a role and that this role was not anticipated by the models.
rgds
dropstone
Yes, and note that The original Nature article's lead author, Leibniz Institute's Noel Keenlyside, acknowledged on Friday that recent data showed much more warming that he had forecast through 2007, but stood by a "stabilization" of temperatures from 2005-2015.
2005-2015 is only a decade. Remember to think in at least 30 year cycles.
http://en.wikipedia.org/wiki/Global_warming
This is not science, this is from Wikipedia;-)
I think a faction of the scientific community are likely working on quantifying the global extent and influence of the WMP and LIA which no doubt will throw up some interesting findings in the years ahead.
The National Research Council has already done that;
You'll see that this graph is identical to the one I provided previously above, except that the one provided previously has additional multi-proxy series. For the previous graph, the series are;
1. (dark blue 1000-1991): P.D. Jones, K.R. Briffa, T.P. Barnett, and S.F.B. Tett (1998). , The Holocene, 8: 455-471.
2. (blue 1000-1980): M.E. Mann, R.S. Bradley, and M.K. Hughes (1999). , Geophysical Research Letters, 26(6): 759-762.
3. (light blue 1000-1965): Crowley and Lowery (2000). , Ambio, 29: 51-54. Modified as published in Crowley (2000). , Science, 289: 270-277.
4. (lightest blue 1402-1960): K.R. Briffa, T.J. Osborn, F.H. Schweingruber, I.C. Harris, P.D. Jones, S.G. Shiyatov, S.G. and E.A. Vaganov (2001). , J. Geophys. Res., 106: 2929-2941.
5. (light green 831-1992): J. Esper, E.R. Cook, and F.H. Schweingruber (2002). , Science, 295(5563): 2250-2253.
6. (yellow 200-1980): M.E. Mann and P.D. Jones (2003). , Geophysical Research Letters, 30(15): 1820. DOI:10.1029/2003GL017814.
7. (orange 200-1995): P.D. Jones and M.E. Mann (2004). , Reviews of Geophysics, 42: RG2002. DOI:10.1029/2003RG000143
8. (red-orange 1500-1980): S. Huang (2004). , Geophys. Res Lett., 31: L13205. DOI:10.1029/2004GL019781
9. (red 1-1979): A. Moberg, D.M. Sonechkin, K. Holmgren, N.M. Datsenko and W. Karlén (2005). , Nature, 443: 613-617. DOI:10.1038/nature03265
10. (dark red 1600-1990): J.H. Oerlemans (2005). , Science, 308: 675-677. DOI:10.1126/science.1107046
Interestingly enough, the Wikipedia Global Warming article has received high marks.
In order to ensure our scientific sources are sound, shall we focus on peer-reviewed articles from respected journals in the future? I'm certainly all for that.
On a 100 yr scale? This is simply false. I don't see how you could even make such a statement unless you just don't understand what we are discussing at all.
As will pointed out, the the current trend is a spike. I repeat: 10k+ years to fall, 150 to return to the same level. If that's not a spike, I don't know what is. The rates of change are orders of magnitude different.
Uh, isn't the entire issue that the driver (nature --> human) and the rate of acceleration (steady --> extremely rapid) are entering danger zones? (Rhetorical question.)
My position is: if you think there's been a recent cooling trend, you don't understand "trend" as used in climate science. As Will pointed out, the **only** way to claim we are in a cooling "trend" is to start at 1998 and ignore previous hundreds and thousands of years before that.
And do keep in mind, global weather patterns do have cycles. These cycles do affect weather. They do not = climate, however.
http://processtrends.com/images/glob_warm_giss_tmp_anom.gif
http://www.nytimes.com/2008/03/02/science/02cold.html
This should help you understand graphs and trends a little better, as well as the lying liars you seem to think truthiness truthers.
http://www.realclimate.org/index.php/archives/2008/05/how-to-cook-a-grap...
My last point and last response. You, like every denier before you, are picking a data point here or there, or one single element out of thousands. Do you think that is wise or even honest? Temps are not the only indicator. There is ice melting all over the planet. There is the rate of change in temps. There is increasing intensity in hurricanes. There are climate zones moving and/or disappearing. There is land going under water. There are animals, insects, etc., going extinct. There are habitats changing, moving, disappearing. There are ice cores. There are sediments. There is melting permafrost. Etc.,etc. etc.
Reconcile your notions with ALL this, then come see me.
Enough. Being polite doesn't buy you a free pass. It's just a schtick to get your silliness in print and engaged with. Congrats. Free propaganda terminated.
Cheers
Ccpo
Thanks for your feedback.
You say that the current trend is a spike. However it is not particularly greater than the Holocene Maximum which reached higher the present by 1.6 degrees. The Eemian 130k-115kbce was yet a still stronger warming period with temperate climax vegetation found as far north as the North Cape and Baffin Island . If this were the case, then I would anticipate the retreat of circumpolar ice to have occurred at least twice in the Pliestocene, so suggesting something significant regarding Ice retreat is to me still within the reasonable bounds of fluctuation and is not especially significant. Furthermore, I understand that retreat may have slowed or stopped in recent years at least at some locations.
Regarding rapid transitions , I agree that we are seeing a rapid change. Is this change particularly anomalous? It may be, however rapid phase shifts have happened before , one of which was negative and profoundly disturbing which saw a an average 5 degree drop in perhaps less than a decade and remaining so for 1300 years.
Overall it has been nice chatting with you, but I do not think you have suggested anything to me to change my opinion that we are still in the normal heat envelope of the Interglacial –glacial cycle and that rather than be concerned about global warming induced by Anthropogenic Carbon I would fear cooling more than heating. To me, our extremely complex climate system cannot seriously be predicted by modelling atmospheric CO2 as the only or even main driving mechanism and with actual measurements going back over a few decades. So, I remain sceptical of the existence of any problem at all and this problem will resolve itself by a depletion of carbon based fuels in the medium to long term through this century.
Best wishes
Dropstone.
You are confusing spike with maximum temp.
That is because, as a denialist, you cannot allow yourself to think systemically. You look at discreet data rather than the totality of the data. Under current conditions, it was expected to not be happening at all. But, go ahead, obfuscate by pretending "ice melting happens" = "the manner, type and time frame of the current melt appears to be alarming." Denialists do this sort of crap. Every time.
You are again either confused or conflating. I was talking about RCC (rapid climate change), as different from just faster than expected. While we could be at the beginning of a RCC event, I have not claimed we are.
Twas never my intent. I respond to you to prevent the spread of such claptrap. My main concern wrt my students is teaching them to think.
Uh, do you not understand CC does not = only warming is possible? (Or is this just another intentionally misleading denialist statement?) That's why they call it CLIMATE change now. If we get another Younger Dryas, it will ALSO be due to climate change. Two sides of the same coin. Yes, warming seems more likely, but shut down the thermohaline and..... ?
Jesus... now I know you're just another denialist plant.
1. Modeling does not predict. If you don't even know that, you really shouldn't open your mouth at all.
2. CO2 is not the driver. It's the sun in its 100,000 year cycle. CO2 is just the most important GHG working as a feedback.
3. Measuring goes back millions of years. Why do you lie about this?
ccpo.
Thanks for responding, but I would suggest the following
1. If modelling does not predict, then what is the value of a model? Further increases in temperature with time due to CO2 increases are a prediction. The IPCC model and predict temperatures.
2. So you do accept that the Sun plays a part in Global temperature? Do you accept it is the main driver (variations in Solar Intensity) or is it orbital forcing with variations in the aspect and proximity to the Sun?
CO2 is definately not the most important GHG by any measure. The most important GHG is in fact Water Vapour and by a very wide margin indeed when compared with CO2 or CH4.
3. Only proxy measurements can go back in millions of years. Actual measurement goes back only to the Renaissance.
1. Modeling, if designed to do so, can assist in making projections (e.g., "under these future scenarios with these parameters, x will occur with y level of confidence"), which are different from predictions (e.g., "Japan will suffer a meteor impact in 2104, then sink into the ocean without a trace"). Predictions are constrained by variations in parameters (e.g., consumption rates of fossil fuels, changes in energy efficiency, runaway feedbacks, etc).
2. Can't speak for ccpo, but yes, the sun certainly plays a major role in Earth's climate, providing warmth well above the freezing level of water for a major part of the Earth. The questions are;
- What timespan are you speaking of (e.g., decades, centuries, millenia, etc)?
- What timeframe are you speaking of (e.g., Eemian, Holocene, last 2000 years, last 200 years, late 20th century, etc)?
I don't see one single answer to this question. You haven't asked if the sun is the main driver in climate change over the last 30 years.
Your opinion of GHG doesn't seem to touch on the deltas in their presence in the atmosphere. Certainly water vapor is more abundant and powerful, but significant changes in CO2 can create significant changes in climate, so it doesn't matter which is bigger; it matter how much, where, and when each change.
Dear Will,
1. Modelling is specifically designed to predict an outcome. How can it be any other way? Good models would probably predict a low case, medium case and high case scenario(s). You would not model historic evidence as there would be no rational point. Evidence trumps a model.
You can vary the outcome of any model by changing the parameters.
I maintain that modelling future outcomes (ie prediction) is the principle reason we are discussing this issue. So models are, by there very nature and purpose, predictive tools. Furthermore the reputation of the model (and thereby modeller) should stand or fall on the predictive quality of the model. To be sure, as data and computing power become available, then the model should become better at prediction. Although you take issue with me regarding the recent (slight) drop in temperature since a peak in 1998, and some may say this is a minor negative fluctuation on a consistent positive trend, as far as I am aware, not only did no model predict this, but also the Met Office predicted that 2007 would be the hottest on record.
Of course, predictions are difficult. Especially about the future.
2. We should consider variations in Solar activity. This variation could be due to: Output, proximity, aspect and several cycles, both Solar and Earth-orbital. Forgive me, but I dont quite understand your point here. The Vostok ice core graph that you put up on the thread earlier shows a very decent cyclicity. If I remember correctly, this graph travelled back to approximately 800 000 years bce. I think it safe to assume that there are several cyclic phenomena superimposed on each other from decadal through Bond and Milankovic. So your answer is All, but the time frame we should consider is the Pleistocene to present. Perhaps the Pliocene, but before that, continental drift should start to be considered, especially the creation of the Central American Isthmus and its affect on the Pacific-Atlantic Oceanic current
3. How much forcing is due to the CO2 Delta? From the start of the industrial age to present? How much additional delta in temperature should be predicted? How much has be measured? There is also some measure of doubt if CO2 leads temperature or Temperature leads CO2.
3. There is no one number for forcings, as they vary over time, but this chart should give you what you are seeking;
I realize that the current measurements in the interglacials show that CO2 rise followed temperature rise by ~800 years, give or take. Did you then want to make a statement on that point followed up with a reference to a peer-reviewed paper?
Will. Thankyou for the link.
My maths was never that good and is now rusty, but if I read it right then deep ocean temperature lag is 8+/-2a (being years) and 12 +/2a (being years). So a 1 - 2 decade lag is a reasonable figure for Oceans, perhaps a lot less so for Shelf Seas and and an order of months for the atmosphere. But the primary component will be (of course) Oceanic systems.
Deep ocean lag? Try hundreds of years.
Chris.
Thanks for that. It could be then that Oceanic Thermal lag would either completely mask CO2 impact by hiding an inevitable and highly dangerous temperature increas or equally it could reduce GHG Forcing to a minor an bit part player. I recommend a look at the following.
Compo, G.P. and P.D. Sardeshmukh. 2008. Oceanic influences on recent continental warming. Climate Dynamics, DOI 10.1007/s00382-008-0448-9.
rgds
dropstone
Dropstone, thanks for joining this debate and for showing great patience. I was wondering if you might say a few words about your background. A dropstone of course is a rock dropped from a melting ice berg / flow that provides some insight to past patterns of glaciation. So I wonder if you are perhaps a Quaternary geologist? In a past life I worked extensively on the provenance of sediments (Phanerozoic) in the circum Atlantic region, so maybe we have a point of common interest. Send me an email if you don't want to answer here, to be found in my details section.
I pretty much agree with most of your comments - it is surprising how different people can look at the same data and reach different conclusions, though I suspect there is some genuine confusion about the temperature - forcings chart that has two different Y axes scales and a variable x-axis scale that does make it difficult to read. No criticism implied to the author of the excellent chart.
Thanks for bringing Compo and Sardeshmukh to our attention. We have been looking at this in recent weeks and I've put a copy on the server. This pretty well addresses one of the main queries that 'skeptics" have and attempts to quantify the effect of natural ocean cycles upon SST data. They also venture into the domain of natural variations in atmospheric H2O and this is an area I feel needs to be addressed by climate science from both the GHG and precipitation distribution angles.
I was wondering if you have any background in examining ocean sediment data and are aware of anyone looking into the sedimentary record of the Arctic ocean floor. The last two years have afforded the opportunity to acquire cores from areas overlain by sea ice for the period of recent history. These ocean sediments should contain a record of the permanency of sea ice cover since the end of the Younger Dryas.
I was also wondering if you have experience looking into the former extent of the Caledonian Forest in Scotland? I have vague memories of seeing the roots of forrest being exhumed in upland areas of Scotland above the current tree line - Loch Ericht and Glen Affric are two areas that spring to mind. And so I'm wondering if the Caledonian Forest was once more extensive during he MWP than it is now.
Euan,
Although I am not an Earth Scientist in the strict definition of the term, I have a Degree in Earth Science and a more than passing interest in the Quaternary and the glacial landforms of Britain.
I too have seen evidence of temperate climax vegetation in Northern Scotland, way beyond the current tree line, though of course Scotland was scraped clean of almost all evidence after the last glaciation. I have also seen evidence of such vegetation in northern waters in early returns to surface while drilling. This and other evidence such as low latitude dropstones suggests to me a very highly variable, sometimes harsh and sometimes benign climate system. In my opinion, there is still a lot to debate about the Climate Change and its driving mechanisms in the past and even more so about the future of global temperatures. This was a good posting on a critical subject.
I may contact you later.
best wishes
dropstone
Euan.
This is an extract from the Quaternary Geology site and is worth inspection .
http://www3.hi.is/~oi/quaternary_geology.htm
This next section refers to the Pliocene and is quoted directly from this site.
Paleogeographic reconstruction of the Pliocene (5.4-1.8 Ma) in the Arctic
The Arctic is not a uniform environment today. Different geological histories, large differences in topography and proximity to the Arctic Ocean between regions, as well as varying weather patterns, bring diversity to the present Arctic environment and has done so through time. Climatically, the Arctic today is often defined as the area north of the 10°C July isotherm, i.e. north of a line or region that has a mean July temperature of 10°C. In some areas the treeline roughly coincides with the 10°C July isotherm and defines the southern boundary of the Arctic. The treeline defines a transition zone where continuous forest gives way to tundra with sporadic stands of trees and finally to treeless tundra. The Arctic is thus by definition primarily a treeless area with low summer temperatures. But it has not always been so.
During the Pliocene, global temperatures, particularly at high latitudes, are believed to have been significantly warmer than today. (Source: http://www.giss.nasa.gov/research/paleo/pliocene)
Generally, the Pliocene world was warmer than at present. The ancient distribution of warm-climate ocean plankton, and of animal and plant fossils on land, shows that globally the greatest warming relative to the present situation was in the Arctic and cool-temperate latitudes of the Northern Hemisphere. There, summer and annual mean temperatures were often warm enough to allow species of animals and plants to exist hundreds of kilometers north of the ranges of their nearest present-day relatives. In the Arctic, boreal-type forests dominated all the way to the present Arctic Ocean where tundra exists today. This has been verified by finds of fossil wood at a number of sites in northern Greenland and Arctic Canada. Fossil wood logs that have been identified include Larix, Pinus and Picea. Fossil mammalian remains include the extinct rabbit Hypolagus, and fossil insects and marine mollusks from a number of sites around the Arctic confirm with a considerably warmer-than-present environment prior to the onset of Pleistocene cooling and expanding Arctic glaciers. Paleogeographical reconstructions for the Pliocene in the Arctic suggest that summer sea surface temperatures (SST) in the Arctic Ocean were at least 1-3oC higher than today, and sea ice cover was considerably reduced or even absent during long periods of time. There was considerably more rainfall over the Arctic, originating over the warmer Arctic Ocean, and permafrost was probably restricted to higher terrain. Because there were less ice volumes at high latitudes, global sea level may have been as much as 30m higher than at present during the warmest intervals. The peak phases of warmth during the Pliocene were mostly during the interval 3-4 Ma (the mid-Pliocene), although almost all of the Pliocene was warmer than today's world.
It could be then that Oceanic Thermal lag would either completely mask CO2 impact by hiding an inevitable and highly dangerous temperature increas or equally it could reduce GHG Forcing to a minor an bit part player.
dropstone,
Ocean surface temperature can change much more rapidly than deep ocean temperature, so your two choices are too few. Ocean thermal lag could partially mask (actually slow) temperature rise in the atmosphere, for example.
Will, Sorry it has taken me so long to get back to this site.
What happens if we have been going through a period of warming , which is a fair assessment as we pull out of the LIA and the seas have warmed up? This is taken from CBATS
http://www.coexploration.org/bbsr/classroombats/html/co2_in_the_sea.html
Hands-on Activity
This simple hands-on activity will help your students explore the relationship between water temperature and the amount of carbon dioxide gas the water can hold. Have your students cool a 1-liter plastic bottle of carbonated water by placing it in an ice bath or refrigerator. Have them warm another bottle of carbonated water in the sun. Wait until the bottles have cooled or warmed sufficiently, then retrieve them. While waiting, discuss how carbonated water differs from regular water, and have the students hypothesize about what will happen when they open the warmed and chilled bottles. Encourage them to discuss each other's hypotheses.
What controls how much carbon dioxide gas the ocean holds? Well, think of a can of soda pop. Just like the ocean, pop or other carbonated drinks contain dissolved carbon dioxide gas. And what happens when you open a pop can that has been sitting in the warm sun?— Phoooosssh!! Bubbles of carbon dioxide gas shoot out, spraying you with soda. When you open a chilled bottle, it bubbles little or not at all. So, the warmer a liquid, the less gas it can hold. The cooler a liquid, the more gas it can hold. The same is true for the ocean. If sea water heats up, it tends to release carbon dioxide. If sea water cools down, it tends to soak up carbon dioxide. Carbon dioxide levels in the ocean also depend on other things, like how acidic the water is. But for right now, let's focus on the effects of temperature
So oceanic warming may explain CO2 rises rather than Anthropogenic CO2 warming the Oceans. If so, we need to look for another main driver.
What happens if we have been going through a period of warming , which is a fair assessment as we pull out of the LIA and the seas have warmed up?
I'm sorry, I'm not clear on your question. Do you mean some sort of naturally forced warming "out of the LIA"? Do you mean that the oceans, instead of absorbing extra CO2 over the last many decades, have been (on balance) expelling it instead? Please clarify, and provide peer-reviewed material to bolster whatever point you are wanting to make. For a basic background in absorption rates and mixing cycles, read this. For a basic look at increasing C02 acidification, look here. For more details, see this article by the Royal Society.
Dear Will,
I refer to the the general and over all warming trend as we climb out of the last major ice-house phase. The MWP and LIA are oscillations on this general trend and these will have impacts on temperature as well. If there is a lag between Warming and CO2 of say 800 years, we could be measuring a CO2 pulse from the MWP could we not?
When you say "major ice-house phase", I'm assuming you mean the entry into the Holocene. IF there is a lag leading into the warming of the Holocene, why would the circumstances be the same for a very tiny change from the MWP to the LIA? Do you have a peer-reviewed paper on this you would like to discuss? The latter is very important to further discussion.
Dear Will,
the last major ice house phase was the Wurm Glaciation. The Holocene is a warm phase. Vernon said that Oceanic thermal lag was of centuries. Some have suggested that the CO2 - Temperature curves are out of synch by about 800 years. If so, then I am merely suggesting a link with the MWP.
However, compared with the Wurm Glaciation and remarkable flip to the Holocene Warming as shown on your earlier graph and illustrated by the Eemian and simliar, earlier transitions, I would suggest a regular cyclical event causing an ice house state with a rapid transition to a warm state. What would cause the dramatic transition?
Given that over the last 2million years, the natural state of the Earth appears to be Glacial with a regular pattern of short lived interglacials.
Do we live in a different environment? Has something changed so much (ie CO2 manufacture)that we can now guarantee that we are no longer subject to Ice House Phases? And, ultimately, is a warmer planet to be more feared than an Ice House Planet?
With respect to the current cooling phase, I would be the first to state that a decade or so of cooling temperatures is not absolute confirmation of a new shift from warming to cooling. But equally, this departure from the upward tendline is potentially the start of an overall cooling trend. It requires monitoring. It does not 'kill off' the Theory of AGW, but it does cause pause for thought. This was not supposed to happen, this was not predicted or modelled. There appears to be substantial back peddaling going on to 'explain' this rather unfortunate 'anomaly' and a new prediction that warming will recommence in 2015.
With respect to your later comment regarding the IPCC and it's 'afermation' regarding warming, afermation is no more Scientific proof of warming than say retaking marriage vows after 25 years of marriage. It is emotion, not science.
We have taken up enough space now on Mearns and de Suza's thread . I am sure that this was not what they wished, but it is an inevitable consequence of predicting CO2-AGW on any site. We may joust again some other time. And thankyou for your good points. Though I remain a sceptic, I have been given some food for thought.
I especially enjoyed your pictures of sea water temperature buckets.
My best wishes
Dropstone
With respect to your later comment regarding the IPCC and it's 'afermation' regarding warming, afermation is no more Scientific proof of warming than say retaking marriage vows after 25 years of marriage. It is emotion, not science.
Since we can't fast forward to 2100 to get real "proof", I'll accept their ability to assess the situation to the best of their abilities. You call it "emotion", I call it "projection through the application of science".
Cooling trend? Looking at the last two months, it appears to be warming...
The October anomaly is 0.440.
*It is 0.073 degrees warmer than October 2007
*It is 0.069 degrees warmer than September 2008
The anomaly for November was 0.216 (in terms of degrees Celsius).
* This reading was 0.085 degrees warmer than November 2007
* It was 0.035 degrees warmer than Octber 2008
Nice point, but of even more concern to me than the 2 degree gap between current temp and total forcings is the 3+ degree gap between current total forcings (black line) and GHG forcings (green line). (Sorry, I don't have the great graphing skills to line these up, but eyeballing it I get something over 3 degrees of difference there.)
I have to assume that gap represents primarily the screening effects of aerosols emitted particularly by dirty coal plants (without scrubbers). As I pointed out above, these largely fall out of the atmosphere in days or at most months. So we are only days or a few months away from a planet that is 3+ degrees Celsius warmer (= over 5 degrees F)???!!!
This is even worse than I had thought. Are there other "negative forcings" that account for that gap that are of longer duration?
All in all then, there are over 5 degrees C (nearly 10 degrees F) "in the pipeline"!!!
Can we please get a new pipeline?
This is the best I could quickly find:
http://www.globalwarmingart.com/wiki/Image:IPCC_Radiative_Forcings_gif
It's a bit out of date, as our understanding is improving. But you can clearly see that about half of of all current GHG forcing is currently offset by aerosols emissions.
Probably 0.5-1K extra warming within 10 years of shutting down all the coal plants, plus a similar amount in the pipeline - essentially, if industrial civilisation switched off tomorrow, we would expect to see another 1K of warming over the subsequent 20-odd years. Not quite as bad as 5K..
What is most striking about this graphic is the rate of change of warming compared to the rate of change of cooling for each cycle and the relative consistency of the cycles with regard to the final peak temperature, and the warming spike just before long term cooling sets in. Looks like we have a bit of naturally forced warming to go in this cycle before we start down the other side, which should not happen anytime soon, from our perspective.
Realist - thanks for your postings and for trying to engage your colleagues at NASA GIS in the energy decline debate.
I have a question from your climate forcings v temperature chart. The black line has much high amplitude noise, in particular a couple of large negative spikes which I'm guessing are Krakatau and Agung. One thing that has always puzzled me is why Krakatau doesn't seem to show in the temperature record. I think we know for sure that the global weather changed for a number of years but temperatures seem to have barely flinched. I wrote to Peter Stott a while back asking about this and didn't get an entirely satisfactory response.
Would you care to comment on volcanic aerosol forcings, their observed v theoretical impact on temperatures and implications for climate models?
Note that different volcanic eruptions have differing ejecta contents (and [2]).
Do you have a subscription to Nature? If so, see this article;
P. J. Gleckler, et al, Volcanoes and climate: Krakatoa's signature persists in the ocean, Nature 439, 675 (9 February 2006) | doi:10.1038/439675a;
Will, thanks for this link which I have read. If you have not seen it, this paper is also worth reading:
Significant decadal-scale impact of volcanic eruptions on sea level and ocean heat content
JohnA. Church1,2, Neil J. White1,2&JulieM. Arblaster3,4
Nature Vol 438|3November2005|doi:10.1038/nature04237
So it is postulated that the Krakatua eruption has left a scar on ocean temperatures at depth (albeit small dt and the scale on the chart has an error), and that ocean surface temperatures cooled following the eruption. This is all fair and good, but the only direct measurements we have are from thermometers which show little to no effect upon mean atmosphere temperatures at the time. The temperature models show a significant drop not present in the actual data (I'm referring to Stott et al 2001?) and as shown above in realist's chart.
Do you have a favored explanation for this?
I do not at this time. I'm rather tied up now and will only point out the prevailing winds from Krakatoa would take the heaviest light-blocking ash and blanket it out above the ocean. I will, though, offer the following from two years later;
Catia M. Domingues et al, Improved estimates of upper-ocean warming and multi-decadal sea-level rise, Nature 453, 1090-1093 (19 June 2008) | doi:10.1038/nature07080
Thanks for your cite: John Church is a well-respected straight shooter.
Pushker,
I have read all the papers in question. Even if Hansen et. al. are correct about the "Earth sensitivity" being 6ºC over centuries, which is based on a specific reading of the paleoclimate data, I can assure you that getting back to 350 ppmv CO2 is not going to happen anytime soon. That would require dismantling our civilization, which realistically I don't think anybody is going to be willing to do.
I have trouble understanding why climate scientists and activists like Bill McKibben can not wrap their heads around this simple point. You know, sometimes in life we're screwed and there is not a damn thing we can do about it. And as Keynes said, in the long run we are all dead.
So, there it is.
I believe it is very difficult for the human psyche to function day to day without hope. Also, most people have an innate will to live. Therefore, even in the most absurdly "hopeless" positions the will to live remains strong and hope arises based on a perceived need to go on and do something.
If rationality ruled most of us would probably not be here because our ancestors would have given up to die during historic duress AND we'd probably not be in our current resource/environment predicament either because we wouldn't be able to fool ourselves with the false optimism that there's always a land of milk and honey somewhere to exploit. How beautifully ironic.
Luis and Euan's piece is very hopeful. As Dave said, 350 is not going to happen, so get over it. But if the worst that can happen is 450, that is very good news. I think the problem is that it takes a lot of the wind out of the sails of those who have been focusing more on the global warming problem than the resource depletion problem. The climate situation is not hopeless and certainly many, many less lives are at stake due to it than are due to resource depletion.
I actually take the reverse position: I find the resource depletion problem frightening but not the "end of the world." However, I find the climate change problem to basically mean we are totally stuffed. That's because at 450 ppm of co2 I believe the rate and magnitude of climate change will overwhelm most ecosystems on the planet. So, I am less concerned about the death of industrialized human kind than the death of most of the other organisms on the planet. Humans can live without concentrated liquid fuels, but we can't live without a well functioning biosphere. I know, I know, as a species we have lived through ice ages, etc. But this round of climate change is a whole new kettle of fish. Comparing glacial-interglacial changes to what we face now is like comparing a parking lot bumper bender to a head-on freeway collision.
There might be a way out. The only folks I've seen articulate it in a tantalizingly credible way are Spratt and Sutton in their book "Climate Code Red." And yes, they discuss peak oil too.
Exactly, Jason. And you didn't even cover rapid climate change (RCC), i.e. +/- 7C in 2 to 10 years.
People who think Peak Oil is our biggest concern need to rethink things. From my perspective, and as you alluded, Peak Oil trumps CC in the short term only if you are concerned with maintaining something that looks like BAU (even if renewable), don't want to have to go through a very tough transition, don't care about future generations, don't believe RCC is a real possibility, etc.
From a risk analysis perspective, it's foolish stance.
http://www.youtube.com/watch?v=mF_anaVcCXg
As you said, and I have often said: PO may change your civilization, but CC can make you extinct.
Cheers
I find it interesting that the producers of this report found it necessary to write it at all. I will keep my reason simple, though the evidence against using the extremely limited sensitivity they do is strong:
They say
and leave this completely unsupported. In fact, the high sensitivity is far more in line with current observable changes than the Charney-based number they accept for their modeling.
The most current thinking on climate sensitivity is 6C per doubling, yet they use sensitivity assumptions based on work from c1979. Why choose data that is thirty years old? Charney simply no longer applies.
They state for non-energy emissions they are using the most recent runs from MAGICC, but the link supplied comes from IPCC 3 and they acknowledge using IPCC 3!!
I repeat: Charney no longer applies and the data from the IPCC is at least ten years old. (At least the link they supplied, which points to IPCC 3.) With the massive amounts of research and startling observations in the natural world since that time, I think an explanation is needed for choosing inputs to their analysis that they certainly must be aware are severely out-of-date and beyond inappropriate for an objective look at future climate change from this point forward.
Further, climate models are behind the curve with regard to observable effects of climate change, yet they claim their run with MAGICC is accurate with regard to CO2. Let us apply logic here:
In the conclusion it is stated the burning of fossil fuels does not present a danger; temperatures will not rise more than 1.6C. Because MAGICC said so, essentially, based on their assumptions about how many tons of fossil fuels will be burned, assumptions about climate senstivity that are thirty years old and work based on that sensitivity with regard to natural forcings. (The use of those natural forcings is OK, apparently, because they were used by the IPCC to produce their inaccurate report on future climate change - regardless of observable events such as increasing methane, CO2 rising at 2.2 ppm/y as of 2007 and numerous, nee ubiquitous other observations in the natural world.)
Let us assume their statement about CO2 and MAGICC is accurate to this point. Where is the guarantee it will continue to be? How does the fit so far square with the observed changes? It doesn't. One thing or the other logically is true:
1. MAGICC is accurately reproducing CO2 thus far, and is reproducing climate accurately, too
or
2. MAGICC is accurately reproducing CO2 thus far, and is not reproducing climate accurately.
3. If 1, then MAGICC is a useful tool here and the conclusions reached by Mearns and de Sousa are equally useful.
4. If 2, then MAGICC is not a useful tool here and the conclusions reached by Mearns and de Sousa are essentially useless: GIGO.
If 3, then the observed changes world wide cannot be happening because they were expected at much higher concentrations of CO2, but Mearns and de Sousa have stated unequivocally that no more than 1.6C of warming will occur, that this is not a dangerous level, and that the climate experts (alarmists) are full of crap.
If 4, then the climate sensitivty and natural forcings used by Mearns' and de Sousa's analysis is full of crap, not the climate experts.
Obviously, 4 above is the best description of what we see.
There are other egregious flaws in this analysis.
A. They are using 1 climate model and drawing definite conclusions about very, very indefinite events. I have not taken a poll of climate scientists, but I doubt very much any of them worth their positions would say that MAGICC says all there is to say about climate change. Given it uses useless data, even more so.
B. If I am reading their work correctly, they did ONE run. See above and multiply the seriousness of the error by orders of magnitude.
C. No mention of the very fast rise in methane after a ten year hiatus, the eruptions of methane discovered in the oceans and in areas of permafrost, nor the new estimate of there being twice as much carbon locked in the permafrost as previously believed or that it is, if memory serves, equal to double the carbon currently in the atmosphere.
D. Unsupported claims.
E. It is generally accepted that the carbon already in the atmosphere will carry us to 2C above pre-industrial, so how does burning a whole lot more carbon not get us only 1.6C over 1990?
Etc.
But my first point is enough to invalidate the entire analysis. We've no need of ABCD, etc.
To be fair, there is this disclaimer:
Unfortunately, that does not square with their quite declarative conclusions:
Somebody help me out here: they don't necessarily agree with the sensitivity they DO use, but the possible 6C is dead wrong based on past decades (before tipping points were reached and feedbacks in full force)? What then, IS the acceptable sensitivity? (We must note the disclaimer does not say they don't disagree, only that they don't necessarily agree. Clear as mud.)
Will. That's a strong word for a scientist. Don't get me wrong, I have no problem using it, but I don't claim any expertise and am on record being comfortable with the knowable vs. the provable, but the authors are presenting this work as experts of a sort. There is no disclaimer in that statement, no conditions or caveats. We *will* remain below 550 even if we use up most or all the fossil fuels, because of the low sensitivity.
And that is the smoking gun. That line is dripping with agenda. Burdening? Artificial? Within the context and the scope of their presentation, those are pejorative words. They could have said, "It appears attempts to limit fossil fuel usage may be unnecessary and place otherwise avoidable strain on the global economy." But they didn't. This will seem the picking of a nit to those sympathetic to the denialist agenda, but this canard that the economy will be destroyed by the transition to renewable energy is weapon one in the anti-AGW repertoir. It's inclusion here is worrying, at best.
Unless the authors are willing to revise based on the many objections in the comments, their work moves the discussion backwards, not forwards.
Cheers
NOTE: I am making no attempt to dispute the energy production-related elements of Mearns' and de Sousa's work. Their work with regard to energy generally appears to be first rate.
Thank you CCPO for taking the authors (deservedly) to task for this article.
I know very little about climatology. Certainly not enough to mount a rebuttal of their conclusions. However, I do know enough about modeling complex dynamical systems to know that a) using a computer model without an intimate (expert) knowledge of that model and its assumptions is not a good idea. If you simply start plugging in your parameters without a full understanding, you're likely to come up with something bogus, b) neither Mearns nor de Sousa are climatologists.
You conclude with:
I must confess I don't feel as comfortable as you do anymore. Both authors have demonstrated that they are happy to ignore empirical data when that data conflicts with their theory (none or insignificant amounts of global warming is attributable to human activity). How am I supposed to know that they are not doing the same with their energy estimates? Maybe they have an agenda driving their work in this field too? I'm not an energy analyst either, I simply can't tell, nor do I have the time to sift through their work and try to see if it is sound or not. I for one will no longer read or pay attention to articles written by Mearns or de Sousa.
dtbks,
In my experience, human beings have a real talent for compartmentalizing, so I don't have much trouble with trusting their other work until they provide reason not to.
As to the AGW angle, well, Mearns is very clearly a sceptic of one degree or other. Why he was given/allowed to do this particular paper is a mystery. I chalk it up to false equivalencies.
De Sousa? I don't know his leanings one way or the other, except what I would guess from this paper, but that would be unfair without further background on his views since there were two on the team and, presumably, the other members of the staff had some part in reviewing the work.
BTW, I'm no climate expert, either, but I can darn sure apply logic to what I see, hear and read.
Cheers
ccpo,
"As to the AGW angle, Mearns is very clearly a sceptic of one degree or other."
This criticism is misplaced. The author of MAGICC, Tom Wigley, has extremely high standing in the climate modeling community, and the CO2 concentrations and the temperature that the program predicts are not considered controversial in that community. Euan and Luis are using the program precisely for the purpose it was intended: to compare emission scenarios.
Dave
I agree with that, I think the purpose of Euan&Luis's work is very clear and it is not on temperature modeling or climatology but rather for a given prediction tools what is the change in the output when fossil fuel scenarios are modified. I think attacking their work on the basis that they used a particular version of MAGICC is completely missing the point.
But I'm not attacking their work on that basis Khebab! Where do you see me questioning MAGICC? I'm not even remotely qualified to do so. I don't think ccpo is either if I'm reading him/her correctly.
What dtbks said.
Again, I don't fancy myself a writer, but dtbks got it, so I'm not sure where you two missed my point.
Cheers
Excuse me?
Neither ccpo, nor myself are criticizing MAGICC (whatever climate modeling program this may be), but questioning Mearn's and de Sousa's ability to make generalizations about climate processes, using the assistance of MAGICC or otherwise.
If you think my claim of Mearn's inability to understand basic empirical data or statistical analysis in the context of AGW are unfounded, consider the following passage from his presentation to the Royal Society of Chemists:
The full presentation may be found here.
Some of these statements are clever twists of framing and some are simply preposterous and have been debunked over and over by climate scientists.
If you study de Sousa's comments under the same article, I do not believe he is any more capable of understanding or being willing to understand the science of and data supporting AGW.
Thanks for the ammo, dtbks.
So there ya go, boys: he's a typical denialist, and as such had no business being involved in this paper. The terrible results speak for themselves.
The sun? For chrissakes...
Cheers
I'd still stand by that statement, believing that we live in a dynamic world where climate has fluctuated in response to a large number of natural phenomena for many millions of years and continues to do so today. Upon these natural fluctuations we now have man made forcing, mainly in the form of GHG emissions and land use changes.
My view of late 20th century temperature development is that a number of natural phenomena would likely have led to warming irrespective of Man's intervention. The latter has accentuated the effect. I wouldn't like to allocate in % terms the natural and anthropogenic components. I gather there are many thousands of scientists around the world actually adhere to this type of thinking, I actually know a fair number of them and gain comfort from being in what I regard to be good company.
I think climate science has painted itself into a corner by underplaying the roll of natural climate variations over the last two millenia and now, by trying to explain near all observations using AGW models whilst natural phenomena are still at work.
Are you still hanging on to the late 20th century solar forcing hypothesis? It's been more than sufficiently debunked by;
Schiermeier, Quirin, No solar hiding place for greenhouse sceptics Nature 448, 8-9 (5 July 2007) | doi:10.1038/448008a
T Sloan et al, Testing the proposed causal link between cosmic rays and cloud cover, 2008 Environ. Res. Lett. 3 024001 (6pp) doi: 10.1088/1748-9326/3/2/024001
Even Lassen and Friis-Christensen have accepted that the current warming is due to something other than the sun.
My view of late 20th century temperature development is that a number of natural phenomena would likely have led to warming irrespective of Man's intervention. The latter has accentuated the effect. I wouldn't like to allocate in % terms the natural and anthropogenic components.
So you believe that current warming is predominantly natural, though don't know how to assign a estimate of the scale of these natural forcings. Which forcings and what findings do you base your belief on? Why do you think that the natural forcings are greater?
I gather there are many thousands of scientists around the world actually adhere to this type of thinking,
And what do you base this number on, the Oregon Deception Project? I hope not. Any recent sources? Out of 10s of millions of scientists, a few thousand as skeptics is scrapping the bottom of the barrel, so I hardly see that as a reason to confirm your belief system
I actually know a fair number of them and gain comfort from being in what I regard to be good company.
How many of them are climatologists? Performing research, publishing papers? If none are doing so, why do you give so much credence to their views over the scientists who are actually doing the work? Using the words gain comfort...good company is a classic example of confirmation bias, where learning is impeded by the seeking or favoritism of information that supports one's current beliefs while ignoring anything that doesn't.
If you want to take an honest look at the rebuttals to the critic's arguments, this article by a climatologist touches on almost all, and hyperlinks to individual articles that are supported by peer-reviewed works. Changing one's mind on this subject shouldn't be considered somehow a defeat; entrenched positions take the longest time for each of us to re-examine, but such re-examinations always prove helpful in the long run, because our end goal is to honestly understand the facts of the matter.
Will, thanks for posting this rather excellent chart again. I think its worth looking at this alongside the PDO index lifted from the excellent Wikipedia.
http://en.wikipedia.org/wiki/Pacific_decadal_oscillation
From 1900 to about 1945 the PDO was in warm phase which seems to correspond to a warming period on your excellent chart.
From about 1945 to about 1975 the PDO then goes into cool phase and corresponds roughly with a cooling / flat phase on your chart.
And then from about 1975 to the present it is back in warm phase.
To me the correspondence between the structure of the two charts is reasonable. Of course the PDO cannot alone explain the overall rise in temperature, but it is but one of a range of oceanic and other influences to consider. Would you agree that oceanic influences such as this need to be taken into account? This is the area addressed by Compo and Sardeshmukh (link given above).
Moving on from that you are clearly impressed by the parallelism between the rising CO2 curve and the overall temperature rise and so I accept that there is maybe something to that. However, I also see a correspondence between the overall rise in sunspot number since around 1940 and the present day. Now I am not saying that sunspots have direct influence upon Earth's climate, but this article by Lockwood and Frohlich goes into more detail looking at irradiance and open solar flux as well. These authors are clearly experts in this field and do conclude that Solar activity has not influenced Earth's Climate over the past 20 years.
Now somewhere else on this thread someone was arguing that we need to look at 30 year averages. I don't necessarily agree with that but a common standard does need to be applied. The main criticism that I would have of Lockwood and Frohlich is that they do not attempt to time lag solar activity and its eventual cumulative impact upon Earth's climate. They do describe a grand solar maximum around 1985 but this is not considered to have influenced Earth's climate significantly since no one to one correspondence is found with surface temperature in data that are not time lagged.
http://publishing.royalsociety.org/media/proceedings_a/rspa20071880.pdf
Thanks for your reply. You don't state your time-ordered aggregation of natural influences explicitly, but it seems that you are looking at solar influence as the main forcing up to 1985 and then PDO since (until a cooling trend from 1998 to now). Is that correct?
To understand SST dynamics, we first have to understand the data. How was the data collected? First it was wooden buckets, then a tall, narrow cylindrical canvas container, then finally an insulated container.
The canvas containers give a temperature bias of up to 1C (depending on sea and air temperature circumstances). Other biases are introduced through drifters, engine intakes, etc. This has been known for some time and the IPCC has specifically acknowledged the need to account for obvious discrepancies caused by the varied collection process. Indeed, there is ongoing work in this area [1][2][3] to help to remove or at least reduce collection biases, similar to the effort to correct satellite temperature readings. I would appreciate your comments on the aforementioned bias correction efforts.
And see further corrections by John Kennedy, Nick Rayner and David Parker from CLIMAR3 May 2008.
Given this, do you have any references on PDO that take the bias corrections into consideration?
Compo and Sardeshmukh propose;
They also make this interesting statement upfront;
They go on to focus on local GHG warming as their comparison point;
They have a major caveat in the conclusions, however, with;
Note they refer to "oceans" instead of "SST", and any examination of the subject would need to address the atmosphere/ocean coupling at least in the thermocline layer, which is not done here. So I don't see the importance of this work, as they refrain from discussing the forcings upon the ocean surface, thermohaline or the total mass of the oceans themselves (they simply take the SSTs as a given).
The main criticism that I would have of Lockwood and Frohlich is that they do not attempt to time lag solar activity and its eventual cumulative impact upon Earth's climate.
Why would a time lag be appropriate? What amount of time lag would you suggest and why (from a scientific perspective)?
What? How? If we are still in the part of the cycle coming out of the glacial period, this would be true. And many do think this, but not just denialists.
Yup. Either way. And NOBODY I've ever heard of claims the only effect on Earth's climate is the burning of fossil fuels.
This is why I simply do not trust the intellectual honesty of denialists. The above statement, given the context, implies that objective people who can read graphs and instruments - and just look out the flippin' window - **don't.** That the only forcing there is is man-made, which is just a huge lie.
And if you want to play with numbers, well, there are many millions of scientists on the planet, so if a few thousand think the same way you do, that's not saying much. And, of course, the numbers are even worse for you when you use as your sample climate scientists. Which you are not.
Well, hell, I might agree with you if your characterization were even slightly accurate. 1. They don't downplay natural variations, they actually - gasp! - count them. Take for instance the paper from this past summer expecting a cooling trend over the next ten years or so. Got a bunch of denialists like yourself all excited. Of course, in order to make their excitement seem legit, rather than much ado about lying, they had to pretend the authors **didn't** say, in the same paper, right there in black and white, that it was a natural oscillation in the Pacific that would **mask** warming over the period in question, and then the trend would start shooting right back up.
Yeah, you're intellectually honest on this topic: none of us objectivists give adequate weight to the freakin' science.
BTW, they're not "AGW" models, they're climate models. Again with that intellectual honesty!
You REALLY need to stop talking on this subject. While it's not necessarily fair, it is a reality that when someone does good work in one field, but makes huge gaffs in another, all their work will be viewed as suspect.
My suggestion to you is quit while you've still got a reputation worth upholding.
Cheers
How can I argue with this? You sound so reasonable. Who can deny that the earth's climate changes because of natural phenomena? I certainly can't.
And then you come out with gems like this one:
And it becomes patently obvious you're trolling the anti-science sites looking for the latest flavor-of-the-month argument to make anthropogenically-induced climate change go away.
One last question. Do you know how good your ability is to distort the data through framing (you do an excellent job), or are you unaware of what you're doing and simply parroting back the anti-science frames from those websites to make yourself sound reasonable?
If my last question mystifies you, take a look here. Lakoff cottoned on to framing rather late in the game, but is one of the few to seriously try to connect it to cognition in a meaningful way.
No, it isn't. Your assumptions as to the reasons the criticism are simply incorrect. Why don't you just ask him his position?
Perhaps you haven't read Mearns' comments and posts that touch on AGW, though that would be strange given their conclusion is tilted toward denialist's agenda and there are other comments in this thread that also support the "criticism." (BTW, an observation is not a criticism.)
I'm not a writer, so perhaps my points were not clear to you? Possible. Others seem to have understood them without any trouble, so...
Cheers
Gentlemen, Ladies.
I have never known a subject that triggers so much animosity on both sides. It is almost as bad as the religious schisms of the 15th and 16th centuries. Where do we go from here? Raising the standard at Northampton or even the sack of Magdeburg? Perhaps this is because Climate Science is relatively new and the true and measured data sets are available over a very short time frame? Almost everything before 1860 is a proxy record and open to interpretation.
I can happily agree that there has been a warming phase and the start point could be as early as 1860. This could be forced by industrialisation. Equally it could be forced by our continued interglacial trending and our climb-out from the LIA. To date we have not broken the next nearest record of the Eemian. As a point of order, I would suggest that defence of the pro or anti stance does not look much further back than the last couple of million years. Since this is the environment which Homo Sapiens were able to flourish. Of course many would argue that horror stories of runaway global warming and snowball earth in deep time are relevant, However, I would not since atmospheric chemistry and marine chemistry may have been quite different and physical and geophysical forcings also quite different during earlier phases of Earth History. (This is an aside to this string since no one has tried to use these sticks to beat up anyone, but I have seen it often on this site and to no one sides benefit).
Potential Climate change and Potential Peak Oil (I would personally prefer Chronic Energy Deficit, but that is my own pet issue) are probably numbers 1 and 2 on humanities current risk management list. Financial collapse, resource wars etc all are all symptoms from these two wellsprings.
In view of the seriousness of the present predicament we find ourselves in, perhaps we should at least adhere to a few ground rules.
Pejorative terms such as ‘Agenda’, ‘Denialist’, ‘Denial’, ‘Warmist, ‘confirmation bias’ ‘Liar’ etc should be outlawed on this site Nobody comes here for that, either to see it or be accused of it. Moderators should show absolutely no leniency. to frequent users of these egregious terms that do nothing but inflame. Sceptic is wholly acceptable and respectable. Denialist is disgraceful and to try and paint sceptical, but sincere and well trained scientists as such is a recent and sinister development. Such attitudes and language are best left on the floor of the House of Commons. If I want to see apes throwing excreta at each other, I can go the gallery of the Commons. Frankly, if the only ways an argument can be won are by using these phrases then it should come as no surprise that the ‘man on the Clapham omnibus’ is completely cynical regarding climate science and the current pro/anti stance.
Finally, can people stop using such terms as consensus? Consensus is not Science however many ‘millions’ of Scientists agree on a consensus. Also the phrase ‘the science is settled’ should be outlawed. Proof of a predictive theory is required before acceptance. Again, the science is not at a mature stage, it is in its infancy, models will undoubtedly get better, further data will come out But this science is not close to settled consensually or otherwise. Such terms of reference belong in the world of Politics and not Science.
Best wishes
dropstone
Dropstone - I've sent your comments around all the editors and contributors.
The extent to which we engage in climate debate is itself the subject of fairly intense debate behind the scenes and we are generally agreed that we (TOD) should not engage directly in this debate apart from when there is direct linkage to energy policy. Since UK, EU and soon to be USA energy policy is ever more predicated upon climate issues, in particular CO2 reduction, then it becomes ever more difficult for TOD to simply ignore this issue.
Luis has done most of the work on this article, I put in some significant editorial time and did a degree of re-writing. It then went through two other editors before it was published. Its a lot of work done by volunteers. It is rather a pity that we / I get drawn into a general climate debate - but it is difficult to simply ignore some of the comments that are made.
On this thread, as far as I'm aware only one comment was deleted - not by me and without my consent. The general editorial line is to allow comments to stand so long as they are not too abusive - but where the line gets drawn is also subject of debate. There was some discussion about banning some of the commenters on this thread and in light of your comments here that discussion will continue.
Perhaps it's just me, but I see nothing over the line in the messages posted in this thread. Banning of any of these commenters would be tatamount to censoring criticism. Where would you draw the line? There have been a number of holes poked in your statements, and you have not addressed those criticisms, but have chosen to "stand by your statements". If TOD does choose to censor criticism, it should be boldly stated right up front, so that all understand that an open and frank discussion is not encouraged or allowed.
Will, by and large your comments are fine and informative. However, you have a tendency to provide a huge amount of data, reflecting that you are indeed widely read on this subject. At one level this is helpful since I do read many of the articles you link to. At another level you need to recognise that it is impossible for one (or two) article authors to respond to this deluge.
Checking out our reader guidelines:
http://www.theoildrum.com/special/guidelines
You'll see:
Keep all comments on non-Drumbeat stories on-topic. If you have comment that is not related to a particular story, please post it the current Drumbeat story.
We do have a problem right now in that we (TOD staff) are agreed that we should not post or engage directly in the CC debate. However, since energy policy is increasingly based around climate and in particular CO2 issues it is near impossible to avoid the topic of CC altogether. So this raises the semantic issue of whether or not the majority of comments here are on topic. The topic was availability of fossil fuels and the possible impact on temperature.
Treat members of the community with civility and respect. If you see disrespectful behavior, report it to the staff rather than further inflaming the situation.
Are all the comments here respectful and civil? Here's a random, very small selection.
This style of discourse will certainly have a negative impact upon a number of would be readers and / or commenters.
In future, when we have a thread incorporating a single aspect of climate we need somehow to ensure that comments are focussed on the subject and not the whole spectrum of CC.
I'm away to leave a note in reply to the link you posted on Krakatau.
Euan, you certainly make valid points on the use of civility and respect. I agree that some posts have stepped over that line. There have been times when editors and contributors have gotten "hot under the collar" or "chow the chafts" and approached or crossed the line as well. Fortunately, all are considerate and amenable 99% of the time. This time, for example, Luis got a tad crusty at some comments, and I felt a bit like he was "be on ane's tap" with regard to me. It didn't bother me so much (perhaps I'm a bit too arrogant), but that can affect the tenor of the overall topic discussion. Now I think he is a superb contributor, especially in his field of expertise, so I am in no way complaining about him, just relaying the effect on the discussion.
you have a tendency to provide a huge amount of data ... you need to recognise that it is impossible for one (or two) article authors to respond to this deluge.
I believe I'm mostly responding per the guidelines;
1. When citing facts, provide references or links.
2. Make it clear when you are expressing an opinion. Do not assert opinions as facts.
3. When presenting an argument, cite supporting evidence and use logical reasoning.
Many times in this particular article, positions were taken or implied with very little or no references, especially peer-reviewed references. If I only presented a link, or maybe two, couldn't someone with one outlier link claim it could be used as refutation? So if I have substantial, even overwhelming amounts of information to make my point, is it not legitimate to present it? And often, the material I present is readily readable in the form of a graph.
In future, when we have a thread incorporating a single aspect of climate we need somehow to ensure that comments are focussed on the subject and not the whole spectrum of CC.
That's a good point, though it will likely be hard to keep even most of the cats in a herd. If it were stated plainly up front, it might work. There is a danger that some contributors/editors may want to focus only on certain areas that either advance or detract from the current understanding, and attempt to make conclusions based on a limited treatment.
Scotsmen are known to be intense debaters, and as you can see by my name, I've inherited that trait in spades. I hold dearly to the mission that TOD has embarked upon, and like you, see how multiple issues can have very similar solutions. I propose that we work together towards those solutions. Indeed, 'tis the season, let's turn this into a toast; Slàinte mhòr agad - Dun Sut!
By the same reasoning, I ought to be able to write an article on abiotic oil, have it published here, and nobody gets to call me names.
However, for some strange unknown reason they're not keen on that.
Mearns is not a "sceptic", but a denialist. A sceptic is someone who questions and then listens to the answers. For example, Mearns spoke of the "cooling trend since 1998." There is no such thing, NASA tells us.
This has been pointed out to Mearns several times. But when dtbks quoted Mearns as saying,
"I suspect that these events plus others are responsible for the cooling trend observed since 1998 that is showing signs of intensifying."
Mearns replied,
"I'd still stand by that statement"
A person who says X, and when X is shown to be wrong still stands by X, that person is not a "sceptic", but a denialist. "La la la la I can't hear you!"
Let me write an article on abiotic oil, and when people demonstrate that all my statements are wrong, I can say, "I still stand by that statement", and see what people here at TOD will have to say to me then. Of course, I can then complain about their rude language, evading the actual matter under discussion. Who will leap to defend me as they have Mearns and de Sousa?
Dear Kiashu,
I think producing a serious post on abiotic oil would be unlikely to stand serious skrutiny. AGW vs Quaternary Geology and Climate is a little more complex than Abiotic oil theory. But I defend your right to try.
I think producing a serious post on abiotic oil would be unlikely to stand serious skrutiny
Interestingly enough, I'd say a number of us feel the same way about those who deny a substantial percentage of humankind's contribution to climate change, especially after we've applied volumes of said scrutiny.
I think what you don't like is that I listen to the answers but then don't necessarily agree with them.
Next time you post a temperature chart you maybe want to consider posting Hadcrut3 monthly and one of the satellite data sets at the same time.
I am happy to concede that it is too early to call the Hadcrut3 1998 to 2008 data a cooling trend since this seems to cause so much distress. One may want to characterise this as noise or natural variability. The recent data are dominated by the 1998 el Nino and its aftermath. There was a "similar" major el Nino around 1878.
http://www.metoffice.gov.uk/research/hadleycentre/obsdata/HadCRUT3.html
Krakatua erupted in 1883 and left no major scar on this temperature record, though one may want to attribute the pattern of descending tops and bottoms seen in the subsequent decades to this event?
dropstone said;
Pejorative terms such as ‘Agenda’, ‘Denialist’, ‘Denial’, ‘Warmist, ‘confirmation bias’ ‘Liar’ etc should be outlawed on this site Nobody comes here for that, either to see it or be accused of it. Moderators should show absolutely no leniency. to frequent users of these egregious terms that do nothing but inflame. Sceptic is wholly acceptable and respectable. Denialist is disgraceful and to try and paint sceptical, but sincere and well trained scientists as such is a recent and sinister development.
In other words, you want moderators to censor articles where persons who certainly seem to be following an agenda funded by Exxon/Mobil et al cannot be identified as such? Initial scepticism is traditionally cherished in science, as any finding should be subjected to intense scrutiny and repeatability. Chronic scepticism, especially when the vast consensus of the scientific community has taken a position, becomes an outlier position that begins to approach Flat Earth support. So people who deny the likelihood of AGW are called "denialists" by some. If that is irritating, then ignore it. Asking for censorship smacks of wanting to find other ways to frame the perception of those who support the agenda of those vested interests who do not want to reduce GHG emissions. I do think that "liar" might be a bit too extreme, but advocating the censoring of the term confirmation bias is beyond all realm of open exchange of information and ideas.
Finally, can people stop using such terms as consensus?
Absolutely not! Read this and then tell me there's no consensus. You are simply trying to adjust the tenor of the debate to the advantage of your position, as in the rest of your post above.
Dear Will,
firstly I do not want moderators to censor articles. The terms Denier , Denialist and Liar are not articles. Secondly, why is there an assumption that sceptics are following and agenda? And why is Exxon-Mobil et al assumed to be the driver behind an agenda? More money is now spent in the promotion of AGW than has ever been spent in its defiance.
It is not up to sceptics to prove GW or CC. I accept GW, GC and the general term Climate Change. How could I not? Every day, I travel through a Drumlin Field. It is up to the postulants of Anthropogenic Global Warming to prove the theory that man made emissions of CO2 have increased the Global Average Temperature.
Finally, Consensus is not Science. Consensus is Politics.
rgds
Dropstone
It is up to the postulants of Anthropogenic Global Warming to prove the theory that man made emissions of CO2 have increased the Global Average Temperature.
And why is Exxon-Mobil et al assumed to be the driver behind an agenda?
Where have you been?
This thread is about to be shut down, so let's just carry on in the next climate thread, though using this thread to refer back to.
ccpo
As far as I can tell from de Sousa's comments history, he is equally a sceptic of AGW.
I agree with you about humans compartmentalizing. I guess I shouldn't be surprised, but still am. In my own work I sometimes study epistemological compartmentalization in cognition (e.g., a physicist who believes in God and goes to church on Sundays). But I am still amazed when a scientist suddenly forgets his/her basic knowledge of statistics and the role of empirical data in the scientific process when suddenly removed from his/her small compartmentalized sub-domain of specialization.
These sentences in the conclusion are not entirely correct:
"Throughout these chapters, the IEA refers to potential climate impacts that imply a CO2 sensitivity parameter that is higher ..."
This because IEAs results ARE compatible with the normal climate sensitivity parameter of 3°. IEA state on page 401: "temperature rise above pre-industrial levels of about 6ºC. " which is the same as 2 doublings of CO2eq concentrations from about 250-300 ppm, to 1000-1100 ppm CO2eq. -> 2x3=6°. Looks ok to me.
Thus also the authors conclusion:
"These inconsistencies undermine much, if not all, the recommendations implicit in the 450 and 550 ppm policy scenarios."
is not strong at all.
It is a cry "we want your data" - which ofcourse is good, but it shouldnt be backed up with false accusations...