| The post-oil energy economies of the future - by Gordon Brown | The Oil Drum: Europe | Gore sets goal of 100% carbon-free electricity by 2020 |
Oilwatch Monthly - July 2008
Posted by Rembrandt on July 16, 2008 - 9:55am in The Oil Drum: Europe
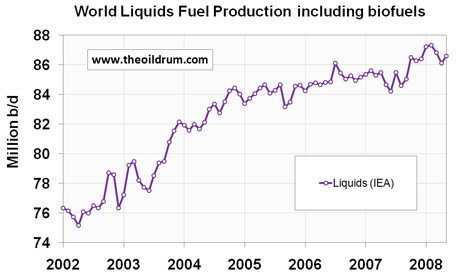
The July 2008 edition of Oilwatch Monthly can be downloaded at this weblink (PDF, 1.34 MB, 22 pp). In this edition I have added biofuels, monthly production revision charts and a barrel to BTU conversion section.
A summary and latest graphics below the fold.
Latest Developments:
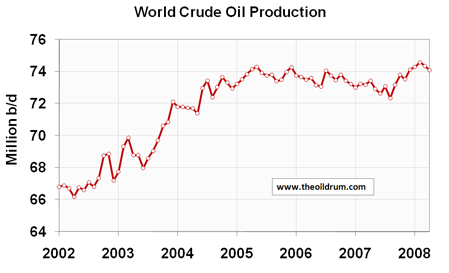
1) Conventional crude - Latest available figures from the Energy Information Administration (EIA) show that crude oil production including lease condensates decreased by 272,000 b/d from March to April. Overall crude oil production statistics have been revised downwards, leading to a lower all time high crude oil production of 74.59 million b/d that still stands at February 2008.
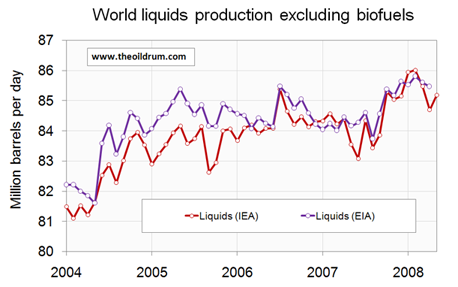
2) Total liquids - not updated
A selection of charts from this edition:

Personnel
Editors
Contributors
Peak Oil Primers
Archives
- November 2010 (3)
- October 2010 (6)
- September 2010 (4)
- August 2010 (7)
- July 2010 (6)
- June 2010 (7)
- May 2010 (2)
- April 2010 (8)
- March 2010 (4)
- February 2010 (6)
- January 2010 (3)
- December 2009 (5)
- November 2009 (8)
- October 2009 (12)
- September 2009 (6)
- August 2009 (5)
- July 2009 (11)
- June 2009 (8)
- May 2009 (16)
- April 2009 (10)
- March 2009 (7)
- February 2009 (10)
- January 2009 (15)
- December 2008 (9)
- November 2008 (9)
- October 2008 (9)
- September 2008 (13)
- August 2008 (10)
- July 2008 (14)
- June 2008 (23)
- May 2008 (16)
- April 2008 (12)
- March 2008 (16)
- February 2008 (9)
- January 2008 (13)
- December 2007 (13)
- November 2007 (16)
- October 2007 (22)
- September 2007 (8)
- August 2007 (9)
- July 2007 (16)
- June 2007 (8)
- May 2007 (7)
- April 2007 (7)
- March 2007 (10)
- February 2007 (10)
- January 2007 (12)
- December 2006 (9)
- November 2006 (15)
- October 2006 (4)
- September 2006 (5)
- August 2006 (5)
- July 2006 (9)
- June 2006 (5)
- May 2006 (10)
- April 2006 (9)
- March 2006 (13)
Vital Trivia
License

This work is licensed under a Creative Commons Attribution-Share Alike 3.0 United States License.
Rembrandt,
First of all, thanks for an impressive and valuable collection of charts and data over status on world liquid production.
Noticed that many countries shares one common feature, as they start to build up production (extraction) most of the buildup takes place over relative short time and is relatively steep. Thereafter it seems like they enter some sort of plateau. It could be interesting to compare some of the countries that share some common features in development in oil production to see if there are similarities that may help understand the general shape of the build up and the down slope.
The diagram showing crude oil stocks is interesting. Could that be split into USA and the rest of OECD?
My guess is that such a diagram will show that it is primarily the US that presently is drawing down crude oil inventories.
@Rune
The crude oil stocks can be seperated into USA and the Rest of OECD (Europe and Pacific). I have the data already in a spreadsheet. Will make a new graph with the separation in the next edition of Oilwatch. Currently travelling so can't put it on here now.
Here here Rembrandt,
These are some of the best articles on TOD.
Your graphs are a key indicator to geo-political events.
It is amazing how much your work has been analogous to the work of Walter Youngquist and how it appears that we are headed toward a significant slide (or cliff) right about NOW.
Mr Youngquists' models, of course, being predicated upon the total consumption of net energy per capita - the notorious Olduvai 'slide'.
Something we Americans are finally starting to feel in our painfully truncated consumption of fossil fuels.
Is it by coincidence that tensions in the Persian Gulf seem to be at the breaking point?
At the very same time world oil production (CC + liquids) is at a precarious plateau?!
Coincidence is not a kosher word.....your graphs are worth a thousand words.
I neglected to mention the time frame of Walter Youngquists' predicted slide in net energy consumption per capita -
2000 through 2012!
Seems to be fairly corporeal.
I think that Matthew Simmons and Kenneth Deffeyes are correct with the peak crude oil at May 2005. The EIA includes Canadian tar sands in crude oil, and it is NOT crude oil, as it cannot be pumped out of the ground.
http://www.eia.doe.gov/emeu/ipsr/appc.html
FROM EIA APPENDIX GLOSSARY: Crude Oil:
"A mixture of hydrocarbons that exists in liquid phase in natural underground reservoirs and remains liquid at atmospheric pressure after passing through surface separating facilities. Depending upon the characteristics of the crude stream, it MAY ALSO INCLUDE:
(skipping 1 and 2) 3. Drip gases, and liquid hydrocarbons produced from tar sands, oil sands, gilsonite, and oil shale."
I don't know if we've hit the technical peak yet, but when you are on a bumpy plateau does it really matter?
I've been waiting for a decline for a number of years. I think that if an economic collapse occurs before the decline, it will take longer to realise we are not going to get better, and the suffering will be protracted. By the way, I heard that it is a myth that you can slowly boil a frog. I wonder if you can slowly bankrupt America. So far the answer appears to be yes. "Getting ahead" is so ingrained in Americas' psyche, that I think we will embrace capitalism to our graves, even as the banks embrace socialism to their continued health.
I prefer to think of it as "corporate welfare." Same thing I guess.
I think "theft" is a better word.
There is a severe economic crisis brewing in the US, and I believe this will cause a significant demand destruction across the planet, making oil cheaper again. I know, in 2009 and 2010, Peak Oil researchers will be ridiculed by everyone. Once the price of oil goes down significantly, which is sure to happen, people will forget about the ticking Oil Bomb, and go ahead with buying the gas-guzzling SUVs again... I have already failed in convincing my friends about Peak Oil and its dangers.
The only way to bring awareness is to conclusively prove that Old Super-Giant Oil fields are actually declining in production. Since such data is hard to come by, people won't listen, and keep looking for easy answers and scape-goats for this price rice.
Dunno about US demand destruction, mate.
Looking at this, we see that recessions in the US have historically simply levelled out consumption, stopping its rise, or else dropped it by 1 million bbl/day for each year of the recession.
So, by mid-2009 we might see US demand drop from 20.7Mbbl/day to 19.7Mbbl/day. Assuming that total liquids production remains at 86Mbbl/day, can we imagine that China, India, Russia and Brazil will manage to find ways to use another 250,000bbl/day each?
I wouldn't expect world demand to drop in the next few years, and so the price is just going to keep on going up. Sorry.
Well, I imagine a deep recession in the US would cause significant economic recessions in India and China too, which are dependent of American consumption to a large extent. It could, very well, reduce demand for a while, though I agree that by 2012, the game would be over.
But it is also possible that somehow, oil extraction may increase, given the new investment in Iraq, Venezuela and Brazil lately.
Check Out http://en.wikipedia.org/wiki/Oil_megaprojects
These people have all the raw data in the world. And what are their conclusions?
New Oil Fields - In thousand barrels per day...
2008 - 5559
2009 - 4636
2010 - 5330
2011 - 3500
2012 - 3476
2013 - 1365
2010 is the peak of new oil production, from the known new facilities coming online. Couple that with Global Economic recession, and you'll see that Oil price is coming down in the short term. We'll just have to wait and watch...
Brazil is still, although just barely, a net oil importer.
Venezuela has shown lower production and lower net oil exports, for 10 years. At their current rate of decline in net oil exports, they would approach zero in about 20 years.
The new oil projects tables like the one above, along with lower consumer demand, look they will solve our oil shortage untill you consider decline rates. As Jim Kingsdale points out at his website:
This estimate of about 4 mb/d of new oil needed just to offset old field decline rate is from CERA, the perpetual overestimator of world oil supply, and doesn't consider that much of recent production in the old fields has been done with horizontal wells, which often result in decline rates more like 10%. So we could ease the less significant end user demand quite a bit, add around 5 mb/d of new oil each year from the new project tables, and still easily wipe out all that good with a real decline rate of about 7%!
Also consider that about half the new projects oil is oil sands, deepwater and the like with an EROI around 4. The math of energy source displacement dictates that this kind of EROI replacing our conventional crude EROI from the old fields means that about 3 barrels of new oil must be produced to replace each barrel of old field declining production to give the world the same net energy. So adding this multiplier of 3 to the new projects table leaves us in the hole by mucho barrels.
This is really bad. If mature oil fields are declining so fast,... Oh Hell!
I had seen a slideshow presentation on CERA website, compiled in 2005, which claimed that Peak Oil is a hoax. It is still being circulated by Peak Oil deniers. But if CERA says the decline is so high, it has to be a lot higher than that.
You know, this is really gotten out of hand, and I don't like it. But CERA guys are still so optimistic, I don't understand why... Their numbers are different than what the IEA and EIA tell us...
Look at this...
Peak Oil Theory – “World Running Out of Oil Soon” – Is Faulty; Could Distort Policy & Energy Debate
Source: http://www.cera.com/aspx/cda/public1/news/pressReleases/pressReleaseDeta...
Also look at "No Evidence of Precipitous Fall on Horizon for World Oil Production: Global 4.5% Decline Rate Means No Near-Term Peak: CERA/IHS Study"
Source: http://www.cera.com/aspx/cda/public1/news/pressReleases/pressReleaseDeta...
Atleast these people agree that "aggregate global decline rate is 4.5 percent". But they are as optimistic as always...
You don't give the source of your data. EIA gives production, net imports, and consumption (called "product supplied") information through April 2008. Net US imports peaked in 2005. This is a graph of recent data. 2008 is a partial year.
If you right-click the image I posted, "copy image location", then you see it's from a TOD article...
Your own graph is very telling. With a decline in US imports of oil over the past three years, we've seen the world price of oil triple.
The point is, even the complete mess the US is in at the moment does not overnight cause 10Mbbl/day of demand to disappear. It's a slow change, and the slow US decline in demand can easily be taken up by declines in supply across the world, and rises in demand elsewhere.
Thus, we cannot expect that the USA's mess is going to drop world oil prices in the next few years. It hasn't so far, why would it in future?
Demand destruction will occur, but now demand/consumption will always exceed production/supply. Thus the rate of extraction will remain the same.
Thus the date of terminal depletion (DOTD) will not change. Likewise because the U.S. is 1/4th of global demand/consumption, the U.S. could pursue maximum conservation policies and the rest of the world would gobble up what we might conserve.
Because DOTD looms and with it looms a reduction of the U.S. population, it would be wise to scrap consumerism, cars, and boats, and use the oil that we can still afford buy for risk management programs.
It's all over folks. Now plan B is planning for the collapse that looms in the not-too-distant future.
Long before DOTD, the U.S. will collapse: increasing U.S. dependence on imported oil, declining domestic production, Land Export Model, bankrupt economy, and the increasing inability to purchase oil as it goes to $500 per barrel and higher.
where is this demand destruction going to come from if it isnt SUV drivers? I thought that would be the first place to look for it.
Sorry, but by definition, SUV drivers have the money to buy expensive gasoline. Demand destruction would most likely start at the bottom with some poor schmuck driving a clapped-out Dodge minivan gives up and takes the bus to work, even though the trip will take an hour vs. 15 minutes by car. Huge pickups, full-size vans, and SUVs still dominate the gas pumps at the local Costco...
Not the bus.
Repaired a Suzuki Sidekick and doubled my gas mileage.
I agree there is going to be demand destruction. However, we have no way of knowing how it will affect prices because we have no way of knowing what the increased instability is going to do to oil producers. Whether it is bombings in Nigeria or strikes in Brazil.
All we can know for sure is that there is going to be extreme volatility. If oil goes to $20 a barrel it may not stay there for long, and it may shoot up $300 in a month.
There is a severe economic crisis brewing in the US, and I believe this will cause a significant demand destruction across the planet, making oil cheaper again.
It's possible maybe, but I tend to think it more likely that global demand will keep bumping up against the roof -- i.e. supply. No way to know for sure, though.
The only way to bring awareness is to conclusively prove that Old Super-Giant Oil fields are actually declining in production.
Here I disagree. You can conclusively prove anything you want, but it won't go anywhere until events compel a recognition of reality, and sometimes the compelling involves a powerful kick in the groin.
On the other hand, I believe that the power-that-be are getting ready to acknowledge peak, and pressing the subliminal message: therefore get behind our efforts to get control of what remains.
A global depression is the only thing that can significantly reduce global oil demand in the near term. There are too many people bidding on the same thing. This $11 decrease for a barrel doesn't mean anything because it's not based on a bunch of new supply coming online.
We are going to see price fluctuations, but as it stands right now these periods of people shorting the market will rebound like a rubber band.
What is happening is called conditioning. Oil cost multiplies by a factor of 8 in not even the same number of years, so people cry out for blood. Every time it tests a new high the anger returns. Then the price dips back and people let out a sigh of relief. The optimism comes back for a while. Then the cycle begins again and prices rise. It's this up and down (though mostly UP!) that makes a lot of pundits and their TV audiences blame all the wrong things. Within 3 years people will beg to return to the days of $147/barrel oil.
What Hubbert and others couldn't account for are above ground political factors such as ELM, economics, and resource wars. Regardless of KSA's ability to ramp up further, we are on an energy and economic tightrope.
American oil consumption will decrease when China stops giving us all that free money. China's oil consumption will increase when they stop giving us all that free money. Same amount of money, same amount of consumption. Just location is different.
War with Iran is not the same deal. There will be less oil available short term for people to buy. I see America broke and unable to buy oil from Nigeria, and China able to buy oil from Nigeria and price out Haiti, etc.
I think the answer is yes, you can slowly bankrupt the U.S. I could see a lot of this coming back in 2001. Greenspan should have allowed the economy to enter a recession. Between Bush telling Americans to spend and Greenspan's policies, people were widely duped into doing this. The idea that houses would appreciate in value quickly enough and do so continually was a stupid proposition to begin with. A majority of the U.S. fell for it.
If you look deeply enough at past wars, bank runs, and financial chaos, bankers are somewhere behind the scenes orchestrating a lot of it. What people don't understand is how the deck is stacked in a fractional banking system. Few people have a clue about how the Fed operates against the best interests of the people. Rarely do I meet anyone who has knowledge about why many of our smartest politicians fought to keep a central bank out of the U.S. for so long. We dabbled with the idea and each time we did, we came to regret it. The founders and statesmen of long ago warned us about what would happen if we allowed central banks or paper money.
There are people in the U.S. who want SOME banks to fail because they will feast on the carcass. Bear Stearns, IndyMac, and others have failed this year. The Fed's involvement in Bear Stearns being given to JP Morgan for pennies on the dollar remains extremely suspect. I'm not saying any particular bank has been targeted, I'm only stating that certain big players have a lot to gain by what is happening. Banks have a history of doing some despicable things to profit, including engineering financial calamities.
I'm not blaming all banks or investment companies. Most are so indoctrinated into capitalist philosophy that they don't know what master is being served. There is an inner core of old banking and oil money who wield enough power to weather any financial storm. We're little more than soylent green in the eyes of the ultra-elite.
If you believe OPEC then there's a new Peak in June 2008
OPECs 86.87 mb/d includes all liquids, which includes lots of different forms - this is not just crude oil. These "other" oils are more costly to produce, and will not bring the price down.
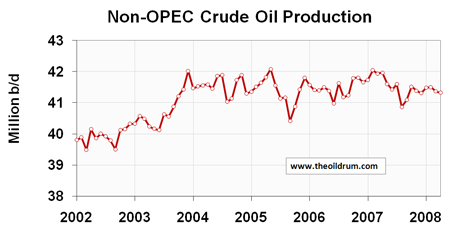
Sure is starting to look like non-OPEC crude production has peaked...
Amory Lovins is on the Charlie Rose Show.
http://www.charlierose.com/home
Amory Lovins is one of those who got us into this mess. For at least 30 years he has preached that solar energy would save us. Because of this message, fewer would listen to Matt Simmons.
He has mainly preached conservation and argued that we should invest in conservation rather than oil. He has also walked his talk. He would be just about the last person I would blame for our mess. If businesses, consumers, and government had followed his advice we would not be in this mess.
Hi tstreet, you forgot this: "For at least 30 years he has preached that solar energy would save us."
And as a consequence, many Americans/Europeans believe that "not to worry, solar power will come on line to save us."
And even many editors and contributors of TOD believe the same as an ideology that they can't get away from.
And why, pray tell, would anyone listen to Matt Simmons?
All Simmons does is say that we are all screwed.
If you think solar energy is crazy(in Germany 3% of electricity comes from PV solar) how about ocean thermal systems and underwater windmills for weird.
As I remember Matt Simmons advised Bush-Cheney on oil BEFORE 9/11.
Is it inconceivable that his advice lead to the Iraq War.
I like Matt Simmons fine as a critic of the Oil business and a doomsayer to the CERA uber-optimists.
But he's hopeless on solutions..that's not his 'forte'.
I listen to Matt Simmons because he knows much about Peak Oil from the standpoint of someone who has been working in the field for years and from his own research. He is not isolated in an ivory tower.
He is not strong on solutions, although he does suggest research into ocean energy.
My research indicates that there are no solutions to Peak Oil and the best policy to follow is risk management. If Simmons says this then for sure he won't get interviews. I can tell you from personal experience that almost no one wants to hear that we are doomed, even if this conclusion is based on the best scientific and independent government studies. Peak Oil is a tough sell. Peak Oil impacts is NO SELL.
It is highly improbable that Matt Simmons gave any political or military advice on Iraq. Bush and company don't ask investment bankers such questions and they already know the answers from the gut.
http://video.google.com/videoplay?docid=-869183917758574879
Rembrandt
I love this report. Could you add one more graph for World Oil Exports.
Since most of the world's leading economies are importers, having a report on usable energy would provide the a good indicator of energy's impact on economics.
Thanks Bill
Net Oil Exports
Rembrandt could you confirm this chart as it seems very important? who cares about peak oil or not if the exporters are lowering their exports!!!
Minor point, but I would classify this as declining net oil exports, rather than "lowering." My guess is that total world net oil exports in 2031 will be down by at least 75% from their 2005 rate.
Our (Khebab/Brown) outlook for the top five net oil exporters:
http://graphoilogy.blogspot.com/2008/01/quantitative-assessment-of-futur...
I believe this is a guess estimate and there is a possible 10% error bar on that curve (only the top export numbers are published monthly).
Can't confirm nor falsify it. The chart presented by bluetwilight is based on certain assumptions regarding consumption for countries on which there is very little data for consumption such as Russia and Iraq. Only annual figures are available.
I think the chart is reasonably valid from what I know about the underlying assumptions.
Thank you very much.
Blue Twilight, since the US is so dependent for its oil (70% imported), then one could say that an American perspective of peak oil occured in Dec. 05, as seen in the above graph.
Hi BlueTwilight
I noticed at your web site the top 20 account for 93% of all exports. If possible I would like to show all exports. Could you add such a graph and could you tell me where at EIA you ferret out the data?
Thanks
Some of my thinking while looking at the total liquids and biofuels chart is that there is a little double counting. Some of the liquids produced were used up in gaining the biofuels. Of course the same is true in obtaining the liquids; some previously produced liquids are used up to get the gross production.
I doubt that an accurate chart could be constructed showing net production (gross production less the equivalent barrels of oil used up in obtaining that energy). I suspect that such a chart might show a worsening situation because the energy cost of acquiring oil and biofuels is generally increasing; for biofuels which have such a low EROEI the contribution to net production might actually be negative for corn ethanol if some of the more pessimistic estimates are to be believed.
I have been following just World Crude Oil Production numbers from EIA. Using the monthly data beginning with the low in production early in 1983 and ending with the most recent month published, I fit a straight line to this data, plus a trend channel using twice the standard error of the Y estimate above and below the calculated line. The data neatly falls within the upper and lower boundaries of this positively sloping channel. As of the most recent month, April, 2008, the data is sitting right in the middle of the channel, actually right on the calculated line. As long as production numbers continue to fall within this channel, it is unsupported conjecture that we have passed peak.
So I sit and watch the paint drying. I do the same thing with US oil imports, and we have not violated that channel either, although we are close to the bottom of the channel as of April, 2008. Tick-tock, tick-tock, etc.


Hi Henry
I agree it's hard to start defining a peak at this stage. As well as the ELM graph provided by another poster it might also be interesting to overlay a graph of global economic growth? I can't find a decent one online for the whole period covered by I'm betting you would see a clear contrast between the 2005-present chart and one in which oil production has previously levelled or declined. Growth has been strong for the last 3-4 years with levelish oil production. Previous level/declining oil production has accompanied slowdowns/recessions. This inability of oil production to rise with global growth is IMO the clearest warning signal that a peak is here/imminent.
tw
Another point about growth (of world GDP) vs oil consumption: one could argue either way by also saying that there's been economic growth but there hasn't been oil usage growth, i.e. world isn't that oil intensive anymore and oil doesn't matter.
Now, this also can be misleading. I'm sure we can have plenty of financial growth by moving funny money around (US derivatives business since the housing boom, anyone?) and not use a huge amount of oil for that. However much of that financial growth does not translate to anything resembling growth in the productive non-financial sector (US being a great example of this since the beginning of the 80s up until now).
In the end, we can't feed or live by paper money alone, so I'd initially cut away the financial sector completely from economic growth for this comparison.
As for this trend overall, I think the question is more complicated than just oil production vs growth. Ayres et al have been studying this for quite a while and I recommend the paper 'Accounting for Growth: the Role of Physical Work' as a starting point for those interested in the study of this.
My assumption is (not necessarily correct) that as EROEI has been shrinking and continues to do so at least for crude oil production, the amount of available physical work for the economy at large diminishes and has to be compensated with the use of more efficient technologies (and practices). Otherwise productive sector economic growth has to stop growing as well.
I've always found the argument that we've moved to less oil-intensive growth a bit spurious. In the OECD it's true on the surface but only because a lot of the oil-intensive industries are now located in developing nations. We still use the products of those industries. Factor in energy used for shipping and you could argue that we are MORE oil intensive.
But that aside, the biggest recent growth has been in developing countries that are undergoing an industrial revolution that is highly oil-intensive. Highly energy intensive full stop.
I think the argument that EROEI is declining is spot on, not just for oil but coal as well. Not sure about gas - does gas obey Hubberts curve or is it much flatter for longer?
tw
tw
...only because a lot of the oil-intensive industries are now located in developing nations.....
and I would argue as well that this also applies to the US where we have shipped so much manufacturing overseas. I think that China oil and coal use to manufacture products consumed in other countries is an obvious fatal flaw in per capita oil/coal use from the importing countries. Yet we point fingers at their growing consumption of natural resources and act like we are so superior.
D
USA
tw
In the scheme of things looking for the exact time of peak is no doubt unnecessarily precise, but intriguing nevertheless. I agree that there are many signs outside just basic charts / graphs such as your suggestion about failure of production to follow economic growth. Listening to people like Matt Simmons speaking from the front lines sure is alarming also.
I am particularly interested in seeing the initial decline rate and then how it changes as the decline progresses. I just keep being shocked that even a 3.5% annual decline will knock the world down to 1/2 of peak production just in 20 years; 7% would get us there in a short 10 years. And of course the US and UK will be in even worse shape because imports will fall even faster than world production. When I am reminded that the biggest absolute decline in production will be in the first halving period my mind just sort of short circuits.
Henry
Why should "production follow economic growth"? Production of a commodity should follow the price of that commodity, with some time lag, if supply of that commodity is available. The producers don't really care about growth, only price. We all know that growth will effect the price but it is only one of many factors.
I am in the plateau camp but nothing has been 'proven'. Even the net export graph above could be explained by the fact that all of the exporters big customers (except China) are reducing demand so are demanding less exports due to high price/bad margins on gasoline/whatever. Westtexas' model is a wonderful tool to simplify the way we think and talk of oil exports but if exports go down there can be other reasons besides depletion and home economy demand increase. Demand destruction in the importer is possible, is it not?
The price of oil is up 14x in 10 years and demand has proven somewhat inelastic over that time period, maybe we have reached a price where the curve is more elastic.
One more thing: If everyone thinks the price of something is going to go up in the future it has to go down. There are no marginal buyers left.
This is for sure. However, we are measuring liquids production, not 'useful liquids for non-liquid production economy'.
I do agree that it would be interesting to plot the amount of liquids used by the liquid production systems (biofuels, crude oil, synfuel, condendates, NGL, etc).
I would guess that this timeseries would plot as a rising graph, although not necessarily showing a clear exponential trend (not yet at least).
Now getting that data for plotting is a different matter altogether. I think this issue has been discussed here before at TOD.
As for your graph, I am no statistician, but I'd assume you'd have to measure the error for each component measure and then use law of error propagation to calculate the total error estimate (assuming previous component errors were normally distributed).
This would be likely to give you a much tighter "error channel" as you describe it.
Another thing of more interest would be to plot the total error for each measurement point in time separately, as I'm sure the measurement error for crude oil estimates in particular has not remained steady as a function of time in the past 25+ years. Is there a trend in there somewhere, I cannot know, but it'd be interesting to plot it. My guess is that the error has been increasing, esp. for crude oil estimates (i.e. initial estimate vs. the revised number).
Hi Henry,
Put oil price on the world oil production chart. What you are seeing is a production plateau held by a massive shift of economic effort into oil production. That cannot last for long. Eventually the economic loss of trying to grow the oil supply will outrun the economic gain of doing so, and we will fall off the plateau. (and it would be useful later for estimating when NG and Coal will hit maximum price and fall off plateau as well).
The prior up/down swings were OPEC supporting its price band. And further back, the Iranian revolution + wars. Price will let you separate out the true shortages.
The "production plateau held by a massive shift of economic effort into oil production" will also push NG and coal to their peaks as well. It is logical to assume that all fossil fuels will fall off of their plateaus at the same time, and that fall will be a steep one.
Based on what I understand as the frenetic use of rigs around the world, I would not dispute your thinking. I just don't understand mechanically how to incorporate the price into an easy to understand chart that reveals to me that we are about to fall off a cliff.
However, from my experience in markets, that is just how collapses reveal themselves. Sudden reversals of direction that cascade into the unexpected are often the way that things unfold. How many plane flights just took one little unexpected failure to make the news as a crash?
I would be surprised if the collapse in oil production would not seem to come out of the blue for those not expecting it. I keep thinking of Wilie Coyote running off a edge of cliff, suspended in thin air just long enough to give the proper expression of surprise, only to face the law of gravity.
:...an accurate chart ... showing net production ... might show a worsening situation"
Ding, ding, ding! You are the winner. As you say, declining EROEI is the story behind the story that the MSM, politicians, economists and the masses are utterly missing.
I've read that overall EROEI has been declining by perhaps 3.5% annually since 'the beginning'. Since its an exponential decline, the long initial slope is so minimal as to be indiscernable. As we fell from 100:1 EROEI to 50:1, for example, the cost (energy consumed to acquire more energy) went from 1% to 2%. Nobody noticed. Even as it has fallen from 50:1 to 10:1, the cost went from 2% to 10%. OK, now we're starting to notice, but it still doesn't seem that big a deal. But each step down now takes huge chunks out of the net energy available to do actual work, which as is pointed out below, is what is actually required to keep us all alive - growing food, pumping water - and happy (insert your favorite product/entertainment/activity here). The accumulation of piles of money is utterly irrelevant to this basic concept. But free market capitalism will go to its grave believing the opposite. And, oh, in case you haven't noticed, we're now investing heavily in energy forms that have EROEI's in the single digits or perhaps just fractionally above parity. The game is up. This is what lies behind the financial mess going on. We built this industrial society on an EROEI that is two orders of magnitude greater than what we're now trying to maintain it on - over 100:1, and now single digits to one.
And just think, the production of anti-depressants will fail also without sufficient oil, and then where will we be.
I consider the four horsemen of the apocalypse to be (1)deteriorating EROEI, (2)post peak declining gross oil production, (3)post peak loss of oil imports for major oil importing industrial nations, and (4)government response to all the above.
When you estimate numbers for the first three, the results are mind boggling. It is surrealistic to observe where we are in history and to realize it will be we who will experience the obvious consequences.
Excellent post clifman. Your explanation of declining EROEI, with most of the obvious decline occurring in the last part of the curve, reminds me of the article with a video TOD (had a few weeks ago) regarding the analogy of a pond that has a type of lilly growing exponentially. Once the pond is 50% full its on the 29th day of the month and too late to do anything about it, before it fills with lillies on the 30th day.
In this case the EROEI for oil will be dropping off a table just as the world finally notices.
You could have drawn that same channel on the production chart for the U.S. in 1972 and concluded that the status quo was continuing - except that Hubbert's model said it wouldn't.
I agree. I am using my trend channel just as a means to tell when this final leg up from 1983 will exhaust itself. After than I have confidence that the Hubbert Curve will approximate the pattern for the subsequent decline.
Obviously linear trends do not predict nonlinear functions, but within nonlinear functions, there may be many shorter term movements that can be approximated by calculating a linear trend; that is what I am watching.
That is a great chart. It is shocking to know we have only fallen to the middle of the trend channel. I guess this means oil production will have to fall under 72 in a year, or simply hold steady for 2.5 more years before we drop out of the trend channel.
If you look at the way the USA peaked from a distance, it appeared to follow a linear track as well ... until it hit the peak and started going downward. Statistical fluctuations can obscure the real trend.
I'm really dumb. Can someone explain to me how anybody could see these graphs and follow this story and still wonder why oil prices are where they are? I'm guessing that either no one in the MSM is looking at these kinds of graphs or if they are they are simply too stupid to grasp the significance.
Yesteday oil lost 4.4% on the markets. Whoop-de-doo. Articles I've read are saying the bubble has burst. The speculators are in retreat. I'm betting no one in media has a clue about signal-to-noise ratios. The stories talk about how this is the biggest drop in oil prices in 16 years (in absolute dollars). Talk about spin.
All of this tirade is by way of saying good job Rem.
George
George,
You're not dumb. But you are mixing apples and oranges.
"Price" is an arbitrary number that we humans make up out of thin air. If we chose to say, today only, the price of oil is $20/bbl instead of $130/bbl, then so be it. The available quantity of oil will sell out at $20/bbl for the first few early buyers and then there would be no more for the day. Tomorrow the sellers may decide to swing it wildly the other way to $200/bbl and see how many takers they get. Price can be extremely volatile.
On the other hand, "production rate" is not a number we can make up out of thin air. It is a real physical quantity. No amount of wishful thinking can make production rate suddenly surge to any large arbitrary number. It's apples and oranges.
Think of M and K. M1, M2, M3, etc, can be whatever the central bank wants them to be. Kilograms and Kilowatts and especially Kilocalories are not nearly so easy to change. It takes seconds to increase the money supply in various ways. It takes years to increase the oil supply or the water supply (food) or the coal supply or the copper supply.
I think that it also helps to look at monthly average oil prices, which have increased at about 6% per month since May, 2007 (WTI, in dollars). To stay on trend, we would need to average about $140 for July.
Rembrandt I dont understand your classification of different liquids. why polar oil and oil sands should be in other liquids? after all, its just oil at the end. oil sands producers have upgraders and sell wti equivalent (syncrude) on the market.
moreover, this classification miss the most important point: how the liquids can be used. as far as i know, NGL can't be used for transportation. So I think you should not put NGL in the same category as the other fuels. It should be: total liquid excluding NGL and NGL. What is your opinion on that? Did i miss an important point?
Very simple, I am restricted in the presentation by the statistics that are available. I don't have monthly polar oil nor oil sands statistics that are very accurate since these are not published by the IEA or EIA.
I could separate NGL from crude oil, although it would be tricky. However, as Ropert Rapier pointed out:
'butane is blended into gasoline, and isobutane is used in alkylate units to produce high-octane alkylate which is also blended into gasoline. The others can be used as fuel gas in a refinery if economics dictate. So it isn't like NGLs constitute a low-value product.'
'Even the short-chain hydrocarbons in NGLs - besides being used for fuel gas - can be used to produce syngas, which can then be used for all kinds of useful chemicals.'
Rembrandt I dont understand your classification of different liquids. why polar oil and oil sands should be in other liquids? after all, its just oil at the end. oil sands producers have upgraders and sell wti equivalent (syncrude) on the market.
moreover, this classification miss the most important point: how the liquids can be used. as far as i know, NGL can't be used for transportation. So I think you should not put NGL in the same category as the other fuels. It should be: total liquid excluding NGL and NGL. What is your opinion on that? Did i miss an important point?
I think they are classified different because:
* Tar sand is a mined mineral that is refined into "Crude". The peaking profile is therefore different than that of conventional oilfields.
* Polar oil is very difficult to scale, because it requires very long fixed capacity pipelines, so here the production profile is very different from regular oil fields.
Absolutely right on the mark. And another thing I'd like to point out, that NGL can be used as a transportation fuel, and is being used in some countries on a small scale.
It takes more money to extract oil from tar and sands and shale.
Much more costly and resource intensive than crude oil.
Production rates will never be high like the big old crude wells.
A question for the EU folks. A friend of my daughter's is Spanish, working in the medical research field here in the US, married to a US citizen, who is a Spanish teacher. He is becoming Peak Oil aware, and has asked the following question: Should they stay in the US, or move back to Spain, or somewhere else in the EU?
I am from the USA, but my step daughter lives in Spain, and I specialize in sustainable locations and relocations. So I have thought about your question. No area in Spain is very sustainable, even the northwest coastal area which has rainfall now, will not have much in the future due to rainfall decline from global warming changes. There are a few places in the U.S. that are sustainable, but not many due to cold climates and the need for irrigation. See my other comments here today about the collapse that is inevitable, and it will hit the U.S. and Europe equally. Given their professional work, there are probably nice places for them besides the U.S. and Europe. A question arises. How could these areas be sustainable in the past, but not now? The collapse is not like going slowly back in time. For a long time there will be no transportation and that makes all the difference between life and death. They are welcome to send me an email for some ideas. clifford dot wirth at yahoo dot com.
Important (life & death) question:
Where in the USA do you predict life as we know it will probably be sustainable?
As for where it will probably be least sustainable, I can easily guess: Los Vegas, Arizona, etc. But where is it going to be most probably sustainable and why?
Cascadia!
(washington state + oregon + british columbia)
Lots of water, moderate population numbers, plenty of hydroelectric power, and good farmland (in eastern Wa).
Thanks. That's one area I have been ruminating about in the back of my mind. But is it not true that part of Cascadia was contaminated by nuclear waste by the US government during the Cold War and is thus not safe for long term living? Are there parts that are clearly safe of nuclear or other chemical pollution?
More detailed info would be appreciated.
It will not be life as we know it. My above comment tells what would be the best to survive. To survive you will have to become integrated into the agricultural economy and have many survival skills, a community working with you, and the foresight to bring much technology to the post collapse world.
I have to disagree with you about Galicia and Asturias. This is an area that has been continuously hospitable to human beings for over 50,000 years, ice-ages and all. One of Earth's most robust histories of settlement.
You dramatic prediction of meagre rainfall in an area that is green all year round suggest you do not have much familiarity with the geography. Southern Spain is dry largely because the northern ranges intercept so much of the moisture coming from the Atlantic.
Besides, a warmer planet is a wetter planet on average.
I recall reading in the papers recently that Spain is slated to become the next Sahara desert. Global warming does not translate into increased wetness everywhere. Some places will become wetter (apparently Mount Shasta in USA) and some much drier and perhaps inhospitable to human life. I don't think climate prediction models are sufficiently advanced to accurately predict.
That was yesterday, but 2050 is a different day. The best research available shows much decline in precipitation for that region.
Given the state of Spain's economy today (an unfolding disaster already much worse than the US), coupled with Europe's history of wars across the continent, I am not sure I would want to be in Europe when the crap hits the fan. However, as cjwirth notes, the US has growing problems of its own, not the least of which is a growing police state mentality by big government and continued denial of serious climate change and the effects of climate change.
Local, state, and the federal governments will collapse before they can become very oppressive. When there is no transportation and no communication, governments cease to function. And long before that they will be out of money, with huge personnel cuts, and much confusion.
A big concern for the USA is the proliferation of semi-automatic weapons and their continued availability as we enter the crisis. Many people and many of the worst will purchase more weapons as police agencies collapse. The only counter to this is to be below the radar or have more firepower.
I like the idea of living where there are few weapons among the population and then making friends with the police.
Strangely that is precisely why I would consider moving to the U.S in England besides the army & police only criminals have guns. I would prefer to be able defend myself without fear of prosecution then at least fate would be some what in my own hands.
from OPEC World Oil Outlook 2008: " OPEC capacity growth is underpinned by over 120 upstream projects. Total cumulative capital expenditure
to 2012 is estimated to likely exceed $160 billion. These investments are expected to result in a net capacity increase by 2012 of over 5 mb/d from 2007 levels."
????
also from El Badri in the WWO 2008: "I also feel it is important to highlight the fact that we continue to hear a number of voices pushing ideas of resource pessimism, a topic that interestingly has been around
for almost the entire history of the oil industry. This is fuelling speculation. Looking at the overall picture, however, the world’s remaining resources of crude oil and natural gas liquids are clearly sufficient to meet demand increases for the foreseeable future. New discoveries, reserve growth in existing fields, and the continuous application of new advanced technologies should also lead to the world expanding its conventional
oil resource base to levels well above the expectations of the past. On top of this, there is also a vast amount of non-conventional oil to explore and develop.
Availability is not an issue.
Resources are plentiful, but the challenge, particularly for OPEC, stems from the uncertainty over how much future production will be required to satisfy demand for oil while making available sufficient levels of spare capacity."
I read the IEA oil report, delayed by two weeks. They predicted total liquids supply growth for Non-OPEC through 2009, and an increase in OPEC NGL's the same year. NGL's were not regulated by OPEC quota allotments.
Kashagan in Kazakhstan is expected to produce at a 1.5 million BOD on a long term plateau. The Russians have two untapped large discoveries in the northern Caspian Sea. Azerbajain was yet expanding production. Brazil may double production by 2015. Canada is expanding production. Iraq may double production within a half a decade. West Africa is expanding production. Libya would like to expand production if the OPEC quota system will allow. The UAE shall be expanding over the next two years. The Russians have not yet completed the East Siberia pipeline towards China; when completed it should add to world supply numbers. Some heavy oil projects in diverse places are of interest.
I was skeptical when people were writing that oil demand would not wane with higher prices. People are becoming interested in public transportation, 100 mpg scooters, and vacations without travel. The resale value of an SUV has plummeted.
Declining EROEI, exports, reserves, production, along with increasing cost of extraction and market price, contracts economies into a continuous recessionary decline, until internal pressures of militaristic countries politically justifies invasion of oil producing countries to control flow.
One could claim this is what happened with the US invasion of Iraq, under the politically manufactured guise of WMD.
Hey there,
First post for me but reading you for a while. One question is in my mind.
How much oil do we need to build a world without oil?
Can anyone come with ideas, suggestions, links ?
Thank you all for your hard work on the peak oil issues... It is great to see web-communities dealing with it.