Dr James Hansen: Can We Still Avoid Dangerous Human-Made Climate Change?
Posted by Chris Vernon on November 22, 2006 - 2:46pm in The Oil Drum: Europe
Hansen was speaking on climate change but I did have the opportunity to ask him about peak oil.
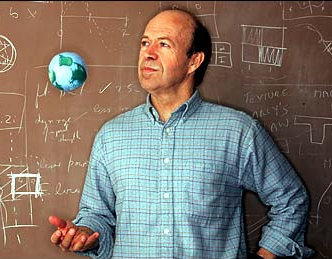
Dr James Hansen (image source NYT)
The world has experienced 0.8°C global average temperature rise over the last century with 0.6°C of that occurring over the last 30 years. Figure 1 illustrates the temperature anomalies of the 1st half decade of this century over the 1951-‘80 average.
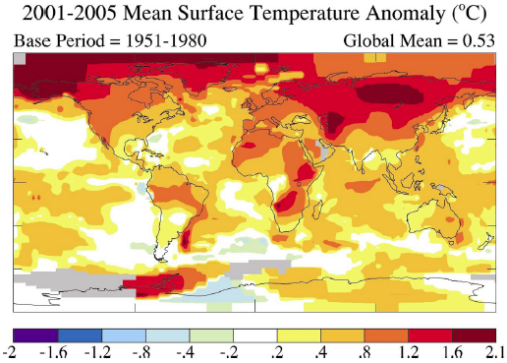
Figure 1
It is exactly what one would expect from forced climate change, the increase is larger over the land due to the thermal inertia of the oceans and it is larger at higher latitudes than low latitudes due to positive feedbacks.
Forcings and the paleoclimate
Hansen’s expertise lies partially in radiative transfer in planetary atmospheres, a large part of his lecture addressed climatic forcing. Looking back at paleoclimatic data enables an understanding of climatic forcing to be developed. Figure 2 shows the familiar Vostok ice core temperature data, illustrating the variation between the last ice age and the start of the Holocene, two periods when the planet was in radiation balance.
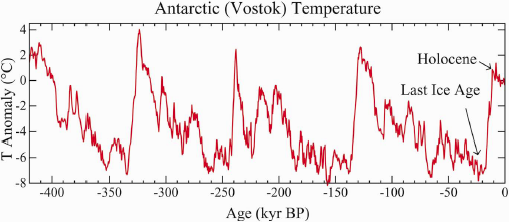
Figure 2
The reason for the temperature difference during these two periods? The climate forcing, mainly of increased ice sheets and reduced greenhouse gas concentrations. Figure 3 calculates the global equilibrium climatic sensitivity to climate forcing producing a result of ~3/4°C per W/m2.
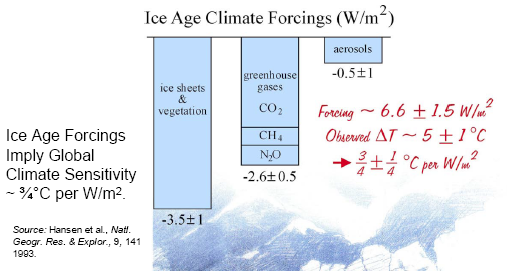
Figure 3
This result is easily checked back through time as we have pretty accurate (±12m on a variance of 100m) historic sea level data from which ice sheet area can be calculated and the ice cores provide historic greenhouse gas concentrations. He didn’t mention it but I gather it is trivial to work out the forcing (W/m2) from ice sheet area and greenhouse gas concentrations. Given these forcings and the previous results of 3/4°C per W/m2, global temperatures can be calculated. Comparing this calculation with the observed temperatures from ice cores shows how just these two forcings account remarkably well for the temperature changes.
Hansen made another point about the temperature changes and greenhouse gas concentration changes, specifically the temporal relationship between them. Data on both can be obtained from the same ice core with high relative temporal accuracy, with only a need to correct for the time it takes between fluffy snow falling and solid ice forming impervious bubbles (the air is younger than the ice, the temperature data comes from the ice and the gas data comes from the trapped air). Comparing the temperature change and gas concentrations Hansen said:
The correlation is maximum when there is a 700 year lag, the temperature leads the greenhouse gas change. So the greenhouse gas changes are a feedback of the climate change.That was news to me.
The conclusions from this part of the lecture were that greenhouse gases and ice area are the chief mechanisms for paleoclimatic changes, however they were “merely” feedbacks from the instigators of climate change which Hansen describes as orbital variations, other small forcings and chaos, stressing the fact that long term climate is very sensitive to very small forcings.
The system is different now though as humans have taken control of one of the main mechanisms through our emissions of greenhouse gases.
At this point Hansen criticised Al Gore’s presentation in An Inconvenient Truth of current greenhouse gas concentrations in comparison to paleo concentrations. Saying Gore was wrong to suggest the temperature change we are likely to experience from current concentrations is proportional to that seen in the paleoclimate. Those paleoclimate changes were predominately driven by ice cover, which as long as Greenland and Antarctica stay roughly the same size isn’t a major factor now and also aerosols which had scope to reduce their cooling contribution as climate changed from cold/dry=dusty to warm wet.
Dangerous Climate Change
So what is dangerous climate change? Surprisingly there doesn’t seem to be very much research on this. Hansen suggested the following metrics to characterise climate change:
- Extermination of animal and plant species, specifically polar and alpine species and those suffering unsustainable migration rates.
- Ice sheet disintegration, leading to long term deviations from paleoclimate data and sea level rise.
- Regional changes including droughts and floods.
For the last 30 years temperatures have risen by 0.2°C per decade. Over northern hemisphere land areas a given isotherm is moving forward at a rate of 50km per decade. A study of 1,700 species found that in the last half of the 20th century the average migration rate forward was about 6km per decade, much slower than the rate the isotherms were moving.Hansen suggested a 3°C warming from where we are now would result in a likely species extinction rate of 50%. 3°C was described as the business as usual scenario. The “Alternative” scenario with falling CO2 emissions and only 1°C temperature increase would result in a likely species extinction rate of 10%.
Greenland
Greenland received particular attention. Three points:
- The area of Greenland experiencing summer melting is increasing at around 0.7% per year with 2005 setting the record melt. This melt water serves as lubrication speeding up the transport of ice to the ocean.
- The GRACE satellite can measure the mass of Greenland ice sheet and is showing a reduction of 162±22km3/yr over recent years.
- The number of ice-quakes, similar to earthquakes and caused by ice sheets suddenly surging forward, has increased markedly. The seismic magnitudes are in the range 4.5 to 5.1 and they are located at the mouths of ice flows discharging ice into the ocean. See figure 4.
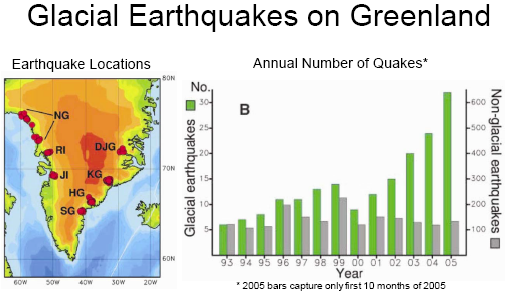
Figure 4Hansen believes the IPCC are conservative with their estimations for sea level rise as they only consider thermal expansion and alpine glacier melt, believing the major ice sheets to be in approximate mass equilibrium and taking millennia to respond. He suggested ice sheet disintegration may start slowly but multiple positive feedbacks can lead to rapid non-linear collapse, noting the equilibrium sea level rise for 3°C warming is 25±10m.
Fossil Fuel
The dominant forcing now at work is human CO2 emissions from the burning of fossil fuels. Figure 5 shows historic CO2 emissions from fossil fuels which we are familiar with.
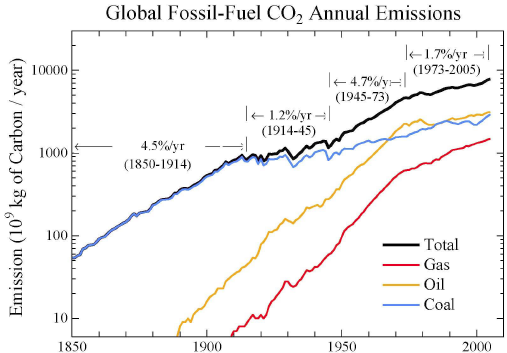
Figure 5When looking forward things became interesting, Hansen suggesting it is feasible to contain CO2 emissions, chiefly because the reservoirs of oil and gas are limited. Figure 6 indicates the potential carbon contributions from oil and gas. This, coupled with the decay of CO2 emissions means that the combustion of remaining oil and gas aren’t critical to climate change.
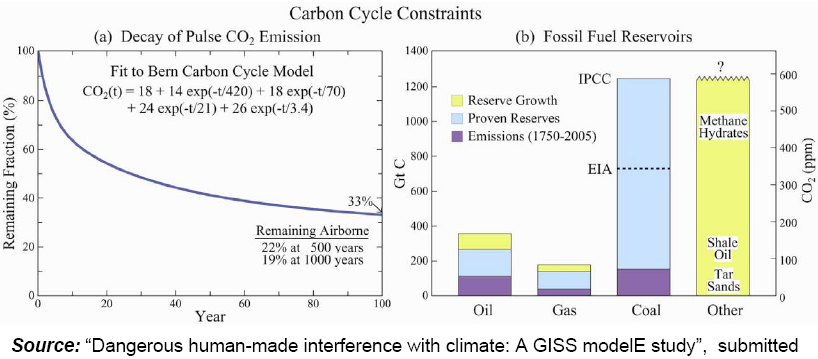
Figure 6, Click to enlarge.The problem lies squarely with Coal. Hansen’s plan for dealing with coal?
- Sequester CO2 at new coal power plants after 2012/2022 in developed/developing countries
- Bulldoze Coal Power Plants without sequestration during 2025-2050
- Stretch oil/gas via slowly increasing carbon tax, avoiding use of non-conventional fossil fuels, permitting time to develop non-CO2 technologies
Figure 7 illustrates the source of future atmospheric CO2 under such a plan. Interestingly this seems to indicate oil and gas peak around 2030 (the point where the gradient of the oil and gas lines dips below 1, but it's not really clear) although it could be sooner that this if one considers falling EROI leading to increased CO2 per barrel post peak more than offsetting the reduced extraction.
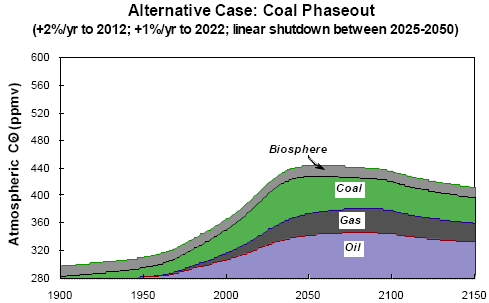
Figure 7Contrast this with the business as usual (figure 8) scenario, noting the assumed 2% decline after 50% depletion.
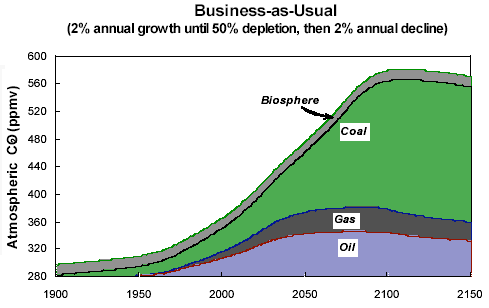
Figure 8What Hansen is saying is that the remaining oil and gas can be burnt whilst limiting atmospheric CO2 to ~450ppm and incremental temperature increase to only 1°C, which really should be the limit unless we want to live on a very different planet. The challenge is that the oil and gas combustion use most of the 450ppm limit, the key therefore is CO2 sequestration or abstinence from coal and unconventional fossil fuels.
This was confirmed in the Q&A session. I asked Hansen his opinion on oil peak within a decade and impacts of peak oil on climate change. He replied that he expects to see oil peak within 20 years as we would have passed the 50% point by then adding, in that case we can probably live with the CO2 emissions from oil without hitting 450ppm. However he did stress the point that we have to start emphasising conservation and efficiency by taxing emissions otherwise we will start squeezing oil/gas from unconventional sources such as shale oil and tar sands. That is something we absolutely can not afford to do.
Someone else asked about aviation growth to which Hansen again replied the climate could probably afford a few more decades of aviation growth, given we address power plants and vehicles.
So where do these views leave us with respect to peak oil and climate change. Perhaps Hansen is right. We can (and I expect will) burn all the oil and gas we can get our hands on, as fast as possible without condemning ourselves to dangerous climate change, if and it’s an incredibly big if, we can get away from coal (and unconventional oil), or at least the CO2 emissions. In some ways this is encouraging as coal is used virtually exclusively for electricity and it is electricity where we have a wealth of potential alternatives: coal with sequestration, wind, hydro, wave, tidal, nuclear fission, solar etc. If we accept that it is physically impossible (maybe unconventional oil will never amount to more than 5mbpd?) to burn enough oil and gas to cause dangerous climate change then the climate change debate needs to be refocused away from SUVs and cheap flights and onto electricity demand, clean coal and other non-CO2 sources of electricity. Can we just let peak oil take care of oil and gas emissions and only pro-actively address coal?
Of course this is only emissions, there are other reasons to try as hard as we can to reduce our reliance on oil and gas. Chiefly due to peak oil and gas inevitably reducing supply and it being easier to choose reduced consumption than to be forced to consume less.
The slides (not for this specific lecture) but for virtually the same lecture given recently are available on Hansen's Columbia University page.
Additional
This view that there isn’t enough oil and gas to cause dangerous climate change is in line with what Anders Sivertsson, Kjell Aleklett and Colin Campbell of Uppsala University published in New Scientist (Oct 2003): ’Too little’ oil for global warmingAlthough estimates of oil and gas reserves vary widely, the researchers are part of a growing group of experts who believe that oil supplies will peak as soon as 2010, and gas soon after (New Scientist print edition, 2 August 2003).
Their analysis suggests that oil and gas reserves combined amount to the equivalent of about 3500 billion barrels of oil - considerably less than the 5000 billion barrels estimated in the most optimistic model envisaged by the IPCC.
The worst-case scenario sees 18,000 billion barrels of oil and gas being burnt - five times the amount the researchers believe is left. "That's completely unrealistic," says Aleklett. Even the average forecast of about 8000 billion barrels is more than twice the Swedish estimate of the world's remaining reserves.
Personnel
Editors
Contributors
Peak Oil Primers
Archives
- November 2010 (3)
- October 2010 (6)
- September 2010 (4)
- August 2010 (7)
- July 2010 (6)
- June 2010 (7)
- May 2010 (2)
- April 2010 (8)
- March 2010 (4)
- February 2010 (6)
- January 2010 (3)
- December 2009 (5)
- November 2009 (8)
- October 2009 (12)
- September 2009 (6)
- August 2009 (5)
- July 2009 (11)
- June 2009 (8)
- May 2009 (16)
- April 2009 (10)
- March 2009 (7)
- February 2009 (10)
- January 2009 (15)
- December 2008 (9)
- November 2008 (9)
- October 2008 (9)
- September 2008 (13)
- August 2008 (10)
- July 2008 (14)
- June 2008 (23)
- May 2008 (16)
- April 2008 (12)
- March 2008 (16)
- February 2008 (9)
- January 2008 (13)
- December 2007 (13)
- November 2007 (16)
- October 2007 (22)
- September 2007 (8)
- August 2007 (9)
- July 2007 (16)
- June 2007 (8)
- May 2007 (7)
- April 2007 (7)
- March 2007 (10)
- February 2007 (10)
- January 2007 (12)
- December 2006 (9)
- November 2006 (15)
- October 2006 (4)
- September 2006 (5)
- August 2006 (5)
- July 2006 (9)
- June 2006 (5)
- May 2006 (10)
- April 2006 (9)
- March 2006 (13)
Vital Trivia
License

This work is licensed under a Creative Commons Attribution-Share Alike 3.0 United States License.
Your conclusion is very inducive :
"Can we just let peak oil take care of oil and gas emissions and only pro-actively address coal? "
We cannot really. Climate change is not yet under control ; there are so many positive and negative feed-backs that we will not be sure of the final temperature until we reach it - a bit like modern weather reports.
That means we must address the issue asap, knowing that "asap" means one or two decades, because "modern" CO2 plants with CCS will not be built before another 7 years on a regular basis, and when they are available, some countries will not accept to pay the additional 30% to sequester.
You did point at an important issue : we do not know what will happen at + 3°C. We have to study our biosphere area by area, including zones where we know little (oceans). Some results do float to the surface, like the anopheles mosquito being accustomed to Central Europe, including the UK, but little is actually known. Few specialists will venture into the "50% biodiversity lost" hypothesis, for fear of too obvious results.
As a side note, it seems to me that the slides 7 and 8 show a very optimistic gas and oil trail post-2100.
There are a few issues to deal with:
1) Note on fig. 2, the temperature charts for the past several interglacials, that trough to peak involves temperature changes of 10 deg. C., or 18 F. Note also that in all but the Holocene there were immediate and progressive declines in warmth, as the interglacial slid inexorably back into the grinding ice age.
If not for anthropomorphic changes since the ancient Greeks, we would probably right now be sliding back into a world where ice sheets were grinding Canada and northern Europe back down to bedrock. As Greg Easterbrook noted in "A Moment on the Earth," an ice sheet is an environmental catastrophe in anyone's book.
If CO2 emissions do not continue to progressively expand after PO, we may actually arrive at a happy medium; no new ice age, and no run away greenhouse warming.
2) I really have to dispute Dr. Hanson's guesstimate about a "50% extinction rate" caused by a 3 deg. C. rise in temp. As noted above in fig 2, the world has periodically seen rapid temperature rises of three times that amount (admittedly from a lower threshold).
We know from the Younger Dryas, as well from earlier temperature shocks, that these changes have happened with startling rapidity, and yet the 17 or so interglacials saw few extinctions until the beginning of the Holocene, which saw an enormous die off of mega fauna, but few changes in micro fauna. (As Tim Flannery put it in "North America: The Eternal Frontier" -- 65 million years of ecological history -- the megafauna disappeared into a black hole; the black hole between the nose and chin of paleolithic hunters.)
3) Note in fig. 6; there is a 50% decline of CO2 levels (from emissions) in a mere 20 years. 66% reduction in a century, and 78% in 500 years. If an economic crash accompanies PO, GW gas emissions will decline markedly. CO2 levels will have more time to balance. Also, with a crash it will be far more difficult to come up with investment capital to figure out how to exploit shale oil and methane hydrates.
4)which brings us to coal. As Dr. Hanson shows, oil and gas aren't as likely to destroy the climate, but coal may. This suggests two very different objectives:
a) It is imperative that we funnel money and political power to those forces opposing mountain top removal, and which block greater coal exploitation. Further, we need to oppose switching transportation from oil to coal based electricity.
b) We need to be honest about the psychological division in each of our minds. On the one hand we are horrified by runaway climate warming, but we also are horrified by the prospect that PO may cause our global economy to collapse.
This isn't just on our site; it pervades institutional thinking, as typified by The Economist. The Economist has gotten the bug on stopping global warming, but they are not only in denial about PO, but they favor doing everything in their power to increase power supplies to increase the chances for exponential economic growth.
We can't have it both ways. If we demand exponential economic growth (and what other kind is there?) then we must accept all the consequences of global warming and the literal rape of the land from strip mining. But if we accept the limitations of both global warming and PO, then we must radically change our conception of what constitutes an acceptable economic model.
In spite of projections close to CERA's, it's getting harder and harder to sustain the CO2 concentration scenarios used by these people up to now.
Of course they still need to check their coal projections, peaking by the end of the century, almost 50 years later than technical projections.
Still, even if the Business-As-Usual scenario comes to be true for Coal, we'll pass the 500 ppm mark well in to the second half of the century. That leaves Peak Oil clearly as a much more pressing problem than CO2 emissions.
CO2 emissions is a problem now. Because the feedback effects could kill us. By the time we take action, the biosphere could already have lost its capacity to restore the damage.
And because it will take so long to deal with the CO2 emissions of very long lived equipment: power plants last 50 years, cars last 15 years, planes last 30+ years, etc. China has something like 100 coal plants under construction, and once built, carbon sequestration is that much harder to implement (to the point where it will probably never be implemented on those plants).
Peak oil? It's a big unknown. My own view is that we will hit PO (by the definition of an exhaustible resource) but more likely in 2020-30 than on Thanksgiving Day 2005 (Deffyes' date, I believe).
There are a *lot
of alternatives to conventionally produced oil out there: tar sands in Canada, heavy oil in Venezuala, the Fischer-Tropf coal-to-oil process, NGLs. All of these can, and will be scaled heavily (Canada alone will be 5 m b/d). And there is still Arctic oil, deep water oil, plus further exploration and production in Africa.But note the CO2 consequences of widespread coal-to-oil projects.
The state-owned oil companies that control most of the world's oil resources are underinvested and undermanaged. Saudi Aramco is perhaps the best, but in Mexico, Russia, Iran, Venezuala etc, there are serious issues. So there is likely to be more oil squeezed out there.
* peak gas, or at least accessible peak gas, worries me more, oddly. We can substitute gas for oil in a lot of applications, but we don't have ready substitutes for gas (except more coal!). And from Simmons gas graphs at least, 'old gas fields don't fade away, they just die'. We don't readily have the transport infrastructure to get the gas from where it is, to where it is needed, even if we do have that gas.
Your view is not supported either by data or mathematics. There's presently no information to counter the reasoning that we've passed the midpoint of depletion for Convencional Oil in 2005.
You should also explain that increase in Unconventional Oil production if you're aware of the Gas constraints in America.
Oil demand has risen since then. Inventories haven't fallen, as far as I am aware.
Prices have fallen.
If you have rising demand, and stable inventories, then supply has risen.
There is enough gas in Canada for tar sands needs, especially if you count in the Mackenzie Delta and Arctic gas reserves. There might not be enough gas to keep Ontario's lights on, but there is enough gas for tar sands.
Totale is looking at building a nuclear reactor in the tar sands to supply steam.
Luis is talking about conventional oil.
How long tar sands production/unconventional sources can keep up with a 4-5% decline rate in conventional oil production is the big question.
Sorry folks, but it looks like basic supply and demand laws are functioning... and will be at least for the observable future.
LOL - I missed this gem.
Please set the scene for us at the Empire Club as the PM of Canada attempts to explain to his audience that in order for tar sand ops to continue, they must freeze!
NRCAN pegs a 'possible' tripling of production to 3mmbbl/d by 2020 but I highly doubt that as water and NatGas usage rates (let alone the fact that we are using gold to make lead) are completely unsustainable.
The GHG impact of the whole affair accounts for 1/3 of total Canadian inputs - 1/3!
Suffice to say there are already calls for a moratorium on expansion by the city, native groups, greens and opposition parties alike.
I agree by 2020 3m b/d is pushing the infrastructure to its limits. But by 2040 or so, 5m b/d seems very possible.
On the natural gas question, what I have is the data point that 0.8 mcf is needed to produce one barrel of oil from tar sands. (that was in the fact sheet for one of the income trusts).
5m b/d is 1.825bn b/d pa, which is therefore 1.46bn mcf. I haven't done the reserves comparison (which would have to include the Mackenzie Delta and offshore Arctic Reserves) but this doesn't seem to be impossible. And there is the possibility of using 'mini nuke' nuclear reactors as steam sources.
Water is tricky, but again not impossible. 1. better recycling of water 2. pipe it from further away.
I suspect carbon sequestration will be used for the later plants, to reduce CO2 emissions.
At some price for oil, the political constraints can be bought off. As Alberta's population rises, it will get more and more difficult for a Federal Government to ignore that electoral impact, and Alberta itself needs that development and investment. When the Feds and the Provinces get aligned, things happen (think the reforms to the Canada Pension Plan).
This statement is nonsensical, moreover, you completely hand wave the moratorium calls away.
Meanwhile, the Mackenzie Delta pipeline is already held up by the D'nay nation nor have we covered how said pipeline is going to traverse a tundra of buckling permafrost.
At the current slope of the CO2 line, we will pass 500 ppm in 85 years.
But at the rate at which CO2 emissions are increasing, (the second derivative), it will be less than 50 years-- the rate of CO2 emissions is accelerating.
Assuming world GDP grows in the next 44 years as it has since 1950 (2.2% pa real) then world GDP will be 2.7 times what it is now in 2050. At the post 1990 rate (2.9%) it will be something like 3.7 times.
That would imply a CO2 growth pa of something like 4-5ppm (ie rising less quickly than GDP).
What the Stern Review says is that scientists think 450ppm is probably the safe level, beyond which we should not go.
It then says that is no longer practicable or achievable, so it assumes 550ppm is what we should aim for.
http://www.hm-treasury.gov.uk/media/999/76/CLOSED_SHORT_executive_summary.pdf
If we hit Peak Oil, my suspicion is that CO2 emissions will accelerate because the only practical substitute with current technology is coal.
You should read a bit more of the information here at TOD to understand how unlikely that is.
The structural danger is global warming (because of the uncertainty of a planet with a radically destabilised climate).
Peak Oil? Some day. When I don't think anyone knows.
* remembering what compound growth does. a 1% change pa, sustained, has huge consequences
Matt Simmons once said: "I'm sixty, I've never needed medical care; can I say that I'll never need to go to the doctor?"
Of course he can't, at least with the pathologist he has an appointment.
I'm getting weary of this cornucopian discourse. I'd recommend the reading of prof. Ayres' work or of prof. Charlie Hall.
At least you seem to know that it won't be in the next decade (contrary to maths).
It will come (definition of an exhaustible resource). At which point we will be forced onto backstop technologies (whose primary danger is that they produce CO2 in massive quantities). The Chinese are already going down this route.*
What I do know is that many of the world's oil fields are currently exploited with bad technology. There is no way that the kind of intense effort that has been brought to the North American market has been brought to Russia, the Middle East and Africa or even parts of Latin America.
How much there is out there I don't think anyone knows. I don't buy 'cornucopian' arguments but I don't buy doomsayer ones either.
* as I said previously, peak gas worries me a bit more. Because the underlying hypothesis, that we have 20 years more gas than oil might be wrong, and (anecdotally from Simmons) gas production falls off much faster than oil production. And the world's gas is not as easily accessible because of the infrastructure issues. And gas is the clean fuel-- the alternatives are all dirtier.
PO is threatening us to lose some quality of life (good bye SUVs), being of suspicios value anyway. GW is threatening the very ecosystem we live in. And yes, I'm also worried, actually horrified by people thinking that the natural constraints on production will "do the job for us" as long as handling GW.
Left unchecked the immediate answer to PO will be coal and tar sands. Statements like "we will never reach 5 mln.bpd from tar sand" are naive, even more - they are close to irresponsible. Never? Do you have any idea how our spoiled society will react to $200/barrel and gasoline rationing? If we dare to face it, the really "incovenient truth" is that we have 40,000 billion boe of fossil fuels, readily accessible in the ground. Some time in future we will add oil shales and gas hydrates to this, likely rounding that to 100,000 bboe. We've burnt just 2,000 or just 2% so far, burning the rest 98%, or converting one form to another is just a matter of scale and economic incentative which will certainly appear. We know how to do it, what on earth do you think will stop us from doing it?
As I understand it, the reactors in question are RBMK designs? ie graphite core? But with a different cooling system than Chernobyl? That's an argument for close monitoring (as you said: 1 bn euros already spent on additional safety features) not for shutdown.
Whilst you and I have argued the toss on new nukes, I am the first to admit that existing plants should be run for as long as feasible, as the alternatives are entirely unpalatable (bunker oil, lignite, etc.) especially given the looming Sibero-European gas shortage.
If you live in Atlanta now you might find the chapter on the Southern Company quite interesting in the book below-- it's a good light read, well written if layman-oriented (paperback out soon). I would be the first to admit that persuading them to build new nukes, in place of old coal, is a good idea!
http://www.houghtonmifflinbooks.com/catalog/titledetail.cfm?titleNumber=688428
http://www.amazon.com/Big-Coal-Behind-Americas-Future/dp/0618319409
http://www.globalpublicmedia.com/interviews/709
Nope. No RBMK reactors were built outside former USSR. The reactors in question are of the VVER-440 type, a predaccessor of VVER-1000, which is currently the standart of the Russian nuclear industry.
RBMK is a dual-purpose fast neutron reactor and therefore the soviets were not interested in exporting the technology. How close were the relations with the former socialist block, USSR wanted to keep a monopoly on the nuclear weapons and did not want other countries to get the ability to produce plutonium.
AFAIK the only functional RBMK reactor outside Russia now is in Ignalina, Lithuania due to be closed down in 2009 (the first unit was closed in 2005, and the last reactor from the Chernobyl plant was closed down recently).
The Balkan situation for this winter is quite worrisome indeed, but probably will be alleviated to some extent next year after Romania starts its reactor in Cherna Voda. My relatives are reporting for electricity price hikes which are hitting the lower and middle class quite badly (the average income stands at ~200 euro/month, while electricity rates have gone up to euro 0.11c/kwth recently). The problem promises to be excaberated by the problems with import of coal from Russia and Ukraine. The whole region lacks NG and oil reservs, while coal is small and of poor quality.
OTOH the question is a little bit overblown by the bulgarian authorities, which hope to achieve some renegotiation of the agreements with EU, or at least to postpone the closure of the 2 units. I have to scoff at this, because the reality is that they missed the train by some 10 years for this; trying to catch it now is not improving a lot our image within the EU.
The good news is that the 2 1000MW units in Belene are in an advanced preparation stage and will most likely be built withing 5 to 7 years.
Nothing wrong with the basic design (a friend of mine works for NASA: the Russians are good at big technology like rockets, better rocket boosters in some ways than the Americans-- they don't take huge leaps, do everything by increments)
but
the Soviets (better word) let themselves down on maintenance, operation, safety.
And there was an arrogance re design, eg in the absence of a proper containment building.
In Eastern Europe there is really no easy alternative to nuclear. There is coal, but we all know the problems with that. And there is Russian gas, which the Russians themselves don't have enough of (and are prepared to play politics with Ukraine about).
Wind is pretty much a nonstarter, I think (memories of the European wind atlas, the wind resource is at the fringes of the European continent, not at its heart). Ditto solar (except for water heating, where Bulgaria should be in a good position?).
Hydro the problem is the snow melt is not reliable-- I know this is the problem in Greece. So the Greeks use lignite -- ugh.
Crete and some of the islands are good for wind. Although there are migratory bird routes. When I was in Crete I noticed that there main power plant is an oil fired thing-- you can see the layer of haze across Heraklion Bay. It is a natural for more wind and for pumped storage, and helpfully, the locals don't think windmills are a blot.
true enough. I can argue though that Chernobyl was such a huge hit to their self-esteem they are still trying to recover. It is of course a bare statement but according to some sources I've read the current state of the Russian nuclear industry (in terms of safety and maintainance) is at least equal to its western competitors. Unfortunatley much of the evolution in thinking comes after a crisis has been reached...
There is coal
Coal and hydro are pretty much utilised. Some excess of coal is left in Poland and Ukraine, but is not that much. NG fortunately is used only for heating and industrial applications.
except for water heating, where Bulgaria should be in a good position?
Hmmmm could be valid for Greece, but hardly Bg. The country is too far from the Gulf Stream and the climate is typical continental - hot summers, cold winters. The average sunshine is not that good. There has been a shift of the climate recently to more tropical - with longer rainy summers, but the winters seem to be getting colder and drier. The wonders of climate change.
Wind is pretty much a nonstarter
In theory we can build some wind, but in practice it is hardly an option. It is too expensive energy source for short of cash countries to choose (after you count all costs) and the only significant resources are offshore - not an option for Hungary or Chech Republic of course.
Overall we don't really have much choices other than nuclear (or building some additional coal). The region is hoping for a healthy economic growth and the energy problems need to be addressed sooner rather than later.
It's obvious from your post that you have absolutely no knowledge on the subject.
Natural Resources Canada predicts that maybe, tar sand production will hit 3mmbbl/d by 2020 - maybe. An assertion from the Federal 06' Energy Outlook based entirely on below ground assumptions of existing ops.
Water, Nat/Gas decline, infrastructure, labor, cost, EROEI, GW and public sentiment as far as GHG emmissions are concerned are just some of the factors NOT considered in this outlook.
The city of Fort McMurray wants a moratorium, the native peoples want a moratorium, the NDP want a moratorium, environmental groups want a moratorium, all want a moratorium until such time as the stated factors above can be addressed.
And you call my statement (which didn't include the word 'never') naive and irresponsible?
If you just allow a friendly advice - be careful when you base your long term predictions on circumstances which may turn out rather short-lived.
As soon as domestic sources are maxed out, it's going to lose a large part of its appeal (especially for electricity generation) and of course its respective domestic lobby, so this would be the best opportunity for carbon free alternatives to substantially gain ground. Many European countries are already on that trajectory.
As soon as the Chinese coal production tops off, the world coal peak is probably not too far off. Maybe not if the US as the country with the largest coal reserves goes coal to liquids in a really major way. But i suspect they will be simply too broke at that point in time to be able to afford that on a scale that would make a difference even if the political class really wanted to go for it (after all ctl technology isn't cheap, and the amounts needed would be humongous).
Kazakhstan is next to China. It's moot whether you produce coal in Wyoming, and ship it to Georgia (domestic production) or in Saskatchewan and ship it to Alabama (foreign trade). Kazakhstan-China is the same.
(for that matter India, the world's 3rd largest coal reserves, is next door to China albeit with a mountain range in the way!-- but I think there is a railway through Assam).
Most of the coal burnt in the UK comes in by ship from Columbia and Australia, you could ship Indian coal to the Chinese power plants that way.
Coal is a global commodity. One of the most global commodities. It was called 'sea coal' in British history not because it came from the sea, but because it was shipped by sea from Newcastle (hence 'shipping coal to Newcastle') to London.
You might see 'peak coal' on anthracite for steel making. Metallurgical coal is a relatively rare beast.
But ordinary coal? Not this side of 2100 I don't think.
* caveat: there's no such thing as infinite exponential growth. But the problem of coal burning is one of CO2 emitted now, that will change the climate for the next few centuries. If we get to 2100, and we haven't destroyed the planet, then we will be using some form of solar power to run our civilisation ('solar' broadly defined: ie wind, wave, geothermal, solar power satellites, controlled nuclear fusion etc.)
.*
actually we use 'solar' power now, it just happens to be the solar rays of the Carboniferous period.To be a devils advocate for a minute, they don't really need to import that coal. The coal may be burnt for electricity or turned to liquids in Russia or USA, and China or whoever-it-is may import the finished product by transmisssion lines or pipelines. Why Japan imports coal directly is obvious - they are on an island and don't have much choice. But for the most of the rest of the world this is not a major problem.
China to reduce reliance on oil imports by basing energy supply on coal
China will reduce its reliance on petroleum imports by basing its energy supply on coal and developing new and renewable energies, said a senior official with the National Development and Reform Commission (NDRC) on Tuesday.
The Chinese economy has maintained a growth of over 10 percent for three years running so it is normal for China to see a rise in its oil imports as well as its demand for energy, said Zhang.
"Other industry experts worry that China's coal resources are not so rich: verified exploitable coal reserves were 188.6 billion tons at the end of 2002, but the average resource recovery rate was only 30 percent. Calculated at an annual coal output of 1.9 billion tons, the reserves would last only 30 years."
http://english.eastday.com/eastday/englishedition/business/userobject1ai2215168.html
Therefore allow me a calculation:
188.6 billion tons/2.2 billion tons=85.72 years x .30 =25.7 years reserve at current production rates
and
188.6 billion tonnes x .30 =56.58 billion tonnes URR(Ultimate Recoverable Reserves)
However the growth rate of use of coal is from end 2002 to end 2005 5%/annum or about 100 million tons(from 1.9 billioin tons to currently 2.22 billion tons/annum). With a 10% growth rate for the economy and 70% of energy from coal, there is a high correlation here. They are the factory for the world. World growth is based on cheap coal for China and eventually for India. When China can not mine a larger amount of coal per annum(or import it) we will hit a wall in terms of cheap production and growth in Asia. the Peak Oil argument is based mostly on transport for the industrialized countries. However most world growth is in India and China from coal.
Where is Peak Coal for China?
(presuming possibility of 100 million tons growth per year in production indefinitely which is highly improbable)
Year billion tons/year
2003 1.9
2004 2.0
2005 2.1
2006 2.2
2007 2.3
2008 2.4
2009 2.5
2010 2.6
2011 2.7
2012 2.8
2013 2.9
2012 3.0
2013 3.1
2014 3.2
2015 3.3
2016 3.4
2017 3.5
2018 3.6
2019 3.7
2020 3.8
2021 3.9
2022 4.0
Total 57.0
It is all used up in by 2022(as above) if they use 100 million more tons per year. Otherwise growth in Chinese economy will stall or they will have to compete more vigorously for the oil and gas resources, speeding up the WWIII scenario with USA. As coal is only 2/3 of energy needs in China and car use is growing this conflict will come anyway. The USA will also rely more on coal to replace dwindling oil, masking Peak Oil and Nat Gas with ethanol and Coal to liquid(CTL). The Chinese will probably never be able to achieve such a high level of coal production as above in later years however so their supply will last longer but economic growth will stall quicker causing mass unemployment and revolt and competition for other fuels with US/Japan/EU will come that much faster.
a very good point.
Indeed, one of the key reasons for Britain's early lead in the Industrial Revolution was that it had coal.
Britain ran out of wood. One solution was international trade and colonialism (New England timber). But for fuel, it needed a closer source. And 'sea coals' (how they were transported as opposed to their source) had been used for domestic fuel since the 13th century.
Once the mines in Cornwall needed pumping out, it was a short step to Thomas Newcomen's steam engine.
So if we ran out of oil, we would burn wood, where we had it.
The Dutch Empire in the 17th century was every bit as grand and worldwide as the British, but the British had mountain streams (to power the woolen mills) and the Dutch only had windmills.
And then James Watt transformed the steam engine in the 18th century...
I would expect more even heating from evenly mixed greenhouse gases. And despite the difference in land and water heat capacities, I would expect that the oceans at the equator would be much warmer than the poles.
There also seems to be a striking contrast between the hot Arctic and "unchanged" Antarctic. Can some one explain why the Arctic is so much hotter than the Antarctic? From this picture I would guess that currents bring more heat north than south? If so Fig.1 might be more informaive as illustrating differential heat transport and thus a clue to the climates internal variability rather than an effect of rising CO2.
Is there a connection to having bigger ozone holes in the Antarctic? Are there differences in the behavior of the polar vortexes? I can see that we have an increased blanket of CO2 but I really don't get the jump to CO2 explaining this map. This map actually makes me more of a CO2 skeptic.
Your Question:"There also seems to be a striking contrast between the hot Arctic and "unchanged" Antarctic. Can some one explain why the Arctic is so much hotter than the Antarctic?"
I refer you to this Wiki-link:
The Artic is an ocean, and the Northern ice probably doesn't get much higher than 10ft above sea level. The Antarctic is a huge continent with a mile or more of ice piled on top making it the highest avg elevation of any continental landmass. The high, cold winds flow relentlessly from the cold, high interior downhill towards warmer sealevel; these are called katabatic winds. This wind motion causes weather fronts from outside Antarctica to rarely penetrate far into the continent, leaving the center cold and dry. The Antarctic Circumpolar Current additionally helps prevent easy thermal mixing with warmer waters to the degree of warming the coastlines too. Thus the year round iceshelves, but larger in winter, of course.
From Wiki:
-------------------------------------
Antarctica is colder than the Arctic for two reasons. First, much of the continent is more than 3 km above sea level, and temperature decreases with elevation. Second, the Arctic Ocean covers the north polar zone: the ocean's relative warmth is transferred through the icepack and prevents temperatures in the Arctic regions from reaching the extremes typical of the land surface of Antarctica.
---------------------------------------
Hope this helps answer your questions. Polar Bears might find Antarctica too cold, Emperor Penguins would think the North Pole is too hot! But some poor, sun-scorched desert bastard like me finds this fascination with frigid Antarctica to be just right. Go figure!
Bob Shaw in Phx,Az Are Humans Smarter than YEast?
You ask good questions, fist of all these charts are continuously shown in a cylindrical projection making the poles straight lines - making them quite awkward to show global data much worse to get an insight of the poles.
Both poles are cooling. This is much more evident in the Antarctic, where only the Larsen peninsula shows a different trend. The Artic is showing both trends, cooling near the pole, heating on the outskirts:
I've never seen a good explanation for this cooling either from the warmers field or from the skeptics field.
Leroux says that the MPHs are incresing in activity, causing major climate disruptions. But he argues that it's the cooler temperatures that are increasing the strenght of the MPHs.
If Leroux is right we still don't know what is causing the poles cooling. At least I don't...
The brief explanation is, uniform greenhouse gas concentrations do not result in uniform heating over the entire surface of the globe. The physics of climatology don't operate that way.
I'm not sure what connection there is between the map posted above and arctic temperatures. The map shows ice concentrations and ice drift patterns.
I hear AGW believers make the same commnets about any and every change. Those changes are completely in line CO2 models.
But what does that mean? Could you provide a mechanism that shows why this mechanism that causes the north to be warmer is unique to CO2 forcings and only CO2? If the ocean currents are the mechanism that redistribute heat unevenly to the north, then any forcing can claim support for their model.
I still see solar, and the IPCC admits a lack of understanding of about solar effects. But the graphs in the IPCC's solar reconstructions show marked increases in solar activity the past 100 years, a correlation that rivals CO2.
http://www.grida.no/climate/ipcc_tar/wg1/245.htm#6112
The IPCC chart I linked to shows reconstructions that clearly show a sharp rise from 1900 with a drop mid century and a rise to currently new heights.
And NOAA has an article with a very similar account of increased solar activity.
And other places in this thread I have provided links from paleoclimate scientists suggesting increased solar.
Interesting Luis. What are the dates for the polar coolings? There is new data published this August that the Oceans have cooled significantly since 2003.
Only the peninsula of the Antarctic has shown warming and it appears that warm waters circulating down from South America may be the reason there. But the current around Antarctica prevents any further influence from tropical waters.
Here and elsewhere I have read about a weak Arctic polar vortex causing warmer conditions around the outskirts but I don't understand the mechanism.
This plot of "anomalies" already has the natural and expected geographical variation (warmer towards the equator) taken out.
This is likely a plot of recent temperatures above a reasonably long term geophysical average, and is what climate physicists use to discern effects of additional anthropogenic forcing terms such as the greenhouse gases.
I have heard that there have been estimations of 600 to 1000 year lag times between CO2 and temperature and I was not sure how much these were unsubstantiated reports. But if Hansen acknowledges this lag time it begs several very critical questions. Looking at the cyclical peaks of global temperatures as displayed by the Vostok ice cores Fig. 2. I must wonder:
- What force is responsible for causing the temperatures to rise in the presence of low lagging CO2?
- What force is responsible for lowering temperatures when lagging CO2 is at its high points. (This cast great doubt on run away heat predictions induced by CO2)
- It would be a fallacy to assume that the force that initiated the warming independent of CO2 stopped after 700 years just as it would be fallacious to assume that this force continued. But I do not see Hansen address this, but he quickly jumps to CO2 as a feedback mechanism and implies the CO2 is responsible for the remaining temperature changes. However scientific rigor demands that until we account for this initiating force, Hansen can not just assume that after 700 lag years that the remaining change in temperature is due to CO2 absorption. Does he account for this non-greenhouse force.
- This lag time makes a very strong argument that CO2 is the result of warming, and so produces the tight correlation. Just as oxygen isotopes may be a proxy for temperatures, just as logically then CO2 may likewise be a proxy for temperatures rather than a cause of warming. If so all the good science that comes from climate models will explain climate change correctly except for proper attribution of the causative factor.
5.Due to the cyclical peaks of global paleoclimates, I would suspect solar changes as the causative force. I do not doubt that CO2 plays a feed back role but how much? According to RealClimate water and clouds absorb many time more heat and up to 85% of all the GHG absorption. Why wouldn't small solar changes -orbital and radiation oputput variations- create enough of a temperature change that is amplified by water and cloud feedback as well as concentrated by oceanic currents?My skepticism increases!
The estimates of CO2 forcing on the climate are not and can not be calculated directly. They are estimated by reconstructing the past temperature changes, removing all the other known estimates and then arriving at at climate sensitivity to CO2. If the other estimates are off and if there are unknown forces or poorly characterized forces that have contributed to the current warming trend, then climate sensitivity to CO2 is over estimated. I agree that there is some feedback by CO2 but I think it is much smaller now being portrayed.
There are more and more paleoclimate reconstructions using 10Be that are showing good correlations with climate change and changes in solar output. Many argue that the past 50 years or so represent a period of very high above average solar activity. Our satellite measurements are too recent to determine any trend other than verify there are 1% changes in output during recent sunspots, so reconstructions give us the best look.
From their abstract.
[b]"Moreover, the 10Be data from the Greenland Ice Core Project ice core as well as 14C support a high current solar activity. "[/b]
http://www.agu.org/pubs/crossref/2006/2005JA011500.shtm
The more paleoclimate scientists look the more solar is involved. This suggests that in deducing climate sensitivity solar effects need to increase their importance in the models and thus the calculus requires the CO2 effects then must be diminished.
Solar radiation changes with time. An increase in solar radiation provokes the system into putting extra CO2 and H2O in the atmosphere. That makes the equilibrium temperature higher than it would if it somehow kept GHG (green house gases) unchanged, in a feedback loop. In this situation, solar radiation is the forcing (it changed outside the system) and GHG are the feedbacks (they changed inside the system). CO2 and other GHG are removed from the atmosphere in a negative feedback, so when solar radiation goes back down the GHG would come down
The actual situation is different. Solar radiation
has not changed much in the last 100 years, but
we have been pumping CO2 and other GHG (but not H20)
and aerosols, changing land use, clearing and
burning forests. We are a forcing. The system responds
to that by trapping heat, raising temperature,
raising H20, melting ice caps which increases
heat absorption, frees more GHG from tundras... Those
are some positive feedbacks. It also responds by
absorbing more CO2 in the sea and in forests, creating
deserts which reflect more heat to the sky. Those are
negative feedbacks.
If an ET came and painted the whole Earth, land and sea white, that would be a forcing. Temperatures would plunge, and the whole Earth would glaciate, in a feedback loop. CO2 would accumulate in the atmosphere (no weathering and no plant growth to take it down), keeping the temperature higher that it should in a negative feedback.
The fact that CO2 was not the forcing in other situations does not mean that it is not a forcing now. The important fact is if raising CO2 raises the temperature, and if raising the temperature raises CO2, then you have a feedback loop. It does not matter which one you raise first.
Solar forcings exist, but they are the wrong scale to explain present warming. H2O is not a forcing, noone is pumping water to the atmosphere, the value is what the system sets it to be and nothing can be done about it directly. CO2 forcing is the right scale and is also controllable by us.
The recent paleoclimate reconstructions suggest that there have been solar changes that coincide with climate changes. Your assertion of not much changing is not true in light of this new information.
some friends of mine work at the renowned Potsdam Institute for Climate Impact Research, so I have a little insight into he actual scientific debate.
They say:
The theorie that GW is mainly caused by solar activity changes has widely been discussed in science and consensus has been reached that it is a minor influence.
Yes, there is some contribution of solar radiation influx changes to GW. However, it does not suffice by far to explain the steep temperature rise in the last few decades.
Cheers,
Davidyson
Information lifted from this book:
The Science and Politics of Global Climate Change: A Guide to the Debate
Andrew E. Dessler, Edward A. Parson
Cambridge University Press (19 Jan 2006)
Davidyson I would have to reply that your friends at Potsdam are now behind the times. There are 2 major reasons why solar theories have lagged.
First is that changes in solar by the Milankovitch cycles happen on large timescales, 100,000, 41,000 year cycle and 26,000 year cycles. So those cycles are not of much use in explaining the temperature rises over the past 50 years, eventhough they frame our current long term warm trend. But the Milankovitch cycles are not the only measure of solar change. They are just the easiest to understand and measure.
Second is the groupthink misconception of a solar constant. We now know that is not true. The sun is a variable star like so many other stars. One aspect of that variability, sunspots cycles, happen on average of 11 years but the intensity of solar activity changes with greater lengths of periodicity. And just counting sunspots is only a loose proxy for solar output. Even as we approached a solar minimum in 2006, the sun released flares as if it was at a maximum. Here are some links on the changing "solar constant"
Now why will they still claim that it doesn't it account for the recent warming? For one, witness the rash of attacks on all skeptics here and elsewhere and ask yourself if you want to be funded for future research how willing would you be to suggest that your research weakens the claims of the CO2 crowd? A simple disclaimer might save you a lot of grief. I have noticed many abstracts now add similar disclaimers despite their research does not compare CO2 forcing with their data. Abstracts use to just summarize the research, but now they add this piece of political protection. Hmmmmmm?
Second they can't account for the recent changes because this solar variability is new information that has yet to be worked into the warming models. The Third IPCC Assessment admits that the level of scientific understanding of solar radiative forcing is "very low."
Our current satellite measurements can only comment on the past 30 years and because of calibration problems, reliability decay of instruments and use of different satellites there is about a 4 W/m2 of uncertainty. To put that into context Hansen estimates a 0.65 W/m2 climate sensitivity due to CO2 as causing the current warming. Total irradiation seems to have a 1% flux over those 30 years. But UV radiation has over a 20% flux. We are only now modeling what the changes in UV do to ozone and the stratospehere. We are only now modeling changes in solar input into the oceans and how much lag time, effect on cloud feedback etc and how that effects land temperatures.
Until we get a longer data set (and the approaching low in solar activity will provide much information), we are left with reconstructing paleoclimates. And we here we are definitely seeing that there has been more papers revealing much greater climate variability than presented in the "hockey stick curve" and conclusions that variability matches changes in solar intensity. Even NOAA's models attribute the little ice age to solar flux. It seems that the past is safer to discuss than the present.
Here's a starter to update your understanding of the importance of solar on paleoclimates.
Science 16 November 2001:
Vol. 294. no. 5546, pp. 1431 - 1433
A Variable Sun Paces Millennial Climate
Richard A. Kerr
Most scientists have viewed the sun's unvarying brightness as the one constant in the ever-changing climate system. Now, in a paper published online this week by Science, paleoceanographers report that the climate of the northern North Atlantic has warmed and cooled nine times in the past 12,000 years in step with the waxing and waning of the sun. Some researchers say the data make solar variability the leading hypothesis to explain the roughly 1500-year oscillation of climate seen since the last ice age, and that the sun could also add to the greenhouse warming of the next few centuries.
http://www.sciencemag.org/cgi/content/summary/294/5546/1431b
how does your comprehensive comment (thanks for that) oppose the view that yes, solar influx changes, but it is not enough to have caused the observed temperature change?
Is all you are saying "we don't understand the sun properly yet, so CO2 contribution to the current warming is questionable?"
Puzzled,
Davidyson
The people who dismiss solar influx as not enough are, from what I have seen, referring to the 0.1% measured changed in Total Solar Irradiation during sunspot cycles in the past 30 odd years of instrumental measurements. This does add about.34 W/M2 And if that was all there was to solar variation I would agree that the sun is not the major player these past 30 years. But there are other cycles such as the Gleisberg and Vries-Sues cycle that vary solar intensity.
The current modelers do not know exactly how to quantify and incorporate the increased importance of solar as doucmented from growing number of paleo-reconstructions that show climatic change correlates with sun cycles. But I gurantee we will see greater understanding of solar importance and dwindling CO2 importance over the next 10 years. And with the approaching "new maunder minimum" nature will soon provide enough solar variation to give our climatologists a real-time education.
I am even going to bet James Annan $100 that average temperatures will decrease by 2030.
Still puzzled,
Davidyson
Milankovich cycles have been known since the 30's.
But solar radiation does not show a trend in the last
decades, so you need to explain how it is causing the warming since the seventies. That is what I meant with solar forcing not being the right scale.
There is also talk of a 1500 year solar cycle, that shows in glacial times and would explain the Middle Age warm period, but then we should be in the minimum of that period (it is 700 years later than the last maximum), so it also would not explain the warming of the last three decades.
All this climate information, and much more and better explained by real metereologists, is in http://realclimate.org.
As you say, the typical dismissal argues that over the past 30 years that there has been no significant change in solar activity to correlate with the increased temperatures during that same time. But that is a shallow analysis.
There are several studies ( I have linked to several in this thread) that show that we have been in a period of very high solar activity the past 50 years, even though it has been level during this time period. By analogy if I start a pot of water at room temperature and turn on the stove burner to high, the stove burner has risen to a high level of activity and remains at that level for a period of time. Meanwhile during that time the water shows a definite trend of warming. To argue that the level trend of the burner does not correlate with the rising trend of the water would be very fallacious if not absurd. Given enough time however we should be able to resolve the issue. What we would expect is that if the burner's output stays level, then at some point in time the water will also reach a temperature plateau.
The ocean has shown a gradual increase in temperature during this period of high solar activity, and now as Lyman and Willis' paper show the ocean's temperature steadily rose during that period but has now leveled off and started to fall. (The average temperature of the water near the top of the Earth's oceans has significantly cooled since 2003. New research suggests global warming trends are not always steady in their effects on ocean temperatures. http://www.physorg.com/news78070962.html)
(And this coincides with reports showing that solar activity is now slowing http://science.nasa.gov/headlines/y2006/10may_longrange.htm).
These observations persuade me to believe that solar is the more important warming force as the high levels of CO2 would never predict that the oceans should be leveling or cooling.
I know that, that is why I said "you need to explain". You say that this is a delayed response to an earlier raise. Fine. You have to find a mechanism. Latent heat in the oceans. Great. Then you have to explain why the green house gasses are not really warming the globe, which by very basic physics should. And then you have to explain why the stratosphere is cooling, which the green house gasses are predicted to do. Raising solar activity would heat the stratosphere, and no delayed solar activity with no warming by green house gasses would not cool it.
Check the link you provide. It says "Other studies have shown that a similar rapid cooling took place from 1980 to 1983. But overall, the long-term trend is warming". In other words, do not read too much in a tree year drop, it does not mean that the raise has stopped.
Again, you are reading too much from that article, it is only saying that the solar cycle two cycles removed from now will be unusually low. That is 22 years from now. If you check the graph, they draw the next cycle as same or higher than the current one. If this warming is a reaction delayed half a century or more from a previous solar activity raise, ¿how can the cooling of the oceans be a reaction advanced two decades to the solar activity decline?
OK, none of us is going to solve this issue, we are just parroting stuff we read somewhere else. Weather is not linear by a wide stretch. It would change even if we were not here. And all the changes we are doing to the system will make it change in many complicated ways.
Now, the other discussion, and the one that would be more on topic on this forum (¿is there anybody else still reading these posts?) is, ¿what to do with fossil fuels? I wish we would use much less, for many different reasons, including global warming. But I do not let my desires filter the information I get.
Good question
There is a lot going on on the CCS front.
Check out my link,once there you can click on snapshot of (Petromin Resources)A company I follow that is spearheading large scale CO2 sequestration projects in China and Indonesia where this tech can be rolled out in a much more expediant fashion given lack of regulatory issues and not in my backyard sentiments that exist here in North America.
Hopefully this technology combined with conservation will buy us some wiggle time to come up with new answers.
But for the conservation part to happen like Boone Pickens said we need $200.00 oil
For the CCS part we have to prepare ourselves for the carbon tax worldwide like the one just announced for Bolder,Colorado.
This might happen if more people like Dr. Hansen keep up the pressure with real science.
P.S
Be wary of the doubters
W5 a knock off of 60 minutes in Canada did a show on bunk scientist's who are going around(and getting alot of airtime)trying to debunk the global warming theory.(Working for big Oil).
They showed how almost all of them have not published scientifically in like 10 years and lots of them are professional spin meisters who used to work for big Tobacco.
JMHO
But comments like your sweeping warning and imputing and the recent wave of attacks on any skepticism is a perversion of science and democracy. Are you arguing my skpeticism has no validity? I have spent 20 plus years working on environemtal protection. Far from an oil lackey or schill.
From Global Warming Working Group 2001 of the IPCC
"To attribute all or part of recent climate change to human activity, therefore, we need to demonstrate that alternative explanations are unlikely to account for a set of observed changes"
"It is important to stress that the attribution process is inherently open-ended, since we have no way of predicting what alternative explanations for observed climate change may be proposed, and be accepted as plausible, in the future. This problem is not unique to the climate change issue, but applies to any problem of establishing cause and effect given a limited sample of observations."
So I counter that we need to beware the agenda of those who dismiss all skepticism without supplying valid arguments or by imputing guily by association. They are asking us to close our eyes, cover our ears and go "nya nya nya!. They are the real preverters of science and democracy!
- climate change in the past was not caused by CO2 level changes (entirely)*
and
- therefore climate change now cannot be caused (over a vastly shorter time period) by a known physical principle ie that increasing the CO2 in an atmosphere, increases its retention of heat (reduces reradiation)
The second does not follow from the first.
(in fact, we pretty much know what caused them: Milunkovich cycles ie peturbations in the Earth's orbit around the sun, impacting the amount of solar insolation received.
One big exception. The Permian Extinction of 300 million years ago, which appears to have been caused by a giant rise in the earth's temperature, associated with massive rises in atmospheric CO2, for reasons as yet unclear)
55 million years ago, the earth experienced another sharp warming, the Paleocene-Eocene Thermal Maximum. It caused mass extinctions, and allowed redwood trees grew in Greenland. One of the leading theories about its cause is a release of methane, previously trapped as Methane clathrates on the sea floor.
Releases of mass quantities of methane, currently trapped in permafrost or in clathrates, is one of the big unknowns about global climate change; could climatic forcing from the addition of CO2 in turn cause unforeseen and 'runaway' warming from methane? We don't currently know, which is another reason not to approach CO2 emissions cavalierly. The Sloan report is built around the conclusion that 550 ppm of CO2 translates into 2º of global warming, and Hansen seems to think that 450 ppm means about 1º of average warming, but we could well find out that we are in for bigger (or lesser) changes at those levels, and I think the downside risks are big enough that concerted action to reduce the growth in CO2 emissions is called for now.
As many others have said before, many of the same strategies that address global climate change will also address peak oil, including relocalization, electrified public transport and rail freight, slowing population growth, carbon taxes that encourage conservation (Simmons's presentation from a few weeks back, was posted on TOD, indicated that the 'noise' of volatile oil prices is interfering with the market signals that a steady increase in oil prices would send), improving energy efficiency, and switching to renewables for electricity generation.
The oceans are very close to near historic high levels. The prospect of higher oceans is slim due to the lack of ice sheets in temperate zones to feed that process. The last UN/IPCC Climate Report was in 2001. They are done roughly every five years. The next is due in September 2007. The Global Circulation Modeling (GCM's) for it was commenced in Sept 2004. Early data from the dozen computer models is showing that the oceans will rise less than two metres (six feet) in the next three centuries.
There is not enuf methane in the arctic to precipitate the massive warming cycles that occured 20,000 years ago. The arctic methane will north america's fuel-of-choice for the latter half of this century and most of the 22nd century.
Cracking up: Ice turning to water, glaciers on the move - and a planet in peril
A new study proves it was global warming that sent an Antarctic ice shelf larger than Luxembourg crashing into the ocean. Geoffrey Lean reports
Published: 22 October 2006
Nothing else quite like it has happened at any time in the past 10,000 years. In just over a month an entire Antarctic ice shelf, bigger than a small country, disintegrated and disappeared, altering world atlases for ever.
A new study shows that the catastrophic collapse of the Larsen B shelf, four and a half years ago, was man-made, not an "act of God". It is thought to have been the first time that a major disaster has been proved to have been caused by global warming.
Research at the blue-chip British Antarctic Survey in Cambridge, published last week, has identified the causes of "dramatic warming" of the eastern side of the Antarctic peninsula, where the vast, 3,250 sq km expanse of ice used to be. Gareth Marshall, the lead author of the study, says it marks "the first time that anyone has been able to demonstrate a physical process directly linking the break-up of the Larsen ice shelf to human activity".
The research has also linked the collapse to the hole in the Earth's protective ozone layer that opens up over the Antarctic every southern spring. Nasa scientists reported last week that this year's hole, at a massive 10.6m square miles, is bigger than ever.
It was in March 2002 that the ice shelf - thought to have been stable for thousands of years - suddenly gave way. In just over 30 days an unimaginable 500bn tonnes of ice shattered into tens of thousands of icebergs, drifting in the Weddell Sea. This one event dumped more ice into the Southern Ocean that surrounds Antarctica than all the icebergs of the past 50 years combined.
"This is staggering", said the British Antarctic Survey's Dr David Vaughan at the time. "It fell over like a wall and has broken as if into hundreds of thousands of bricks."
But he added that though man-made climate change was "one of the best candidates" for causing the abrupt break-up of the shelf - some 200 metres thick, and larger than Luxembourg - "I can't, with my hand on my heart, link it to global warming."
And a leading sceptic, Professor Philip Stott, emeritus professor of biogeography at the University of London, insisted that the collapse was "only to be expected", adding that "simplistic, apocalyptic statements about 'global warming' have more to do with myth than reality."
Last year, however, American research showed that no other collapse of this size has taken place in the past 10,000 years, and it is becoming ever clearer that the Antarctic peninsula, which juts some 800km from the frozen continent towards the tip of Latin America, is heating up faster than anywhere on Earth.
The new study reports that it has warmed by a relatively large 2.94C since 1951, six times higher than the global average.
The scientists say that the main cause of the exceptional rise in temperature has been a strengthening in warm westerly winds blowing on to the peninsula.
This warmth melted ice on the surface, forming pools. This water then trickled down through the ice, widening crevasses as it went, thus fracturing the shelf and setting it up to shatter.
The collapse of Larsen B, and less dramatic disintegration of smaller shelves on the peninsula over the past decade, has led to some ominous knock-on effects. Glaciers which had been held back by them have begun moving up to eight times more rapidly towards the sea.
Scientists report that this is happening to some 200 glaciers on the peninsula, 87 per cent of the total.
Melting glaciers have much greater consequences than disintegrating shelves. Since the shelves float on the sea, they do not raise its level when they disappear, any more than a melting ice-cube increases the level of water in a glass. But the ice from glaciers does, because it comes off the land.
Worse, the British Antarctic Survey has found that the same thing is beginning to happen to the vast west Antarctic ice sheet, which scientists had thought would not be affected for 1,000 years. Some 250 cubic kilometres of it is disappearing every year; Professor Chris Rapley, the survey's director, calls it "an awakened giant".
Already the frozen continent's melting ice is helping to raise sea levels around the world by some 2 millimetres a year, but this is expected to get far, far worse. If the entire west Antarctic sheet were to disintegrate, the waters would rise by six metres around the globe, submerging the world's coastal cities, including much of London.
It is much the same story in the north. The Arctic ice sheet (there are few ice shelves there since these protrude from land, and the North Pole is covered by sea) is shrinking alarmingly.
By last month, it dwindled by an area the size of Turkey over usual September levels, the fifth successive year that it has melted far more than normal. It reached its second- lowest extent ever, after 2005, and scientists believe that it would easily have set a new record if it had not been for an abnormally cool August.
Even so, a giant patch of open water the size of Indiana opened up in the supposedly permanent ice cover north of Alaska. And at one stage the ice north of Spitzebergen fragmented so much that, for the first time, a ship could have sailed unhindered all the way from there to the North Pole.
In all, the United Nations Environment Programme says, the extent of Arctic summer ice has shrunk by a quarter in the past half-century, and has lost almost half its thickness.
The rate of loss is accelerating rapidly. Since 1979 the ice has been diminishing by about 0.15 per cent a year. But in the past two summers this has jumped to 6 per cent.
Some scientists believe we are approaching the point of no return, where the process feeds upon itself. For as the white ice - which reflects heat - melts, it will be replaced by dark water, and this absorbs heat. So the ocean will get even warmer, causing even greater melting, until all the ice is gone.
At the same time, as The Independent on Sunday exclusively reported last year, glaciers in Greenland are melting even faster than in Antarctica.
In the past two years alone, the rate of loss has grown by 250 per cent.
Scientists fear that this too may soon become irreversible, causing the whole Greenland ice cap to disappear, raising sea levels by another seven metres.
The melting ice also sends more fresh water into the North Atlantic, disrupting the huge but delicate system of currents that brings the Gulf Stream to warm Britain and Northern Europe, in winter. Research last year showed that the current, which prevents these places from having the same cold climate as Labrador, has already slowed by 30 per cent.
http://news.independent.co.uk/environment/article1919117.ece
My logic is that until we characterize the forces that caused paleoclimates to rise and fall independently of CO2 we can not determine the degree to which the climate is sensitive to CO2.
Your logic disconnect is that just because it is known that CO2 is a greenhouse gas we can not just assume that it is repsonsible for current temperatures. Again the climate sensitivity of CO2 is not directly measured! It is deduced by eliminating "current estimates" of other known forcings and feed backs but does not account for the "unknowns" and the "poorly understoods"!
There is nothing definitive ever published to prove that CO2 causes the rise in temperatures. Only that it correlates 4/5th of the time. Correlation is not causation. Oxygen isotopes correlate even better than CO2 with temperature.
And even if I leave out the poorly characterized solar forcings, there are other problems like poor models of clouds, methane and aerosols. Max PLanck researchers just recently demonstrated that photosynthesizing trees contribute much more methane that any one thought. Actually up until now our experts had attributed most of that methane to humas because their "group think" dictated that live trees don't make methane. Couldn't see the forest thorught the trees!
Clouds are just as poorly modeled as methane. Think of CO2 as a "sheet" while water vapor and clouds are more like a "down comforter". (RealClimate agrees that water is much more powerful absorbing up to 85% of the longwave radiatiion)
So if its a cold night and you double the "sheets", that extra "sheet" is negligible relative to the comforter.
There is a lot of room for debate people.
but we aren't likely to replicate and re-discuss the whole scientific process involving literally thousands of highly specialized scientists on a blog like TOD.
In the end, the layman has two guidings:
- The various climate models do not only try to make predictions about the future, but are calibrated by predicting the past. So they they get fed a starting point for their calculations at some point in the past and then the scientists look at how close they are able to model the already observed climate behaviour that followed until today. The models have become pretty good at predicting the past and get refined with more and more detailed variables and parameters every day. Of course, the models are not - and probably never will - be at any truly prophetic level of accuracy, particularly because complex non-linear systems can always pop up a surprise factor somewhere. But look at it as you look at the probability of finding more oil: the biggest and easiest oil fields get found first - just as the biggest and most obvious variables in a simulation tend to get identified first or second.
- Every professionally managed business does risk managment. The basic formula is RISK = IMPACT x PROBABILITY. If Sir Nicholas Stern is right and unmitigated GW could cost us > 20% of global GDP (which is nicely abstract, but would mean billions of additional people to be thrown into existential poverty and likely hundreds of millions into death), and this has only a 10% probability to happen, then all measures that prevent this from happening that are cheaper than 2% of global GDP "make sense".
How would you estimate the probability that the scientists are right about GW? What impact figure would you give it?Cheers,
Davidyson
He says that there could be a 20% drop in GDP.
But he also admits that if temperatures rise by more than 5 degrees centigrade, the costs are unquantifiable.
So he ignores that part of the 'loss'.
The argument for dramatic action on global warming is simply this: that we don't know how bad it could get, and we don't know when we cross the 'tipping points'. And we aren't likely to know until we have crossed them.
I would argue a 1% chance of a 5 degree centigrade rise from Business As Usual argues for dramatic action. Indeed a .1% chance would seem to me to be too great. The IPCC says there is a 20% chance of that outcome.
A 20% chance of an outcome whose costs are incalculable, and could include extinction of most of the planet's life, and possibly of the human race. (more likely humans will survive in a form different than our current civilisation).
I am constantly guided in this by one of the most profound thinkers about Financial Markets and natural phenomenon: Benoit Mandelbrot, the discoverer of Fractal Geometry. Mandelbrot's point is that the nice, Gaussian, normal curve models we impose upon the world are wrong empirically-- outsize events occur far more frequently than a normal distribution would predict.
That is true of most natural phenomena and human activity. So we could be massively underestimating the chance of the outside occurrence here.
He says that there could be a 20% drop in GDP.
Stern's 20% is based on IPCCs worst case scenario (BAU). Due to PO, these worst case scenarios simply can't happen.
Now the question becomes, do we spend 1% pa over 20 years to save a 5% drop in GDP? The answer changes entirely.
In fact PO brings forward Global Warming: because we will burn more coal. lots more coal. And more tar sands oil, heavy oil, shale oil etc.
So the worst case scenarios can happen.
If there is mass methane release, a big change in the earth's albedo, or massive marine life die-off, then the problem could be a lot worse than we think.
I actually think the outcome is better framed as 'do we spend up to 5% of GDP, between now and 2050, to forestall a drop in GDP of 20% (permanently) and the possibility of ending civilisation as we know it?'.
The good news is that history shows the cost of pollutant mitigation tends to fall over time, and quite dramatically.
Take car,
Davidyson
In the abstract you are correct. The case for GW caused by man's activities is less than 100 %. But it is surely large enough to MERIT PANIC! If we don't do what we can [all mankind, I mean], and your scepticism is misplaced, we have a man-made catastophe. If we make whatever changes are possible, and your scepticism is correct, well, we've improved the lives of future generations. I don't understand why so-called intelligent people can't understand this simple explanation [perhaps their income depends on willful blindnessto the danger and/or destuction]. After all, science is only useful to the living, and two of our major reasons for pursuing it are: mitigation of disaster and improvement of life.
Obviously you feel the panic. I don't. And only time will tell whose feelings were misguided. In this thread I already mentioned that I feel the markets will deal with the level of concern, both politically and economically. Politicians are swayed less by the scientific debate and more by the mood of the voters. I would vote against madatory regulations on CO2 but I would support all businesses innovating in alternative energies and uses by eliminating all corporate and capital gain taxes to stimulate a flow of capital into diverse approaches.
I see things that need to be done no matter what or who is to blame for warming, like wetlands restoration. All those scary scenarios can happen if it turns out solar is the major force. I support energy uses that minimize the disruption of the earth's surface where virtually all species are affected. I just don't buy the CO2 argument. The consensus can decide what to buy, and they can push for their political solutions, but consensus does not decide scientific issues. Verifiable predictions do.
Right now CO2 is what Stern calls the greatest unpriced externality in human history. It's free to emit CO2, so no one pays it any mind.
By the time we know for certain the role of solar variability in the earth's short term climate changes, it may be far, far too late.
Correct me if I'm wrong, but:
- no-one has ever built a coal-fired power station with CCS
- commercial application of the technology is 10 years away at best
- even if it is made to work, the scale of the problem is enormous
To get some idea of the scale of the problem...World CO2 emissions from burning coal: 10.43 GT in 2006
http://www.eia.doe.gov/oiaf/ieo/excel/figure_66data.xls
Volume of one ton of CO2 = 556.2m3
http://www.icbe.com/carbondatabase/CO2volumecalculation.asp
10,430,000,000 * 556.2m3 = 5,799,080,000,000m3 = 5,799.1 cubic kilometres per year = 15.89 cubic km per day.
So, to make coal clean, the world has to bury ~16 cubic kilometres of CO2 every day and hope that it stays there.
Of course, by 2012 when Jim Hansen expects developed countries will start sequestering CO2 the DoE forecasts 12.51 GT of coal emissions, which means we'll have to capture, compress and store 19 cubic kilometres of CO2 per day.
Does any of this sound plausible to you?
Well, every day the world produces about, what? 120 billion cubic feet of natural gas. That is about 4 billion cubic metres, equals 4 cubic kilometres. And something kept the gas underground for a few million years between when it was generated in the source rocks and when we were ready to use it.
Seriously, keeping CO2 underground once it's put there is no big deal. It's the cost of purifying and compressing it, and transporting it to a suitable injection point, that is prohibitive. Coal fired power stations tend to be built downwind of cities, or near coal basins, not over oilfields.
I agree that storing the CO2 may in fact be the easiest part of the problem to solve. I was trying to illustrate the scale of the problem more than anything else.
Compressing or liquifying the CO2 will be very expensive and energy intensive, building the pipeline infrastructure to transport the CO2 will be very expensive, and as you point out, coal-fired power stations are often nowhere near suitable sequestation sites. In my home city of Sydney most of the coal-fired power stations are built near the coal mines of the Hunter Valley (about 200km north of Sydney) but the only viable sequestration sites are the other side of a major mountain range.
Our politicians conveniently ignore these facts when they talk up "clean coal".
I don't agree. To keep the CO2 "down there", you have to have good answers for the following points, answers which I don't think exist yet with sufficient certainty:
- Did the reservoir's internal structure get compromised during drilling, artificial fracturing and the production-related pressure loss?
- Unintentional and criminal intentional leaking during filling must be completely avoided. The actual volume of stored CO2 must be measured continually by independend inspections (otherwise the temptation might be big to just let the CO2 cheaply bubble into the ocean or into the air just claiming to have it expensively stored).
- All holes drilled into the reservoir (even those that were once drilled then abandoned) must be found and be closed after filling with CO2 for absolute tightness for several millennia.
- The CO2-filled reservoirs must be monitored non-stop just as nuclear waste storage locations must be monitored - for millenia.
- If the monitoring shows inacceptable leaking of the reservoir - what then? How do you find out where it leaks? How do you close a fracture maybe miles long and miles deep? What if it is a sudden "blow out" type leak due to some unanticipated structural failure within the reservoir, releasing hundreds of millions of tons of CO2 quickly? Would any of these scenarios be the death spell for all sequestration projects? What would we do with all the supposedly "clean" coal power plants then?
From what I have read so far, CCS is far from easy or safe or even economical.Cheers,
Davidyson
The IPCC report on Carbon Sequestration tackles all these topics in mind numbing detail.
The bottom line: we can do it. We have to trial the integrated technology, but the pieces exist already.
We are far closer to carbon sequestration than we were to the atomic bomb in 1938. And the urgency is just as great.
The costs look painful, but not out of line with the estimated costs of CO2 per tonne ($50-$200) as an emitted pollutant.
Is it the best, or the only solution? No. But it can be done.
Sequestration creates a new problem with the potential (I don't say likelyhood) for desastrous outcomes.
And it is not sustainable, as it is mainly used to dump FF originating CO2 - and FF are clearly finite.
So why go down that path? I don't buy "to buy more time to find a solution". The solution is exists. A friend of mine showed in a quantitative (!) study that the UK can reduce its CO2 emission by 60% using today's technology (see http://www.energypolicy.co.uk/epolicy.htm).
"Buying more time" just means "buying time for more complacency" while the planet is run down even further.
Cheers,
Davidyson
around 4 cents/kwhr. Which doubles the price of conventional coal power, but is about the price of new nukes and new wind capacity.
- we have CCS on other power stations (Weyburn in Alberta, Sleipnir in Norway)
- we have over 10 years of IGCC operating experience
So 'commercial application' is actually now, what we lack are the test bed plants on commercial scale ie 650-800MW coal fired units (Centrica in the UK has announced plans to build one).The nuclear industry was far more of a prototype industry when we started ordering reactors en masse in the early 60s.
On CO2, remember it doesn't have to go away for forever just long enough to reenter the atmosphere when our CO2 output is below the planet's capacity to deal with it.
I'm not expecting we will be burning coal in 2150, or even 2100. Technology will have moved on. So say 100-150 years.
(we may also have genetically engineered some very clever solutions to the CO2 pools-- let them out slowly, and eat them up with algae).
This is a transitional technology, to get us through the tough bit.
http://www.co2symposium.com/IFP/en/CO2site/presentations/ColloqueCO2_Session1_02_Socolow_PrincetonUn iversity.pdf
p.21 scales the problem (1 'wedge' of CO2 sequestration is equivalent in 2050 to putting all of the worlds current oil production pa back underground).
You are allowed your opinion as am I.
That show I referred to was not W5 it was the fifth estate.
Here for your viewing pleasure.
http://www.cbc.ca/fifth/denialmachine/index.html
These ex-tobaaco clowns have me ROTFLMFO
Same lines they used 10 years ago with tobacco "WE have no evidence of that"
Notice how the interviewer looks like she would like to punt them.
http://www.eande.tv/main/?date=111506
After you watch these you should go rent the movie
"Thank you for smoking" (Satirical look at the absurdity of those who Lobby governments)
Honestly, you will laugh your head off.
Cheers
It started in the USA in 1971 with the Powell Memorandum I reference in the above post. This is as serious as a heart attack.
Another good source of information about who's behind the funding of this "work" is Ross Gelbspan.
He has a couple of books out and I interviewed him here:
http://www.globalpublicmedia.com/interviews/721
But are your beliefs that shaky that insult and innuendo is your only recourse?
Correct me if I'm wrong but to me the thickest bars on oil and gas are around 2080.
All - note that past climate cyclicity is dominated by Milankovitich Cycles - orbital variations of the Earth around the Sun. These warming - cooling cycles have controlled greenhouse gas concentrations in the atmosphere - which then have some affect on the climate cycle. Rising and falling sealevels and freezing thawing of permafrost etc. That's why there is a delay between climate changing and green house gasses rising - the cause and the effect.
http://en.wikipedia.org/wiki/Milankovitch_cycles
Today we are in a new ball game where man's combustion of fossil fuels has uppset the equilibrium - forcing climate change at a time in the cycle that is already a warm inter-glacial phase.
If this is correct then the causal sequence is increased temperatures leading to increased CHG. This is suggestive of strong positive feedbacks associated with a temperature rise. One possibility is increased temperatures resulting in "out-gassing" of previously frozen arctic tundra and/or increased microbial activity due to the temerpature rise.
One of the key features of a chaotic system (such as the environment) is that a small initial peturbation may result in significant amounts of change. Since we do not yet fully understand the linkages involved, we may be in for a series of suprises.
There are very few natural mechanisms for massive rapid CO2 release other than volcanic activity. Volcanic activity and the associated release of CO2 may be implicated in the Permian extinction. The fact that in general CO2 rise has lagged temperature rise does not preclude anthropogenic CO2 from being a trigger. We have few other identified natural mechanisms for a CO2 release leading the temperature rise. This seems to have been a rare order of events in the past.
If CO2 release subsequent to a temperature rise can then accelerate the rise, I have little (no) doubt that an initial CO2 release can act as a trigger.
If you factor in realistic estimates of gas, oil and coal, 550ppm looks like the very upper limit, and the BAU usual scenarios are just not credible.
I read the Uppsala University study some time ago, and have been wondering when its implications will filter into public conciousness. This chart illustrates the gap between IPCC and reality:
which is why I am not so worried about GCC.
Coal is regarded as the bogey man, but we are so near peak coal now that production will not be increased significantly , even if there is massive demand for CTL etc (that Hubbert curve...) All that will happen is that the price will rise. It must be all pretty confusing if you are in government trying to develop a coherent policy. So for the doomers, there is still plenty on the downside.
I'm not sure we are near Peak Oil or Peak Gas (although even 25 years away would be something to worry about and do something about sooner rather than later).
But peak coal?
Without really trying China, India and the US have discovered coal to last them 50 years. I've never heard of major coal reserves in Africa but I assume there could be some.
Even in Europe we still have significant amounts of coal left: German and Polish lignite. And the Russians have coal in Siberia.
The thing I've been wondering is how coal extraction will be affected by the reduced availability or higher cost of using petrol/NG products to mine & transport the coal. Would it go more towards electric (and NG/Coal/Nuclear) as an alternate work-force,(can it?), or some revival of Coal>Steam, in either case further ramping up the coal demand, while skinning down the eroei of the product?
And Russian technology is so backward I am sure that they still have coal fired, steam powered mine trucks.
A steam powered car is a superior technology to an Otto Cycle/ Internal Combustion Engine car. The steam car is the poster child (along with the Qwerty Keyboard) of 'path dependence' ie in a new technology, your early choices determine your later choices-- you can't go back. This was a classic case of the 'better man lost': the Stanley Brothers just weren't as good businessmen as Ford and the people behind GM.
Pressurised Water Reactors weren't the ideal nuclear technology for civilian use, but Admiral Rickover's team had already perfected them for naval applications. So the world is a PWR world. Path Dependence.
A well designed steam locomotion system could be more efficient than our existing systems.
http://en.wikipedia.org/wiki/Steam_car
The problem the Russians have is they no longer have slave labour to work the Gulag coal mines.
Steam power in cars may have an application as a bottoming cycle for waste heat reclamation, especially in hybrids, but not as the main power plant.
Check the Wikipedia about efficiency which gives potential efficiencies of 60%. I haven't been able to dig out a mechanical engineering textbook and work this out from first principles, yet.
The Hanson presentation validates what Jean Laherrere has been saying for two years. Even at 4-Tb URR, there ain't enuf down there to justify the A1 & A2 IPCC Scenarios. Coal is the potential culprit for 600+ co2 concentrations and fortunately there are alternatives (nucelar) to mitigate.
And you are hostage to disaster. Lose one reactor and you could lose the whole family (if the fault is replicated).
Ontario Hydro wrote off $32bn on its nuclear plant-- that's effectively $2100 per KW of capacity. On top of the construction and other costs.
I can't see the Chinese building 500 power reactors (ie equivalent to the entire world's existing nuclear reactors in operation).
When the Chinese made this choice, a lot of the 'clean coal' pieces of the puzzle didn't exist. Clean coal has only emerged more recently.
I think nuclear is a piece of the puzzle, but so is 'clean coal'. So is solar. So is wind. It's not a 'one size fits all' problem.
http://www.co2symposium.com/IFP/en/CO2site/presentations/ColloqueCO2_Session1_02_Socolow_PrincetonUn iversity.pdf
Socolow's 'wedges'.
Thats pretty much all in the accounting allready... Monitoring waste for ten thousand years is nearly exactly the same cost as monitoring it for one hundred. Its sort of how discounting works.
Nevermind that we'll be using most of it for fuel and valuable fission products(xenon, rare earths, platinum group metals) sometime in the next century anyways.
I mean look how much the decommission of the UK Magnox reactors is costing - no way could we afford, or maybe even be technically competent to do the work had we not have 30 years of economic growth. If another 30 years of growth is in doubt we had better no do anything now that relies on it!
The principal of discounting is money is more valuable now than later. Its allways true when your lifespan is limited, and nearly allways true otherwise because economic growth is a near certainty.
Remember of course if you choose your discount rate high enough, the problem doesn't exist ;-).
And there is an implicit promise that civilisation will be around in its current form, to look after those wastes-- which is itself an unconscionable burden on future generations.
For example, that liability in the UK is £70bn. It's not included in our electricity bills.
From a total system cost perspective, nuclear power sucks.
Put a carbon price into the system, and nuclear power is competitive (although hardly cheap). Which is why I think there will be a new nuclear generation, but I don't think the US and UK are going to do a France. Sweden and Germany certainly aren't.
Any nonzero discount rate makes anything after a century entirely moot.
If its not, why should we care?
In the US it is. Its a tax per kwhr for the nuclear repository, that has never been built because of politics.
Of course, fluid fuel thorium reactors have a waste stream about 1/1000th that of light water reactors if its really deemed that expensive... which it isn't.
Yeah, I knew someone would say that. They say "250 years at current rates of consumption". Reserves only look good because of low demand. Coal is mainly used for electricity generation, which is only a fraction of energy use.
When you factor in 1.8% growth, those reserves shrink to 150 years. Then add new demand from CTL etc, now we have 30 years. Oh, and not all is economically recoverable, or is poor quality. Lignite is not a solution for Europe, nor is imports. China, India and the US will not be exporting. If China has so much coal, why are they desparate for oil, gas, nuclear and developing fusion?
The price of coal will inevitably rise with increased demand, making it less attractive compared to renewables or nuclear. Add the costs of sequestration...
When you look closer "we have plenty of coal" turns out to be cornucopian hand waving. Which IMO is a good thing.
I also don't see why Europe won't continue to import coal except for environmental considerations.
Do you have any good data on coal reserves? What I know of (Bangladesh) has been a recent history of big discoveries.
Coal is about 22% of world energy consumption, I believe.
Your drop 250-150-30 years seems too dramatic. In practice, if we really started running out of oil, I suspect we would use hydrogen rather than CTL for the majority of our transport fuels (ie still burning coal but via gasification).
History says as demand (and price) rises more marginal deposits are accessed. In a world where oil is $150/bl, the price of coal will be at least double what it is now.
There is a peculiarity with coal. You can't reopen mines, safely, in most cases. The British coal industry is probably gone forever.
China is hedging its bets on generation technology. They are smart people, and they think (very) long term-- a characteristic trait of Chinese leaders since at least 200 BC. To understand China now, you would have to think Europe was still governed by the descendants of the Roman Emperors.
On oil, of course, it is the key to their transport network. One could imagine coal fired locomotives, in extremis, but only in extremis.
Sorry, but you are quite clueless.
Coal from South Africa and Australia reaches the coast of the UK.
http://www.asia-energy.com/
Phulbari Project
Phulbari will feed coal to Asia's major seaborne and Bangladesh's domestic markets. The mine will transform Bangladesh into an energy exporter, spur the country's industrial growth and provide it with a new long-term source of energy.
Bangladeshi coal reserves are about 0.6% of world total. It might be "huge" for the Bangladeshi economy, globally it's insignificant.
Incidentally, as I am sure you are aware, Bangladesh is at severe risk due to sea level rise. A 1m rise would inundate 15% of it's area, displacing 13 million people. Some irony there, I think.
Every time you turn to personal insults, you lose the argument.
Seriously, find out the facts before you start arguing off the cuff.
An even better answer.
'I know, you don't. So you must believe what I say is true'.
The data out there says that there is more than 100 years of coal, even factoring in growth in consumption.
QED.
Ok, as you present no data, I say that is bullshit. Works both ways.
Anyway, you have not disproven my original claim "we are near Peak Coal". Even if coal lasts 100 years (which it won't), we will see a peak within decades. Have you heard about the Hubbert curve?
Greenhouse Gases themselves help the heat remain trapped in the atmosph. longer, then in part creating conditions for more GHG's to add further to the atmosphere. (Melting Peat Bogs, etc)
I was wondering why the problem of Methane (CH4) emission, which is a greenhouse gas with a higher radiative forcing, is never looked at. Methane is closely tied to agricultural activities and is therefore more difficult to control:
src
Actually CH4 forced climate change is now recognized as very important by the scientific community, and it may be easier to limit its man-made emissions than CO2.
Already it is starting to slow down on its own:
http://news.bbc.co.uk/2/hi/science/nature/6170736.stm
Still CO2 is the biggest worry because of its magnitude and length of time in the atmosphere.
http://www.realclimate.org/index.php/archives/2006/10/attribution-of-20th-century-climate-change-to- cosub2sub/#more-355
I'm not sure how to paste the Hansen graph in here, but it gives the estimates.
CH4 (methane gas) is tricky. Some release can be controlled (stop leaking natural gas!). Others could be used (coalbed methane, methane from decomposing garbage).
However some (many) of the agricultural sources (Indian cows) it would be more difficult.
Anyone remember Mad Max III ('Thunderdome') with Tina Turner? She runs her feudal state (Bartertown) using methane from pig manure.
In it, Al discusses how 06' is now the the hottest year on record, the earthquakes in Greenland and the frozen methane in Russia among other items.
He can't say it of course, but if you look closely when he tells the camera that's there's 700 billion tons of methane starting to be released back into the atmosphere, you can see it in his eyes... we're f*cked.
A good example of another "surprise" is the whole revelation termed "global dimming" that got pieced together after 9/11.
By comparison, within the past 20 years half the energy used in the history of the industrial revolution has been consumed, and global average temperatures are rising about 100 times faster than during transitions out of ice ages. The current rate of change in the chemistry of Earth's atmosphere and oceans is only comparable to a few previous mass extinction episodes over the past several hundred million years that appear to be related to radical, rapid climate change.
The rate of change is perhaps more important to the climate system and life on Earth than is the amount of change. A slow rate of change is akin to gently applying the brakes to stop at a light, while a fast rate of change is akin to hitting a brick wall. Both take the vehicle and a passenger from 60 to 0 mph, only one is faster.
Nobody really knows what this means for the climate system, the acidity of the oceans, the physiology of plant growth, etc. Policy-makers ask scientists how much pollution can be tolerated before "dangerous interference" occurs. Unfortunately, answering how much is too much is not possible, and in all probability we have already passed some very dangerous thresholds that will only become apparent as the future unfolds.
There are many reasons why a precise answer to "how much is too much" is not possible. Consider that for any factor that goes into a model, scientists (1) work with what they know, (2) try to incorporate plausible ranges for what they know they don't know, and (3) obviously exclude what they don't know they don't know.
Some would argue that because we can't be sure climate models are correct, we should do nothing. Would "do nothing" skeptics be as cavalier about uncertain dangers if the food being served their children had possibly been contaminated by a deadly poison? What you don't know can kill you. Given the stakes, many advocates for energy policies leading to a curtailment of greenhouse gas emissions take a precautionary stance. After all, if the U.S. is so concerned about security that it is willing to spend about half a trillion dollars a year on the military, what is it worth to help secure our climate?
Computer power limits the ability of models to capture many of the details of change. For example, models can't scale down to the future climate of a single town, making it difficult, perhaps, for local officials to understand the implications of global models. Nor can models usually identify critical thresholds in a complex system with much accuracy. Systems can remain remarkably stable over long periods under stress until something snaps, like a balloon expanding until it pops. The Earth system has been remarkably tolerant of the stresses it is under, but when something finally gives it will probably be "loud." Recent studies of the pace of change in Greenland and Antarctic ice sheets underscore the fact that thresholds can be difficult to detect, and that current models may often underplay the true threats of climate change.
Although climate models have these limits, they also do an incredible job accurately modeling the past climate. For example, when comparing images from weather satellites to the most advanced climate models, one can even see how well models match the actual formation and movement of storm clouds around the globe.
One of the tests climate modelers perform to decide whether human-induced changes in the atmosphere are causing climate change is to run climate models for the 20th century as if we hadn't burned so much fossil fuel. The rise in global temperatures and the shifts in rainfall patterns seen during the 20th century can be accurately modeled only when fossil fuel induced greenhouse gas emissions are included. Natural variations in solar radiation and the shape of the Earth's orbit around the sun do not account for recent climate change. Climate change is our problem.
This is important looking forward as there isn't the same scope now to further reduce ice-sheet cover, increasing the forcing as occurred coming out of an ice-age.
So I don't believe in this 450 or less "comfort zone."
Then it was realized the process was proceeding orders of magnitude faster. Why? Because the meltwater flows down crevasses to the base, lubricating the flow of large sections to the sea. (Okay, this is a potted version, but I'm sure you all get the idea).
We didn't even get something as 'simple' as 'how fast will an ice-cap melt', because we didn't think of something as obvious as its physical structure (it isn't a gigantic ice cube).
What other, probably very unpleasant, surprises await us?
One of the tests climate modelers perform to decide whether human-induced changes in the atmosphere are causing climate change
This begs a question ....
Have any of the modelers use climatic data
inputs from the 1950-1970s that we know are
accurate in an attempt to see if their models
can accurately predict our current climate ???
I'd feel a lot more comfortable with the desire
to alter our emissions if I were convinced that
the modelers were able to accurately predict the
present climatic circumstances ....
Triff ..
More on this topic by Coby Beck can be found here.
Assuming this is a necessary objective, can we as a society make the transition to a mix of renewable energy and sequestered coal without wrecking our economy or suffering years of serious blackouts as we make that transition. It would be nice if one could demonstrate this from a political standpoint.
On a personal level, I think we should be willing to sacrifice some degree of wealth given the disastrous impacts to be expected from global warming. Politically, however, my gues is that there are very few people who take this problem seriously enough to sacrifice a very much wealth.
I think this coal issue is a good one to use when one is addressing one's political representatives. One can very quickly determine if one's representative is engaging in smoke and mirrors if he/she is not willing to seriously address coal usage.
Not to be picky but at this level coal would emit about 1/5th of the CO2 per kwth as natural gas. In the name of fairness you have to extend your proposal to NG powered plants, which would have to sequester at least 80% of its emission.
ie we should equate marginal cost of abatement across all technologies. A tonne of CO2 is a tonne of CO2, regardless of how we emit it, or avoid emitting it.
Some 'old coal' stations would shut. Others would simply buy new carbon permits in the market. Conservation would turn out to be the cheapest 'generation' in almost all cases.
Natural gas stations would go back to their proper use (peaking power, and low local pollution power: eg Toronto building a 550MW station in its harbour, to handle summer peaks when the grid can't bring the power in without melting).
http://www.cramton.umd.edu/papers2000-2004/02ep-tradeable-carbon-permit-auctions.pdf
is a paper that (if adopted) could save the world.
The chances of us adopting it are about zero, politically and socially. But the tool is at hand to save the planet.
Give me where to stand, and I will move the earth.
Archimedes, 300 B.C.
This paper of course would be a huge step forward if it gets implemented. But. Let me address a couple of obvious flaws it has:
1) The point of usage issue. The proposed permist are at the point of fossil fuel production, not usage. Thus a refinary in Russia that exports its product to EU will have to pay because someone else is burning its fuel. This must be addressed by requiring carbon permits from the end users:
- Power stations
- Oil products retailers
- other energy distributors (NG, coal and firewood distributors for personal usage come to mind)
IMO penalising primary producers is totally wrong.1) The internation issue. At international level the amount of permits per country will still have to be allocated. Based on what? On past experience obviously. Thus the rich countries, currently emitting large quantities of CO2/person will be in advantage over poorer countries. The poorer countries will be penalised for trying to get a little better standart of living as in essence permit trading is penalising CO2 emission growth.
I have a counter proposal. It's a bit complex but more fair IMO.
- Let permits still be auctioned on national level but change the way they are allocated per country by implementing the next steps
- Allocate "base permits" per country based on population. For example: we have 6.5 bln.people on the planet, emitting 6.5 bln.tons of carbon. This makes 1 ton/person/year permit.
USA gets 300mln.tons. "base permits", while having ~2bln.tons "allocated permits based on past performance".3) Penalise the difference using international trade of permits. How? Mandate a certain portion of the difference to be obtained from the international market. For example let the portion be 10% for the first year.
US has 1.7bln.tons over limit. Thus it will have 170 mln. tons to buy from the international market.
India for example will have 0.5 bln.tons below limit. Thus India will have 50mln.tons to sell. Auction those on government level.
4) The next year repeat steps 1) - 4) based on past year performance. Increase the international penalising percentage. For example by 1% per year.
P.S. If you think my proposal is good I think we should work out some details and try to promote it, what do you think?
As a result, the price crashed. They subverted the system.
(begin rant about the EU and British government)
This is the typical European game. I despair for Europe in a lot of ways, because vested interest groups inevitably rig the game their way. Europe remains as allergic to free markets as it has ever done.
(also I think that at least Americans can see China, and think about the challenge and threat it poses. Europeans don't seem to have any concept of how much China's entry into the world economic system changes the game, for all of us)
We live with a government and society where the thought that 500,000 Rumanians and Bulgarians might move westwards to find better jobs so terrifies us, politically, that we have moved to block it. We did so because we forecast that 20k Poles might come here, and instead 300k did. Yet there are 30 million people working in the UK! And probably fewer than 200k Rumanians and Bulgarians would move to the UK.
500k number of people move from countryside to city in China every day.
(end rant ;-)
I'll have to think about your trading scheme. My own thought is that taxing the producers is the right thing to do (and you can make arrangements eg for imports of refined oil products) because
- it's easy to measure at the minehead or wellhead
- it's easy to collect
- they will pass those costs down to their customers, each of whom will make their own allocation and production decisions
thereforeit is a relatively efficient tax (or permit requirement).
That's the whole point. As long as the rules are not strictly defined, governments, influenced by lobby groups will screw things up. It's just a matter of will to come up with some logical and unforgivable market-based schema where it is hardly possible to cheat. Auctions are a great idea in that respect, and have that advantage over carbon tax, that they eliminate the tricky question of setting its rate. Carbon tax could work, but I can only imagine what kind of games and political buying and selling will happen once its comes to setting it.
Obviously US and EU have diametrically opposite philosophies on the role of the government policies. Personally I don't know which one is worse, as both seem to be way off the balanced center. Immigration for example (incl illegal) is the motor of the US economy. OTOH I partly share the european concern about what kind of people are coming from East - a certain dosage of conservatism also has its merits. But I am optimist - EU has a history of implementing bad policies, which evolve in the longer run though quite slowly. Sooner rather than later they will wake up for the reality that for China becomes the biggest polluter in town, Russia is not necessarily our enemy etc. I'm not such an optimist for USA - the predominant philosophy here is that things are "fixing by themselves".
(Apropos countries like Bulgaria are quite open for the opposite immigration direction - there are already whole villages of UK citizens living in Bg. The nature is great and the type of living is much more natural... you may consider this as an invitation :)
His recent book: Making Globalization Work, 2006 Amazon
Book Review
"Making Globalization Work": Nobel winner's fresh views on globalization, By Bruce Ramsey, Special to The Seattle Times, Oct. 13, 2006
He founded the Initiative for Policy Dialogue at Columbia University to address these issues.
Here is Hansen's track record on presdictions:
"In 1988, James Hansen, a climatologist, told the US Congress that temperature would rise 0.3C by the end of the century (it rose 0.1C), and that sea level would rise several feet (no, one inch). The UN set up a transnational bureaucracy, the Intergovernmental Panel on Climate Change (IPCC). The UK taxpayer unwittingly meets the entire cost of its scientific team, which, in 2001, produced the Third Assessment Report, a Bible-length document presenting apocalyptic conclusions well beyond previous reports".
This quote is from an awful Monckton article in the UK Telegraph newspaper a couple of weeks ago. It's wrong. Hansen is being misrepresented here.
See discussion here: Deltoid
I have read it. It is far from apocalyptic. In fact, that is my major critique of it.
The inputs of the models are perpetual economic and population growth leading to greenhouse gas emissions (i.e., no peak oil, peak gas, peak water, etc.).
These greenhouse gas emissions are given to climatologist who plug these forcings into models.
The outputs of the models are rather alarming, and are given to biologists and economists to interpret.
The economists wave their hands and say "we have a lot of non-market impacts here," meaning four horses of the apocalypse kinds of events, "that we can't put monetary values on so we are a bit stumped."
The biologists get a bit skeptical about the ability of food to be grown in sufficient quantities and ecosystems to remain intact, etc.
And yet, after all of this, the input assumptions, i.e., we will grow our economies and our population, are never questioned.
A lot of work goes into sorting out what technologies to use to "mitigate" but this is all very weak.
We think we can see the end of world population growth-- when GDP/head crosses something like $10k, world population growth will slow down to almost nothing. Which is somewhere between 10 and 12 billion people.
This has already happened in all sorts of places that once had a 'population bomb': Mexico, India, Morocco, now even Iran (birth control was about as popular with the rulers of Iran as it is with the Catholic Church).
There are a few counterexamples. The Horn of Africa is looking pretty damned close to a Malthusian collapse. Saudi Arabia in particular. Zimbabwe shows what happens when the rulers of a country set out to destroy it. Iraq is of course the Once and Future Zimbabwe.
There are feedback effects. The Sahel is in year 7 or 8 of a drought, and the place is about to collapse-- Darfur. AIDS has shown that whole countries can be devastated-- it won't be the last mass plague either.
The key is the female literacy rate, apparently. Direct correlation with Total Fertility Ratio (children per female per lifetime).
Man is a classic K-strategist, a rat is a classic R strategist. The R-strategist has lots of children, relies on that for survival-- population explodes and collapses in cycle. The K-strategist has few children, and invests huge resources in them (Mrs. Polar Bear nearly starves to death for hers, Mrs. Tiger will fight male tigers to the death to save her young).
As to other economic inputs, the nature of GDP will change. What will be consumed in 100 years will be very different than what is consumed now.
If you can put a price on something, an economy can deal with it.
We aren't pricing the ecological havoc we are impacting upon this planet, whether by CO2 emission, destruction of fish species, etc.
It's what an economist calls a 'negative externality' and all economics shows negative externalities lower total income unless you can work out a way to charge for them.
Who do you think is more correct at this juncture, me or Jim Hanson?
> At 06:58 AM 10/12/2006, Lee Brown wrote:
> >> Dear Dr. Hansen:
> >>
> >> I listened to your comments that were published on the Internet.
> >> You discussed auto efficiency as a possible mitigator of CO2
> >> emissions. I believe this statement is false. This is because
> >> the number of cars on the road is growing. Moreover, more
> >> efficient cars would allow the growth to happen more quickly
> >> because it would remove pressure on the price of gasoline.
> >> There is reason to believe I am correct. We have made major
> >> strides in electrical appliance efficiency, yet electricity
> >> consumption has grown steadily. This is true for the US alone,
> >> nevermind the growth in other countries.
> >> Why should gasoline be any different? It won't be. The world
> >> will continue to consume as much gasoline as can be produced
> >> because demand is growing much faster than efficiency ever could.
> >>
> >> If the world put a soft cap on the total number of vehicles,
> >> say, by increasing vehicle registration fees to price some
> >> people out of having a vehicle, then increasing efficiency
> >> would have the impact you state. But without this second
> >> contraint, you would probably end up doing more harm than good
> >> from an environmental standpoint, because with more cars, there
> >> would be more ecologically damaging infrastructure put in place.
> >>
> >> I believe that you are unwittingly promoting a myth that stems
> >> from the 70's when demand was well below production capacity.
> >> This is no longer the case. The solutions of the 70's no longer
> >> apply. It's just not that easy.
> >>
> >> I mention this because I believe that it could really hurt the
> >> environmental movement to tell people that a certain behavior
> >> will help, only to find out 5 years later that it was no help at
> >> all. Not only would that waste 5 years, it could also create a
> >> credibility gap between the general populace and the movement.
> >>
> >> Sincerely,
> >> Lee Brown Jr.
> >> Pittsfield, MA
> >> M.S. Physics UFlorida, 2000
> >>
> At 05:09 PM 10/14/2006, you wrote:
> > Darnell, perhaps you could send Mr. Brown something to assure him
> > that we took account of increasing vehicle population. Jim
> Dear Mr. Brown,
>
> Thank you for inquiring about Dr. Hansen's published Internet
> comments regarding auto efficiency as a possible mitigator of CO2
> emissions. While it is true that the number of vehicles will
> continue to grow, the assertion that fuel efficiency can contribute
> to CO2 abatement rests not only on recent data regarding demand and
> production capacity but also on the nature of the future vehicle
> likely to be produced. Our analysis found that, with the
> cooperation of automakers and legislators, technological
> improvements can be implemented which allow for emissions
> attenuation to outpace expected growth in the vehicle fleet,
> yielding a net decrease in CO2 emitted. This determination was
> made by not only considering passenger vehicle demand, vehicle
> scrappage rates, and changing fuel efficiency, but also by noting
> population growth, the number of miles those vehicles might be
> driven and the expected cost/benefit (in constant dollars) for the
> consumer driving one of those improved cars or 'light' trucks.
> Below are a few of the references used in developing those
> relationships, with the more general ones coming first and all
> including a short note after, flagging some take-aways.
>
> Regards,
> Darnell Cain (Dr. Hansen's assistant & Co-Author on a related A-Team paper)
> * National Research Council (NRC), 2002: Effectiveness and
> Impact of Corporate Average Fuel Economy (CAFE) Standards, National
> Academy Press, Washington, DC, 166 pp. *Data: feasible
> technologies, expected CO2 abatement
> * David L. Greene and Andreas Schafer, 2003: Reducing
> Greenhouse Gas Emissions From U.S. Transportation. Pew Center on
> Global Climate Change
> <http://www.pewclimate.org/docUploads/ustransp.pdf>http://www.pewclimate.org/docUploads/ustransp.pdf * overview, technology and
>
> policy
> * Ausubel, J.H. and C. Marchetti, 2001: The evolution of
> transport, The Industrial Physicist 7(2), 20-24. * Inertia and
> change in net vehicle miles per driven driver, contrast w/ Pew
> Report.
> * California Air Resources Board (CARB), 2004: Climate Change
> (Staff proposal regarding the maximum feasible and cost-effective
> reduction of greenhouse gas emissions from motor vehicles), June
> 14, 178 pp. *Strategies, Technologies, and practical issues.
> Contrast with government report at
> <http://www.nhtsa.dot.gov/>www.nhtsa.dot.gov.
> * Davis, S.C. and S.W. Diegel, 2003: Transportation Energy Data
> Book: Edition 23, Chapter 3. ORNL-6970 (Edition 23 of ORNL-5198),
> Oak Ridge National Laboratory, Oak Ridge, TN,
> <<http://www-cta.ornl.gov/data/chapter3.html>http://www-cta.ornl.gov/data/chapter3.html > * data: scrappage rates, emissions data, miles
>
> driven
> * Energy Information Administration (EIA), 2003b: Emissions of
> Greenhouse Gases in the United States 2002,
> <http://www.eia.doe.gov/oiaf/1605/ggrpt/index.html>http://www.eia.doe.gov/oiaf/1605/ggrpt/index.html *
>
> data
> --------------------------------------------------------------------
More Jim Hansen....
"The forcings that drive long-term climate change are not known with an accuracy sufficient to define future climate change." -- James Hansen, "Climate forcings in the Industrial era", PNAS, Vol. 95, Issue 22, 12753-12758, October 27, 1998
"John P. Holdren is president of the American Association for the Advancement of Science, director of the Woods Hole Research Center, and Teresa and John Heinz Professor of Environmental Policy at Harvard University. Alan I. Leshner is CEO of the AAAS and executive publisher of the journal Science.
Holdren and Leshner are two people who should know the temperature effect of atmospheric carbon dioxide is logarithmic - that is that the per unit effect of additional CO2 diminishes as the total quantity increases. Anyone with a half-way decent calculator or a spreadsheet program can get a fair idea of the surface temperature increment of any atmospheric CO2 content simply using the natural log of the carbon dioxide content in parts per million with the result in degrees C -- the result is not likely to be perfect since the sensitivity so calculated is between that of Lindzen's clear sky calculation and that of Kondratjew & Moskalenko but it is quite adequate to belie the "biggest culprit" claims.
Those who don't yet have a handle on the diminishing effect of increasing atmospheric carbon dioxide should try it out. The first 20ppmv atmospheric CO2 yield almost 3 °C while boosting that to 200ppmv results in a total warming of ~5.3 °C, the pre-IR level of 280ppmv: ~5.63 °C; current 380ppmv: ~5.94 °C; doubling to 560: ~6.33 °C and so on. To derive the net warming of any increase simply use the formula LN(higher CO2ppmv) - LN(commencing CO2ppmv) = °C increment -- e.g., LN(560) - LN(280) = ~0.69 °C for the expected surface warming from a doubling of atmospheric carbon dioxide relative to pre-Industrial Revolution levels.
Most damningly, the HadCRUT3 data series indicates warming of 0.67 °C for the 30-year period 1911-1940 after cooling 0.62 °C from 1878 to 1910, periods when both rising and falling periods were accompanied by increments of ~10ppmv in carbon dioxide levels. Even ignoring the subsequent quarter-degree cooling from 1941-1975 (concurrent with an increase of ~20ppmv CO2) this still leaves the problem of explaining why the period 1976-2005 should be considered exceptional with a warming of 0.69 °C and why we should now ascribe this warming completely to rising carbon dioxide when there is recent modern precedent without it.
If the world has warmed as we think it has (not guaranteed) then obviously carbon dioxide is far from the "biggest culprit" and these gentlemen are presumably quite capable of determining that, making us wonder what prompted the inclusion of such a silly statement in the above piece. We further note that increasing carbon dioxide is associated with warming periods totaling ~1.3 °C and cooling periods ~0.9 °C for a net change of ~0.4 °C over one and one-quarter centuries with history suggesting a shift to a cooling phase is imminent as another ~30-year phase expires. Hardly alarming, surely -- unless, of course, we get a serious cooling, that could be rather troublesome".
For an explanation, charts and links about mid-century cooling, see What about mid-century cooling?
I regret that somebody used my post as an opportunity to dispute climate change. In fact, it really annoys me.
I wanted to continue the discussion of effective policy for climate mitigation. I agree wholeheartedly with the original post that coal has to be primary target number 1. In light of peak oil, I view the whole hybrid movement as ineffective and unrealistic. It disappointed me that Hansen was a proponent. Climate science and economics are two different things.
There seems to be a mentality that denies that humans could be causing global warming, and/or that we can do anything meaningful about it.
I think the world atmospheric science and climatic science community is as unified on the subject of anthropogenic forcing of climate change as it ever will be, or can be.
And any one of us can look outside our window and notice very significant changes in our natural environment, within our lifespan. Changes which are entirely consistent with a thesis of global warming (true for Toronto and London, at least).
By contrast, Peak Oil I would characterise as the belief of a fringe of scientists and oil industry analysts (caveat: Peak Oil is inevitable, by the definition of an exhaustible resource, when and how fast is what is at issue). Now that fringe has some good arguments (and there are reasons why the consensus of opinion would be against them), but we don't have the data to refute or confirm the thesis.
We also know that in the case of Peak Oil, market forces will exert themselves. If oil becomes scarce, the price will rise, there will be conservation, and there will be alternatives (the speed and disruption of that adjustment could have very adverse consequences, though).
In the case of global CO2 emission the feedback is reversed. Largely, increased temperatures will lead to increased adaptive measures, which could increase CO2 emissions (more air conditioning!). There is no 'market mechanism'.
In economic terms, CO2 is the largest negative externality man has ever engineered (nuclear war would have been of a similar scale, potentially). And it is entirely unpriced.
The question now is what do we do about Global Warming. Because a very significant scientific consensus is emerging that the problem is much worse than we thought, and the consequences much sooner.
Where the cranks and the Jeremiahs were a few years ago, the centrepoint of scientific consensus is moving towards now. Hansen was seen as a radical viewpoint on the urgency of Global Warming, once.
that more than anything is what scares me: the pessimists are being proved right.
As far as discussion of effective personal or public policy, I am all for it.
I would like to encourage people to explore a variety of mitigation and adaptive strategies, but with great emphasis on mitigation and conservation of resources.
My own personal strategy involves designing my life to be as sustainable as possible in the city where I live. I ride a cargo trike and now trying to rehab my old house into a more ecologically sound dwelling. I am gardening, composting, working toward a permacultural yard.
Our city's Midtown Grenway Coalition plans to put me on their Board of Directors at the next meeting in a few days. I hope to work on local policy issues and provide input in a variety of ways to promote a "continuously productive urban landscape" along with more emphasis on walking and biking as primary modes of urban transportation.
There are no real solutions at this point. There are good efforts, and some with more obvious apparent benefits than others.
We need to be wary of unintended consequences of our solutions, and be on the lookout for "unknown unintended consequences" like those we are dealing with today as a result of our technological "success."
Resource depletion and global climate change are examples of "unknown unintended consequences" that are not that difficult to watch for if one reasons out the possible impacts of widescale use of certain technologies.
We could very well have been dealing with these issues thirty years ago. We ought not to be as blind with future technological "advances."
Our current path takes us toward likely chaos or at least to a relatively destabilized world where all are absolutely vulnerable -- even those in fortified bunkers in undisclosed locations.
Of course, it is all about our own mortality anyway. The only question we have to answer is: "what do I want to do between now and whenever I die?"
I am grateful somehow for whatever time I do have, and hope to do my ridiculously little bit to make a positive difference along the way. We are "ephemeral clowns" and we ought to enjoy that while we can!
I do not have the time, nor the inclination, to debunk some of this stuff right now. However, if you want to know what's going on, and talk intelligently about it as Hansen certainly does, spend a couple years reading about the subject in journals such as Science and Nature, not to mention the more specialized journals like Climatic Change. If you want the shorter version -- and want to go from there -- then read RealClimate.
Furthermore, it does not help The Oil Drum's credibility for some commenters to parade such ignorance for all the world to see. For what it's worth, paleoclimatology is a complex subject based on ample empirical data as found in tree rings, ice cores, isotope analysis, etc. There is ample evidence of episodes in geological time of CO2 as a climate driver. This matter is complicated by multiple causes and poor data the further back in time you go. But that is not really even necessary to show, because the basic physics is clear enough and there are no existing identifiable natural climate forcings that could possibly explain what is happening now. Since these changes are happening on timescales much faster than ever occurred in events in geological time, there are open questions -- and the past presents no good analogue to human meddling with the composition of the Earth's atmosphere.
The basic questions as to whether CO2/methane emissions are driving climate change are already decided -- this involves multiple lines of evidence that will certainly not be disputed in any kind of serious way on this thread. As for lag times with respect to CO2 forcing, there is serious physics involved in predictive theories about that -- but, as the paleoclimate record shows, changes are often abrupt -- ie. non-linear -- as the Pleistocene data record shows.
So, if you are some kind of "skeptic" on this thread, study the science for some number of years and then, if you are capable of understanding it, get back to us.
I couldn't more agree with you.
It does not help the Oildrum's credibility when one of is putative "editors" engages in a puerile ad-hominem attack on posters who are trying to come to grips with a subject of some complexity.
I am sorry to hear that you have a full and complete understanding of the topic but do not have the time to make your knowledge available to others. I suspect in the future that what is left of human civilizations will be heard muttering "if only Dave Cohen had had more time . . ."
I am writing to a contact at the UN and requesting that they entertain disbanding the IPCC and seek to contract Dave Cohen in its stead.
I am also requesting Professor Goose revoke your posting rights until you learn some humility. It only took you a few years to understand climatology. I am quite certain you might learn to be civil in under a decade.
Cheers!
However, being familiar with so-called "skeptics" for over a decade now, I know better as to what their motives are.
But here's the real point. We are long past the "engaging with skeptics" point regarding the climate change problem. There is full consensus in the climate change scientific community. As in all science, there are disagreements about filling in the details in various theories. None of this will have any affect on the basic science. The Arctic is melting down. The oceans are warming. The permafrost is thawing out.
So, as a staff member of this website, I felt the need to point this out. Those who choose a path of denial rather than learning are just sending out noise in the vain hope that they will somehow disrupt the strong climate change signal.
As for me being a "putative" editor and you having PG revoke my posting privileges, I am wondering where your delusions of grandeur come from in this regard. I did not attack any specific person personally and was careful not to do so. In fact, the only puerile ad hominem argument stated here was the one you just used against me.
Heh, quote of the century. Welcome to the internet! If you really don't want people to post "bullshit", why do you have open threads? Are they just for congratulating the authors of the articles on their excellent work?
Skepticism is good. Otherwise how do we distinguish the bullshit fron the truth? There is a legitimate debate about climate change. Unfortunately that debate has become politicized to the extent that even pointing out the uncertainty that the scientists themselves admit is labelled "denial".
Seriously Dave, you can't control what everyone says, or thinks, you'll just work yourself into an early grave. Stop reading, or get over it.
Nice post, Dave C!
My favorite GW book: The Two-Mile Time Machine - Alley
Two U.S. climate scientists' blogs (Of particular note because the comment sections contain some very active debate between the scientists, their peers and others):
Real Climate (mentioned above)
Climate Science: Roger Pielke Sr. Research Group Weblog
Two major U.S. climate science websites with good introductions to the climate issues:
Dr. Stephen Schneider's Climate Science - Stanford University
Dr. Spencer Weart's The Discovery of Global Warming A hypertext history of how scientists came to (partly) understand what people are doing to cause climate change. Parallels a book by the same name.
The current Artic ice cover is not looking good.
http://arctic.atmos.uiuc.edu/cryosphere/
The reason I'm asking is that in case the mechanism envolves some kind of terrestrial carbon sink (oceans come to mind), was the assumption that this sink will work at 450ppm with the same effectiveness as with 380ppm, a safe one? Is it possible that we oversaturate the carbon sinks with time and basically doom the atmosphere of high CO2 concentration for many millenuims to come?
Good question at the end of the day I don't think we really know the CO2 capacity of the ocean. We do know that C02 levels have gone higher than 1000ppm in the past. But you hit one of the basic problems with all the data we have. We don't know how much C02 entered the atmosphere and was cycled out in the past. In other words we don't have a good handle on the capacity of the various sinks. And I don't think we have a good way to measure them. So sure we could easily find at say 500ppm we suddenly start seeing increases of 100ppm each year for the same input as a major sink is overwhelmed. Also of course the sinks themselves generally become sources with increasing temperature.
Here is a link about what we do know.
http://www.grida.no/climate/ipcc_tar/wg1/095.htm
But remember the ocean is very sensitive to C02 levels and we don't know the forcing that well.
Russian scientists are predicting cooling in the coming decade. Has to do with the sunspot cycle. (Recall the Little ice age...sunspot cycle)?
One more thing Cohen...there is an opposing point of view to the flock of sheep that are lapping at the trough of all things made worse by man. I don't buy it. And until you prove it, don't peddle your poo as "CASED CLOSED"!
Yup...Criton's book, State of Fear, was aptly named.
NASA is dominated by CO2 believers but they still must acknowledge the role of the sun. They now see low solar activity as causing the Little Ice Age.
They want to cling to the notion that CO2 is now more powerful despite the growing evidence to solar influences.
Despite the growing bulk of solar data, my guess is the AGW believers will not be convinced until we get a cooling spell. Which is soon to arrive if the solar models are true we are now on course for a down turn in solar activity approaching the Maunder minimum.
I find it intersting that this new decrease in solar coincides with the observed facts from Argos that the oceans are now cooling since 2003. Nature will soon decide!
http://www.srs.fs.usda.gov/sustain/draft/histry/histry-40.htm#P338_102405
A couple of factors have retarded global CO2 accumulation in the last 50 or so years:
- it appears the oceans are absorbing more CO2 than they were, which is evidenced by the increase in oceanic acidity. This makes sense in basic chemistry (more CO2, more CO2 exchanged between ocean and atmosphere)
- the developed world has had a massive 'regreening'. It is sobering to think that in 1870, much of New England was deforested. Go there now, and it is covered in dense trees-- but they've only been there a century. The farming was actually bad, and the farmers migrated to the mills, or to the Great Plains as the railways opened those up after the Civil War.
(a lot of New Englanders actually wound up in Washington and Oregon, which accounts for the similar political and civil cultures between the NE and the NW-- there are also certain linguistic similarities, apparently)Similar forest management policies have been followed in Germany, France, Japan, since at least the 1870s. I think Bismark was the one who started planting forests en masse (to improve his hunting, in part).
however the bad news is it appears that whilst an immature temperate forest absorbs CO2, a mature one releases it (trees die and decay). So that process is more or less over.
And looking at estimates of urban and suburban tree cover, the Berkeley Energy Conservation team (the one who discovered the 'urban heat island effect' that you could reduce air conditioning loads by 10% if you made roofs lightly coloured: this is now reflected in a number of local ordnances in the US), showed that urban/suburban tree cover has declined by about 25% in the last 30 years in the US.
So its not likely we are going to have a lot more new trees, at least in developed countries. And the existing ones aren't going to help our case.
WRT to some questions asked above about atmospheric CO2 removal mechanisms. If I recall my facts correctly (and I've not run these past Dave yet), about 50% of all CO2 produced by burning fossil fuel is still in the atmosphere.
From reading this and Lovelock's recent book, a point was made about ocean water stratification. The oceans have a huge capacity to dissolve CO2. However, the exchange only takes place at the atmosphere - ocean interface. There is a stable layer of warm water riding on the surface of the oceans - a few hundred meters deep. This stable warm surface layer does not exchange CO2 rapidly with the underlying colder water. Thus, the thin surface layer of ocean water can become saturated with CO2 - forming an effective skin between the atmosphere and deeper ocean water.
I asked him about peak oil and its impact on climate change (he had presented several ~50-year graphs and I wondered about their base assumptions). I didn't get the impression he really knew anything about peak oil, repeating the common arguments of higher prices making more reserves available and "vast amounts of oil in Canada" etc... I don't believe an imminent peak in oil extraction is on his radar. I had hoped that due to his broad experience and senior position in the scientific community he would have an awareness of imminent peak.
One thing to know is he is a devout Christian. This has enabled him to reach out to the more moderate part of the American evangelical community re global warming.* He has been instrumental in persuading (some) of them that there is a problem and we need to do something about it.
Something like 40% of Americans fall under the category of evangelical Christians. If a significant proportion of those don't join the cause of global warming, then we really have no hope.
On Peak Oil, I don't think consensus has moved on this (it certainly hasn't moved my consensus!). The good news, such as it is, is that what we can do about Global Warming has the side benefit of helping us to deal with Peak Oil.
I'll stick with my view though that if Peak Oil comes soon, we'll generate a lot more CO2 trying to resolve it, be it by coal, tar sands, heavy oil or oil shale.
* one extreme of the US evangelical community, those who believe the Second Coming is almost upon us-- a la the bestselling Left Behind books, some of the best selling books ever written -- there is a word for it in the Christian community, damned if I can remember it.
http://www.leftbehind.com/
Or to quote US Secretary of the Interior James Watt (under President Reagan): 'what does it matter if we preserve trees? When we cut down the last tree, the Lord will come to take us back'.
Less oil => more coal and more 'alternative oil' which means more CO2.
Less gas => more CO2 on virtually any scenario.
Jeremy Legget's Half Gone is about the only book I know which treats with both. He has the right background (Phd Geologist, used to work for Shell) to appreciate the arguments on both sides.
The good news (if there is any) is that the solutions to one can help with the problems of the other. A Plug In Hybrid diesel Electric that gets 100mpg is a good thing, whether we are worrying about Peak Oil or Global Warming.
Anyway, what I wanted to do was highlight someone else to intelligently addresses climate change and peak oil simultaneously. Jonathon Porritt, here's my report on his lecture earlier this year:
Jonathon Porritt: Peak Oil and Climate Change
Unfortunately, coal production will probably increase.
So why don't the people/organizations that are worried about climate change work together to prevent coal from being burned?
For instance, every one could buy some stock of coal companies, and then impose a constant/declining production. (I believe the companies would even make more profits in the long term...)
Is it possible? Am I being naive?
Alternatives would be to buy coal mines. Or pay coal workers for them not to work. Or destroy coal mining facilities.
Isn't human specie's future at stake here?
What do you think? How could we do that?
As james Leggett (Solar Century CEO) put it 'on global warming, you meet reasonable people in the oil and gas industry who will consider your arguments. You do not meet reasonable people in the coal industry'.
A better tack is to get at the power utilities and the power utility regulators, and make them use 'best practice' CO2 technologies.
What we need to do now is get as many IGCCs built as possible. Because the jump from IGCC to carbon sequestration is a very small one, and relatively cheap.
The other is to make sure as much wind and nuclear capacity gets built as possible, and energy saving technologies are deployed fully.
Second I think a freer market could solve many warming concerns. First I would suggest that all alternative energy companies become free of corporate taxes and capital gains taxes. This increases the risk reward scenarios and allows induces more capital to flow to innovating new technologies. And by freeing the flow of capital there will be a greater diversity of innovative undertakings than if some policy wonk decides where the tax money goes. I don't know what the best solution is, and no one person does. The greater the diversity of innovations the better.
Finally I would end any protective tariffs on anything that emits CO2 or things that compete with CO2 emitters. Whether or not the science has been proven about CO2, there are enough people who want to act just in case and that creates a huge market for hybrid cars and alternative energy systems, etc.
A lot of that subsidy will be wasted, either encouraging the wrong technologies, or in subsidising activity that would already have taken place.
(the exception being where you are trying to establish a market, get economies of scale and technology spillovers happening. This more or less happened in Silicon Valley during the first 20 years (the US defence department funded a lot of it) and the aerospace industry (WWII and then Korea funded the creation of the airliners).
You exemplify the problem I am concerned with most. Some policy wonk thinks that he knows what is right and what is the wrong technology. Such tax systems create a dictatorship of the policy wonks. Buying a hybrid car or choosing to ride a bicycle is the market pricing CO2. Some wonk setting up an arbitrary value for CO2 is command and control, not free markets.
A market system creates a greater diversity of possibilities. The elimination of capital gains taxes is not a subsidy because nothing is being given to them. They are just not being taxed for success, because they risk everything if their innovations fail. And failures will happen.
But where I see failure as the unavoidable building block of success, you call it waste.
You assume there would be no waste if taxes are spent by some wonk. But percent of failures will be high no matter who innovates them. What your solution does is curtails broad innovation.
You suffer from an error in logic that evolutionary biology would contradict. You think failed innovations mean waste, therefore some self righteous wonk should decide.
By analogy, I walk into the forest of the Sierra Nevada in the spring as the snows melt. The ground is littered with thousands of fir and pine seedlings. It is hard not to step on many. By the end of summer probably less than 1% still survive and a year later less than that. What a terrible waste eh? Perhaps we need to regulate that waste and make sure no seeds with the "wrong genetics" are produced?
The problem in life is that you can not determine "wrong solutions" before hand. "Wrong" is determined afterwards. So all natural life has evolved a premium on generating diversity. Through creating genetic permutations during meiosis and with sex, life produces a multitude of possible "right" solutions, brings them to life and then nature decides which is best. It is nature's wisdom and we could all benefit from it. And it leads me to support anything that supports entrepreneurial innovations and democracy.
I said the problem with subsidy is waste, but that subsidy can be justified where you are creating 'new' industries where there are substantial, non appropriable, spillover benefits
(the internet comes to mind)
and that taxation of carbon emission would be better.
You then argued as if I had said the opposite.
- it causes a less efficient solution to be chosen over a more efficient one (and could easily suppress technological change by doing so: I think the current subsidies to the fossil fuel industry fall into this category)
- it causes someone to do something they would have done anyways-- you've handed them a free lunch
It is justified if:- the 'spillover benefits' of the new technology or industry created are such that the investment would not have been made by a single private entity, because it could not fully appropriate the benefits (the appropriability problem)
- there are very significant costs of coordination (effectively, the cost to market participants of acquiring information) which leave the market in a sub-optimal equilibrium
(examples of this include the absence of clean water in 19th century cities-- no private company could grab all the benefits from reducing cholera. So eventually governments had to step in and create that benefit)In the case of an externality (the emission of a pollutant 'for free' ie no sanction on the polluter) penalising that activity (in this case CO2) is a better solution than subsidising lower emitting alternatives.
This is what the US government (and Ontario) does with SO2. The EPA auctions the rights to emit SO2. The result was power companies found it optimal to do a lot to reduce SO2 emissions, and emissions have fallen faster (and more cheaply) than was originally envisaged.
This gives a lot of hope for a similar process when we tackle CO2 emission-- ie better results and cheaper than we forecast.
Where government subsidy can come in is in backing the R&D which leads to more efficient products, lower emission processes, and in creating 'baby' new energy industries.
I would argue Carbon Capture is a classic case of the latter. We need a crash programme to build and test power plants incorporating CCS.
Another good example would be the Price Anderson Act, which allows the nuclear industry to exist by providing insurance that markets cannot produce.
- set a limit on CO2 emissions, a quantitative limit, and let the market bid for it, a price will result. Who owns the permits in the first place is important (eg grandfathered to existing polluters, or held by the government)
- tax CO2 emissions until your emission level gets down to the required level
Either will work, they have different welfare effects, depending in part how you recycle the revenue.The level of CO2 the atmosphere can take is a decision taken outside of economics, on the basis of the best science available.
Smekhovo...I'm not as excited about your anti-business posts.
If the peak oil crowd is just a front for anti-capitalistic paranoia, Then I'm not going to be able to take it very seriously.