| Tech Talk: Driving a tunnel and holding the walls with bolts | The Oil Drum | Drumbeat: September 13, 2010 |
| Rewarding results: how should we support the development of renewables? | The Oil Drum: Europe | Trends in World Oil Supply/Consumption and Net Exports/Imports |
Global Oil Supplies as Reported by EIA's International Petroleum Monthly for September 2010
Posted by Rune Likvern on September 12, 2010 - 10:58am in The Oil Drum: Europe
My post is mainly an update to OPEC's Spare Crude Oil Capacity - Will it Disappear by the End of 2011?, based on data which the EIA reported in the past few days. I will also briefly present updates to recent developments in OECD and Non OECD oil supplies/consumption.
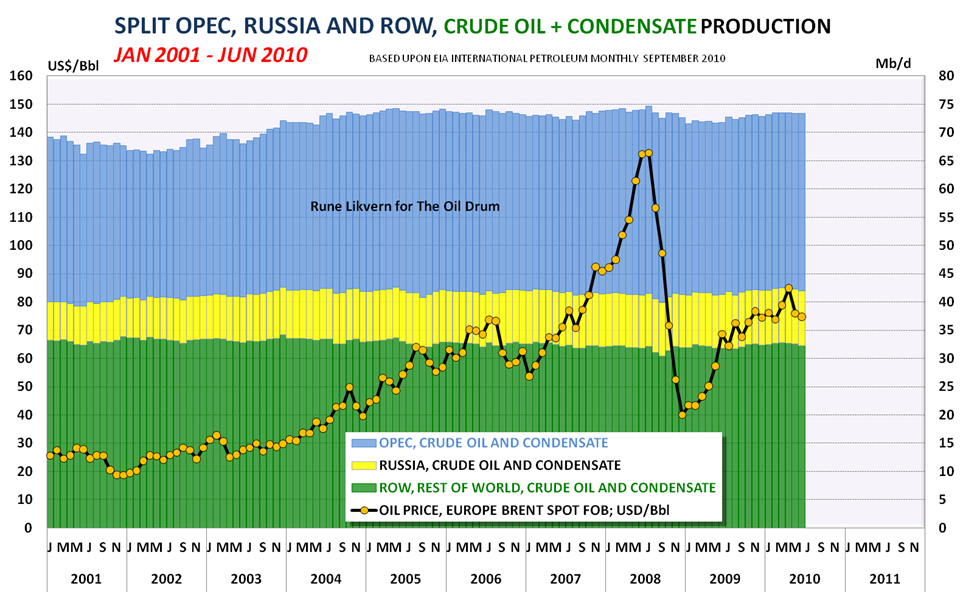
The stacked columns shows crude oil and condensates supplies split on OPEC, Russia and ROW (Rest Of World) which also includes OECD, from January 2001 through June 2010. The development in the average monthly oil price is plotted on the left hand y-axis.
Note that world oil production has been on a plateau, from late 2004 to the present, with a small dip when prices dropped in late late 2008 to early 2009. This graph considers crude and condensate only, excluding natural gas liquids and other forms of liquid energy, such as biofuels.
DISCLAIMER: The author holds no positions in the oil/energy market that may be affected by the content of this post.
NOTE: Scaling varies from chart to chart and some charts are not zero scaled. Labels indicate whether graphs are on an "all liquids" or "crude and condensate" basis.
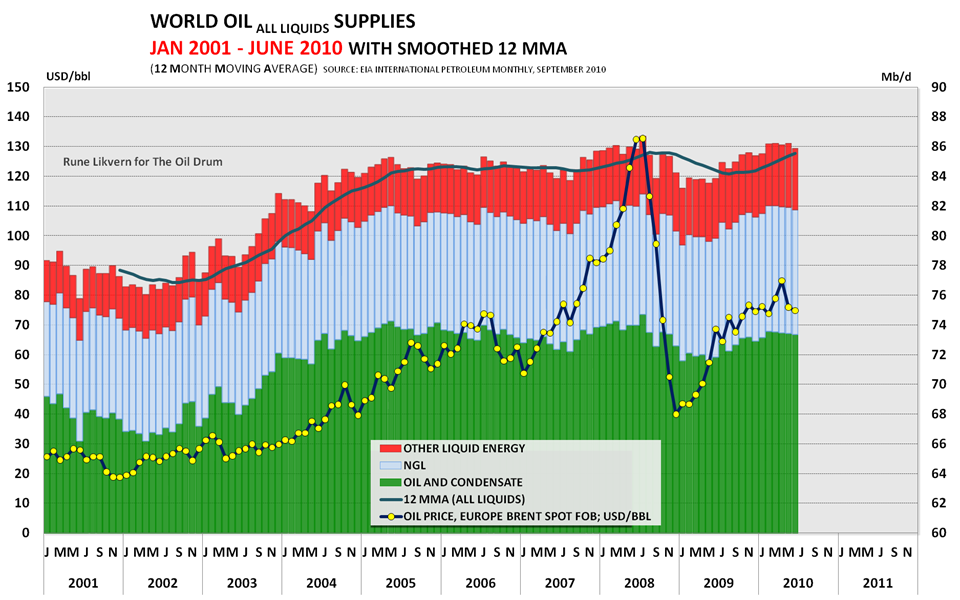
Figure 01: The stacked columns in the diagram above show development in global supplies of crude oil and condensates, NGLs and other liquid energy from January 2001 though June 2010. The development in the average monthly oil price is plotted on the left hand y-axis. NOTE: Diagrams based upon EIA data may be subject to future revisions.
Figure 02: The stacked columns shows crude oil and condensates supplies split between OPEC, Russia and ROW (Rest Of World; which also includes OECD), from January 2001 and as of June 2010. The development in the average monthly oil price is plotted on the left hand y-axis.
Over the period covered by the graph (2001 to present), growth in Non OPEC supplies have primarily come from Russia. Oil supplies from the "Rest of World" (ROW) have not grown.
The long bumpy plateau from 2004 to the present illustrates that huge swings in oil prices in recent years have had only small effects on crude oil and condensate supplies.
EIA in their STEO (Short Term Energy Outlook) for September 2010 projected a slight decline in OECD and Russian petroleum supplies from 2010 to 2011. Under most circumstances, it could be expected that most of these declines would be offset by growth in OPEC supplies.
It is expectations like these that will make 2011 an interesting year to follow developments in global oil supplies. If the wheels on the global economy remain on, global oil supply may be stretched, as I pointed out in my earlier post.
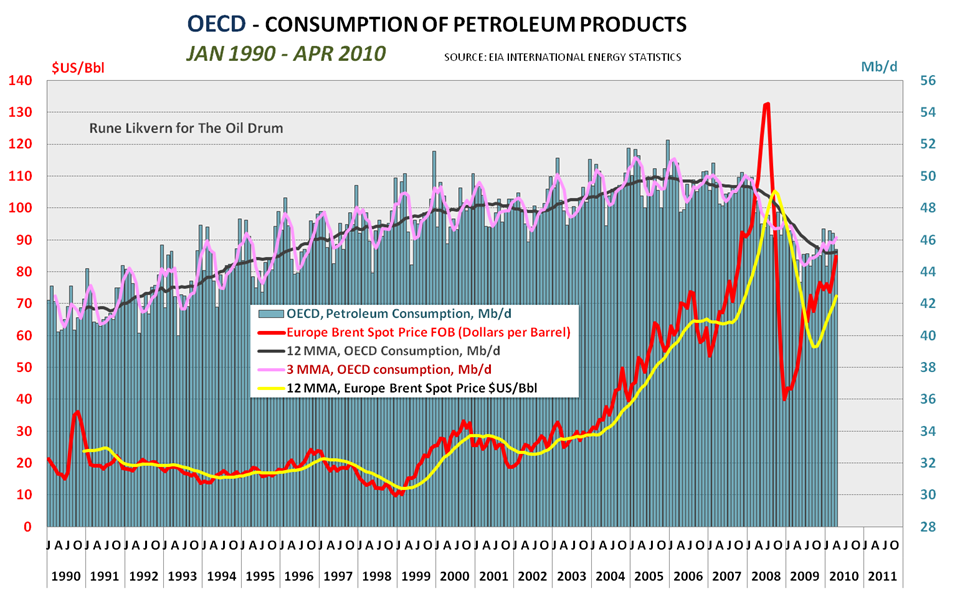
Figure 03: The diagram above shows development in OECD consumption of petroleum products between January 1990 and April 2010 together with the development in the oil price.
In the recent months, petroleum consumption within OECD has seen some growth and this coincides with the recent growth in the oil price.
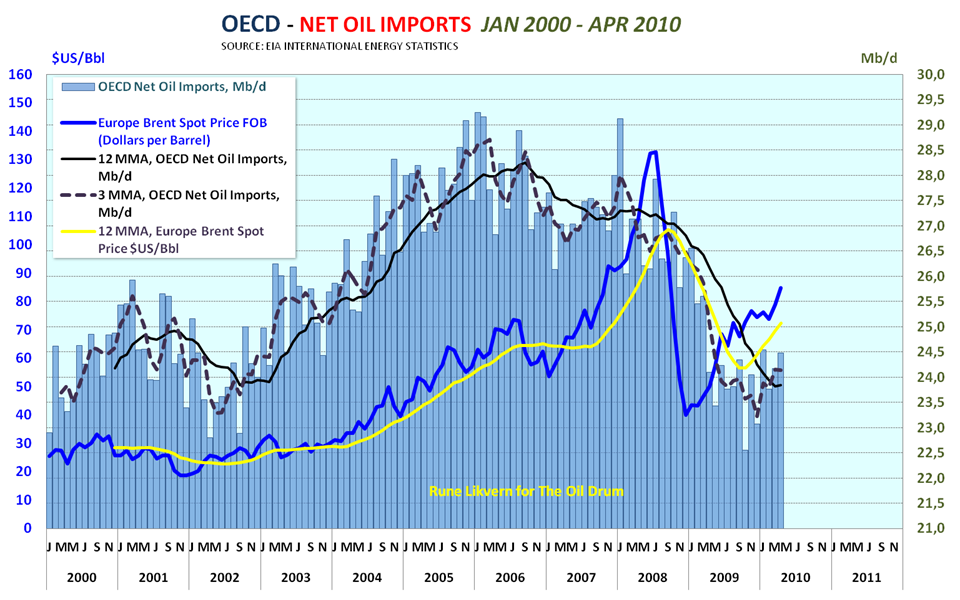
Figure 04: The diagram shows development in net oil imports for OECD from January 2000 through April 2010.
This diagram shows that the recent oil price growth happened as OECD again started increasing oil imports. This is one of the indicators suggesting that the oil price now has strong support based on fundamentals.
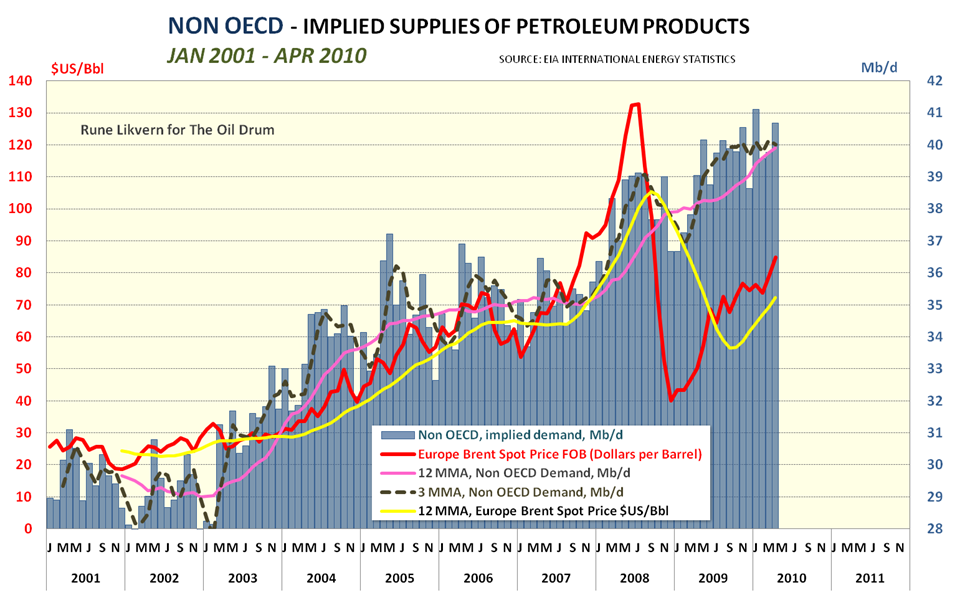
Figure 05: The above diagram shows implied demand for liquid energy from Non OECD countries from January 2001 through April 2010. (I describe it as implied demand as the diagram shows the difference between total global supplies of liquid energy and OECD supplies (production + net imports)).
Recently, demand for petroleum products from Non OECD seems to have leveled out as illustrated by the 3 MMA (3 Month Moving Average). (I use the 3MMA both to more easily identify seasonal variations and also to act as a “pilot” for trends over several months.)
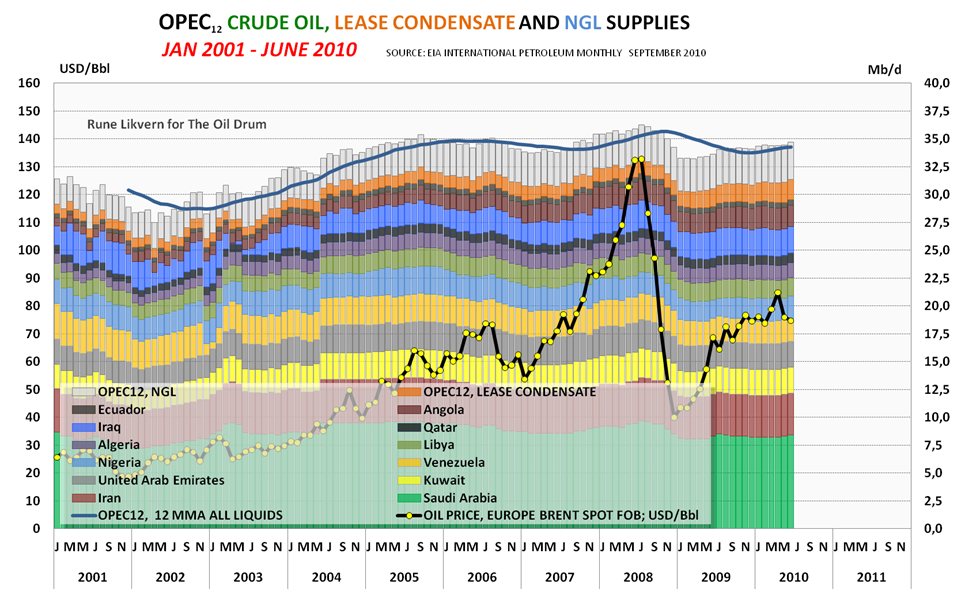
Figure 06: The stacked columns show each OPEC member’s crude oil supplies and OPEC’s supplies of lease condensates and NGLs from January 2001 through June 2010. The average monthly oil price is also plotted on the left hand y-axis.
The recent data from EIA shows a small growth in supplies of crude oil, condensates and NGLs from OPEC. (Lease condensates and NGLs are presently not part of OPEC's quota arrangements.)
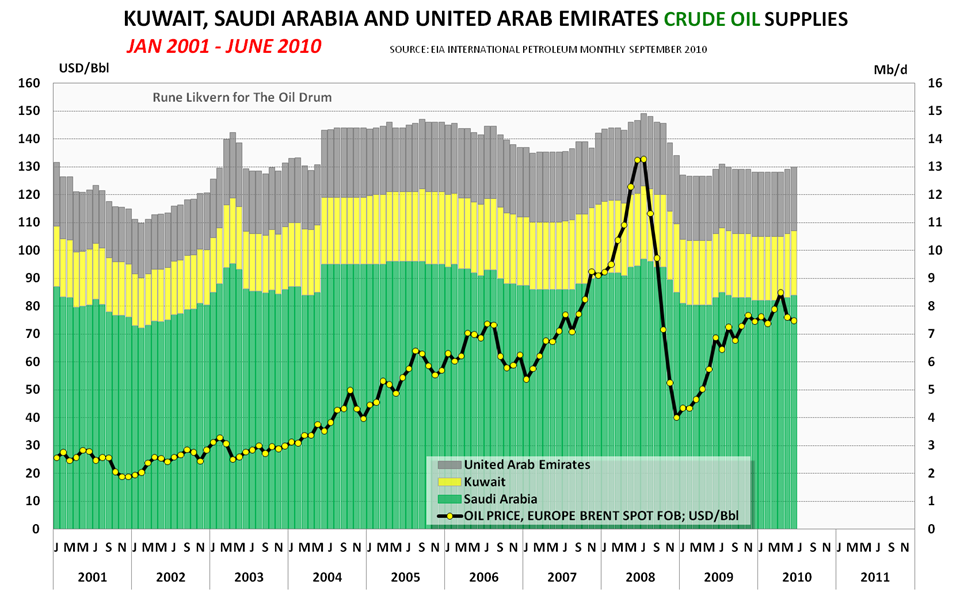
Figure 07: The diagram above shows crude oil supplies from January 2001 through June 2010 (data may be subject to future revisions) for Kuwait, Saudi Arabia and United Arab Emirates.
I believe most of present global spare marketable crude oil capacity is to be found amongst the 3 exporters presented above. Saudi Arabia increased their crude oil supplies by 200 kb/d between April and June of this year. It is not clear whether one can conclude that this caused some retreat in the oil price, but it is an interesting coincidence.
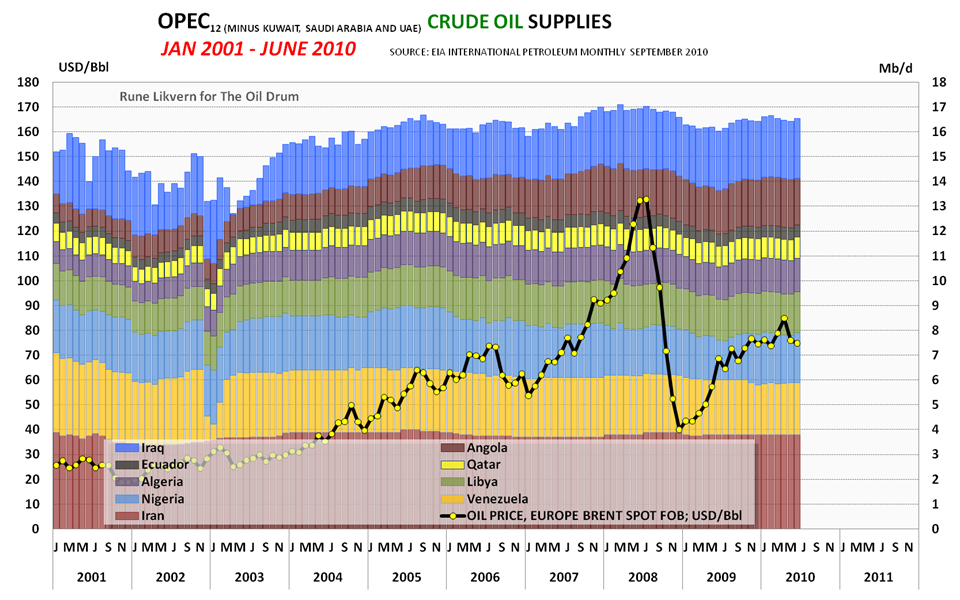
Figure 08: The stacked columns shows developments in crude oil supplies from the 9 other OPEC members. The average monthly oil price is plotted on the left hand y-axis.
Total crude oil supply from the 9 OPEC members above have remained relatively high and flat during the recent months, suggesting that these countries are pumping at maximum levels, regardless of price.
In summary, September's International Petroleum Monthly confirms a continuation of the trends I had noted in my earlier post. The next 15 months may be interesting ones!
SOURCES:
[1] EIA, INTERNATIONAL PETROLEUM MONTHLY, SEPTEMBER 2010
[2] EIA, INTERNATIONAL ENERGY STATISTICS
[3] EIA, SHORT TERM ENERGY OUTLOOK, SEPTEMBER 2010
Global Oil Supplies as Reported by EIA's International Petroleum Monthly for September 2010
PDF version
94 comments
Global Oil Supplies as Reported by EIA's International Petroleum Monthly for September 2010
PDF version
94 comments
Personnel
Editors
Contributors
Peak Oil Primers
Archives
- November 2010 (3)
- October 2010 (6)
- September 2010 (4)
- August 2010 (7)
- July 2010 (6)
- June 2010 (7)
- May 2010 (2)
- April 2010 (8)
- March 2010 (4)
- February 2010 (6)
- January 2010 (3)
- December 2009 (5)
- November 2009 (8)
- October 2009 (12)
- September 2009 (6)
- August 2009 (5)
- July 2009 (11)
- June 2009 (8)
- May 2009 (16)
- April 2009 (10)
- March 2009 (7)
- February 2009 (10)
- January 2009 (15)
- December 2008 (9)
- November 2008 (9)
- October 2008 (9)
- September 2008 (13)
- August 2008 (10)
- July 2008 (14)
- June 2008 (23)
- May 2008 (16)
- April 2008 (12)
- March 2008 (16)
- February 2008 (9)
- January 2008 (13)
- December 2007 (13)
- November 2007 (16)
- October 2007 (22)
- September 2007 (8)
- August 2007 (9)
- July 2007 (16)
- June 2007 (8)
- May 2007 (7)
- April 2007 (7)
- March 2007 (10)
- February 2007 (10)
- January 2007 (12)
- December 2006 (9)
- November 2006 (15)
- October 2006 (4)
- September 2006 (5)
- August 2006 (5)
- July 2006 (9)
- June 2006 (5)
- May 2006 (10)
- April 2006 (9)
- March 2006 (13)
Vital Trivia
License

This work is licensed under a Creative Commons Attribution-Share Alike 3.0 United States License.
Hi Rune, thanks for these fantastic charts. My two main observations / comments:
1) figure 1 shows how close we are to new total liquids peak (I should have accepted Nate's wager)
2) with price not impacting supply that much, must we conclude that price fluctuations are controlled by demand (modified by Saudi adjustments to their production).
This is the trap the Keynesian's just don't see. Even if they manage to steer a course through the debt minefield using QE and other leavers and manage to achieve some meaningful growth, then this will send oil price back up that will kill off any revival.
CW
China's vehicle fleet likely will exceed Japan's in size this year, at ca. 76 million. Sales remain robust even in the face of 9 day long traffic jams. BYD attempted to market a PHEV, with sales in the hundreds. First time motorists in developing nations want cheap vehicles.
The bulk of the articles I come across on China's cars talk about the mounds of money to be made there, with little attention paid to the obvious call on resources this will entail. Even with efficiencies exceeding those of Europe or Japan these vehicles will quickly demand a brand new share of available petroleum in the handful of mb/d, irrespective of what happens in the OECD, or so it seems to me. Things would have to go pretty sideways to be otherwise, judging by their performance through this recession.
Euan,
I believe we are now caught in the “oil price trap”. Oil prices are too high to help many western economies grow and too low to allow for meaningful exploration and developments to counter declines and grow future supplies.
Figure 02 should raise some questions about the relations between prices and supplies.
Rune - I don’t know that I would agree about oil prices being too low for a strong exploration effort. I was just joking with one of my engineers last week about the news that oil had “Dropped low to $70/bbl“. “Low” is a silly qualifier IMHO. NG is a different animal. In fact, our more attractive NG prospects are greatly aided by the price we get for the condensate yield. I can’t offer a statistical model to back up this impression but IMHO if oil prices rose significantly from where they are now we wouldn’t see a proportional increase in production compared to the price rise. I can offer the anecdotal evidence of the late 70’s oil boom. Rig count peaked out at 4,600 thanks to the oil price spike. And I promise you half those rigs were drilling wells that had little chance of success. A more recent example of this disconnect would be the boom in shale gas drilling in the US when prices went over $13/mcf. And the NG prices collapsed and the SG plays crumbled for the most part.
Very high oil/NG prices greatly encourage drilling efforts that ultimately don’t produce profits proportional to the increase in activity IMHO.
Hello ROCKMAN,
My assertion about the oil price is more related to what I expect of near term economic developments and observations on how global oil supplies so far have responded to the growth in prices.
Some CEO’s (if not all) for International Oil Companies frequently refer to that a considerable part of the global economy in recent years has been on “steroids” that is debt/credit fuelled the growth. This also allowed consumers to pay for growing oil prices….for some time.
What I fear is that we will see another economic backlash that could send oil prices down, say to the $50/Bbl range. Few if any oil companies makes decisions on how the oil price is traded now or on how it is priced in the futures market.
What price they use for investment decisions (either exploration and/or development varies between companies) is somewhat lower than what the oil presently is trading at and often the oil price used by IEO’s economic decisions are made once or twice a year based upon internal assessments.
Oil sands developments is now found economic viable at an oil price of $60 - 90/Bbl, to mention one source for growth in supplies.
If you look at Figure 02 you see global oil supplies barely responded to the recent year’s price growth. This suggests to me that it would take a higher price to bring in more supplies and more oil consumption normally is associated with economic growth……..however there is a flip side here…..a too high oil price reduces discretionary spending and fuels recessions.
I have no doubt that there are several oil prospects worldwide that now gives good economy for the owners at an oil price of $70/Bbl….question is; will all those trickles result in a noticeable growth in global oil supplies?
Have we reached the point where new supplies from sources such as oil sands are significantly offsetting conventional crude? Has conventional crude started its slide yet?
If so, a new peak in production, even at a "sustained" price of $70/bbl, will not represent a net energy peak anytime soon, given the higher energy of extraction.
Perhaps the more significant point in such a case is that $70 appears to be enough to stimulate new production, albeit at lower total consumption, and so also appears to represent the cost level the world can really support at this consumption level.
If $70 were enough to spur a lot of new production, we'd be seeing higher production and lower prices. If it were low enough to spur growth, we'd see increased consumption and rising prices. $70 seems to be "muddle along" price for the economy.
Surging supplies from the oil sands are largely a myth. Their quantity is so low that about all they do is offset the decline in conventional oil production in Canada. Canada's own oil consumption is growing, so this means that Canada must import more and more oil in order to have a constant supply of oil from the oil sands to export to the US. Maybe if oil sands production increases, it will offset the increase in Canadian consumption. But it will not be enough to "write home about".
We need to remember too, that Canada needs to continue importing oil, for this arrangement to work.
Actually, that's not true. I checked the Canadian Association of Petroleum Association's Statistical Handbook for 2010, and this is what I found (numbers converted to millions of barrels per day because the Canadian industry operates in cubic metres):
Note that what is happening is that conventional crude production has been nearly flat for 20 years, while oil sands production has been doubling every decade and now exceeds conventional crude. The net result is a significant and accelerating growth in total oil production.
Net Canadian consumption of petroleum has been nearly flat for 20 years. Canadian fuel taxes are much higher than American ones and this discourages consumption (public transit ridership rates are three times as high).
In calculating Canadian consumption, you have to keep in mind that Canada both imports and exports crude oil and products. Refineries in Atlantic Canada import a lot of oil, but they export 2/3 of their production to the US - they are really just refining Arab oil for US consumption. Oil imported for product exports really shouldn't be counted as Canadian consumption because it gives a completely misleading picture of what is going on. This is a common mistake.
What is happening here is that crude oil imports have been nearly flat for 20 years, while exports have tripled in the same 20 years. Essentially what is happening is that, as the oil sands come on production, virtually the entire increase has gone to export.
If you look at US EIA numbers, you will see that the US is importing about 2.7 Mpd of oil and products from Canada these days (it is an "all liquids" number which isn't really compatible with Canadian data). There are some big oil sands projects coming on stream in the near future, so that volume should exceed 3.0 Mbpd in the next year.
The Canadian Association of Petroleum Producers forecasts that Canadian oil production will reach about 4.5 million barrels per day by 2025, which will probably be more than US production by then. Most likely the additional 2.0 million bpd will go to export, just like the previous 1.0 Mbpd, but not necessarily to the US. China is moving to buy up a lot of it.
Thanks for the clarifications. A huge amount of lead time between the initial tar sands pilot projects and the large scale development coming on line now. It should be interesting to see if there were any bites at all on the north slope natural gas open season. About the only big customers I've heard rumored might be out there right now are the tar sands oil producers but it would seem those producers could get all the gas they needs from the McKenzie River fields with no need for a big line from the slope.
On a distantly related note, it always blows me away when people talk of peak oil, peak gas and the energy gap they will create while in the same breath declaring a quickly following peak coal, while using assumptions of that don't include peak oil, peak gas and an energy gap. If oil prices can justify such comparatively low ERoEI projects as the Canadian tar sands (say relative to twentieth century Los Angeles basin projects) you would think future fuel prices might just make huge scale development the massive, virtually unmapped northern coal fields profitable. But all those who predict peak coal by 2025 or even a few decades thereafter discount at least all of Alaska's coal as being of too low a quality and too inaccessible to ever be part of the fuel mix.
I don't know--
China and India are very fuel hungry. Alaska's largest coal reserves (actually rated as a hypothetical resource these days as only the most cursory mapping has been done) are only a couple hundred miles from the Chukchi Sea and arctic freeze up (minimum ice extent) has been averaging three days later every year for decades. Does northwest Alaska really sound that inaccessible when those factors are considered? I'm hoping cheaper cleaner 'fuel' and reduced consumption (through efficiency) will fill the gap but that certainly does not seem the path we are on at the moment.
The first pilot projects in the Athabasca Oil Sands were in the 1920's and 1930's. The first full scale commercial operation came on stream in 1967, so it has been a very, very long time to ramp up production to current levels.
Oil sands producers are unlikely to show much interest in Alaska natural gas in the near future since there are large shale gas deposits being developed much closer in Northeast British Columbia.
I'm not a big believer in peak coal either. There are vast coal reserves that nobody is showing any interest in solely because it is too expensive to ship it to the nearest port. There are vast, stranded coal resources not only in Alaska but in Canada and Siberia as well. The problem with coal is not lack of supply, but lack of demand.
Hadn't heard about the BC shale gas plays. Not surprising our local media wouldn't mention them.
Yes there is a lot of coal all over the north and arctic shipping seasons could well be getting longer. If only the lack of demand was the only problem with coal--not in any big hurry to see it all burned myself. Lots of better uses could be found for FF derivatives in the millenium down the road I'd bet.
Interesting,
Should the USA set up long-term contracts with Canada, to better control the half life of their Oil supply (ie move to shut China out ) ?
China seem to be throwing large sums into Mongolia, for more local energy, and
better security of supply.
I don't think the US government is really aware of what is going on. US politicians tend to be totally focused on domestic politics, and almost completely unaware of what is going on in the rest of the world.
The US government blocked the Chinese from buying control of domestic US oil companies, but it doesn't seem to occur to them that the international market is of great importance because the US now imports about 2/3 of its oil. Chinese companies are very subtle and not that easy to shut out of a market because they can bring a lot of cash to the table. They also do much longer range planning than US companies.
Rune -- I can see how a lack of surge in oil supplies after the price surge could lead one to see a potential for higher prices to increase supplies. But again I can only add anecdotal evidence. In the last 12 months I've spent almost $100 million drilling wells in the Gulf Coast Basin. And I would have spent every penny on oil prospects. But 90%+ of the capital was for NG prospects. Fortunately some had high condensate yields so higher oil prices benefited those efforts. I've reviewed a small number of pure oil prospects during this period and rejected the vast majority. And if oil had been selling for $140/bbl instead of $70 I would have still rejected them. If a oil prospect makes sense it will be more than viable at $70/bbl. But I'm talking exploration. Higher oil prices would be a benefit to enhanced oil recovery projects. But the gains from those projects would be relatively small compared to global demand. More profitable...yes. A surge in supplies...no IMHO.
Of course, I'm dealing with the US Gulf Coast Basin and that isn't to representative of frontier areas around the globe. I'll defer to the international explorationists on that matter. But I still have a gut feeling that an increase in oil prices will lead to an increase in drilling but a disproportionately small gain in production even internationally. For 35 years I watched one company after another drill poor prospects because they used high oil price expectations to bolster their confidence. I know it's simplistic but none the less true: dry holes don't produced a profit regardless of how high the price of oil goes. IMHO if oil were to jump to $140/bbl for an extended period you would eventually see something of a surge in drilling. And also a larger surge in dry holes.
ROCKMAN,
I appreciate your comments, because they help demonstrate the point I am trying to make.
The diagram above shows developments in world crude oil and condensates supplies as from January 2001 and as of June 2010. The oil price is plotted towards the left y-axis.
In the diagram and by using 2004 as a base, is also shown a blue fan illustrating how oil consumption (C+C) would have grown at respectively 1,0 %/year and 1,5 %/year.
EIA in their IEO (International Energy Outlook) for 2004 used a growth rate of 1,9 %/year towards 2025 in their Reference Case.
Let us here just imagine that BAU continued as expected some few years back.
Demand/consumption of oil (C+C) would in such a world have been in the area of 77 - 79 Mb/d now, as illustrated in the above diagram. So far in 2010 global oil (C+C) has been around 73,5 Mb/d and assuming OPEC now has around 2 Mb/d of spare marketable crude oil supplies that was brought in, there would now still have been left a gap of somewhere between 2 - 4 Mb/d of (C+C) supplies.
Question then becomes; what oil price would have been required to fill the gap (2 - 4 Mb/d) illustrated here?
(And ROCKMAN….we could also come to see “Peak Dry Holes” in such a scenario ;-))
And population has grown. Given price is set on the marginal barrel your little wedge also illustrates increasing inelastically in demand. As we did not move up that wedge at any price then current demand must be less flexible than if price had drive new production.
Eventually of course as long as population is growing this means higher prices are required not to spur increased production as we already are well below any level that would be considered optimal. Simply put we will never have enough oil at any price to grow like we used to.
Thus form here on out and indeed for some time higher prices will be needed to impact the demand side of the equation yet this of course selects for inelastically in remaining demand leading to higher prices.
Although I dismiss alternatives even if you include them it seems reasonable that they would have to follow price and be readily profitable in and open market before they are widely adopted. No government program on the planet is going to drive support for alternative energy if the free market is not behind it via the price mechanism.
Eventually of course perhaps alternatives will actually remove some of the inelastic demand for oil production via substitution but the irony is they can only do so for a price if they expanded to rapidly then oil prices would fall and since in general alternatives are inferior substitutes demand for oil would grow again. However such a cycle would have a huge impact on investment in alternatives.
This of course makes the claims I've seen that 70 is some sort of stable price point highly questionable. I don't see any chance for stability in oil prices for the foreseeable future until real alternatives are removing inelastic demand via substitution at a scale sufficient to level prices. Only then can one consider the market stable. There are a host of reasons for the current price of oil however stability ain't one of them.
Your wedge diagram is sufficient in my opinion to blow the stability argument out you don't need any more.
Whats interesting is to consider that current prices are not representative of a stable market therefore what are they ? Why 70 ? Ask those questions given the assumption its not a stable price give interesting answers.
Thanks Rune!
All of these charts are quite helpful.
I think Figure 4, Net oil imports of OECD countries, is especially one to be concerned about. It looks like net oil imports of OECD countries peaked back at the end of 2005. Since then, there has been some bounce up and down, but the general trend has been down, as the rest of the world demands more oil, and total world production remains flat.
Recently, Figure 4 shows that OECD has tried to increase its imports, and Rune notes that there seems to be some price rise occurring as this action takes place.
I wonder what happens in more recent months, months for which data is not yet available. I am wondering if we may not be headed back to more recession. Perhaps even the slightly higher prices were enough to push some of the already weak OECD economies in toward recession. Also, some recessionary issues have been hidden by high government spending and low taxes. As tax rates rise, there may be more of a downward push on OECD demand, even as the rest of the world's demand continues to grow.
This will be an interesting chart to watch in months ahead!
Hello Gail and thanks!
I agree figure 04 in this presentation will be interesting to follow how it develops. In EIA’s STEO for September 2010 EIA forecasted OECD oil supplies to decline around 0,5 Mb/d from 2010 to 2011.
Oil supplies within OECD responded somewhat to the growth in prices earlier this decade, but now it seems like these effects are waning.
I presently expect OECD supplies to decline with around 1 Mb/d from 2010 to 2011.
Will OECD demand/consumption decline with its supplies or will demand/consumption level off and thus result in growing net imports into OECD in the months ahead?
It will also be interesting to follow how Non OECD demand develops.
As of now it is hard to predict the full effects from the stimulus packages within OECD (and within other economies) and how long their effects last.
I believe oil prices in the region of $70 - 80/bbl first impacts discretionary spending and at the next turn it may affect demand.
We could experience a period where demand contracts and brings prices with it which will result in less exploration and developments of new supplies that would set up a new price rally somewhere in the future.
I don't find Figure 4 to be all that surprising. Demand seems to be wiggling around flat.
Figure 5 is far more to be concerned about. The clear trend for non-OECD economies is to use a lot more energy. If the emerging countries continue their strong growth in usage, we could easily see a situation in which the OECD economies continue their dismal performance of the last couple of year AND oil prices go through the roof.
Economic doldrums and sky high energy prices driven by growth outside the OECD is a nasty combination.
I have said this before but the interesting spike-up/spike-down in price in 2008 is likely related to the fact that price is a derivative of some other peaked or bubble measure.
price(t) = d/dt(peaked_function(t))
see the peaked blue curve below, and the derivative of that in red. The peak occurs where the derivative crosses zero.
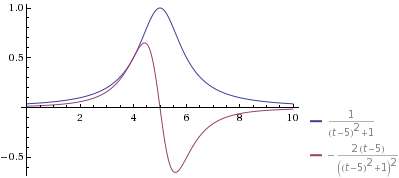
It's really apparent now that a year has gone by since it stabilized.
I would only add that derivatives are very susceptible to noise and other fluctuations so I don't know how much more quantitative meaning one can get from this observation.
"I have said this before but the interesting spike-up/spike-down in price in 2008 is likely related to the fact that price is a derivative of some other peaked or bubble measure."
Yes, the Gaussian is investor confidence that prices will continue to rise :^)
Hi WHT,
I get from your graphs that the minimum rate of change happens at the peak.
I take it that these expressions are for illustrative purposes only?
Oh yeah. I haven't even talked about this on my blog because it is a strictly hand-wavy qualitative argument.
yes, the peak has zero slope.
Silly Telescope!
The post shows a rather flat oil production curve with a rather curvy sawtooth price waveform superimposed over of it.
You take the logistic function and superimpose a curvy sawtooth waveform on top of that, noting that the sawtooth like curve is the derivative of the symmetrical logistic curve.
Meaning what exactly?
Probably that real world of oil price and production have absolutely zilch to do with the mathematical world of your curves; otherwise reasoning backwards a price sawtooth should occur when production rapidly rises and later falls--and we don't see that.
This is about as logical as Kepler deducing the orbits of the planets from consecutively inserting the 5 platonic solids inside
a sphere.
http://en.wikipedia.org/wiki/Mysterium_Cosmographicum
And WHT, you're no Johannes Kepler.
Yes indeed, you caught me. I decided not to post something like that on my blog because it was just idle speculation on my part and I reserve the blog to keep track of solid findings. Yet make a comment on TOD to provoke discussion and you predictably get Major Ian frantically decrying out-of-the-box thinking.
But one thing to remember is that measures like price that are dependent on other variables via derivatives are very sensitive to any kind of perturbations. In yesterday's DrumBeat, KLR posted this graph of daily price differential:
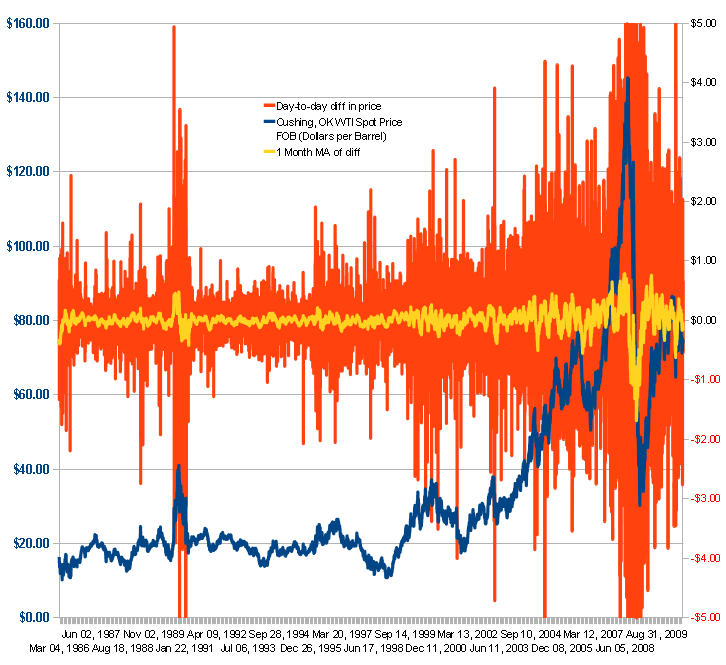
See those fluctuations? Derivatives always accentuate noise in any data they encounter. Anything can spook the price at any time scale.
BTW, that curve I plotted was not a Logistic curve. I am reminded that you don't know what an inflection point is either.
Maybe this means he realizes it's not predictive, just a simple observation? Anybody who's followed WHTs work knows he looks for base principles and then grows the math to explain observed behavior. In some cases, he's ended up recreating other lines of research, and in others it's a work in progress, but in both cases it's interesting to see how the theory evolves to explain real-world observations. Somewhere in that process you have to look at the kind of behavior you see an figure out what toys in your toolbox might apply.
And at least WHT mostly does what he does without being unpleasant and pointlessly insulting.
And at least WHT mostly does what he does without being unpleasant and pointlessly insulting.
Not true at all. He pretends geologists don't do math, and calls them names for it, and when its pointed out that they do he calls them names for not doing anything probabilistically, and when its pointed out that they do, he changes the topic and says, "Yeah, but they are still stupid, look at how dumb these hydrogeologists are!"
Which means its perfectly acceptable for those of us he is insulting to comment that signal processing solutions can't predict peak, don't know anything about reserve growth and while curve fitting any data with an nth degree polynomial is amusing, it just doesn't usually mean bubbcuss.
It's true that I get upset about all these scientists using way too complex math or conversely using idiotic heuristics. I get mad at them because I know I would really get mad at myself if I came to realize that all I am doing is wasting my time.
For the love of the baby jeebus, does know one else see how obvious some of this stuff is?
Peak coal in 2011? (http://news.nationalgeographic.com/news/2010/09/100908-energy-peak-coal/). I think he is talking about peak BTUs from coal; not peak coal production.
With peak BTUs from coal and China now being a net importer of coal, will KOL (http://finance.yahoo.com/q?s=kol), JRCC (http://finance.yahoo.com/q?s=jrcc) and MEE (http://finance.yahoo.com/q?s=mee) become the next "internet stocks"?
I can imagine that problems indirectly resulting from oil shortages may affect coal extraction - initially high coal prices, but then lower prices, as credit problems set in and as oil production declines.
I am not persuaded by the type of curve-fitting analysis that was done for coal. It seems to me the approach is iffy to begin with, and especially so if applied to coal, which is extracted as needed over many years. But it may be that the forecast turns out to be right, for the wrong reasons.
Peak coal is largely illusory.
Right now, there is a strong aversion to coal, so in many countries, peaks are behind them.
In the UK, Coal peaked nearly 100 YEARS ago, helped by ample cheap alternatives.
However, if the tail of Oil shows signs of too steep a decline, (too short a half-life) then watch for some serious upticks in Coal, and any forecasts, and certainly 'pick-the-peak' can be thrown away.
I am not sure I understand you. Are you saying that peak coal is behind us and it is largely driven by demand and not supply?
Peak coal is a long way behind, for the UK.
Because there is such a strong aversion in many countries to coal, of course production tapers.
China has a very strong appetite for coal, and now uses more than 50% of the total global supply. China's peak is still ahead of us.
I also do not quite understand the point you are trying to make, but I think that the 'strong aversion' is purely a cost issue. In other words, coal production/consumption tapers because it is too expensive. In addition to the cost of mining the coal there is the cost of all the flue gas treatment at the power stations, or alternatively the cost of the dead forests and acidified lakes with no fish.
No, quite the opposite.
Coal is cheap, which is why China loves it. They care less than most, about 'collateral damage'.
The aversion occurs because much of the OECD considers Coal a source of last resort, due to emissions concerns, which is why Coal is the first-retired fuel, as renewables ramp. (At least for domestic consumption; in a quirk of politics and human nature, many countries seem happy to export Coal, for someone else to burn ?)
China is buying huge tonnages of Coal from Mongolia, "Mongolia's share jumping from 11 per cent to 39 per cent", and from Australia too :
"Australia's coal exports to China grew by 1000 per cent last year to become our second largest export commodity, behind iron ore. Over the last 12 months, two further LNG contracts have been signed for the supply of Australian gas to Chinese terminals."
So, there is little sign of Peak Coal for China being anywhere close.
But if demand for coal grows faster than supply growth, eventually we end up with "peak-coal-lite" when demand catches up with supply and there is no spare capacity. How far away do you think such a scenario is?
If China's imports continue to grow at this rate, eventually they will consume close to 100% of coal exports. How far are we from such a scenario?
Coal is not a substitute for Oil !
For a list of Peak Coal papers, articles and video:
http://www.peakoil.org.au/peakcoal.htm
I'm not reading too much into any of the micro possible trends. What is fascinating is the plateau of crude & condensate production since May 05. (Sorry I disagree with the plateau starting in late 04 because production was still on a slight incline.) It's easy to see it hasn't budged much in all these intervening years, in spite of oil price fluctuations, a huge recession and changing consumption patterns. It's as if the world is saying, "Give us all the crude & condensate you can muster and we'll use it."
In my view we are in a pattern that can best be referred to as 'peak plateau', and until that changes, it's steady as she goes. Amongst the friends and relatives we are on close contact with, the economy seems to be rebounding for them and us. The stock market is gaining some, and as things improve there will be more pressure on oil price to rise. A rising price should dampen economic data downward, but in response to that price will drop down again.
So the only thing that will really change this situation dramatically is the beginning of the descent from peak plateau to cause a supply crunch. Which of course is probably why so many are interested in when that might occur. I have a dumb ars prediction for when that will happen based on what I call the 'Mountain Range Perspective'. Told you it was dumb. If the beginning of the C&C production plateau was in May 05 and the highest peak in the range is July 08, then it took 3 yrs 2 mo's until the highest peak, highest production point in time. And if we view most mountain ranges to have its highest peak in the middle, then the decline from peak plateau should occur approx. 3 yrs. 2 mo's after July 08, in September 2011.
I believe 2011 to become an interesting year and could well become the year we leave this (C+C) plateau.
I think your Sept 2011 WAG is pretty good. I didn't realize that imports had dropped 4mm bpd in OCD countries. That tells me that most of the slack has been removed. Now supply shortages are more likely to appear. One year from now? Sure, why not. The key is going to be production. I thought 74mm bpd was going to be the peak, but it looks likes we are going to reach 75 or 76mm. That could keep prices under $100 until sometime in 2012. But a year from now in 2011, I think supply issues will be apparent.
Newager
"What is fascinating is the plateau of crude & condensate production since May 05. "
That was the first thing that caught my eye too. Nice plateau you have there. It would be shame if something happened to it.
The economies of the US, EU, and Japan are expected to lay there twitching well into 2011, and might even keep doing nothing until 2012. So their demand should not explode upwards. Will we stay on the plateau until 2014, or will it start down sooner?
Interesting graphs, and a very valuable lesson there, for those few who think price alone, is a good control mechanism for volume.
It is not.
Note that many graphs have amplified axes, but the ones that have a common Zero, underline just how little consumption changes, even with a large spike in price.
There is a few percent of Elasticity (discretionary use), but that is the limit.
If politicians are serious about reducing Fossil Fuel usage (and they should be!), they need something MUCH smarter than reflex taxes, or paper shuffling cost imposts.
Although not all Politicians are guilty of this, the subject they are usually "serious" about, is their re-election...
That's a feature of measures that on rates of change. The large spike in price and reverse spike is just a time derivative of some other factor. I contend that the price does not control anything (production is largely steady) but varies a result of other changes. No other way to explain it as production has largely been steady. See my graph up thread.
I would suggest that Price is the mechanism for a redistribution in consumption. In other words, the swings in the price have a much stronger impact on who consumes the oil, than on how much oil is consumed in total.
Not entirely, as the resistribution trend pre-dates the price spike.
- ie it was already a trend before the spike occured.
All price has done here, is squeeze a little elasticity out of the system.
My observation is that OECD consumption has declined from about 50 mbd to about 45.5 mbd. so we could call this marginal and "unneccessary" useage
this 4-5 mbd excess is in the process of being mopped up by Chindia etc.
so question is: when the next price spike comes, can the OECD afford to lose another 4mbd? to whom will the oil be more valuable, OECD, or emerging economies? who will be willing to pay more?
my prediction is emerging economies. the marginal value is greater there.
but at some point, there is an end game for all oil importing nations. the same can be said of all food importing nations. i don't care how productive they are or how cheap their labour is
It seems like at some point, we will start seeing debt defaults among some of the importers, making the situation even more interesting. Who will want to continue to sell to them, especially if their primary source of funds is tourism that is declining is demand?
Tourism has to be one of the largest elasticity items out there.
Even business class travel, is becoming less critical, as the Internet expands.
So Business travel could easily halve, and more general tourism could drop back to numbers seen decades ago.
Conference business, which seems in many cases built on tax-structures, more than real need, is also quite exposed.
Gail
If there is OECD debt default, and you are Saudi Arabia, what do you take as payment? Dollars and Euros suddenly lose their appeal.
Maybe you still take dollars while the US is still sending soldiers.
I think the role of gold in international exchange will increase.
I think bilateral trade in specific goods will increase - oil for food, with trusted partners. Or oil for machinery or high tech expertise. Counties who have mainly tourism or financial services to sell will be left out.
There will no sovereign debt defaults in the US or western Europe since the central banks are ready to create trillions of dollars and Euros out of thin air to buy assets if no one else will buy them. We have quantitative easing to infinity which will lead of an explosion in price of gold and commodities. Simultaneously, you will get the deflation you are looking for as private sector credit continues to contract.
After you have inflated away debt (which is my book is a form of default) what do you do for Act II? Who are you going to borrow from in the future? You now have the rest of the world angry with you, and folks should have learned the debt is no longer working. So it seems like you are in pretty bad shape. Who do you attempt to trade with, and what do you use for currency?
There will be a new reserve currency partially backed by gold. Global trade will be reduced and most people will lose their standard of living.
Six years with little if any change in world oil production and consumption. Over that 6 years world population grew by some 70 million souls per year, or about 420 to 450 million, mostly in the developing countries. So how much did per-capital oil use rise in the developing countries while it fell 8% to 10% in the OECD? Perhaps not much at all.It probably fell outside of China and OPEC countries. How much slack is left? I think we are closer to an oil price
explosion than most believe.
This suggests that demand elasticity has declined. Also of course not only has population increases but also a significant amount of wealth has been transfered to the poorer countries over this same time period thus they have more people and more money today and are more competitive for the remaining oil supplies.
Back in the old OECD the initials somehow remind me of the Soviet Union :)
In the US VMT as rebounded and is now showing slow growth.
http://www.fhwa.dot.gov/ohim/tvtw/10juntvt/figure1.cfm
And of course the crash following the last rapid rise in prices will probably work to make demand less elastic at first if we see another price rise as people will be less willing to make significant changes for what they expect to be another short term spike. On the financial front given the actions that have been taken and the powers that have been granted and outright financial crash is far less likely until the system reaches a much higher stress point.
Some people have mentioned that travel will fall but more likely air travel will be replaced with shorter local vacations so the total oil usage might not change nearly as much as you think.
In the US the housing construction industry is now DOA so it can't collapse to take pressure off prices.
Outside of the OECD growth is still vigorous thus prices have to rise to the point they not only slow growth but also turn demand negative. Who knows how high prices would have to go to blunt demand in China ?
In short across the board demand today is significantly less elastic than it was in 2005-2009.
Hi c185pilot.
I can see why you are worried.
Help is on it's way. Utube video
Isn't it beautiful?
The manufacturers in Slovenia want to put solar cells on the wings.
Aviation will just have to get more subtle in the post oil decline.
With luck we will still be able to get up in the air.
Sure hope you are right----oil is wonderful for a lot of energy in a compact/light/easily transported and used form. If I lean it out to lean of peak EGT I can cruise at altitude on about 11 gph. Almost 15 mpg at 160 miles per hour. With 4 on board, that is not to bad when compared to most terrestrial motor vehicle travel. I will be 70 when my next physical comes due, maybe there will be fuel for me until my health/age would make me quit anyway. Light plane fuel usage gets lost in the rounding error of oil use--so maybe some will stay available for a few years.
What the hey?
c185pilot2000's 11gph would be somewhere around 450kW of heat power, or maybe 120kW to 150kW of electrical/mechanical power. So where, exactly, do I put, oh, 1000 or 1200 130W solar panels on those wings to power that thing? How could the panels conceivably ever amount to more than an absolutely trivial feel-good, that would provide at most only a very low single-digit percentage of the power consumption? (Yes, I know there was a solar plane flight, but that plane was a whole different entity, academically amusing but utterly useless for general aviation.)
Fire does not burn in a vacuum. Its physically impossible for OECD citizens to spend a lot more on energy and still have enough left over to pay for everything else that sustains our economy.
Euan - I agree - so if you had to rank the necessities, what falls off the bottom?
I plan to sell my oversize suburban house next year. I just can't see house prices in any OECD country being maintained.
Assuming the 420-450M growth of total population in 5-6 years is correct, consider this. If USA population has grown 12M since 2005 [wikipedia], and if US per capita oil consumption is 5 times the average per capita in 'developing' nations, including China, then as thought experiment, the US 12M growth over 5 years would be equivalent to perhaps the potential oil demand of 60M extra citizens in the 'developing world'. That is, something over 13% of that world population growth total if expressed in a way relevant to oil consumption? We should bear in mind that within my definition of 'developing world' (see note) the largest share is 'not-developing-very-much' at all? e.g. very rough estimate for the latter at the moment who continue with very little access to fossil fuel: within India and China; 600M Indians, 400M Chinese, most of Africa's total population, 150M Bangladeshis, similar in Pakistan, Indonesia, etc
(US share of consumption of world oil exports is still an enormous factor and memmel makes relevant points about elasticity of demand.)
note: I only eyeballed Jonathan S Callaghan export browser database to check actual figures for oil consumption, and categorized the 'developing world' as World minus OECD and FSU and Opec-10; which probably erroneously puts the whole of S&C America in the 'developing' category.
My latest incremental crude oil graphs using EIA IPM data are here:
http://www.crudeoilpeak.com/?page_id=51
We have to watch when hitherto growing countries (Fig. 7) are peaking/declining
If you only look at the last five years of production from these countries, you get a different perspective:
Alghough oil prices are 2-1/5 times higher than in 2005, half of these countires have nearly the same production as in 2005 -2006. True for Libya, Algeria, Equatorial Guinea, Canada (since 2006), Sudan (since 2007).
I also would like to know if these production figures are C & C or "all liquids" count that includes NGL (Qatar) or biofuels (Brazil). There is a difference in the energy content of NGL and biofuels like ethanol, so a rise in these fuels is only good for 60% or less energy compared to crude.
The graph clearly says its crude only (crude and lease condensate to be precise)
http://www.eia.doe.gov/ipm/supply.html
There are arguably a few new countries joining the group - perhaps Uganda, Ghana, Mongolia, deep water off of Africa.
I think a major issue for all countries (these and other countries) is how high the oil price can stay on a consistent basis. If EROI limits are such that the oil price can never stay above, say, $85 barrel for long, then it will not be economic to produce the most difficult-to-produce oil, and enhanced oil recovery will not be economic on a huge scale. If oil price is not high, production will tend to drop more quickly than it would otherwise.
In terms of global C&C supplies, it seems that the only real term potential game-changer would be new production out of Iraq. I'm not optimistic--but how possible/probable is it for a substantial boost in Iraqi production to at least extend the plateau?
Iraqi oil production has gone essentially sideways since 2001. That's 10 years gone just there. Wild-eyed optimists are anticipating a quadrupling (but more likely a doubling, all things being equal) of the current figure, but not for another 10 years.
Global oil decline is/was running at 6.1% p.a. according to the IEA. More and more mainstream government agencies around the world are forecasting peak oil around 2014-15 (so we take this as our outer bound for the PO date). Now do the math. How many Iraq's will we need to fill in the shortfall between 2015-2020? I suspect it would be a lot.
From Giant oil field decline rates and their influence on world oil production (Höök, Hirsch, Aleklett 2009):
Taking the CERA estimate of 4,5% and a start point of 73 mmbopd for this year, and adding the Wiki megaprojects total for 2010 to 2011's production, etc., I get a production of 69,8 mmbopd in 2015, a reduction of 3,2 mmbopd over today's. The Megaprojects list seems rather useless beyond that, however continuing the series I get a cumulative shortfall of 13,7 mmbopd in 2020.
Thus the Al-Shahristani plan, if it pans out perfectly (Iraq @ 12 mmbopd in 2020 or so), could extend the plateau a decade (nevermind that 550 mbopd of the megaprojects are from Iraq already, this is a VERY rough estimate).
Of course, the decline rate is unlikely to fall and likely to rise, and also CERA is notoriously "optimistic".
With a constant decline rate of 6% (upper end of Exxon's range) and the assumptions above, I get a shortfall of 8 mmbopd in 2015, and 21,6 in 2020. In this case we need both the al-Shahristani miracle and a new Saudi Arabia for the plateau to extend another decade.
With 8% decline the shortfall is 14 mmbopd in 2015 and 30,7 in 2020. If it was that bad, however, we should be peaking rather violently right about now, which doesn't seem to be happening (*knocks on wood*).
The initial Lower 48 (1970 peak) and North Sea (1999 peak) crude (C+C) production decline rates were relatively low for the first three years, followed by more rapid decline rates over the next six years--an initial three year production decline rate of less than 1%/year for the North Sea, versus a 10 year production decline rate of about 4.8%/year.
I think that the key difference between post-2005 global crude oil production versus post-1970 Lower 48 & post-1999 North Sea production is slowly rising unconventional global production now, which was not a factor in the initial Lower 48 and North Sea declines. But the underlying global conventional crude decline rate could easily accelerate.
Incidentally, Sam did a "Megaprojects" analysis of post-peak North Sea production. The 1999 peak was about 6 mbpd. Sam looked at North Sea oil fields whose first full year of production was in 1999 or later, and these post-peak fields had a peak in 2005 at about one mbpd, but a million barrels per day of new production, equivalent to about one-sixth of total peak production, only served to slow the overall decline rate.
And as noted below, slow initial net export decline rates tend to mask sky high underlying CNOE depletion rates.
Westexas said:
I don't think the global decline rate is likely to accelerate quickly. Unconventional oil, as you point out, works against rapid decline; also, the US decline is past it's rapid days, so simplistically I expect that to stay flat, and it's a goodly chunk of world production; OPEC has traditionally been much less aggressive extractors than non-OPEC, and thus I'd expect a rather rounded peak there; North Sea has reached the point where declines are decelerating...
Of course, Ghawar might do a Cantarell, and Chinese production might collapse, but all in all, I think using a constant decline rate is a reasonable simplification in a ROUGH estimate of WORLD production not too many years hence.
Hello,
The diagram above shows developments in year over year (YOY) decline rates for North Sea crude oil and condensate production from January 2001 and as of April 2010 shown by grey dots. The blue line shows the North Sea decline rate smoothed with a 12 MMA (12 Month Moving Average). The green line is the oil price plotted towards the left y-axis.
The decline rate shows huge variations on a year over year basis.
The blue line which shows how the annual decline rate develops is quite interesting. Note how decline slowed down with the growth in prices and most recently has accelerated again, and as of April 2010 the decline rate for North Sea was above 6 % on an annual basis.
Hei Rune,
yes, that is indeed quite interesting! Thanks!
However, I think my general point still stands - going by the 12 month ma, the decline rate had a "trough plateau" of roughly 8% from mid-2005 until early 2007, and have since improved somewhat. And if the (eyeballed) correlation with price with a lag of about a year holds, the general direction should be flat or slightly improving decline rate in the next year or two.
Anyway, I should probably modify my statement from "NS decline rates are decelerating" to "NS decline rates are no longer accelerating".
The diagram above shows developments in year over year (YOY) decline/growth rates for the Gullfaks field on NCS (Norwegian Continental Shelf) crude oil production from January 2001 and as of July 2010 shown by grey dots. The blue line shows the Gullfaks decline rate smoothed with a 12 MMA (12 Month Moving Average). The green line is the oil price plotted towards the left y-axis.
Looking at the 12 MMA it shows that the annual decline rate have a bumpy behavior. This has been observed for most of the oil fields on NCS. To me this suggests that decline rates are hard to predict and it does not seem as they settle at some level.
This ought IMO to be given more attention as I expect the global decline also will wobble around from perhaps 2 % one year to perhaps 7 % the following year or vice versa. The average decline rate over several years may become 5 %/year. Such a behavior takes of course out the predictability which so many now base their forecasts on.
This wobbling around also makes future oil price predictions an enhanced risk sport.
Rune Likvern said:
Do you really think so? Won't the bumpiness of several regions cancel each other out? Don't your own graphs show this? After all, the bumpiness of the Gullfaks field is much greater than that of the aggregate North Sea.
Also, as WHT pointed out above: "derivatives are very susceptible to noise and other fluctuations". Decline/growth is the derivative of production.
Well certainly, we can construct scenarios where the decline rate of the world goes down. A price spike could drive depletion rates up and decline rates down, temporarily, for instance if the vaunted OPEC spare capacity comes online. Some time later the decline rates would go up again, perhaps spectacularly.
But if I understand you correctly, this is not what you mean?
As for predictability... When reasonable informed estimates of global avg decline range from 4% to 8%, well, there are copious amounts of uncertainty.
We really do not know. What my graph shows is that the decline rate for North Sea wobbles around.
That is why I presented actual data for both a region and a field as a response to your assertions. Despite rate differences decline rates exhibit some common features.
Decline in all the data I have seen starts out slowly and apparently accelerates to some maximum. From there decline rates may over time move in either direction as documented by the diagrams above.
Which I understand is an average for/over several years.
As a perturbation, I would not doubt that increased prices will spur further extraction, as you can't really argue the profit motive (extract faster) or what to do with excess profit (explore more).
The role of time derivatives on price is also pretty strong as decision lags leading to undershoot and overshoot in price are also a form of derivative. That's what causes much of the volatility in stock market prices as well.
To be technically precise, current production is the derivative of cumulative production, and instantaneous production increases/decreases, or acceleration/deceleration, is the derivative of current production. So all you need is slight changes in production level, like as in you say OPEC decisions, for the acceleration to change and the price will go with it as people try to make profits by being the first to detect the rate of change.
(Net Export) Depletion Marches On. . .
Through the end of this year, Sam Foucher's most optimistic projection is that Saudi Arabia, Russia, Norway, Iran and the UAE will have shipped about 30% of their combined post-2005 CNOE (Cumulative Net Oil Exports), almost one-third gone in just five years.
The point is that slow declines in the annual volume of net oil exports obscures the underling depletion rate. And it's not like there aren't examples out there. If we sum the output of Indonesia, the UK and Egypt (IUKE), they had a combined production peak in 1996. Three years later, in 1999, their combined annual volume of net exports was only down 9% from their 1996 rate, but they had already shipped more than half of their post-1996 CNOE.
The current "health" of the world economy (especially in oil importing OECD countries like the US) is largely an illusion, in the sense that it is being propped up because of a high post-2005 CNOE global depletion rate. The continuing irony is that most governments in oil importing OECD countries are doing precisely the wrong thing at precisely the wrong time--borrowing against future revenue to encourage consumption, in a desperate attempt to maintain BAU.
Incidentally, I think that average annual oil prices provide a much better indication of global supply & demand, and annual prices tend to average out the trading hysterics (both going up and going down, e.g., the 2008 average was $100, versus $62 for 2009). A point that most analysts seem to be missing is that the average annual oil price to date for 2010 (around $75) exceeds all prior annual oil prices, except for 2008, when we averaged $100.
Hello,
Thanks for this intteresting studdy.
For me, the more important is not the peak oil production, but the peak oil exportation. For the major part of Western states (USA, Canada, Europe, Japan, ...), even if they produce a small part of the oil they use, the major part is imported from other states that export oil (OPEC, russia, ...). But, even if the world oil production is stable, the available oil for export can be going down because the producer states can be increasing they own part of oil consumtion. And if the volume of oil export is going down, the oil price in the international market will explod. The graph of OECD net oil import show a peak 2 years before the oil price peak in 2008. And this OECD states are the major part of import oil state.
I thing it will be very interresting to do a calculation of oil export in the world since 50 or 100 years, and see if this curve has peak or not. Other interresting point will be the ratio between the oil production and oil exported by the states. Because if the oil producer states maintain they production but keep for them self a part more and more oil, the other states will have a problem before the "global peak oil". This problem already appears on some states (Indonesia, Egypt, GB, ...).
Thanks a lot, and sorry for my poor english.
Bergil
Our 2007 presentation to ASPO-USA on the (2005) top five net oil exporters:
http://energybulletin.net/node/38948
The 2007, 2008 and 2009 data points for top five net oil exports fall between Sam Foucher's middle case and best case scenarios.
So by 2020 we could be in a situation where Net Oil Exports are zero?
No. Sam projects the top five approaching zero net oil exports some time between 2030 and 2035. However, his best case scenario is that they will have shipped about half of their post-2005 CNOE (Cumulative Net Oil Exports) by the end of 2013, three years hence.
Where it gets interesting is the rate of increase in "Chindia's" net oil imports. At their current rate of increase, 10 years from now, in 2019, Chindia's combined net oil imports will be equivalent to 100% of projected (2005) top five net oil exports.
Our forecast for the US is that the US is going to be forced to make do with a declining share of a falling volume of global net oil exports. In effect, we are well on our way to becoming "free" of our dependence of foreign sources of oil.
The world economy would be toast, as would most of the other economies. Well before 2019 as there are likely to be resource wars over the remaining net oil exports as well as financial wars to undermine the stability of competitors.
"Net Export Math" suggests that most debts won't be repaid, at least not with currencies worth anything close to current values, and that the markets are mispricing most stocks (the volume of exported oil won't be there to generate the earnings that stock markets are expecting).
Absolute insanity.
Best leave Canada out of that statement. Canadian oil exports have been increasing for decades while Canadian oil imports and consumption have been flat for many years, and at this point in time Canada is exporting more oil and products to the US than it is consuming itself. See my reply to Gail, above, for details.
The volumes are relatively small, though, and don't do much to compensate for declines in other OECD producers. They certainly will not compensate for a decline in exports from OPEC countries.
A case in point is Canada + Venezuela. Their combined net oil exports fell from 3.7 mbpd in 1977 to 2.8 mbpd in 2009 (EIA).
Well, according to CAPP statistics, Canadian oil exports increased from 0.33 mbpd in 1977 to 1.86 mbpd in 2008, so I think the decline in Venezuelan exports must have been really spectacular.
Canadian oil imports increased from 1.13 mbpd in 1977 to 1.78 mbpd in 2008, but there's the confounding issue of the big Eastern Canada refineries importing oil, refining it, and exporting most of the products to the US. CAPP is no help there. The US EIA gives a volume of 536,000 bpd of product imports from Canada in 2008, but their web site data I'm looking at doesn't go back to 1977. Looking at the trend line of the data, I would say that in 1977 it was a tiny fraction of what it was in 2008.
Based on that, I would say that Canadian net exports of oil and products increased by around 1.5 mbpd from 1977 to 2008. If combined Canada+Venezuela net exports fell by 0.9 mbpd, then Venezuelan net exports must have fallen by around 2.4 mbpd.
As we have previously discussed, net exports are defined as domestic production less domestic consumption. The EIA shows Canadian net oil exports increasing from 0.7 mbpd in 1997 to 1.1 mbpd in 2009. The precise number is a 449,000 bpd increase in net oil exports over a 12 year period, or about 37,000 bpd per year.
To put this in perspective, the 12 year rate of increase in domestic Saudi consumption has been about 88,000 bpd per year. So we would need more than two Canadas just to meet the increase in domestic Saudi consumption.
Canadian net oil exports (EIA):
Oh, I see. The problem there was that you cited 1977 rather than 1997 for your base year. That was probably a typo.
In 1977, the Canadian oil industry was quite different than today. The vast majority of production was Alberta conventional oil, and oil sands production was a mere trickle. Alberta production had peaked in 1973 and was in steep decline, the Liberal government of the day was taxing production and using the money to subsidize imports, and much to their surprise, exports fell while domestic consumption and imports rose, making Canada a heavy net importer of oil.
Today, things are quite different. Five of the ten provinces have significant oil production, the vast majority of Alberta production is from the oil sands, and the current Conservative government lets the market determine prices (with heavy fuel taxes to discourage consumption.) They quite like the revenues they get from consumption taxes plus income taxes and value added taxes on oil production, and they also like the favorable balance of payments effects of oil exports, so it's full speed ahead in the oil sands.
Also, gasoline prices in Canada are over 20 times as high as in Venezuela, and probably 10 times as high as in Saudi Arabia, so don't expect Canadians to develop a sudden urge to do a lot more driving.
As you say, it would require two more Canada's to match the increase in Saudi domestic consumption. It's all about economics and rational energy policies.
Saudi Arabia used to be just a lightly populated kingdom with about as many people as Quebec, but now its population is now nearly as big as all of Canada, and by the time they run out of oil, it should be considerably higher.
I can't continue this discussion because I have to catch a helicopter this morning and fly in to a remote Alpine hut to help do some maintenance (new floor). I'll be out of touch (except via forestry company mountaintop VHF radio repeater) for the next week. And then I'm off to bicycle the coast of Oregon, so I may not have much to add for the next month or so.
Sorry, 1977 was a typo. I was trying to show the change in combined net exports since the 1997 production peak in Venezuela.
El Badri, the OPEC Secretary General said today in an interview with the German Handelsblatt that OPEC has 6 Million b/d spare capacity. He also said that enormous OPEC reserves exist but one only has to find it. Children say the same about Santa Claus.