| Drumbeat: August 3, 2010 | The Oil Drum | BP's Deepwater Oil Spill - Start of the Static Kill - and Open Thread 2 |
Europe and Natural Gas - Are Tough Choices Ahead?
Posted by Rune Likvern on August 3, 2010 - 10:40am in The Oil Drum: Europe
In Europe, natural gas has great importance. Many people believe (some countries even instituted policies) that it will be the fuel that will become the bridge to an energy future with less reliance on coal and nuclear power. Furthermore, in 2009, about 26% of the primary energy consumption of the 27 members of the European Union came from natural gas, making it a very important fuel today.
In this post, I present some graphs showing European historical natural gas consumption and supply, along with my estimates of future consumption and supply. Based on my analysis, there may be a shortfall in supply very soon, especially if sufficient new sources of supply are not found, or if natural gas is used as a substitute for other energy sources. More specifically, the findings from my analysis are as follows:
- It is projected that between now and 2020, Europe will need to develop additional natural gas supplies of approximately 120 - 150 Gcm/a (thousand million cubic meters per year) from more distant sources, if demand as projected by EIA and IEA is to be met.
- As of 2009 Europe obtained approximately 47 % of its natural gas supplies from distant sources; this is projected to grow to more than 70 % by 2020.
- Europe’s growing dependence on natural gas from more distant sources may also impact its future policies to ensure security of energy supplies.
- If additional supplies fail to appear, Europe could see an imbalance in natural gas supply and demand starting as early as 2011/2012.
These issues also raise questions as to the feasibility of using natural gas as a substitute fuel for transportation within Europe. The IEA, in its Mid Term Market Gas & Oil 2010 report, shows growing natural gas demand in Europe, similar to what one might expect if natural gas is being used for new purposes. I could not find any indication in that report, however, as to where this new supply might come from.

This diagram shows actual natural gas consumption between 2001 and 2009 for EU, split between Europe’s (inclusive of Norway’s, even though Norway is not a full member of the EU) own production and imports by pipeline and LNG. It also shows forecast growth in demand (black line) to 2020 based on EIA and IEA projections. The light blue area is my projection of Europe’s natural gas production. The light red and light yellow areas indicate expected pipeline imports and LNG imports, if these stay at 2009 levels. I calculate the required amount of additional supply by subtraction.
More below the fold.
DISCLAIMER: The author holds no positions in the oil/energy market that may be affected by the content of this post.
EUROPE’s DEVELOPMENT IN NATURAL GAS SUPPLIES AND RESERVES
Below I will present developments in Europe’s natural gas production and reserves. I also describe how additional supplies by pipeline and LNG have developed in the recent years for both source and end user. It has been an objective for many European countries to diversify their sources for natural gas supplies.
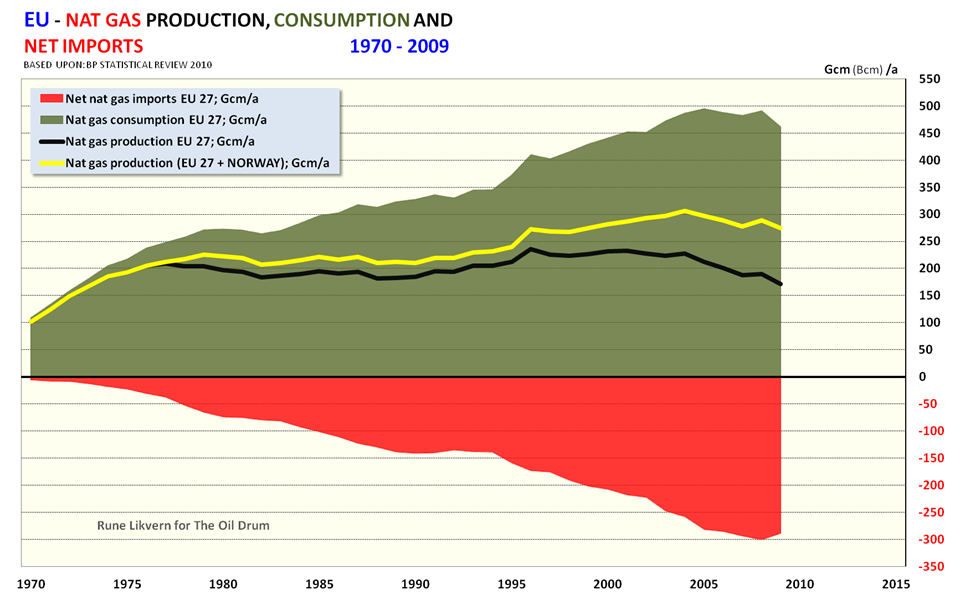
Figure 01: The diagram shows developments in EU’s natural gas consumption, net imports (inclusive of imports from Norway) and production from EU and EU + Norway.
The recent economic slowdown reduced natural gas consumption and thus the need for imports. Now it seems like demand for natural gas in EU is growing.
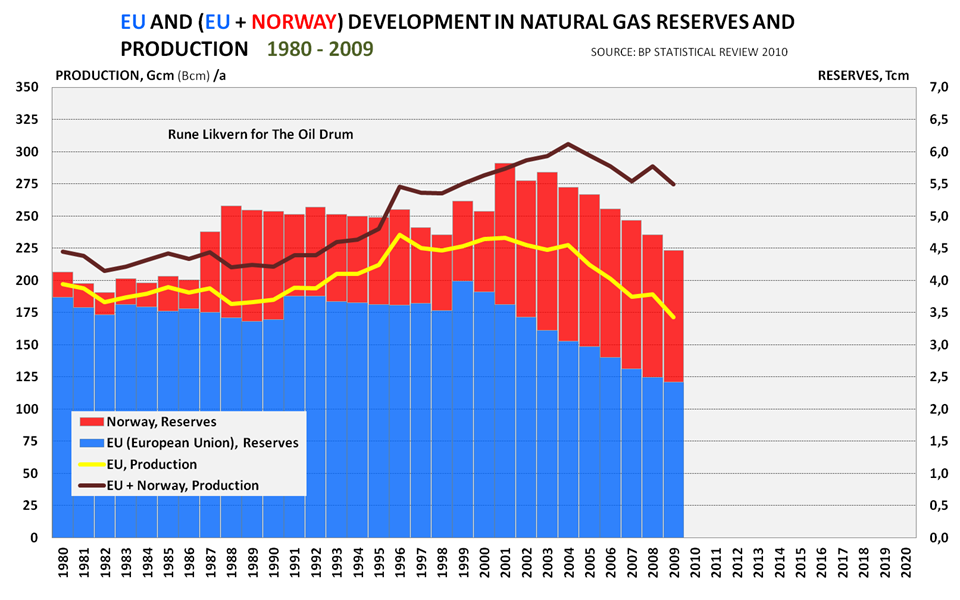
Figure 02: The stacked diagram shows developments in proven natural gas reserves for EU and Norway for the years 1980 - 2009. It also shows developments in production for the same.
EU + Norway’s proven natural gas reserves had a top in 2001 and have since been in steep decline. EU + Norway's production peaked in 2004 and is now in terminal decline. As of end of 2009, Netherlands held around 75 % of EU’s proven natural gas reserves.
PIPELINED NATURAL GAS
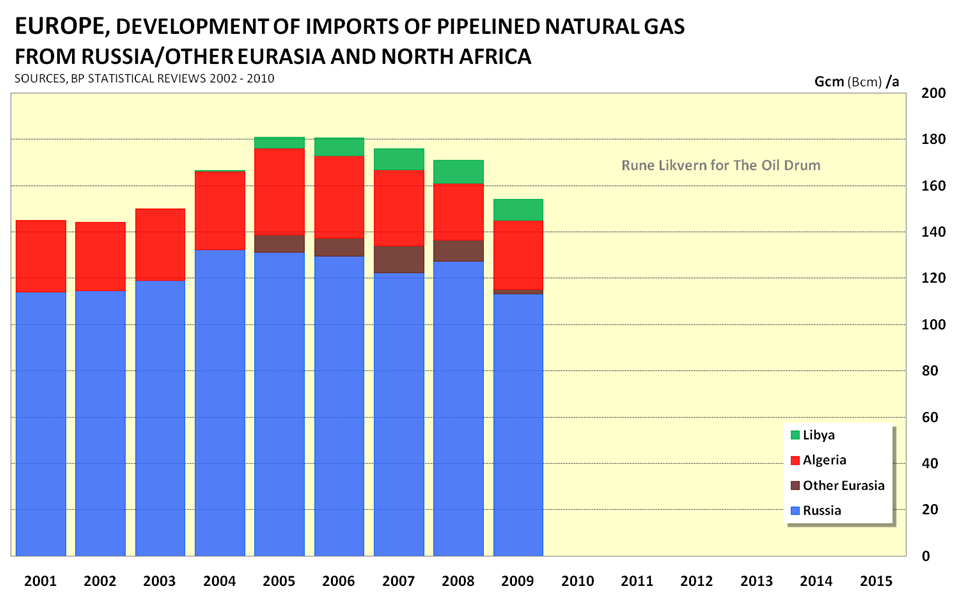
Figure 03: Above is shown developments in sources for Europe’s imports of natural gas by pipeline for the years 2001 - 2009.
Russia has been and is believed will continue to be the biggest supplier of natural gas for Europe. North Africa by Algeria and more recently Libya, has been and will continue to supply the Europe’s Mediterranean region with natural gas.
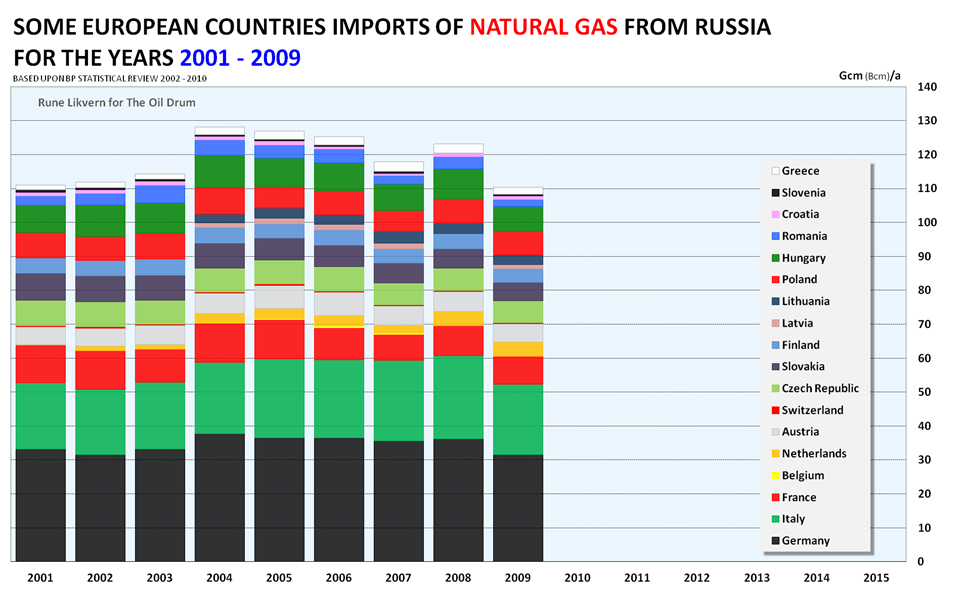
Figure 04: The stacked columns above shows how imports of natural gas from Russia for some European countries have developed for the years 2001 - 2009.
Germany and Italy have been big importers of natural gas from Russia. Countries close to Russia have supplemented their indigenous production with imports from Russia or been dependent on most of their natural gas supplies from Russia. Imports from Russia had a high in 2004 and has declined a little in recent years mainly due to the economic slowdown.
For my estimates on when Europe could experience future imbalances between supplies and demand I have assumed that Russia has the ability to increase natural gas supplies to Europe and thus allowed for future growth in Russian natural gas deliveries to Europe.
LNG (LIQUEFIED NATURAL GAS)
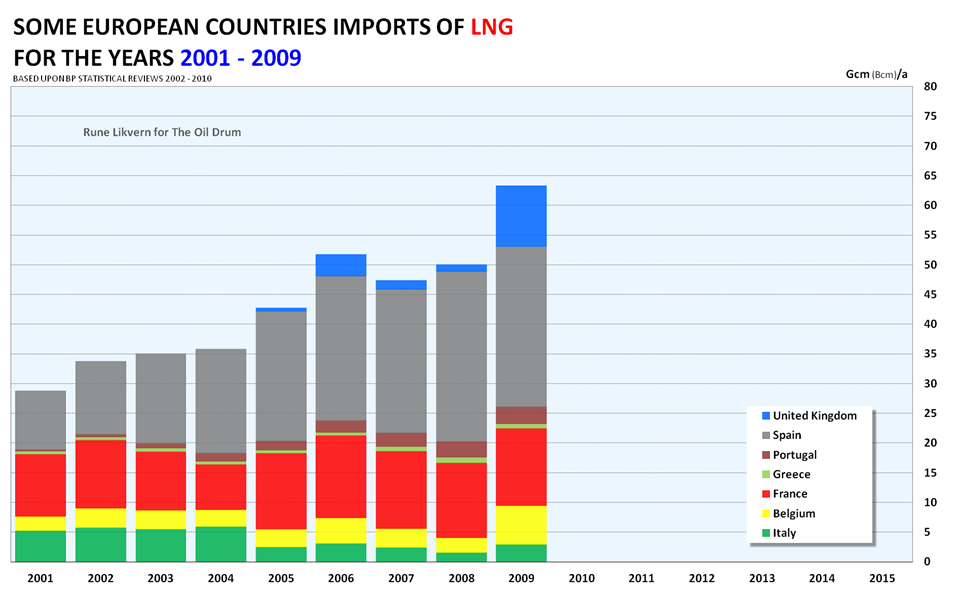
Figure 05: The stacked columns shows how supplies of LNG for some European countries have developed for the years 2001 - 2009.
LNG (Liquefied Natural Gas) has been one way for Europe to pursue a diversification in natural gas supplies. Spain which in recent years has had a strong economic growth has facilitated this also by growing energy consumption and for natural gas, primarily by LNG imports.
As of 2009 Europe’s demand for LNG was around 26 % of the global LNG market.
Recently UK has been a big importer of LNG and these imports will grow in the next few years. Interestingly this year’s growth in U.K.’s LNG imports have facilitated increased exports of natural gas to Continental Europe, which could suggest that companies on Continental Europe have taken benefits of U.K.’s growing LNG import capabilities.

Figure 06: The diagram shows where Europe’s imports of LNG has come from for the years 2001 - 2009.
LNG has a more global market than pipelined natural gas provided there are receiving facilities and provided specifications are met.
Earlier this decade, many LNG developments (like Snøhvit in Norway) were sanctioned in the anticipation of growing import needs for natural gas from the USA. The recent year’s growth in unconventional natural gas production in the USA, primarily what is now referred to as shale gas, became what in many circles was referred to, a “game changer” which also affected the market for LNG. The supplies of unconventional gas led to a softening of the natural gas prices in the US market.
This is now reflected in how Europe imports its LNG which includes more distant sources as Trinidad & Tobago (ref the diagram above).
Some years ago Algeria experienced a fatal accident at one of their LNG plants that reduced their export capabilities. This explains the recent years' decline in European LNG imports from Algeria.
Qatar is now emerging as the biggest supplier of LNG for Europe; this is very much facilitated by the growing LNG receiving capabilities at the South Hook and Dragon in Wales.
THE FORECAST
Figure 07: The diagram shows developments in actual natural gas consumption between 2001 and 2009 for EU, split on Europe’s (inclusive of Norway’s) own production and imports by pipeline and LNG. It also shows forecasts growth in demand (black line) towards 2020 from EIA and IEA.The light blue area is my projection of how Europe’s natural gas production will develop towards 2020 and by showing pipeline and LNG imports at 2009 levels towards 2020, the diagram illustrates the growth in additional supplies from pipeline and LNG, if forecast demand is to be met.
NOTE. Production from Norway has been included in EU’s production though formally Norway is not a full member of EU.
The forecast on EU + Norway’s natural gas production is done with regard to developments in proven reserves, production and R/P (Reserves over Production) ratio for each European country.
For Norway (which production forecast is included in the light blue area), my forecast is based upon a field by field approach for all sanctioned fields as of end 2009 and where due considerations to NPD’s (Norwegian Petroleum Directorate) data for proven reserves, production developments and R/P ratios has been given. My forecast for Norway results in growth in natural gas supplies until 2012 which then starts to decline.
At the beginning of this post, I described the possibility for an imbalance between European natural gas supplies and demand around 2011/2012. In my analysis I have allowed natural gas deliveries from Russia to Europe to grow above 130 Gcm/a by 2012 and assumed full utilization of U.K. LNG receiving facilities which is still being expanded.
IEA in their WEO 2009 have assumed a growth in European natural gas demand of 0,8 %/y and EIA in their IEO 2009 has assumed a growth of 1,0 %/y.
Presently I look upon the European natural gas market as being driven by three components; a) economic development, b) substitution from coal and nuclear to natural gas for electricity generation, and c) weather.
Substitution from coal and nuclear could be what now primarily drives European demand for natural gas, as recent data from U.K. suggests.
Allowing for growth in Russian and LNG supplies, it looks like European demand and supplies may become imbalanced by 2011/2012 and this gap may grow to 120 - 150 Gcm/a by 2020.
As of now, it is hard to see where such additional supplies will come from, if EIA/IEA projected demand by 2020 is to be met.
NORWAY AND RUSSIA
Presently Norway and Russia are the biggest suppliers of natural gas for EU.
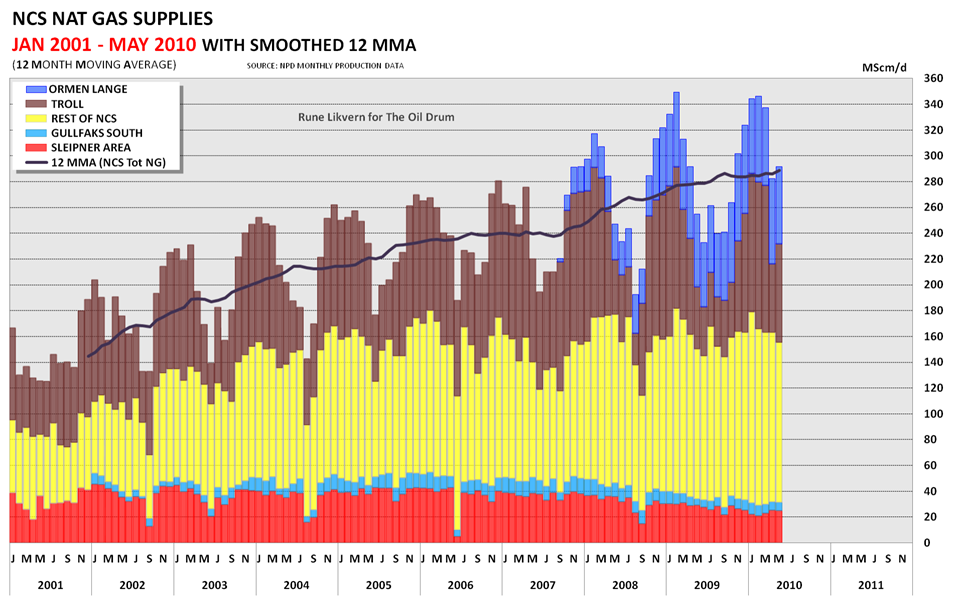
Figure 08: The above diagram shows development in Norway’s natural gas production by some individual fields and group of fields as reported by NPD (Norwegian Petroleum Directorate) for the period January 2001 and as of May 2010.
As of now it may look as Norwegian supplies are about to plateau as illustrated by the 12 MMA (Month Moving Average). The diagram shows how supplies from fields like Sleipner and Gullfaks South are now in decline due to depletion. The Troll field has been and will be a major supplier of natural gas. The diagram illustrates that recent growth in Norwegian supplies has primarily come from the Ormen Lange field.
The yellow columns shows all other fields and the diagram illustrates that new fields brought online primarily have helped offset declines from fields in decline like Sleipner and Gullfaks South.
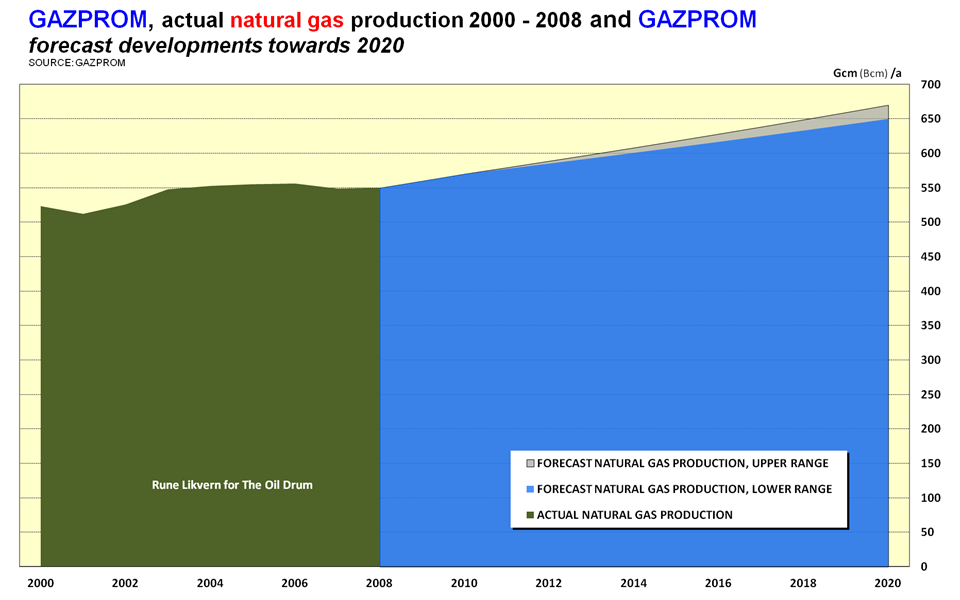
Figure 09: The diagram shows Gazprom’s production of natural gas for the years 2000 - 2008. It further shows present projections by Gazprom on how their supplies will grow towards 2020.
The Russian gas giant Gazprom presently controls more than 85 % of Russian natural gas production and has a monopoly on exports on natural gas. Gazprom now projects their supplies to grow by around 100 Gcm/a relative to 2008 levels by 2020. This growth is for increased domestic consumption, growing exports to Asia (from Eastern Siberia to China and Japan), and some for other markets included the European.
As of now it appears as Gazprom is not planning to increase European deliveries to such an extent that they will cover a major part of the European natural gas supplies gap I have described here.
SOURCES:
[1] BP STATISTICAL REVIEWS OF WORLD ENERGY 2002 - 2010
[2] EIA, INTERNATIONAL ENERGY OUTLOOK 2009
[3] IEA, WORLD ENERGY OUTLOOK 2009
[4] IEA, MEDIUM-TERM OIL&GAS MARKETS 2010
[5] NATIONAL GRID, TEN YEAR STATEMENT 2009
[6] NPD, RESOURCES ACCOUNTING FOR NCS AS OF END 2009
[7] NPD, ACTUAL PRODUCTION FIGURES FOR NCS AS OF MAY 2010
[8] GAZPROM’s WEBSITE
Personnel
Editors
Contributors
Peak Oil Primers
Archives
- November 2010 (3)
- October 2010 (6)
- September 2010 (4)
- August 2010 (7)
- July 2010 (6)
- June 2010 (7)
- May 2010 (2)
- April 2010 (8)
- March 2010 (4)
- February 2010 (6)
- January 2010 (3)
- December 2009 (5)
- November 2009 (8)
- October 2009 (12)
- September 2009 (6)
- August 2009 (5)
- July 2009 (11)
- June 2009 (8)
- May 2009 (16)
- April 2009 (10)
- March 2009 (7)
- February 2009 (10)
- January 2009 (15)
- December 2008 (9)
- November 2008 (9)
- October 2008 (9)
- September 2008 (13)
- August 2008 (10)
- July 2008 (14)
- June 2008 (23)
- May 2008 (16)
- April 2008 (12)
- March 2008 (16)
- February 2008 (9)
- January 2008 (13)
- December 2007 (13)
- November 2007 (16)
- October 2007 (22)
- September 2007 (8)
- August 2007 (9)
- July 2007 (16)
- June 2007 (8)
- May 2007 (7)
- April 2007 (7)
- March 2007 (10)
- February 2007 (10)
- January 2007 (12)
- December 2006 (9)
- November 2006 (15)
- October 2006 (4)
- September 2006 (5)
- August 2006 (5)
- July 2006 (9)
- June 2006 (5)
- May 2006 (10)
- April 2006 (9)
- March 2006 (13)
Vital Trivia
License

This work is licensed under a Creative Commons Attribution-Share Alike 3.0 United States License.
Thanks, Rune! Very nice graphs!
All of this is very worrisome. Do you think public officials are oblivious to all these likely problems, or just hiding them from their constituents? It seems like people will be pretty unhappy, when they discover the true state of natural gas supplies. Even if the problems don't hit for a few years (say 2015), it is already late to make a decision to to ramp up nuclear instead.
Hello Gail,
That is the multi trillion dollars question!
I really do not know, but judging by the increased use of the word “nuclear” by British and German politicians, it seems like this is an issue they are aware of.
From Germany Energy Profile.
Some years ago Germany embarked on a policy to substitute most of its nuclear plants with natural gas powered plants. And in the U.K. it looks like natural gas was going to become the major substitute for coal as coal fired plants went into retirement and this may also be the strategy for nuclear power.
These policies suggest to me a continued growth in Europe’s natural gas consumption for the years ahead.
A continued sluggish economic development may also affect natural gas consumption.
All forecasts are wrong.
Question is by how much?
That one graph sure looked mighty Mummar to me.
Starting from the very top, graph's nos. 4 and 5 look -"peakish".
I understand the finite quality of all the FF we burn. It seems to me '"we" just don't want to look'.
Who wants to tell everybody the party is over?
Globally speaking (from memory)... There's around 6000 trillion cubic feet of reserves, but we already use 100tcf annually. That's 60 years at current consumption, much less with so-called transitional growth.
The party has some legs yet, but yep, limits for sure.
BAU. Cliff. That's the plan!
(Doh)
Graph no. 4 shows Russian natural gas supplies to some (most) European countries and Russian natural gas supplies has declined in recent years due to the economic slowdown and it is also believed that presently some customers has favored LNG over pipelined gas due to price differentials.
Nord Stream from Russia through the Baltic Sea to Germany has a potential of 55 Gcm/a, and this pipeline will add new supplies (amongst others Danish Dong and Dutch Gasunie) has signed up for deliveries through this pipeline. If Nord Stream’s full potential is used for only new supplies or that some existent contracted volumes will be rerouted through this to avoid other countries of transit is not fully known.
There is reason to believe that Russia has the capability to increase future natural gas deliveries to Europe beyond its former high in 2004.
Graph no. 5 shows LNG (Liquefied natural Gas) imports into Europe. These imports are now growing and more receiving capacities have come on line. European LNG import potential could grow with as much as 50 Gcm/a towards 2015.
A large conference on European shale gas was held in Warsaw in July this year. The mood was optimistic for shale gas in several places in Europe. ExxonMobil, Chevron, Total, Gas de France and surely others have taken very large positions in exploration areas in vaious countries, and I fully expect a flurry of wildcat drilling to begin soon. The result will be a new source of European natural gas, which will likely depress prices further, and create a natural gas surplus lasting for 5-20 years, given all the LNG looking for new customers since North America is in a natural gas glut. After that who knows.
Shale gas is overhyped. Calling it a glut of gas in North America is stretching the truth. As for LNG who knows, maybe China will become a major importer by pipe and tanker.
Todd -- I hope for the EU's sake you're optimism proves out. But the tone is identical to that heard in the USA about shale gas in 2007-08. I was working with Devon when the NG price drop essentially decimated that company and many dozens of others. In the summer of '08 Devon was contracting every shale gas drilling available. Just 6 months later they releases 14 of the 18 rigs they had drilling shale gas in Texas and paid a $40 million penalty to do so. The run up in shale gas drilling, along with new Deep Water fields coming on line here, has given us a nice plateau. But it's a false prediction of the future. Both the shale gas and Deep Water wells have a rather short life. And at current NG prices in the USA you won't see many of the surviving companies rushing back into either play. Prices will rise as supplies dwindle but there will be the same lag time factor we saw when prices dropped.
There's a crude (pun intended) line about the speculation around new "boom plays" like shale gas: You want to roll into town with the first wagon load of drilling equipment and whores and roll out before the first load of production equipment hits the ground. You need to keep separate the words of those who will profit by enticing companies to drill from those of the folks whose profit will depend on producing those wells. By far the most profitable ventures in the USA shale gas play were made by the speculators who bought up drilling rights early/cheap and the sold them for 100 times what they paid. And these folks never spent a dollar on drilling a well. Drilling prfits are of no concern to the speculators talking up any play. It's all about the hype for them.
Both the shale gas and Deep Water wells have a rather short life.
I've heard this in several places and believe the concept has substance behind it - why can't we get more (retired) petro-geologists to insert such reasoning into the national/international discussion? News orgs don't seem to be reporting this at all, just the opposite frankly.
Will - I'm' sure one of the major goals of the early SG developers in the EU will be to characterize the decline rates of the various SG plays. Some of the apparently more exciting SG wells in the US had decline rates exceeding 70% PER YEAR. So you might see exciting results that Company X tested it's SG well at 10 million cu ft per day. But when that well declines to less than 0.5 million cf in two years you probably won't see Company X issuing a big press release highlighting that fact. That's what really hurt US producers: we've always been subject to low pricing periods so we just hang on till prices get better in 3 or 5 years. But at that time those SG wells will be producing very little. So why not choke the wells back and wait for the higher prices? Some companies can afford to do that but most need the cash flow even if it means destroying the ultimate profitability.
And I'm not retired. I work for a privately owned company. Profit is the goal...not cash flow. So we don't consider any of the resource plays as viable options. Even more important being private we don't have to worry about growing our stock price. The desire by public companies in the US to satisfy Wall Street's demand for ever increasing reserve booking was THE prime motivator for the SG boom IMHO. The SG public companies used unmet price escalations and unrealistic reserve recovery to boost their book value and thus their stock value. Which is exactly why those companies crashed and burned at an unbelievable speed: those values disappeaded in the blink of an eye because they were never real to begin with. There may be a great profit to be made in EU publicly owned SG companies. Just be sure you're not still holding the stock when the music stops.
RM, that could well be our Epitaph. 300 years from now, someone may dig up an old hard drive from the ruins of some former city and have a techie on hand to hook up the hard drive to a 300 year old computer and a 300 Watt energy supply and, with a bit of technological wizardry, kick it back into life. The computer language will be archaic, but some scholar will work out this was a world-wide forum about energy depletion back in 2010.
No pun intended re. the GOM, but TOD could turn out to be the Dead Sea Scrolls of 2310. Scholars will spend their lifetimes working out why a global society which knew its energy sources were depleting continued to make profit the goal.
Friedrich Hehl, neophyte of the Uppsala Gang, recently produced an overview of our knowledge of shale gas, available here.
Hehl writes that
He then proceeds to call the Rogner estimate "a qualified guess".
"The mood was optimistic" you say?
I say "Hope is not a method"!
In the apartment house where I now live we use gas but I never turn on the heat as we have good insualtion and a mild climate in norhtern Germany. We have bought a house which is weatherized and with solar water heating so we will hardly need the nat gas heating and water heating over gas will be less necessary depending on how much sun shine we get and how little hot water we use. What I worry about is industry and similar and about many houses without good insulation. If they really turn off the nukes and industry relies on nat gas what then? I would like to see more anaylsis of consumption side in Europe. Who will suffer?
I do not think there will be a natural gas supply issue in Europe over the next few years, but this will be due to decreased demand, not increased supply. Part 2 of the financial crisis will result in countries like the UK having to balance the books, resulting in a deflated currency and increased natural gas prices for the consumer. The result will be less consumption.
The EIA/IEA forecasts completely ignore the sovereign default / QE that is going to happen over the next few years.
To me, peak supply and peak demand are pretty much the same thing. If prices go up much (and if more needs to be imported), countries find themselves in worse and worse financial condition, and demand drops.
It may be that the underlying problem is really peak world oil supply, that is rippling through the financial system and causing reduced demand for all energy supplies (because of credit problems). So peak oil may cause peak natural gas and peak coal--even peak nuclear. This could happen because the world is so dependent on oil. Having a short supply of this may disrupt the financial system, and then flow back through to other systems. When the price of oil went up to $147 per barrel, and then dropped back, the related credit disruptions caused drops in demand for all fuels. See this earlier post.
Without boubt, at some point we will realise energy is at the core. The centre. As a species we continue to ignore the real world, this can only end in tears.
C
Hi Rune, great charts!
Remember this, lsat posted 2 years ago? I need to cross check my numbers agaonst yours. One of the very tricky things is to estimate demand - I suspect we see very soft demand in the decade ahead - though last winter was a bit chilly and I gather this summer has been rather warm in parts of Europe.
Figure 32 Gas scenarios for OECD Europe summarising the indigenous supply forecasts and demand forecasts from the preceding sections. With the BAU demand scenario, imports will need to grow from current 197 BCM per annum to projected 442 BCM per annum by 2020 - an increase of 245 BCM per annum. It is doubtful that this quantity of gas may be sourced from African and Middle East markets. It is therefore considered more likely that high price and supply shortages will curtail demand for gas. It is conceivable that conservation, more efficient energy use and substitution with alternative sources of electricity may fill the gap left by declining gas supplies.
http://europe.theoildrum.com/node/4361
Hello Euan,
Through the years we have had many good discussions about Europe and natural gas.
I remember well the diagram you posted in your comment.
The forecast on OECD (which for all practical matters and when it comes to European natural gas is EU + Norway) supplies is where we have a sharp difference.
Presently marketable U.K. natural gas supplies declines at an annual rate of 13 - 14 % and U.K. was as of 2009 the third largest producer of natural gas within OECD Europe and a R/P ratio of around 4,9 as of end 2009 suggests future steep declines.
Norway is presently the biggest supplier of natural gas within OECD Europe. Approximately 70 % of proven recoverable reserves, of a total of 2 042 Gcm, were as of end 2009 in 3 fields, Ormen Lange, Troll and Snøhvit. This according to data from NPD’s resource accounting as of end 2009.
The 3 fields listed are presently facilities restricted at a total of around 50 - 55 Gcm/a. Norway is presently selling above 100 Gcm/a. The distribution of the reserves and restrictions on facilities suggests that Norwegian natural gas supplies are about to peak and then start to decline.
Hi Rune, I think my chart actually used your Norway gas forecast and Rembrandt's Dutch gas forecast. The 14.1% decline in UK gas in 2009 caught my eye whilst scanning BP stat review - have yet to explore this figure. I'm guessing this is affected by a "one off" event, or by strategy - UK may have finally decided to stop burning its own gas as fast as it possibly can in favor of burning Qatar's gas instead.
You are showing about 160 BCM per annum OECD Europe production in 2020 whilst my chart shows over 200 BCM - seems a big difference but is probably due to a very small difference in assumed decline rates.
But I think the big picture, main point, is that Europe will be more dependent upon imported gas in future - and on that we agree - its all a matter of scale and timing.
The other big picture points for UK are that Ormen Lange / Langeled and LNG imports from Qatar are also kind of one off rescue strategies (actually 2 of) - unless of course shale gas comes to the rescue.
€
Thanks - very interesting.
One point often made in the energy debate is that gas is better for global warming than oil, and oil is better than coal, in terms of CO2 emitted per unit energy generated.
That's true at the end point, but the story is more complex if the full supply chain is considered. UK natural gas extracted from the North Sea, burned in a UK powerstation nearby, has a relatively low global warming potential. But in future to pump Russian gas from the Ob estuary to the UK would involve both burning gas to CO2 to pump gas, and leaking CH4.
Currently the UK is producing less and importing more (from Ormen Lange, Norway), so the UK total global warming impact is deteriorating sharply.
As a rough rule of thumb, to burn Russian gas just west of the Rhine has about the same global warming impact as burning oil. Similarly using LNG in the UK is about the same in global warming impact as oil.
No easy answers here. Shale gas is clearly going to help keep prices down. The transition to nuclear baseload power seems essential, plus some contribution from hydrogen made from wind and water in places like Iceland, and even the Falklands, S. Georgia and Kerguelen, where there is a lot of wind. Aluminum and fertiliser (which are essentially electricity) could be made where there is the most renewable power, not from gas power. Also, there is a good argument for a power cable to carry say 2 GW from Iceland to Scotland.
Given that Scotland has the best wind energy potential in Europe and plenty of lakes suitable for pumped storage, it could be 100% electricity independent. No need for cables from anywhere!
Especially cables that are over 1000km long and cost over $1 billion!!!
>;^)
http://www.youtube.com/watch?v=8OpVfBenW60&feature=related
What I find interesting is installed wind capacity per capita. Taking a few of the countries with large installed wind capacity (and the UK) and ranking them by installed wind capacity, we get
(wind capacity figures from http://www.ewea.org/)
Ranking by installed capacity per capita (W) would change the rank order to (largest first) Spain, Germany, USA, UK and China.
Let's look at Texas (March 2010 figures) and Scotland - a US state and one of the countries making up the UK.
Both Texas and Scotland have larger per capita figures than USA and UK respectively. Scotland's installed wind capacity per capita of 406 W puts Scotland ahead of all other countries bar Spain in the top table, followed by Texas.
Scotland has 0.89 GW of wind capacity currently under construction, 2.1 GW consented via the planning process and 4.25 GW of capacity submitted for planning approval (see http://www.bwea.com/statistics/ for details).
Once the capacity currently under construction is complete, the per capita figure for Scotland comes out to be 578 W. Once the capacity consented is also completed, the per capita figure for Scotland is 985 W. And we haven't started to consider the off-shore wind potential, or electricity from waves and tide.
Scotland is well placed for an electric future with 25% of the European wind resource, 25% of the European marine tidal resource and 10% of the European wave resource. The marine resource is already being tapped for electricity generation and Scotland (Orkney) is home to the European Marine Energy Centre and a number of companies making devices to extract energy from the marine environment (Pelamis, Oyster etc).
Note: Lakes are called Lochs in Scotland and that Scotland has 1.5 GW of hydro capacity (it rains a fair amount - especially when the Edinburgh Military Tattoo is on, FMagyar!) including pumped storage.
to steal a Dr. Suess line.. I don't like to brag, and I don't like to boast, but you missed the state with 1.2KW of installed wind per capita.. I also included the City of Ames which has a municipal utility that bought 30MW of capacity for a nearby NextEra wind farm..
What's interesting is the wind watts per capita *exceeds* the average KW consumption in my house in July. (my average was 1160 watts.. I am sort of a power hog.. I was testing an electric resistance furnace). The house I am renting averaged a whopping low 405 watts. We are getting around a 34% capacity factor around here, so the energy my tenant uses is pretty much provided (on average) completely by wind.
So I laugh a little when I start hearing tales of civilization collapsing due to running out of oil. The midwest united states (or, maybe Iowa and Texas) are probably not going to change a whole lot. I haven't even gotten into the 3.2 billion gallon capacity for ethanol production in Iowa. That's over a thousand gallons per person, which turns about to amount to 20 gallons of ethanol (equivalent to 15 gallons of gasoline) per week. So we could all fill up E85 pickup trucks and drive 300-400 miles a week with excessively large vehicles. Personally, I'm filling my Prius up with about 6 gallons of ethanol, and 4 gallons of gasoline a week, and I could drive about twice as far.
Someone will bring up ammonia fertilizer from natural gas for the corn.. we can add another 15GW of wind by 2020, and make ammonia from electricity instead of natural gas ( http://iowagrid.org/20x2020-AFN.pdf ). I'm just waiting for someone to write me a check to put in the orders for a 1 ton per day pilot plant.
And we'll have plenty of meat too, as cattle operations are starting to move back to Iowa because of availability of dried distillers grains.. And the intelligent farm operators have integrated crop & livestock operations where all the livestock manure is used for fertilizer.
So I realized North Dakota actually has 1860 watts/capita installed wind, but has a population well under a million. (646,844). I suspect Kansas, Oklahoma, and Wyoming will also have pretty good Watts/capita numbers, as they are all over a gigawatt of installed wind.
Hi BenjegerdesFarms,
Thanks for those figures - very interesting indeed.
Do you have a link to figures for installed wind capacity in individual states in the US?
Best wishes,
Alister.
"Do you have a link to figures for installed wind capacity in individual states in the US?"
http://en.wikipedia.org/wiki/Wind_power_in_the_United_States#Wind_power_...
http://www.awea.org/projects/
Sorry for the partial OT:
I was interested to look at the global scenario of production/supply and confirmation of model forecasts, but the "peak oil update" page is stuck to July 2009.
It would be greatly appreciated to look the graph updated to july 2010 , but I don't know who ask for it.
Thank you
Thanks, very educational post.
Can someone please tell me at what pressure/temp is the cubic foot of NG when it is used to describe resource amounts. Thanks
HA - STP corresponds to 273 K (0° Celsius) and 1 atm pressure.
AND FOR ALL: Just a little advice in evaluating the various claims of resource reserves. Any recoverable reserve number, regardless of the source, is worthless unless it includes both the NG pricing and development cost assumptions. An in place reserve might yield 5 TCF at $13/mcf but not be developed at all if prices are below $4/mcf. The collapse of US shale gas drilling was two-fold. Prices dropping from the high of $13/mcf to $3.50/mcf was obviously critical. But drilling and completion costs also escalated rapidly. Early wells cost less than $3 million. By the end of the boom $10 million was not uncommon. Initially wells were frac'd 1 or 2 times. At the end 10 to 12 frac stages were not uncommon.
And be very dubious when you see the term "technically recoverable". This means the amount of product that could be produced without regard to profitability. As an example: there are many millions on kilos of gold "technically recoverable" from sea water. The fact that the cost to do so is much greater than the value of the gold is not relevant when you're speaking about technically recoverable volumes.
Thanks Rock,
isn't there also a 'Calorific level' which needs to be taken into account to determine the energy available. How widely to various gas fields vary with respect to calorific value?
HA -- A factor in some case but not too often. One big exception in the US right now is the Eagle Ford Shale play in S. Texas. Some of these shale gas well will also yield 200-400 bbls of light oil with the NG. makes a huge difference in the economics. I'm sure some of the EU operators are hoping to find similar anomalous oil yields.
The base conditions for measuring natural gas vary somewhat from jurisdiction to jurisdiction.
The usual standard in Europe, Canada, and South America is to measure natural gas volumes in cubic metres at 15°C (59°F) and 101.325 kPa (14.696 psi).
In the United States it is commonly measured in cubic feet at 60°F (15.5°C) and 14.696 psi, although 14.73 psi is also common, and other states have other pressure bases (I think Louisiana uses 15.025 psi). Since gas is compressible this can make a significant difference in volume.
The heating value of gas also varies considerably on composition since, while natural gas is mostly methane, it can also contain varying amounts of ethane, propane, and butane, all of which burn hotter than methane. US companies often sell gas in British thermal units (BTU) but, unfortunately there are about six different sizes of BTU that I know of, so you need to know which BTU you are using, and also the base conditions of the gas, as well as the composition.
The appropriate metric unit for the heat content of natural gas is the gigajoule (GJ). There's only one GJ, and only one set of base conditions, so all you need is the composition of the gas, and you don't have to convert from jurisdiction to jurisdiction.
Canada also used to have a variety of base conditions (Alberta used 14.65 psi), and varying definitions of BTU, but that went away with metrication. Now it's always in cubic metres at 15°C and 101.325 kPa in the field, and gigajoules on the gas bills.
Normally volumes of natural gas is referred back to standard (+ 15 deg C) or normal (0 deg C) and atmospheric (ambient) pressure.
Is there a breakdown available as to how much of the Russian gas comes from oil wells (associated gas) vs from NG only wells?
Rgds
WeekendPeak
Great work, Rune - thanks.
Your findings echoe those of Bengt Södergergh, who writes:
Shale gas may be a game changer, but, as per my comment above, the evidence is not in yet. So banking on gas as the energy source of the future seems frankly hare-brained to me. Does it even make sense as a "transition fuel"?
I think you are underestimating Russian (Gazprom) supplies. Nord Stream intends to bring huge amounts of gas into Germany, which would only make sense if Gazprom was confident of their resource supply. Likewise, South Stream will bypass Ukraine, and is only being built f Russia thinks they will have the resource to pump.
While their may be political opposition to fracking in the US, I am sure Russia wouldn't think twice if it was necessary to increase their reserves.
I find it totally unlikely there will be a physical shortage of NG in Europe. A political shortage, such as another squabble with Ukraine, is quite possible, but there will no physical shortage of CH4.
delete dupe. sorry
Rune,
Excellent analysis and lovely graphs. Thanks for all your hard work.
I mostly agree with your analysis but would like some clarification on the following statement:
Of course supply and demand will always be equal when we go back and look at the data in the 2020 BP Statistical Review. Any 'imbalance' will be addressed with increased prices, reduced consumption and, if necessary, interruptions as occurred when Britain's Gas Balancing Alert was triggered this past winter. To my mind the important questions are:
As you mentioned, gas demand in 2009 was down significantly resulting in a drop natural gas imports. By my estimation the decrease in imports was about 8%. But, in the next sentance you suggest demand is growing again.
Do you have any monthly data to support your claim that natural gas demand in the EU is growing?
I think it is quite possible that the EU has seen a peak in total, non-renewable energy demand and that continual improvements in efficiency and a weak economy will keep natural gas supply and demand in balance at prices not too much higher than today's. (I fully expect the national gas exporting nations of the world to be desperate for cash and willing to sell.)
My evidence for claims of declining energy use come from the following charts from the Energy Export Databrowser. On the left we see that Europe's overall energy demand (not including renewables) has been in decline since before the economic crisis. On the right we see that Germany's non-renewable energy use reached a peak in 1979 and has been in more or less steady decline since 1989. Recently Germans have picked up the pace as evidenced by the commenter above with insulation and solar hot water. Based on these trends, I am not confident that the EU must return to increased consumption of natural gas.
I do believe that we will eventually hit peak natural gas with all the difficulties that entails and generally subscribe to your analysis, Rune. This comment is just a minor quibble over timing.
Personally, I am doubtful that we will see any major 'imbalance' in the 2011-2012 time frame and would pick early next decade as more likely time frame for natural gas supply problems in the EU. Still crushingly near, but not quite 'tomorrow'.
Best Regards,
Jon
This related headline just in from the Drumbeat:
Bioenergy From Wood Capable of Substituting for a Fifth of German Oil Use
re: Bioenergy From Wood Capable of Substituting for a Fifth of German Oil Use
Yes, but it's going to be sad to see the remaining German forests converted into biofuel farms.
According to the article, within 10 years, 4 million hectares, or over 11% of the surface area of Germany, would have to be converted to biofuel production, wind farms, or solar parks to produce the required energy. Germany is not a large country, but it does have a lot of people and industry.
One issue is that all those LNG imports might be going to China in 5 years time.
China has strong growth in their natural gas consumption.
Could also Middle East countries start to use more natural gas to free up oil for exports?
Jonathan,
You are right about that demand and supplies will always be in balance, and price is often used to see to that happens.
What I am describing is more precisely that I expect, more correctly, supplies driven price increases a few years from now.
My expectations for the timing of when to expect supplies driven price increases is very much related to the demand projections issued by EIA and IEA.
(I have not said anything about that I necessarily agree with EIA/IEA future EU demand projections.)
The best data I have is from U.K., which is the largest natural gas consumer within EU and these are presented in the diagram below.
Another indicator is that gas prices at NBP (National Balancing Point, U.K.’s equivalent to Henry Hub or similar) has increased since this winter from around 30 – 35 p/therm to now around 45 p/therm.
The diagram above shows developments in U.K. disposition of natural gas from January 1996 to as of May 2010.
The dark red line shows 12 MMA (Monthly Moving Average) of U.K. total natural gas consumption. It shows a decline through 2009 and has since moved back up during 2010. Some of this is due to the demand for natural gas during the recent cold winter.
Data from DECC also shows that consumption of natural gas for U.K. electricity generation has grown strongly in recent months while electricity generation from primarily coal and nuclear has declined.
Hope the answer above clarifies some of your questions.
EU-27 gets 43% of its gas from EU countries; UK 20%, Holland 17% and about 3% from Germany and 3% from Denmark.
The expectation is that European gas fields are set to decline.
EU-27 gets 24% of its gas from Norway and 33% from imports from Russia, Qatar and Algeria.
It is fairly obvious that LNG can only supply a limited percentage of the whole demand, maybe 10% and they will be competing with a more economically dynamic Asia.
The solution obviously is to diversify into imported coal or be at the tender mercy of Russia.
The EU-27 already imports 244 million tons of coal per year worth about 5862 TJ of energy versus 5000 TJ of natural gas imports.
Coal costs about $2US per GJ while LNG gas costs $8US per GJ.
It's a no brainer, more coal.
Let's hope they elect to eat the 25% of the energy to do proper CCS.
UK imports most (about 60%) of our coal, mostly for power generation, and most of our imports are from Russia.
Whoa-nellie!
One crisis at a time!
You can buy coal from lots of places. Originally, EIA said Australia and South Africa.
http://www.eia.doe.gov/cabs/United_Kingdom/Coal.html
Then somebody else said Russia.
The fact is coal is easy to find globally.
I have suggest for a couple years that the UK look into underground coal gasification, a new automated technology and apply it to an estimated 3 trillion tons of coal under the North Sea(20 times Russia's proven coal reserves). The CO2 should be buried in the huge Sleipner saline aquifer.
http://www.theoildrum.com/story/2006/1/6/181130/4446
This could work well with the strong North Sea wind providing pure oxygen for combustion and a bit of H2. The resulting syngas could be water shifted to hydrogen gas, etc. making the process emission-free.
The Brits are clever lads and I think they can figure out how to make this all work.
Otherwise there's plenty of coal in Canada, the USA, RSA and Australia.
You should read Jevon's Coal Question; he waxes eloquent on the subject of the infinite supplies of coal in North America.
http://tinyurl.com/23puyqr
points to the paper "A global coal production forecast with multi-Hubbert cycle analysis" by Patzek and Croft which predicts a peak for coal energy in 2011, reaching 50% of peak by 2047...
Wait till china get russian gas too.
Remember...
Back in the 1980s, Thatcher burnt off most of the UK north sea gas 20/25 years worth into the atmosphere in order to give tax cuts to get re-elected, the money was there to store it. Norway did store their gas and are now selling it to the UK and making a lot of money.
I am old enough to remember three people going into No 10 to BEG Thatcher NOT to burn off all that north sea gas (picture off it was in papers at the time). They told her it would soon be needed. It was three days later she came out off NO 10 and was asked….”Why are you going to burn off all that gas” she said…”I have agonised over this but feel it is the best thing to do”…I will remember that till my dying day.
.
All to give tax cuts to get re-elected.
It should also be pointed out that it was NOT in the interest of some of Thatchers friends for the UK to have that gas (Nuclear industry and others).
This folks is how things work...
What a mess our railway/transport system is in, it was all planned to be like this...
Back in the 1920s the railway system off the UK was ready and able to take on the mantel of distribution of goods/passengers to all parts of the UK and it would have worked very well, all the plans were in place. But the road haulage industry that was just beginning to come into being (it was a very small concern then), didn`t think this was a good idea,the motor manufacturers didn`t think it was a good idea, the oil companies didn`t think it was a good idea. So to cut a long story short and a lot of very thick brown paper envelopes later, MPs didn`t think it was a good idea. All that went on is now documented history, a documentary/play about what went on was showing on the TV about twenty or so years ago. We have suffered to this day and how. Everytime you see a lorry on the motorway think of this post.
The sheer criminality of successive UK governments has brought about the state of our transport system. We are about to find out the full extent of the true cost when the oil price goes through the roof. We are TOTALLY UNPREPARED.
gee -- Very sad indeed. Several years ago I was sitting offshore Africa and could see dozens of flares off the coast of Nigeria. And there was also the 25 millon cu ft of NG being flared from the field I was working. Very sad indeed especially when you think about the future.
Gee -
slightly revisionist take on history, always good to give Maggie a bash eh what?!
Never the less, that was 25 years ago. Since then Major, Blair and Brown have all come and gone.
So... how exactly does donning the 'hindsight specs' actually solve our present crisis?
:)
Rune,
Thanks for your efforts on this article and the great graphs.
There are both pro and con comments about shale gas and its potential relevance for Europe in the thread above. What are your thoughts on this subject?
CL
naturalgasforeurope.com
Thank you for generously sharing your analysis. I wouldn't contradict anything you have said, but would comment that supply demand dynamics in gas are always more complicated than they seem.
Demand can be incredibly price sensitive but that price sensitivity point is very hard to understand because big users are often exposed mainly to long term contracts based on oil prices and are quite often take or pay. Therefore industrial users will often sell gas into the market if the spot price of gas is higher than their long term indexed price by a margin that at least compensates for their loss of production.
Another factor that is underestimated is the ability of Russia to swing domestic fuel consumption for power between coal and gas. They have a huge capacity of boilers that can take either, and the decision to switch is taken at a political level and therefore very hard to predict. Simple market analysis won't do it. They are currently heavily in gas consuming mode, and Russia is exporting a lot of coal.
Yet another complexity of the supply demand balance is the age of gas fields and actual production capacity versus potential production. It works like this: imagine you have a brand new field that is expected to produce at maximum capacity for the next 20 years, if prices are low and you decide not to produce gas then you are giving up cash flow that you will not recover for 20 years (because the field was due to produce at full capacity anyway). Most companies have a weighted average cost of cash of at least a couple of % above interbank rates, so the decision not to produce on this field is almost unthinkable, you would have to be confident that gas prices would be at least triple the current rate in 20 years, which would be a big call. However if you have a highly depleted field with declining production every year and you decide that prices will be much higher next year than this year, then it costs you nothing to delay production. The Morecambe Bay facility off the coast of Cumbria has operated like that for years now as has Groningen (which also acts as storage).
Add to these the big unknowns like shale gas, and undoubtedly other Black Swans that will take us all by surprise in one direction or another, and the future of gas is as hard to predict today as it always has been.