| Storm Watch: Bonnie update, understanding wind fields | The Oil Drum | BP's Deepwater Oil Spill - Tropical Depression Bonnie (1a) - and Open Thread |
Oilwatch Monthly July 2010
Posted by Rembrandt on July 23, 2010 - 10:27am in The Oil Drum: Europe
The July 2010 edition of Oilwatch Monthly can be downloaded at this weblink (PDF, 1.24 MB, 33 pp).
The Oilwatch Monthly is a newsletter that is available free of charge with the latest data on oil supply, demand, oil stocks, spare capacity and exports.
Below the fold is an executive summary, subscription form to receive the Oilwatch Monthly by e-mail, and latest graphics. For much more detail and a country by country profile, download the .pdf.
Subscribe to receive Oilwatch Monthly by e-mail
Latest Developments:
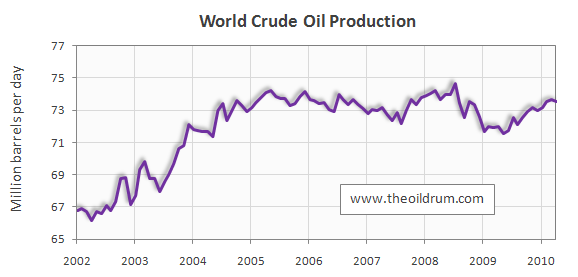
1) Conventional crude production - Latest figures from the Energy Information Administration (EIA) show that crude oil production including lease condensates decreased by 100,000 b/d from March to April 2010, resulting in total production of crude oil including lease condensates of 73.52 million b/d.
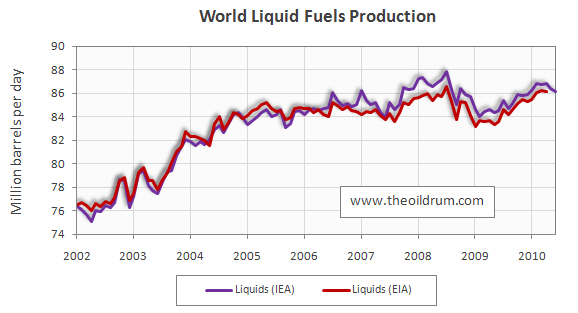
2) Total liquid fuels production - In June 2010 world production of all liquid fuels decreased by 250,000 b/d from May according to the latest fgures of the International Energy Agency (IEA), resulting in total world liquid fuels production of 86.15 million b/d. Liquids production for May 2010 was revised upwards in the IEA Oil Market Report of July from 86.31 to 86.4 million b/d. Average global liquid fuels production in 2009 was 84.94 versus 86.6 and 85.32 million b/d in 2008 and 2007.
3) World oil production capacity - Total oil production capacity in June 2010 decreased by 80,000 b/d from May 2010, from 90.0 to 89.94 million b/d. World production capacity is measured here as the sum of world liquids production excluding biofuels plus total OPEC spare capacity excluding Iraq, Venezuela and Nigeria.
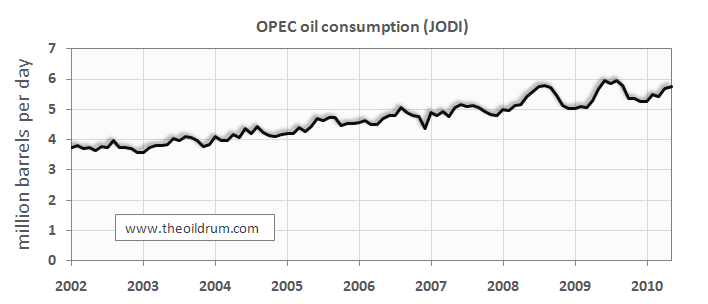
4) OPEC Production - Total liquid fuels production in OPEC countries decreased by 60,000 b/d from May to June 2010 to a level of 33.97 million b/d. Liquids production for May 2010 was revised downwards in the IEA Oil Market Report of July from 34.23 to 34.03 million b/d. Average liquid fuels production in 2009 was 33.7 million b/d, versus 36.09 and 35.02 million b/d in 2008 and 2007 respectively. All time high production of OPEC liquid fuels stands at 36.4 million b/d reached in July 2008.
Total crude oil production excluding lease condensates of the OPEC cartel decreased by 60,000 b/d to a level of 28.89 million b/d, from May to June 2010, according to the latest available estimate of the IEA. Average crude oil production in 2009 was 28.7 million b/d, versus 31.43 and 30.37 million b/d in 2008 and 2007 respectively.
OPEC natural gas liquids remained stable from May to June 2010 at a level of 5.08 million b/d. Average OPEC natural gas liquids production in 2009 was 4.67 million b/d, versus 4.47 and 4.55 million b/d in 2008 and 2007 respectively.
5) Non-OPEC Production - Total liquid fuels production excluding biofuels in Non-OPEC countries decreased by 190,000 b/d from May to June 2010, resulting in a production level of 50.38 million b/d according to the International Energy Agency. Liquids production for May2010 was revised upwards in the IEA Oil Market Report of July from 50.05 to 50.57 million b/d. Average liquid fuels production in 2009 was 49.67 million b/d, versus 49.32 and 49.34 million b/d in 2008 and 2007 respectively.
Total Non-OPEC crude oil production including lease condensates decreased by 73,000 b/d to a level of 42.48 million b/d, from March to April 2010, according to the latest available estimate of the EIA. Crude oil production for March 2010 was revised upwards in the EIA International Petroleum Monthly of July from 42.34 to 42.55 million b/d. Average crude oil production in 2009 was 41.61 million b/d, versus 41.32 and 41.80 million b/d in 2008 and 2007 respectively.
Non-OPEC natural gas liquids production decreased by 52,000 b/d from March to April 2010 to a level of 3.38 million b/d. Average Non-OPEC natural gas liquids production in 2009 was 3.34 million b/d, versus 3.65 and 3.79 million b/d in 2008 and 2007 respectively.
6) OPEC spare capacity - According to the International Energy Agency total effective spare capacity (excluding Iraq, Venezuela and Nigeria) increased from May to June 2010 by 17,000 b/d to a level of 5.59 million b/d. Of total effective spare capacity an additional 3.85 million b/d is estimated to be producible by Saudi Arabia within 90 days, the United Arab Emirates 0.43 million b/d, Angola 0.22 million b/d, Iran 0.25 million b/d, Libya 0.19 million b/d, Qatar 0.18 million b/d, and the other remaining countries 0.47 million b/d.
Total OPEC spare production capacity in June 2010 dereased by 5,000 b/d to a level of 5.2 million b/d from 5.25 million b/d in May according to the Energy Information Administration. Of total effective spare capacity an additional 3.95 million b/d is estimated to be producible by Saudi Arabia, the United Arab Emirates 0.30 million b/d, Angola 0.15 million b/d, Iran 0.10 million b/d, Libya 0.15 million b/d, Qatar 0.25 million b/d, and the other remaining countries 0.15 million b/d.
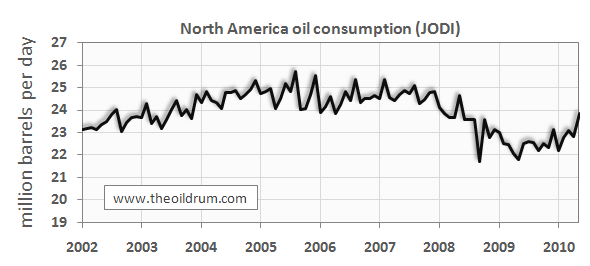
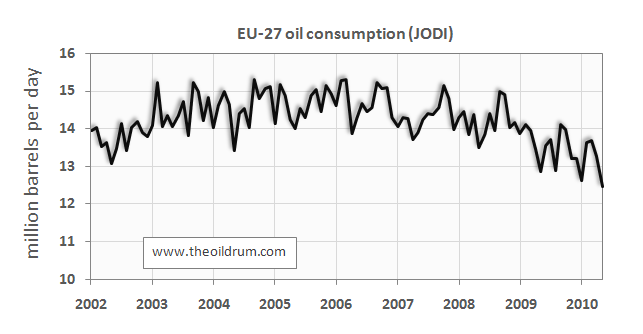
7) OECD liquids demand - Oil consumption in OECD countries decreased by 500,000 b/d from April to May 2010, resulting in a consumption level of 43.43 million b/d. Average OECD oil consumption in 2009 was 43.92 million b/d, versus 46.10 and 47.68 million b/d in 2008 and 2007 respectively.
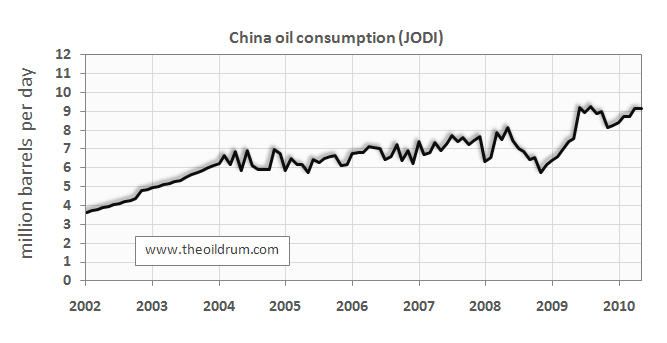
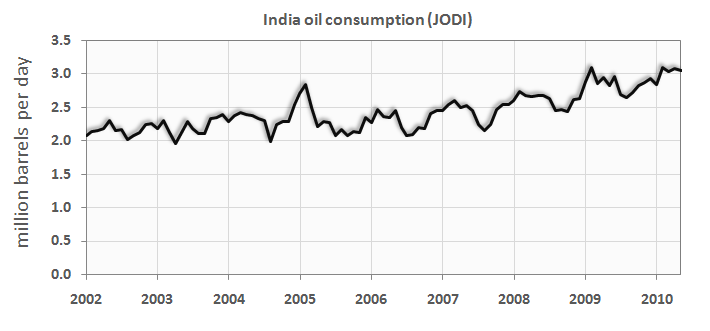
8) Chinese liquids demand - Oil consumption in China decreased by 24,000 b/d from April to May 2010, resulting in a consumption level of 9.12 million b/d according to JODI statistics. Average oil consumption in China in 2009 was 8.05 million b/d, versus 6.92 and 7.29 million b/d in 2008 and 2007 respectively.
9) OECD oil stocks - Industrial inventories of crude oil in the OECD in May 2010 increased to 1041 million from 1036 million barrels in April according to the latest IEA statistics. Current OECD crude oil stocks are 71 million barrels higher than the five year average of 970 million barrels. In the June Oil Market Report of the IEA a total stock level of 1023 million barrels was tabulated for April which has been revised upward to 1036 million barrels in the July edition.
Industrial product stocks in the OECD in May 2010 increased to 1417 million from 1399 million barrels in April according to the latest IEA Statistics. Current OECD product stocks are 8 million barrels higher than the five year average of 1409 million barrels. In the June Oil Market Report of the IEA a total stock level of 1424 million barrels was tabulated for April which has been revised downward to 1399 million barrels in the July edition.
Personnel
Editors
Contributors
Peak Oil Primers
Archives
- November 2010 (3)
- October 2010 (6)
- September 2010 (4)
- August 2010 (7)
- July 2010 (6)
- June 2010 (7)
- May 2010 (2)
- April 2010 (8)
- March 2010 (4)
- February 2010 (6)
- January 2010 (3)
- December 2009 (5)
- November 2009 (8)
- October 2009 (12)
- September 2009 (6)
- August 2009 (5)
- July 2009 (11)
- June 2009 (8)
- May 2009 (16)
- April 2009 (10)
- March 2009 (7)
- February 2009 (10)
- January 2009 (15)
- December 2008 (9)
- November 2008 (9)
- October 2008 (9)
- September 2008 (13)
- August 2008 (10)
- July 2008 (14)
- June 2008 (23)
- May 2008 (16)
- April 2008 (12)
- March 2008 (16)
- February 2008 (9)
- January 2008 (13)
- December 2007 (13)
- November 2007 (16)
- October 2007 (22)
- September 2007 (8)
- August 2007 (9)
- July 2007 (16)
- June 2007 (8)
- May 2007 (7)
- April 2007 (7)
- March 2007 (10)
- February 2007 (10)
- January 2007 (12)
- December 2006 (9)
- November 2006 (15)
- October 2006 (4)
- September 2006 (5)
- August 2006 (5)
- July 2006 (9)
- June 2006 (5)
- May 2006 (10)
- April 2006 (9)
- March 2006 (13)
Vital Trivia
License

This work is licensed under a Creative Commons Attribution-Share Alike 3.0 United States License.
Thanks, Rembrandt!
I think what is striking to me is the correlation between economic activity and oil consumption. As economic activity goes down, oil consumption decreases; as economic activity rises, oil consumption rises.
There are people saying that oil consumption can be divorced from economic activity (I think mostly be shipping oil intensive activities overseas), but it is hard to see that happening.
Damn it!! I was looking forward to another record peak.
Maybe next time....
I'd love to see a graph of total world liquids over the whole available data set. I think it would be interesting to compare the plateau size to the overall curve.
I have some odd numbers:
China's growth rate in consumption of oil is 11.6% average over the past 8 years.
OPEC's is 5.6% over 8 years.
I had calculated about 7% for both based on previous data
so - do we know how much of China growth comers from strategic storage? They seem to add new storage capacity on a regular basis
11% growth is astounding. If it continues, it will put them up at 20+ MBD in 8 years
The growth in China's oil consumption has taken everybody by surprise, particularly the International Energy Agency, which had predicted a growth rate of about 1/4 as much as actually happened.
Yes, at the rate China is going, it will be consuming more oil than the US in another decade. The Chinese are aware of the developing problems and are buying up as much of the world's oil reserves as they can. They are also stockpiling uranium for the new reactors they are going to build, and developing coal facilities in Australia.
However, China is now the world's largest car market. General Motors is now selling more cars in China than the United States. It bodes ill for other people who depend on cheap oil.
How many more of these monthly reports do we need before we finally declare July 2008 to be the date of the all time peak in global oil production???
Probably around 60 to 120.
-best,
Wolf
I think Matt Mushalik gave us part of the answer a few days ago. That very high prices did not result in increased production is an indication that we're either there or near there.
Thanks for your answers. I think I will wait for the next oil price spike to go above $150 and then check the global oil production figures. If they are lower than for July 2008 then the peak is behind us...
Agreed. Another price spike and the same level of production as July '08 (or less production), and the 'liquid fuels' peak debate can finally be put down.
OTOH, when one includes unconventional oil, the tank is still half full...
Well, when you include unconventionals, its more like the tank is 4/5's full, but that isn't a popular topic.
Too bad unconventional doesn't flow as fast, there's quite a bit of unconventional oil in the U.S. Has that reversed the peaking of U.S. oil extraction? Of course it hasn't and never will.
Drag racers say, "going fast costs money...how fast do you want to go?" Of course unconventionals can flow fast...how much rate can you afford?
As far as US peaking, yup, oil did peak. So did natural gas. And nearly 40 years later...unconventionals brought on another natural gas peak. So maybe we'll call the US example at 50/50 right now?
I don't doubt that the unconventionals could flow fast AND furious if we are willing to pay the cost. I suppose the $64,000 question then becomes; how fast CAN an industrial economy afford?
Absolutely. Such a concept, of "dialing up as much as you need" also fits in well with a world concerned about its CO2 emissions. Making a conscious decision to put more oil into the system balances off quite nicely against the normal discovery process for conventional oil.
No more are required. Peak happened, I don't understand why people just won't accept the obvious and move on to other important topics.
I think this is more an academic hobby to see how close initial estimates were for the period of actual peak, be it in all liquids or just crude. TOD really now is more a community for reacting to what was inevitably going to happen, and more recently, BP's little boo boo in the GOM. It pays to have a centre of excellence for the energy sector here where people can find out more regarding such topics.
mybe I'm misreading it but the bump in the graph around 2008 seems to match the OPEC increase , which then dropped off . And the rise this year seems to be comming from the non OPEC sources.
Can we acertain that the OPEC spike is their shut in capacity ?
what mega projects contributed to the the non OPEC rise and what is their projected rate for the next couple of years ?
I think that if I'm right that OPEC has that minimal spare capacity then the platue will end around 2012-13 ?
I'd much appreciate a more learn'ed opinion of the Oil Drum contributors on this happening.
thanks
Forbin
PS: going to be a interesting for us in the UK as our oil and gas continue their steep decline, with the Olympics as well........
PPS: seems 73MB/d of oil and 84MB/d of oil+liquids ( line drawn across from 2004 to 2010 on both graphs ) is the most the world will have on this platue
If this were the case it would mean that their actual unused production capacity were less than their claimed unused production capacity by a considerable margin.
July '08 to Feb '10 I've got 1354.77 kb/d shut-in from KSA. Forget what the rest of putative OPEC capacity is supposed to be now. Rest of spare capacity numbers from EIAIEIA is from megaprojectz like Khurais. Add grain of NaCl to your assay there. Check JODI to get most precise numbers on current consumption levels.
Top 10 YOY gains for May 2010:
Top 10 YOY contractors for May 2010:
Gains outweigh losses by 1375.18 kb/d. Average that out and yes, we will burn through bona fide shut in capacity in a couple of years, barring a double dip.
Oil keeps moving from OECD countries to the rest.
One of the curves that I find remakable in the PDF is the consumption trend in Saudi Arabia. It not only is that the consumption has increased around 40% in 5 years, but also the seasonality of the consumption has increased.
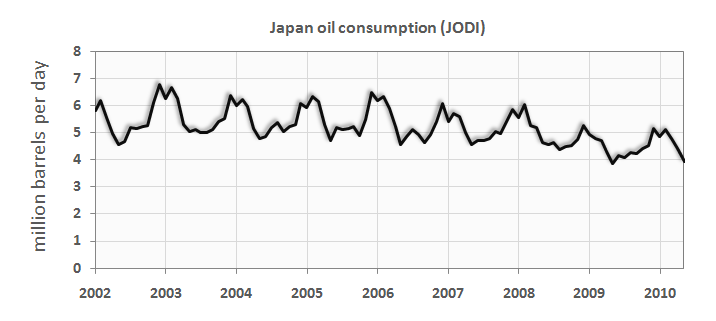
Japan has a strong seasonal pattern in the oil consumption which is smoothing down, I assume that it it may be linked with the use of oil for electrical production and that Japan may be moving to more efficient ways of producing electricity. However, the seasonal peak in Saudi Arabia is increasing tremendously. May be the use for electricity production for air conditioning?
If it is.... What about a few combined cycle power plants running on natural gas instead?
This curve represents the Saudi oil production and consumption from 1995 to 2009, I've used the data from BP Statistical Review of World Energy. It shows that consumption is incresing year to year while production does not, with the unavoidable consequence of a decrease of exports.
Saudi Arabia does not seem worried about this, while the price of oil keeps rising in a long-term perspective. In fact, the Saudi King Abdulla has ordered to halt exploration according to the July 4th TOD Drumbeat. What is in fact a strange and striking new.
Saudi Arabia has wanted to switch to natural gas and even brought in outside developers to help. But apparently they have not had much success discovering and developing natural gas only fields.
Uh, yeah, it's rather hottish in KSA. In fact:
NOAA: June 2010 the globe's 4th consecutive warmest month on record
August, 1956, according to wikipedia: http://en.wikipedia.org/wiki/Abqaiq
The graph of Japan`s oil use is most interesting. It went from about 6 to about 4 million bbl/day, on avg. I live in the greater Tokyo area. I can report that, as the years pass (I`ve been here about 4 years), it is getting easier to cross roads. Lots of shops and restaurants being shuttered too. It is easy to see the oil draining out of the system, although superficially things look "normal".
Of course I am perfectly content about the situation. I don`t like cars so the fewer there are the happier I am.
Thank you for this data!
Yeah, try telling that to all those who used to work in those places.
Oh, people adjust. Sure everyone has to lower their expectations but I think there was a downside to the booming economy too, a feeling of stress, worry that it wouldn`t last or that one would lose out compared to others. I think a tanking economy is easier to handle in some ways. For one thing, people take pressure off themselves by not buying things or having many children. Live lightly, freely...I certainly feel a sense of relief that no more huge condos will be built, no more big roads...
People really do like nature and want to keep it.
Being unemployed is a sense of relief? Let me know when you go without a paycheck for a while. Tell me then how much stress and worry go away.
Here's a chart of Japan's consumption by individual petroleum product, 1984-2008, plus the 2009 total (only value available from EIA at the moment):
Here is the same data, but from BP - their series goes back to 1965, but only breaks down to four streams:
Note how the only stream they really cut back on 30 years ago was (residual) fuel oil, used for power generation. Gains in fuel efficiency of automobiles only obtained for about 8 years and were quite marginal compared to phasing out burning oil for electricity.
Japan has about the higest percentage of old aged population, plus they have been in a depression since 1990. The two are probably related.
Nobody seems to have mentioned that non-OPEC in March was just a few thousand bpd away from their 2005 record.
Golly gee, I thought that wasn't supposed to happen. /sarcasm
Do y'all need to be reminded how often it had been predicted here that non-OPEC was past peak? When non-OPEC reaches a new record (could be there already, for all we know), I expect a big fat thread here on TOD telling the world, "We were dead wrong." :P
Have you ever seen Colin Campbell say that about his 1989-1990 peak oil prediction? Do you honestly think that if the grandfather of the modern peaker movement can play kick the can for a few decades, that random internet blogs can't play the same game?
Oh hey, so we nearly hit a peak from five years ago. Clearly we're wrong.
No, wait, emphasis on "nearly", let me know when they breeze past that there limit. Troll much?
I don't know who the "we" is? But referring to Peaker predictions, in general, the method appears to be perfectly rational. Make a prediction, if the prediction doesn't succeed, kick the can down the road a year or two. Do it all over again. Continue until true. Guaranteed to work.
The peak is ‘probably’, somewhere in the band of 2004 to 2016. So oil peaked 6 years ago, or will peak 6 years from now. In 2017 we’ll have all the data and graphs we need to pinpoint it accurately down to the millisecond. That information will no doubt come in very useful.
In the mean time we should start to think like our parents and grandparents. How would they live? What would they do? And if you are lucky enough to still have your grandparents around, or anyone that can recall how things were 80 years ago. Ask them.
Grandparents are dead, and I find it unlikely that the elderly I do know can tell me much about the age of electric transport which was bumped off at birth by cheap gasoline. Certainly their knowledge of that terminated path of human behavior wouldn't resemble what is has become in the form of a modern Volt, Leaf or Honda plugin.
Unless you were implying that slowly declining crude production will bring about 1920's type standards of living rather than a change in human transport systems? Certainly there are many other scenario's which make more sense than that one.
.
Reserve - you are wasting the bandwidth of TOD by endlessly repeating a logically empty argument that because one or more prior 'peak oil' predictions was wrong, then by your logic, all future PO predictions are likely wrong.
Ok, we understood your point, or actually lack thereof, the first 100 times you posted it.
There is sufficient doubt as to the accuracy of the monthly figures, now or in the past. Whether some measure of oil output is marginally exceeded or not, one would have to just completely ignore the basic trend to realize even the widely expanded definition of 'oil' is struggling to reach prior peaks - even though demand in the US, China, and India has been surprisingly very strong this year, and there is incentive for producers to supply oil.
Obviously, you don't understand. I never said all predictions of peak are wrong, and will happily accept whatever the most current one is. So obviously, 100X wasn't enough for you, maybe others have missed the actual position I have taken as well?
As far as the uncertainty in monthly figures being the deciding factor in determining the peak date, I've provided references from learned peakers who said it was 2005, and if I recall correctly even TOD weighed in on a 2008 peak date? So its in the past in either case....a position which I a quite happy to accept...for the 101st time.....
I thought the editors of TOD were quite firm in the view that "Peak" could only be known in retrospect.
Read the TOD Mission Statement
Obviously there is a lot of conjecture from TOD bloggers about the undulating plateau since 2005 and the peak in this plateau in 2008.
In answering the question posted above by ecowolf,
graywulffe answered
The recent rebound is just producers bringing capacity back online. Overall trend is still down.
Peak in 2005 or 2008 is certainly in retrospect. And TOD seems to have made up its mind. So why does it matter any more, obviously its a done deal.
http://www.theoildrum.com/node/5177
If it doesn't matter anymore, then what is your point in bringing up again some faulty predictions of the past - over and over again?
Although KLR's and other graphs are very valuable, we may be getting reoprts of shipments, and not actual output from oil producers, from some countries. So there is some doubt that the 2008 was a peak at all, and it could have been as early as 2005.
Einstein was also wrong about some things, so based upon your 'logic' applied to Campbell about how he was 'wrong', we should never have listened to Einstein after his initial theories failed to fully pan out.
So yes, I don't understand why you continue to bash Colin Campbell.
I'm not concerned with the accuracy of any particular prediction, but I bring it up when people act as though peak oil is something still off in the future. How can it be off in the future if...its already happened?
So there is some doubt that the 2008 was a peak at all, and it could have been as early as 2005.
Then perhaps TOD shouldn't have decided to call the game early?
Einstein was also wrong about some things, so based upon your 'logic' applied to Campbell about how he was 'wrong', we should never have listened to Einstein after his initial theories failed to fully pan out.
People are wrong all the time. Want to bet Einstein, once he knew he was wrong, didn't keep proclaiming his rightness with the same scheme over and over knowing that if he just ran out the clock, he would be right by default, sooner or later?
Yep.
Ten or twenty years after peak, nobody will care if it peaked in 2008, 2010, or 2015.
Five or ten years doesn't matter compared to the number of decades the average person lives.
It just won't matter.
What matters to me, is that Peak cannot, and will not be avoided and I'm going to live to see this once in a lifetime transition.
I'm only 43.
World biofuel production has reached 1.8 mb/d.
Boring question - what is the assumed energy content per barrel of this? Is the same as 'ordinary' oil or is lower?
Is there a handy table of assumed energy densities somewhere?
If I remember rightly (from Downeys 'Oil 101') then it is just different source blends into the final mix at refining and the energy content will be no different.
If you are asking about end-to-end efficiency (well-to-wheels) then this is far too complex a question for me. Someone else here I am sure can talk about total EROI perhaps, but I imagine most of these are theoretical models and are not empirical results.
Single month highs and lows are not dispositive to the issue of final peak. It would not even matter if a single month for Non-OPEC or Global production made an all time new high. Singular, monthly lows and highs can be created by all sorts of unsustainable factors from weather to the restoration of previously shut-in production. What matters instead are the annual averages. To wit:
1. 2004 remains the peak of Non-OPEC production at 42.068 mbpd. Here in 2010, it initially appeared that Non-OPEC might have a shot at exceeding that average on an annual basis. But the data coming in May and June will put that to rest.
2. 2005 remains the peak of Global production at 72.719 mbpd. We are unlikely to even challenge that average now, with May and June production once again falling.
Global oil production no longer responds to prices. Rather, it responds to a longer cycle of price, and the emerging geological constraint which is now a factor that increases with each year. The last easy response to price from global production was perhaps in the 2000-2004 period. For six years, any correlation has been coincident at best. And, we know why.
So we are nearly six years beyond the peak-year of Non-OPEC production, and nearly five years beyond the peak of global production. Only the personality of the individual could stand in the way now, of such data. :-)
G
Global Crude Oil Supply Update
Agreed Gregor on annual averages. Since those average highs, there has been the real estate bubble bursting mortgage meltdown with the 147 a barrel oil spike and stock market crash. What we now see is a consistently high price for oil coupled with minimal economic growth. What appears most glaring, is the inability for govt. at all levels to keep up with day to day costs, which puts the repair and replacement of infrastructure farther out into the future. A future that will only be exacerbated by dwindling oil supply.
I don't see huge increases in the price of oil, but rather a steady high price at the pressure point of causing recession. That is until the supply crunch hits.
What I'd like to know: How does this translate into the future course of GDP?
To put it another way: Will the weak recovery halt some time in the next 12 months due to oil supply constraints? Can the economy manage to grow for a couple of years without an increase in oil consumption? Or will declining oil availability (rather than flat availability) cause a further economic decline?
More succinctly: How soon does it get much worse?
When or where?
Supposing China doesn't crash before their oil use expands to take up the spare capacity everyone suspects, maybe one-two million barrels per day then something will give due to high prices.
The most leveraged people everywhere will lose out, live on the streets, sell their cars, whatever and those unleveraged will then pick up the slack after the price falls back down. This means of course that Asia will take on more consumption after the next downturn(if they are still as miserly ass previously, current generation of single child Chinese I don't know) if USA and Europe have not deleveraged in the next couple of years , which seems highly unlikely.
It could be however that China is a lot more leveraged than anybody wants to believe. Their housing market seems to be crashing recently. Maybe they are just a couple years behind the curve on this one. We call this "progress". Maybe they can beat "The West" to the punch next time. In that case maybe ELM II is overrated. Still a billion drivers just going a few miles in some clappity cheap cars could sure use a lot of oil on a very small portion of their meager factory/farming income. The West has a lot of slack to give up- crusing in big cars for fun. Maybe then "Worse" is only for "The West" and in "The East" it can only get better. At $300/barrel we still have cheap prices in Europe because the biggest part of gas prices is taxes, for example.
http://www.eia.doe.gov/emeu/international/gas1.html
USA would be dead in the water at 300/barrel.
Europe will be quite damaged by higher oil prices because the taxes just move money around within countries (i.e. within the same economy) whereas the price of oil moves money across borders.
Also, Europe and the United States uses oil for other purposes aside from powering cars.
China: Yes, we can't guess when that country will have a financial crisis. Maybe they can keep their economy growing rapidly for another 10 years. But then again maybe the bad debts and massive misallocations will catch up with the central planners and the economy will go into a severe correction.
There are so many unknowns.