| Drumbeat: March 23, 2010 | The Oil Drum | Check Out Art Berman on This Week in Energy, Wednesday 17:00 UTC |
| UK new car sales and the recession | The Oil Drum: Europe | How Close will the U.K. Come to Running Out of Natural Gas in Storage this Spring? |
Oilwatch Monthly March 2010
Posted by Rembrandt on March 23, 2010 - 10:20am in The Oil Drum: Europe
The March 2010 edition of Oilwatch Monthly can be downloaded at this weblink (PDF, 1.24 MB, 33 pp).
The Oilwatch Monthly is a newsletter that is available free of charge with the latest data on oil supply, demand, oil stocks, spare capacity and exports.
Below the fold is an executive summary, subscription form to receive the Oilwatch Monthly by e-mail, and latest graphics. For much more detail and a country by country profile, download the .pdf.
Subscribe to receive Oilwatch Monthly by e-mail
Latest Developments:
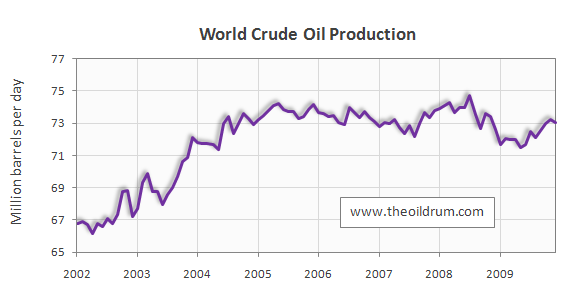
1) Conventional crude production - Latest figures from the Energy Information Administration (EIA) show that crude oil production including lease condensates decreased by 184,000 b/d from November to December 2009, resulting in total production of crude oil including lease condensates of 73.04 million b/d.
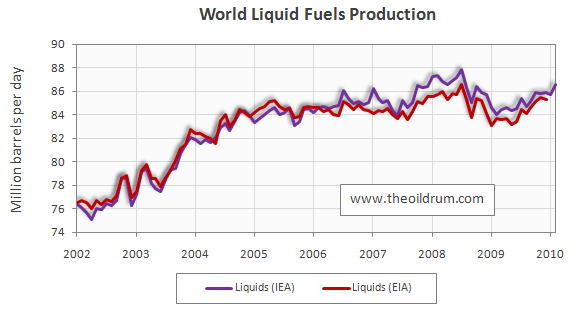
2) Total liquid fuels production - In February 2010, world production of all liquid fuels increased by 880,000 barrels per day from January according to the latest figures of the International Energy Agency (IEA), resulting in total world liquid fuels production of 86.59 million b/d. Liquids production for January 2009 was revised upwards in the IEA Oil Market Report of March from 85.4 to 85.7 million b/d. Average global liquid fuels production in 2009 was 84.94 versus 86.6 and 85.32 million b/d in 2008 and 2007.
3) World oil production ccapacity - Total oil production capacity in February 2010 increased by 785,000 b/d from January 2010, from 89.36 to 90.15 million b/d. World production capacity is measured here as the sum of world liquids production excluding biofuels plus total OPEC spare capacity excluding Iraq, Venezuela and Nigeria.
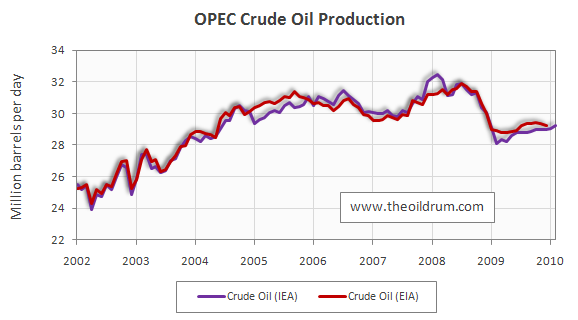
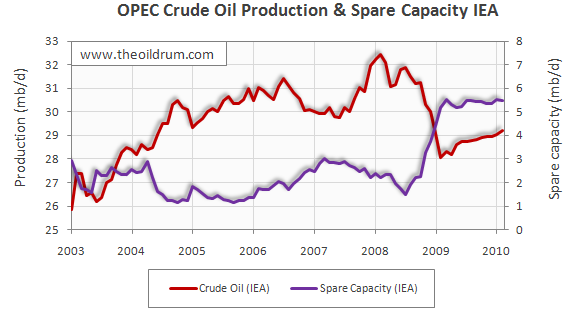
4) OPEC Production - Total liquid fuels production in OPEC countries increased by 200,000 b/d from January to February 2010 to a level of 34.37 million b/d. Liquids production for January 2010 was revised downwards in the IEA Oil Market Report of February from 34.2 to 34.17 million b/d. Average liquid fuels production in 2009 was 33.7 million b/d, versus 36.09 and 35.02 million b/d in 2008 and 2007 respectively. All time high production of OPEC liquid fuels stands at 36.4 million b/d reached in July 2008. Total crude oil production excluding lease condensates of the OPEC cartel increased by 200,000 b/d to a level of 29.24 million b/d, from January to February 2010, according to the latest available estimate of the IEA. Average crude oil production in 2009 was 28.7 million b/d, versus 31.43 and 30.37 million b/d in 2008 and 2007 respectively. OPEC natural gas liquids remained stable from January to February 2010 at a level of 5.13 million b/d. Average OPEC natural gas liquids production in 2009 was 4.67 million b/d, versus 4.47 and 4.55 million b/d in 2008 and 2007 respectively.
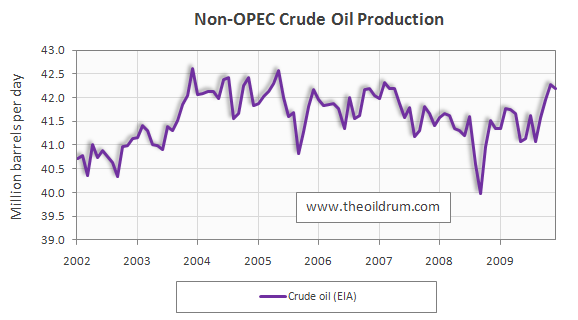
5) Non-OPEC Production - Total liquid fuels production excluding biofuels in Non-OPEC countries increased by 665,000 b/d from January to February 2010, resulting in a production level of 50.32 million b/d according to the International Energy Agency. Liquids production for January 2010 was revised downwards in the IEA Oil Market Report of March from 49.71 to 49.65 million b/d. Average liquid fuels production in 2009 was 49.67 million b/d, versus 49.32 and 49.34 million b/d in 2008 and 2007 respectively. Total Non-OPEC crude oil production excluding lease condensates decreased by 79,000 b/d to a level of 42.19 million b/d, from November to December 2009, according to the latest available estimate of the EIA. Crude oil production for November 2009 was revised upwards in the EIA International Petroleum Monthly of March from 41.93 to 42.27 million b/d. Average crude oil production in 2009 was 41.62 million b/d, versus 41.32 and 41.80 million b/d in 2008 and 2007 respectively. Non-OPEC natural gas liquids production decreased by 46,000 from November to December 2009 to a level of 3.37 million b/d. Average Non-OPEC natural gas liquids production in 2009 was 3.34 million b/d, versus 3.65 and 3.79 million b/d in 2008 and 2007 respectively.
6) OPEC spare capacity - According to the International Energy Agency total effective spare capacity (excluding Iraq, Venezuela and Nigeria) decreased from January to February 2010 by 8,000 b/d to a level of 5.46 million b/d. Of total effective spare capacity, an additional 3.84 million b/d is estimated to be producible by Saudi Arabia within 90 days, the United Arab Emirates 0.42 million b/d, Angola 0.15 million b/d, Iran 0.26 million b/d, Libya 0.17 million b/d, Qatar 0.08 million b/d, and the other remaining countries 0.54 million b/d.
Total OPEC spare production capacity in February 2010 increased by 3,000 b/d to a level of 5.08 million b/d from 5.05 million b/d in January according to the Energy Information Administration. Of total effective spare capacity an additional 3.8 million b/d is estimated to be producible by Saudi Arabia, the United Arab Emirates 0.30 million b/d, Angola 0.19 million b/d, Iran 0.10 million b/d, Libya 0.15 million b/d, Qatar 0.25 million b/d, and the other remaining countries 0.14 million b/d.
7) OECD Oil Consumption - Oil consumption in OECD countries increased by 1.67 million b/d from November to December 2009, resulting in a consumption level of 45.27 million b/d. Average OECD oil consumption in 2009 was 43.92 million b/d, versus 46.10 and 47.68 million b/d in 2008 and 2007 respectively.
8) Chinese liquids demand - Oil consumption in China increased by 125,000 b/d from November to December 2009, resulting in a consumption level of 8.27 million b/d according to JODI statistics. Average oil consumption in China in 2009 was 8.05 million b/d, versus 6.92 and 7.29 million b/d in 2008 and 2007 respectively.
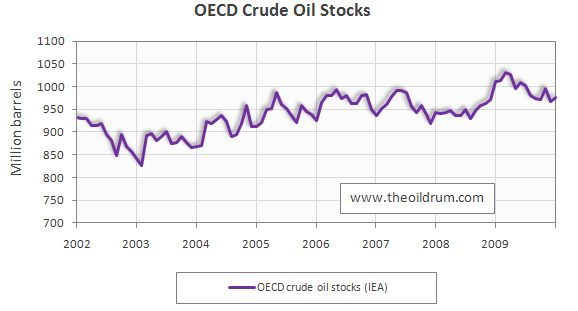
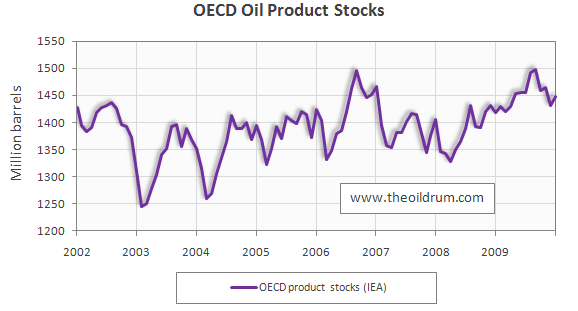
9) OECD oil stocks - Industrial inventories of crude oil in the OECD in January 2010 decreased to 979 million from 994 million barrels in November according to the latest IEA statistics. Current OECD crude oil stocks are 13 million barrels higher than the five year average of 964 million barrels. Industrial product stocks in the OECD in January 2010 increased to 1447 million from 1431 million barrels in December according to the latest IEA Statistics. Current OECD product stocks are 42 million barrels higher than the five year average of 1447 million barrels.
Personnel
Editors
Contributors
Peak Oil Primers
Archives
- November 2010 (3)
- October 2010 (6)
- September 2010 (4)
- August 2010 (7)
- July 2010 (6)
- June 2010 (7)
- May 2010 (2)
- April 2010 (8)
- March 2010 (4)
- February 2010 (6)
- January 2010 (3)
- December 2009 (5)
- November 2009 (8)
- October 2009 (12)
- September 2009 (6)
- August 2009 (5)
- July 2009 (11)
- June 2009 (8)
- May 2009 (16)
- April 2009 (10)
- March 2009 (7)
- February 2009 (10)
- January 2009 (15)
- December 2008 (9)
- November 2008 (9)
- October 2008 (9)
- September 2008 (13)
- August 2008 (10)
- July 2008 (14)
- June 2008 (23)
- May 2008 (16)
- April 2008 (12)
- March 2008 (16)
- February 2008 (9)
- January 2008 (13)
- December 2007 (13)
- November 2007 (16)
- October 2007 (22)
- September 2007 (8)
- August 2007 (9)
- July 2007 (16)
- June 2007 (8)
- May 2007 (7)
- April 2007 (7)
- March 2007 (10)
- February 2007 (10)
- January 2007 (12)
- December 2006 (9)
- November 2006 (15)
- October 2006 (4)
- September 2006 (5)
- August 2006 (5)
- July 2006 (9)
- June 2006 (5)
- May 2006 (10)
- April 2006 (9)
- March 2006 (13)
Vital Trivia
License

This work is licensed under a Creative Commons Attribution-Share Alike 3.0 United States License.
If I'm collating all this properly the supposed 5 - 6mbd of extra "oil" capacity is actually only about 2mbd, maybe 3mbd, of crude, right?
Given we lose more than that a year in declines, that's a pretty tight number, if so.
Cheers
Actually, condensates and NGL are excluded from OPEC production quotas, so if you've got them, you produce at maximum output. The spare capacity is conventional crude, though you can still take issue with the estimated numbers - it's highly doubtful that Nigeria or Venezuela could access the spare capacity they are listed as having, and you would also wonder whether the Saudis really have 3.7 mb/d that could be sustained. Nevertheless, 4 mb/d across OPEC is porbably a decent bottom line estimate.
I think it's in the 2 to 3mbd area. Mid 2008 was the peak for supply and we are about 2mbd short of that. With demand growing by 1mbd to 1.5 mbd per year we have 2 years to a shock unless Iraq can get pumping real fast.
Associated gas is subject to OPEC quota, non-associated isn't. It's only half lifted from the Texas playbook. Deffeyes related what an acquaintance said about NGLs and prorationing back in the days when Texas was under the heel of the RRC; NGLs weren't under quota at all, and hence were "not a cash cow - they were a cash river."
Leanan's top link for today is on topic here: Energy in Saudi Arabia: A Kingdom Running on Empty? - Arabic Knowledge@Wharton
I'll say one thing for OPEC. They sure are sticking to their production output in spite of 80 dollar prices. But, I suppose that makes sense, to sell less than total capacity to keep the price at or around $80 per barrel.
In fact OPEC isn't really sticking to the target - outside of the GCC states, compliance has been getting worse and production overall has been slowly increasing.
Thanks, Rembrandt!
Your Fig 4 above shows world liquids production on a bumpy plateau since 2005 even though oil prices increased significantly from 2005 to 2008.
Yesterday, Sir David King, UK former chief scientist, said that world oil reserves are exaggerated by one third.
http://www.telegraph.co.uk/finance/newsbysector/energy/oilandgas/7500669...
Consequently, I believe that world liquids production has already peaked in July 2008 and will decline slowly as shown by my forecast below. There is a good chance that oil prices will exceed $US100 around the middle of this year as demand is forecast to be greater than supply starting in July. We'll find out if OPEC will increase production to meet this demand as non OPEC production is in a declining trend as shown by your Fig 1.
Do you mean liquids or conventional oil? Conventional oil for non-OPEC perhaps, but I think there is still room for growth in total liquids given the planned additions in NGLs and ethanol. And do you mean total world production or just non-OPEC?
I mean liquids peaked in July 2008. There is still room for growth from NGLs and bio-fuels. However, that growth will probably not be enough to compensate for the decline in world crude, condensate and oil sands production as shown below.
You can also see from the forecast that whether remaining URR is 0.83 trillion barrels (TB) or 1.08 TB, there will still be a decline.
Sir David King's recent estimate of world reserves is between 0.85 and 0.90 TB.
http://www.telegraph.co.uk/finance/newsbysector/energy/oilandgas/7500669...
This means that the forecast could be closer to the red line below rather than the green line.
The peak year was 2005. The production in 2009 was 72.26 mbd according to EIA. The production in 2010 should be about the same as 2009. 2011 production is estimated to be 70 mbd.
I've also placed the forecast from the IEA WEO 2009 on the chart.
http://www.worldenergyoutlook.org/
Their forecast to 2015 is somewhat believable. However, afterwards their forecast is not believable as it is demand derived and not supply based using realistic decline rates, recovery factors and reserve estimates.
Is it just me...???
I can't see your image.
Yeah, I have the same problem. However if you just click inside the empty space the image will open up as a separate page.
Ron P.
It's a pdf, which most web browsers can't display inline in a web page. If ace would save it as a .jpg file, it would work.
Here's ace's chart reformatted. Click image below for full size PDF version
Try GIF it may work better for images with sharpe edges.
Why did NON-OPEC production drop so much in 2007?
Demand crash due to the recession drove down prices which shut-in or slowed marginal production?
@Emanuel,
Are you referring to 2008 (in 2007 there was no downward spike)? The downward spikes in Non-OPEC production in 2005 and 2008 were due to US production declines because of hurricanes. The sliding decline in 2007 was due to a combination of large oil producing countries declining at a high rate (Mexico, UK, Norway) which in 2008 stabilized somewhat.
Rembrandt
Checking Pemex field data I see that Catarell only declined 26.87 kb/d from Nov to Jan. Pemex to Stabilize Output This Year, Calderon Says (Update1) - BusinessWeek
I thought this graphs from Oil Watch Monthly was good. It looks a lot like peak OECD oil imports!
Really? To me it looks like Freddy Kruger's hand.
Demand destruction, biofuels, minor efficiency gains. I was surprised to see that Texas onshore production has been basically flat for about 5 years, due to a lot of vertical infill drilling in the Permian; they are tapping pockets of oil and holding decline at bay. That plus plays like the Bakken mean US production is flat to slightly gaining; the gain for liquids is sharper, as is shown in Rembrand't chart.
Ethanol in the US has added another 107.31/163.08/136.99 kb/d "megaproject" in each of the last three years, too. These are just nameplate numbers obtained by converting RFS goals from gallons to barrels, without taking into account EROEI or losses in transport etc. Still, it's a given volume of fuel at racks that no longer needs to be filled by gasoline. Overall ethanol production goals for 2009 were at 724.07 kb/d and will continue to grow. EPA has ruled that sugar cane is an "advanced biofuel," meaning its GHG contributions are lower, meaning we can import the stuff and meet quotas, undoubtedly a sigh of relief for the ethanol biz, since by 2014 20.66% of 1183.95 kb/d needs to be met by these advanced biofuels. 9.64% will have to come from cellulosic
biofuel, it will be make-or-break for all that lignin.
US commuters maxed out MT in 2008, not sure if that's fallen back. 10s of millions of unemployed probably puts the brakes on a bit of motoring, although I notice VMT/gasoline consumption headed back up in the US already. All those hybrids contributed a sliver of efficiency gain, too. Plus a sharp downturn in non-transport uses of oil due to the recession. Add them all up and it's not surprising imports are down.
Too much analysis. The main driver was the economic downturn.
Just keep in mind that this chart is rather narrow in range (only 7 years) and scale (complete scale from bottom to top is only 5 million barrels per day, so any moves look pretty big...I am not saying the chart is incorrect, I am just saying folks should be observant of the scale in both axis.
RC
18/3/2010
Back to the 2004 future, but with double the oil prices
http://www.crudeoilpeak.com/?p=1271
How long are we going to stay on the plateau, before heading into terminal decline???
We should place bets on the timing of terminal decline.
Terminal decline? Are you expecting an attack on Ras Tamura?
;>)
Craig
I'm betting on after 2017, maybe after 2020. Plateau till then, maybe a little increase. Iraq, deep water Brazil + CTL and biofuels.
I agree leduck. Guesses are made every six months here on oil price range, so why not on when post peak oil decline begins? There seems to be some concensus on here that the plateau began in 05, so what is the math on when it should begin declining. Ace has a chart suggesting it will begin soon, but what are the educated guesses of the other people posting on TOD? Why just have one thing being predicted? There are no limits I'm aware of as to how many things can be predicted. This website is dedicated to oil and the idea of certain events occurring in the future, so why not offer up projections?
Mike Emmel certainly has more than an opinion...
:-)
"There seems to be some concensus on here that the plateau began in 05, so what is the math on when it should begin declining."
The math in my simple mind is when there is no possibility to increase production no matter how many holes are drilled. That is the big unknown. With demand rising, we'll soon know if supply can keep up. If OPEC's spare capacity is truly 3-5 mbd, then that could be some time -7 years or more- if demand only increases at the 1% or so year to year and others, OECD and Asia, can maintain current 50 +/- mbd.
"There are no limits I'm aware of as to how many things can be predicted."
That's the nice thing about the future. We can make educated guesses(or WAGs)and then make a new one tomorrow when new information becomes available. I'm right until I'm wrong.
Updating with new information is also the key to Bayesian estimation. More analysts should used probability-based models becase that is the only way you can even begin to apply Bayesian techniques.
Is there really anyone else besides me using this approach?
I have used it. It is the right approach. Classical is schizophrenic. No one comes tabula rasa to a forecasting exercise.
I think how long the financial system holds out will play a big part in how long production stays generally "up".
Once there is a major break in the financial system, it could affect a lot of things:
1. Companies' access to capital
2. Value of the dollar and other currencies
3. Willingness of sellers to sell oil to those without adequate credit ratings
I could imagine new drilling (even infill drilling) dropping off dramatically. The decline rate would then look a lot more like the natural decline rate without the two or four or six more Saudi Arabias of oil that people are talking about.
Gail -- You can stop imagining and see it coming today. The smart money in the oil patch (including the capex sources) sees a significant drill rate drop in the next few months. NG prices are again heading to the basement (below $3/mcf) just like they did last summer. Maybe even worse. The drilling companies are "cold stacking" (long term shut down) as fast as possible right now. NG futures have dropped 25% in the last month and that was happening while the NE was still getting hit with snow storms.
The credit availability with all the public companies will drop proportionately with NG prices. And just like with the refineries the bankers see a MOL for energy companies: there is a price point for NG that is too low to lend even $1 to a company. No way to be sure but I suspect for many of the companies (especially the shale gas players) that number is south of $3 - 3.50/mcf. That means no equity borrowing. And I suspect many companies will have just enough cash flow to pay debt and keep the lights on.
Granted oil prices are still great. But many companies have 2/3 or more of their reserve base in NG. And the vast majority of drilling opportunities in the US are NG. And we still have a lot of production coming from the older SG wells now that they are in a relatively low decline rate phase. A the Deep Water NG is still humming along nicely thru the Independence Hub. So from the consumer view things look pretty good. And will until the DW GOM NG fields drop like a rock. No guess on my part when that will come but it will come. Who knows: PNG may slap this country upside the head before PO does.
YOY Change in Employees in US oil+gas extraction 2000-2009, broken down by supervisory and production/non-supervisory:
"Supervisory" isn't actually provided by the BLS, I'm just subtracting non-Super/Prod from the total they do provide, perhaps this covers other subfields in the industry.
Surprising that overall there is a bit of an uptick, despite the crash in rigs; overall it's up 41.4k since 2003, even 2009 grew 1.6k. Ratio of supers to others for 2009 was 46.72% to 53.28%, hardly changed from 2000; it seems to have wobbled around these numbers all the way back to 1972.
Now, in "Petroleum" we're down 0.7k and 3.5k for '08 and '09. But 2004 was -4.7k all on its own, and 2000-2006 contracted a staggering 22.3k.
Industries at a Glance: Mining, Quarrying, and Oil and Gas Extraction: NAICS 21
Industries at a Glance: Petroleum and Coal Products Manufacturing: NAICS 324
Gas stations are under Retail trade. Some other time. Have to go "beneficiate." ;)
KLR -- I'm guessing they don't include consultants/contract hands in those stats? Can you tell if they also include service company hands? I would think so.
Looking back when I was hooked up with Devon I would guess a good 30%+ of the professional folks in the office were not employees.
Not sure about that, ROCK. It seems an even split between refiners and roughnecks; I'd think that Schlumbergers are in with the roughneck classification, being involved in "well operations." I went over the BLS tables pretty thoroughly and these were the only classifications that suggested the FF industry; maybe consultants are filed away in some white collar type straightjacket in there. I don't doubt they're in there somewhere, though, the biggest government in history loves to count those beans.
Peak Earl said
"There are no limits I'm aware of as to how many things can be predicted. This website is dedicated to oil and the idea of certain events occurring in the future, so why not offer up projections?"
True, there are no limits, but one assumes that there should be some attempt to retain credibility. An endless stream of false alarms is more damaging to the cause of gaining meaningful support for the concept of peak oil and resource depletion than all the slanders the cornucopians and fossil fuel producers can hurl at the concept of peak oil (which in it's basic form cannot be denied, if you use a non-renewable resource, sooner or later you begin to run out...the discussion is about when and how the events following that will occur.
I have been here four years, and in that four years have seen predictions posted with absolutely certainty that turned out to be absolutely wrong. I now believe even more than when I first came here that if one chooses to make predictions, they should have to stand behind them, myself included.
I for example have made only one real "prediction" that I can recall: That peak demand for oil in the developed nations of U.S., Japan, and Europe has probably (note the fudge factor!) already been seen.
Of course, that is a relatively safe one when you accept the premise of peak oil...either demand will drop faster than supply drops (note no denial that supply will drop, just a question of when) and supply will follow downward, and we get by with less suffering than if supply drops faster than "demand" drops (and I realize that in theoretical economic terms the two have to balance, so let us say "desire" for oil drops) and demand follows the drop in supply down, the open question being with how much damage and suffering to the economies of said nations. Either way you get peak demand, the only question is in what order the events occur, which is no small matter when you think about it.
Back to predictions...I predict most of us, including very probably myself as well, will be wrong...the only question is to what degree.
"A theory is only perfect to the degree that it is complete. An entirely complete theory by its nature would be entirely perfect."
Albert Camus
RC
Crude oil, 2005 yearly. Going down already.
Total liquids, flat until 2010, then down in 2011.
Net exports: peaked in 2005, heading down steeply in 2011
OECD imports: headed down since 2007.
Net energy from oil products: probably peaked 2004 or before.
"We should place bets on the timing of terminal decline."
yeah? Who do you trust to hold the money...:-)
RC
Nice work as always, Rembrandt.
I don't know if you perused the Petroleum Demand Lessons from the Late 1970s article I submitted here; I was able to find some info on use of oil for power generation, which I'd asked you about; here's a link to my spreadsheet: Electricity (from World Development Indicators 2009). May be of interest. It's a sizable sliver of overall consumption for many nations:
One question I would have is why countries have chosen to use oil for electric power. Oil is a lot more portable and easier to store than natural gas. Portability might be a reason an island nation would use quite a bit oil. Hawaii is the part of the US that uses a mostly oil for electric generation. Backup generators are generally diesel powered.
Another question I would have is where the natural gas (or coal) is going to come from, to substitute for oil. Back when the US switched to other methods of electric generation, it wasn't too hard to ramp up coal and natural gas and nuclear.
For example, Kuwait, according to the EIA, seems to be using all of the natural gas it produces right now, for desalination or fertilizer or reinjection or electricity, and in fact, some uses have to be cut back to meet summer electricity needs. The article talks about trying to import natural gas.
Saudi Arabia seems to be selling natural gas cheaply for uses other than electricity. There was an article in Drumbeat about the issue. They have an electricity shortage, so would like more electricity from natural gas, if they could figure out how to do it.
I caught that article too - excellent stuff. Another confidence builder for me too, I've speculated about a possible reluctance on KSA's part to move to non-FF sources of power like solar thermal as being hubris, or not wanting to show their hand; it caught my attention that a source in the new article states that they may be reluctant to shift away from being an oil exporting power house to a more diversified industrial economy: "They haven’t made the psychological transition yet.” Solar thermal would be just the thing, seems to me; it's proven as a source of reliable baseload at close to GW scale, and they're drowning in insolation even more than hydrocarbons over there. But this would be a loss of stature, going against the grain of history; "Coals to Newcastle" as the expression goes. France importing wine. Iowa importing corn.
KLR, excellent point. It is interesting that in the prior several posts we have talked about Hawaii and Saudi Arabia, two of the sunniest places on earth, using oil to generate electricity (!!!) Insanity if one belives that concentrating solar will work at all. If solar thermal, concentrating mirror solar and PV won't deliver economic viability in Hawaii and Saudi Arabia, it's not going to work anywhere. Several years ago I saw a slogan or title somewhere that said "The Saudi Arabia of solar energy will be...Saudi Arabia."
RC
The skinny I've heard is Oahu (not all of Hawaii) uses bunker oil after the local refineries make aviation fuel for sale locally. The bunker oil would have to be shipped away at some cost, so Hawaiian Electric Co. gets a "deal" on the oil. I'm sure the oil refineries on Oahu, at the southwestern tip of that island, which is usually downwind of the prevailing trade winds, are there because they can then comply with or beat US Clean Air Act regulations cheaply with dispersion to sea. The main Oahu power plant now burns a slurry of 30% coal, 70% oil, and since the ill-fated events of 911, new power plants have been placed in other locations, and some of those burn coal exclusively. One burns trash that would otherwise go into a landfill.
Thanks, interesting. Always wondered why they didn't just direct some of that heat coming off that basalt into a turbine, though. Checking further I see that Puna Geothermal does tap into Kilauea.
Geothermal Energy in Hawaii
Are we at 90 mb/d, then? At least on paper, or in theory.
Since the price of oil was runaway from 2006 to 2008 it seems reasonable to assume that world production was flat out at this period.
That would imply that about 2mbpd of spare capacity is imaginary. If we assume that the growth of capacity in the last couple of years is real that would give us about 88 mbpd capacity against production of about 86 mbpd. I would posit that 'real' spare capacity is between
0 and 2 mbpd. We should find out soon, if Chinese demand continues to grow,
I prefer 90, being a round number fan. ;) Hard to say how much of the spare cap is illusory. Those were some big pipes Leslie Stahl was standing in front of, you know. I was always hoping for an examination of a mothballed field being rejuvenated and worked over to produce x times its original capacity, as the Saudis claim to have done with Khurais. Has that ever been done on a field of comparable size?
Related note: I was surprised to see how geriatric some of the top 100 fields in the US are - average age is 55.65 years. Top 10 includes Midway-Sunset, Kern River, and Belridge, 109/111/99 years old.
If the world is on plateau with energy production and there is a possibility of a terminal decline in energy production why isn’t more being said about this on the news? Why did President Obama spend all his time pushing health care coverage when there is a possibility that folks won’t have heat in their homes in a few years? I don’t understand. If the people at theoildrum understands that we are headed for a energy crisis why don’t our leaders do something? Is it the hopelessness of the situation? I’m old but I think I’m teachable. What’s going on?
hotrod
Cognitive dissonance?
I can't remember where I read it, maybe here, that peak oil is like the ex-spouse showing up at the wedding drunk. The discomfort is palpable but everyone ignores it because it's contrary to our comfortable experience.
Or technology will solve it. By god, that's what we civilized people are good at.
"What’s going on?"
I think one needs to expand the scope of what's being denied. In addition to peak oil there are economic and ecological crises that have been swept under the rug. And for how many years?
But then, the rich are getting richer, so what's to worry?
I suspect our fearless leaders think they have enough on their plates, without 'creating' new issues for public debate. In the case of PO, they seem to have a perfect out. The IEA supplies the official statistics governments use to determine energy policy, and as the IEA does not see a crises imminent, it's BAU.
lineman:
Our leaders are definitely doing something. They have committed us to endless war in the M.E. for the world's remaining hydrocarbons. They have guaranteed endless bailouts for the financial and mortgage industry.
Are these the right moves? Well, probably not in isolation. And the government isn't especially inspiring on anything else. Take cash for clunkers, for example. It was not particular well thought out, but it could work, if done more effectively. As in, permanently subsidize 50% of the purchase cost for anybody trading in their pickup/suv for a compact car, mandate something symbolic like 50 mpg average in 10 years, and enforce a national highway speed limit of say, 60 mph. And enact a gas tax!
The reason why none of this is done is because Wall Street owns our goverment. If these moves ever happened, people might become bearish on equities, which simply cannot be allowed.
It's fundamentally due to the shape of the world oil production.
The left hand slope is steep. So production rises rapidly and keeps prices low. Then suddenly it peaks. Then it will slowely decline with a concave tail.
The shape I have described is how an oil field's production evolves. World oil production simply aggregates the oil fields. So same shape is expected as long as oil discoveries are not dispersed in time (bulk of the giant oil fieds were discovered between 1945 and 1965).
Peak oil is the train you never saw. There is forewarning to the shape of the production curve.
Look at North Sea or Norwegian production. Rapid growth followed by an unanticipated peak and then gradual decline.
The chart for US consumption shows a decline of about 2M per day over several years ago. The chart for US all-liquids production shows an increase of about 1M per day over several years ago. That suggests US imports should have decreased by about 3M per day.
Why does the chart for US imports show a decrease of 1.5M per day or less??
...maybe the barrels have gotten smaller?
US consumption in Dec was 2875 kb/d lower than its Aug 2005 peak. Diffs for crude oil/finished products imports in Dec were 2632 and 1842 kb/d from their peaks in June/Oct 2005. The sum of these discrete streams is more than what the EIA gives for "U.S. Imports of Crude Oil and Petroleum Products," BTW. Don't know what that means. Using this latter lower figure of 4210 kb/d the difference is 1,335 kb/d. Ethanol is one factor, as I related in another comment here - production goals from the RFS have increased 469.41 kb/d from 2005 to 2009.
Dec Production was up 404 kb/d YOY. Peaks for '05-'09 in PADD 3 and 2 were set in Dec and Nov respectively. Add it all up and...
Dec consumption of "Other Oils," which I'm obtaining by simply summing up everything from ethane on down - industrial apps by and large, not including propane, resid, or LPGs - is down 49.64% from its June '05 peak. It looks resolutely down since June '06, too, following a linear nosedive. That ain't good news for any kind of industrial rebound.
Weird: Ethane's peak is Nov '09. Production up for about 5 years. Main use: polyethylene.
Is that used in house wrap? And perhaps some hoses/piping? Maybe it peaked late due to insulating initiatives?
Using this latter lower figure of 4210 kb/d the difference is 1,335 kb/d.
I'm not clear what you mean here.
OK - so you'd estimate that US consumption is down about 2.9M b/d from peak, and that production is up about .4M b/d from the trough of production? So, imports should have fallen by roughly 3.4 b/d? How does that compare with the official import stats?
Imports are down 4.4 mb/d, consumption is down 2.9 kb/d; add perhaps 800 kb/d from increased production both of oil and ethanol, and you're only short about 700 kb/d. I haven't counted every bean here but it's close to the total. Some of the imports are just going into stocks. The size of the deficit depends on where you choose to start from, my numbers are from absolute peaks, computing running averages would give different numbers.
ok, but why doesn't the oil-watch imports chart #54 reflect this?
It suggests a decline of only 1.5 M b/d (from about 12M to 10.5M).
You know, I'm not sure. My source is here: U.S. Imports of Crude Oil and Petroleum Products This is EIA, the IEA number seems to be the EIA's "U.S. Imports of Crude Oil and Petroleum Products (Thousand Barrels per Day)" minus imports of Finished Products, but not minus "Other Liquids"; these latter two comprise the "Petroleum Products."
EIA absolute peak for crude oil + products imports was Aug '06 at 14697
kb/d; subtract 2028 kb/d of finished products imports from the same month and you get 12669
kb/d, close to what's on Rembrandt's chart. This may just be a methodology quirk of the IEA, like the way BP doesn't include biofuels or CTL in their production numbers for the Stat Review, but they do include NGLs, giving numbers that are neither C+C nor liquids as usually defined.
the IEA number seems to be the EIA's "U.S. Imports of Crude Oil and Petroleum Products (Thousand Barrels per Day)" minus imports of Finished Products
Not including "Finished Products" seems like an enormous error.
Rembrandt, can I suggest you use the EIA stats linked by KLR above?
I appreciate these charts as much as the next reader. But all one really needs to know is encapsulated in the Reuters story Leanan posted in today's Drumbeat.
"New oil investments need $60-$70 oil price-BP head"
http://uk.reuters.com/article/idUKWNA660520100323?rpc=401&feedType=RSS&f...
Two and one half years ago, I posted this article on TOD.
http://www.theoildrum.com/node/2978
I have more reason today to endorse the contentions I made and the concerns and outlook expressed by the OPEC planners than I did even then.
RC
How do you figure that? Russia production peaked decades ago and despite reworking fields has not been able to equal the prior peak. The Russians have indicated they will have to make huge investments just to keep production at current levels.
Mexico will become a net importer by 2015. I am looking at Norway's oil production data right now. Big declines. Well past its prime
Iraq has about as much chance of hitting production targets as George Bush has winning an election about Iraqi Sunnis.
How do you rationalize increasing production?
By the way, a chart of non-OPEC oil production from 2004 to the present suggests it is long term decline. Granted we have a business cycle superimposed on top of a long term secular trend, but we don't have a story at the country level where this oil is going come from ...
We should also look over Non-OPEC supply which increased by 590,000 bbl/d in 2009, and is the largest annual increase since 2004. Non-OPEC supply is projected to increase by 550,000 bbl/d in 2010 before declining slightly in 2011, as declining production in mature areas more than offsets any new production growth. And the largest source of supply growth in 2010 is the United States, followed by Brazil, Azerbaijan, and Kazakhstan, which as a whole makes the supply more diversified rather than dependent only on Middle East.
Want to learn more about balanced energy for America? Visit www.consumerenergyalliance.org to get involved, discover CEA’s mission and sign up for our informative newsletter
So what? US oil production peaked in 1971 and Prudhoe Bay made no difference ...
With Mexican production in long decline the US will be more and more dependent on foreign oil.
There is no reversing that trend.
US consumption is falling, and production is rising. Imports are falling quite fast.
Take a look at the import numbers, especially in 2009:
http://www.eia.doe.gov/emeu/mer/pdf/pages/sec3_3.pdf
YTwBiLy kulNUqS