Peak Gold, Easier to Model than Peak Oil? - Part II
Posted by Luis de Sousa on December 2, 2009 - 10:13am in The Oil Drum: Europe
 This is the second installment of a guest post by Jean Laherrére on peak gold. The first part can be read here. This time Jean takes a macroscopic perspective on gold mining for the world as whole.
Note: This post contains 33 images amounting to 1.5 Mbytes of data.
World gold production
In Part I, we mentioned how uncertain past data is, in particular for the countries of the Former Soviet Union. Furthermore, gold producers try to inflate their discoveries to get higher stock markets values, even to the extent of fraud. A series of high profile resource stock scams took place in the 1990s, which culminated in the huge Bre-X scandal in 1995. Bre-X’s stock collapsed after its much-touted Busang gold project – thought at the time to contain more than 70-million ounces (2.1 kt) of gold - turned out to be a fraud; core samples from the drills had been tampered with and expertly “salted” with gold dust.
The world cumulative gold production has reached about 150 kt at the end of 2008 (151 kt according to Gavin Mudd and 161 kt according to USGS, which had too high an amount for FSU). USGS estimates remaining reserves at 50 kt and resources at 100 kt. We model the future for an ultimate of 250 kt.
The world population is also plotted and displays a good correlation with cumulative gold production.
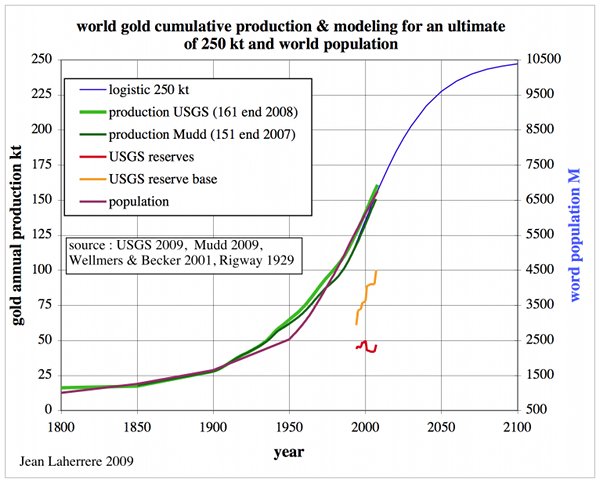 Figure 50: World cumulative gold production & modelling for an ultimate of 250 kt |
Gold production is reported to have started about 6000 years ago, but industrial production started around 1900. Gold cumulative production displays a real hockey stick!
 Figure 51: World cumulative gold production since the beginning of gold discovery in -3900 and world population |
Hubbert linearization (annual production over cumulative production percentage versus cumulative production) is often used to estimate the ultimate with a linear extrapolation, but this procedure only works if cumulative production follows a logistic curve (called the S curve). The world linearization graph is useless; no reliable linear extrapolation can be drawn, except that the last 10 years since 1998 could be extrapolated towards 240 kt.
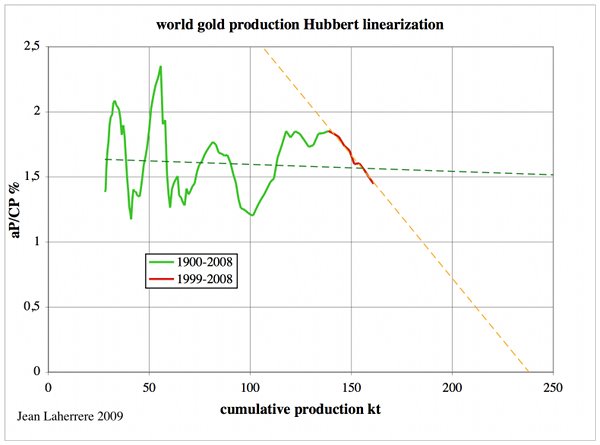 Figure 52: World gold production Hubbert linearization |
World gold annual production is plotted from different sources: USGS, Gavin Mudd, and goldsheetlinks. There is a large discrepancy during WWII and the cold war because of the overestimates by the CIA for the FSU. Gold price is also plotted with the drastic increases of 1980 and 2008.
Gold annual production peaked in 2000, and the decline is as steep as the increase despite the increase in gold price.
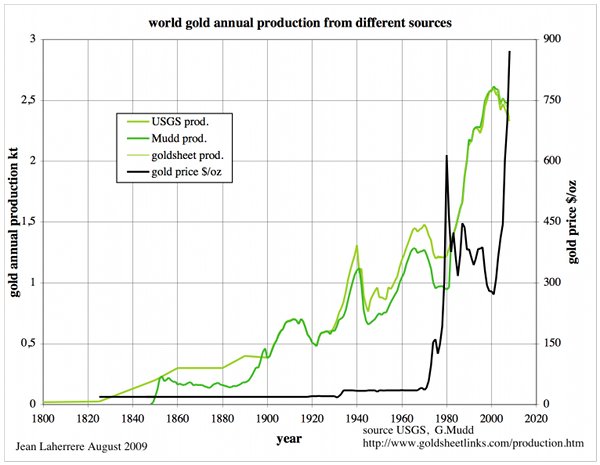 Figure 53: World gold annual production from different sources |
The breakdown country by country can be seen clearly on the graph from the 2009 Erste Bank Special Report Gold, despite of the USSR collapse in 1960 being wrong, as previously described.
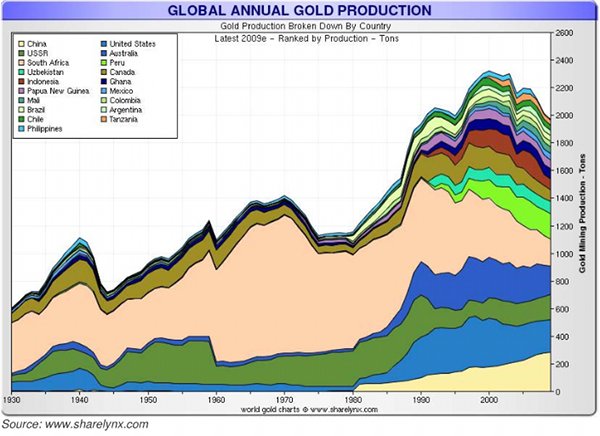 Figure 54: World gold annual production breakdown by country 1930-2008 |
Moorhead 2009 Newcrest has a similar graph for 1980-2008:
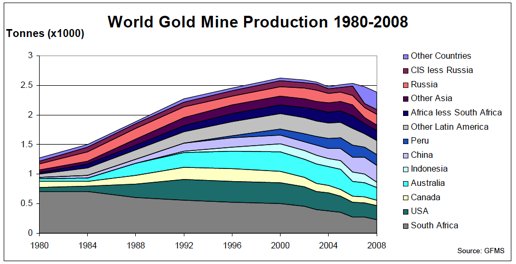 Figure 55: World gold annual production breakdown by country 1980-2008 |
World annual gold production is modelled with 7 cycles, but from 1800 (close to zero) to the 2000 peak the pattern looks like a simple bell-shape curve, despite several short bumps.
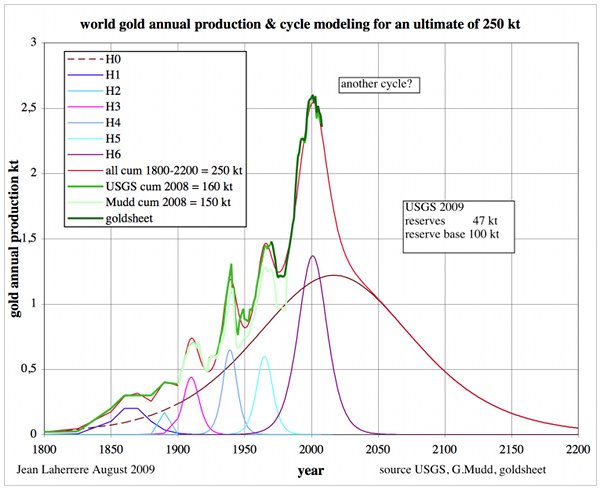 Figure 56: World gold annual production & modelling for an ultimate of 250 kt |
Gold annual production and forecasts of the main producers are compared. If China is now the largest producer, South Africa could be back to that position in 2030 if its 58 kt ultimate is right. New producers will arrive if the world ultimate at 250 kt is right.
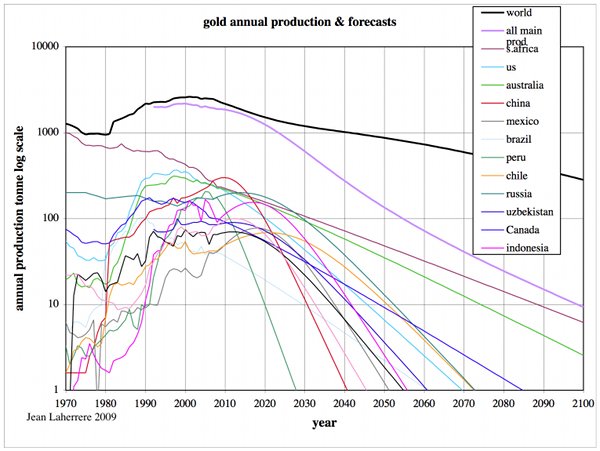 Figure 57: Gold annual production of the main producers in log scale |
The same graph in normal scale:
 Figure 58: Gold annual production of the main producers |
World gold grade
It is very hard to find historical data on world gold mine grade. The best one I found is from
2009-07-02: Erste Bank Special Report GOLD. The graph starts in 2000 at 2.2 g/t and declines down to 1.1 g/t in the first quarter of 2009. It is confirmed by data from CIBC World Markets.
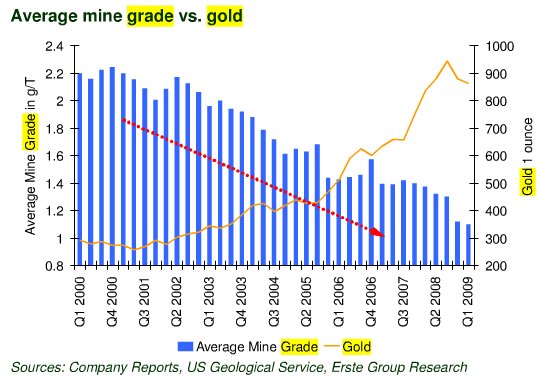 Figure 59: World gold mine grade 2000-2009 |
Estimation of reserves needs to assume an economic cutoff, which depends mainly upon the gold price and the mine set up (surface or deep mine). The gold cutoff was taken as 1 g/t a few years ago, but with the recent gold price increase it went down to 0.7 g/7 and now to 0.5 g/t. But in fact there is a little difference in reserve volume between cutoff at 0.5 g/t or 1 g/t, because the frequency of gold grade displays a pattern where 1-2 g/t seems more frequent than 0-1 g/t , as shown in this graph by Andean Resources Ltd [pdf!].
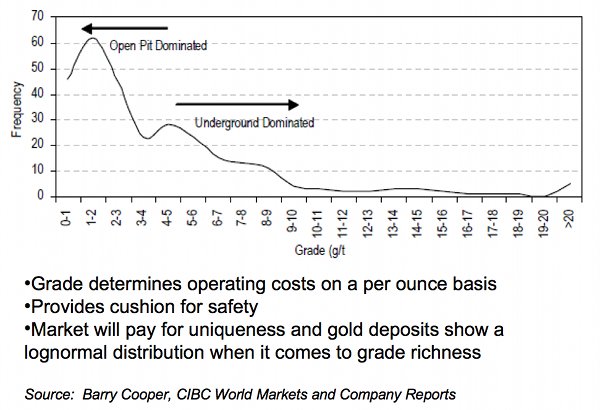 Figure 60: Gold grade frequency by Andean Resources Ltd |
This graph surprises me because it disagrees with most fractal distributions I have seen. The frequency must be computed with the number of deposits and not by volume, and, of course, low-grade deposits are ignored; as well as gold in seawater.
Vann et al. in the 1995 article entitled Global resource estimation [pdf!] estimated reserves for a particular dseposit, where the difference between 1 g/t and 0 g/t is small.
 Figure 61: Gold volume estimate versus gold grade frequency (Vann 1995) |
Gold in seawater
Everyone agrees that gold in seawater represents a huge volume, but it is hard to get a consensus on the concentration (grade) and volume. The volume of the oceans is 1.3-1.5 billion km3 (10E18). Some attempts have been made to assess these figures:
The famous chemist Fritz Haber had heard that a ton of seawater contained 5/1000ths of a gram of gold or even more which meant the oceans could contain something like 8 million tons of it. Early sample tests were encouraging but not conclusive, so Haber and his assistants took about 5000 samples back to his Berlin laboratory. Alas the final result was that a ton of seawater only contained about 1/5000th of a gram. This was way too low to make it economically feasible to extract the gold. It was a crushing blow for Haber.
| Concentration (10E-12) |
Volume (kt) |
Reserves (kt) |
|
| Haber | 200 | 320 | |
| Bardi & Pagani 2007 | 11 | 14 300 | 42 |
| Dartmouth University | 600 | 8 000 | |
| Encarta | 50 000 | 9 000 000 | |
| GoldFever | 10 | 750 |
It is a mess!
However, recently, a high concentration of gold (15 g/t) was found in oceanic deposits close to black smokers. Production with copper is planned by a company (Nautilus). In this case it is difficult to estimate the total volume at this stage.
World gold exploration and budgets
In the Erste 2009 report, it is interesting to see that gold exploration budgets have sharply increased since 2003, but exploration budgets for 2009 are estimated to be down by 40%!
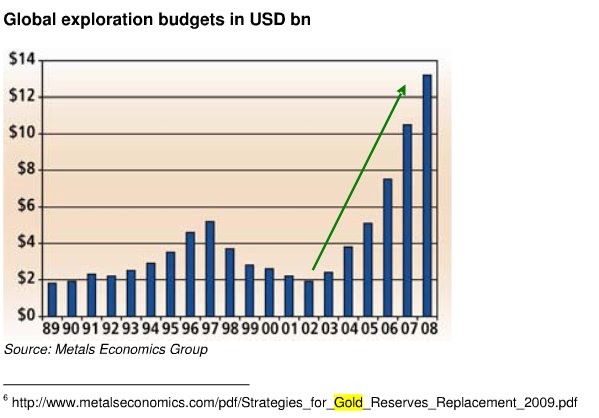 Figure 62: Gold exploration budgets from the Erste report |
The discoveries in the western world (Owen Hegarty CEO G-Resources «Gold: the perfect metal» June 2009) peaked around the 1980s, but low discoveries around 2000 may be due to low exploration investments.
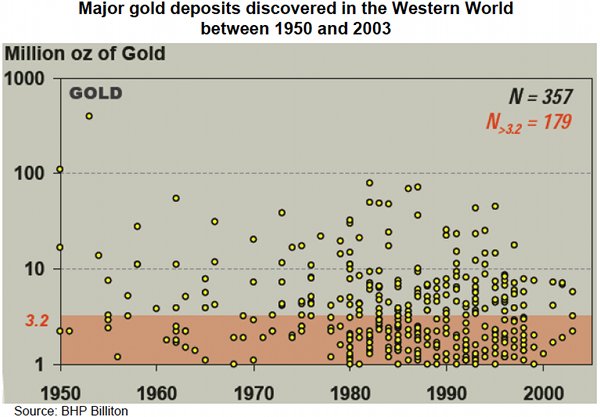 Figure 63: Gold discoveries in the western world 1950-2003 |
The Metals Economic Group says there were only been four world-class gold discoveries in the last 15 years. In fact, of all new discoveries, 75 % are made by the juniors.
Newcrest states that Gold discoveries are becoming rarer [pdf!]:
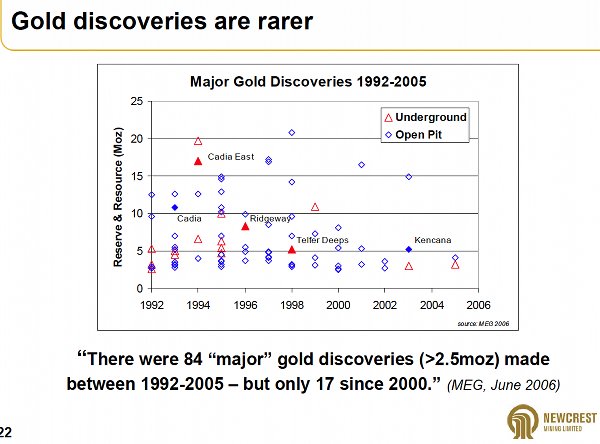 Figure 64: Gold discoveries 1992-2005 from Newcrest |
Distribution of gold deposits
Peter Laznicka, 1999, Quantitative relationships among giant deposits of metals, Economic Geology V94 n04 gives the gold distribution from geological ages:
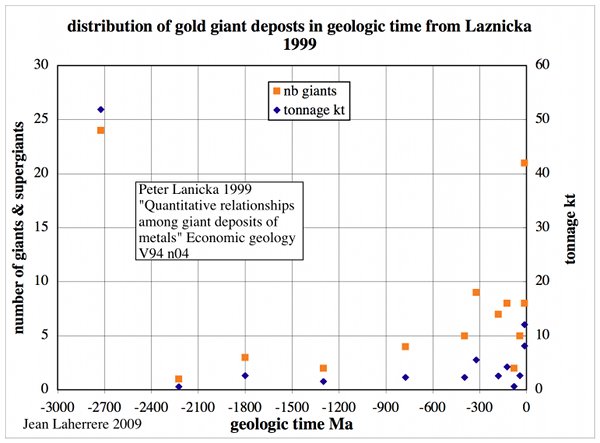 Figure 65: Gold giant deposits (number & tonnage) in geologic time from Laznicka |
Laznicka has listed over 500 giant metal accumulations in a database called GIANTDEP that is not available on the web.
Robinson, 2007, The Spatial and Temporal Distribution of the Metal Mineralisation in Eastern Australia and the Relationship of the Observed Patterns to Giant Ore Deposits [pdf!] has a graph that is similar but slightly different despite being from the same source.
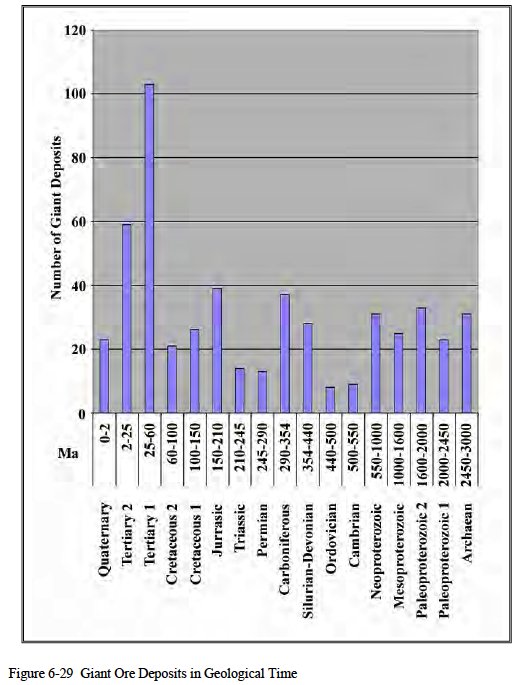 Figure 66: Number of gold giant deposits in geologic time from Robinson page 220 |
 Figure 67: Number of gold giant deposits in geologic time from Robinson page 221 |
Laznicka‘s classification is 4 kt for a supergiant, 400 t for giant and 40 t for large deposit.
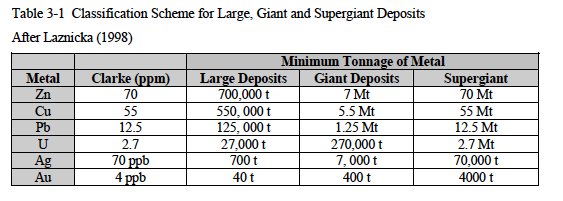 Figure 68: Classification of gold deposits, Robinson page 89 |
Unfortunately, no complete list of world gold deposit reserves is available on the web. We have to restrict our analysis to deposit production.
The fractal distribution of gold deposits annual production (deposit size versus rank of deposit in decreasing size order) is plotted from USGS 0FR 02 303 (table 11), world’s largest mines in 2001 and gold producers from gooldsheetlinks. The fractal distribution is parabolic like all natural objects (Laherrere 1996, Laherrere & Sornette 1998).
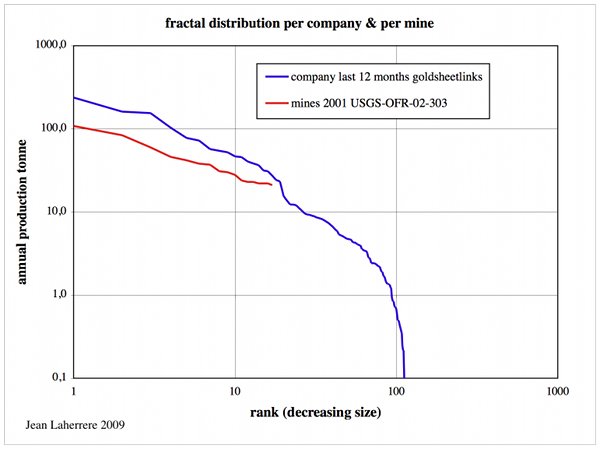 Figure 69: Fractal distribution of annual production per company & per mine |
Fractal distribution is related to Pareto’s law: 80/20 (80% of the production comes from 20% of producers). The production of the 15 largest producers represents 51% of the world's production (goldsheetlinks rank per company for the last 12-month trailing production, August 2009).
World gold demand
Unlike oil, gold is mostly conserved, and demand can be much larger than mine production. The demand is mainly jewelry.
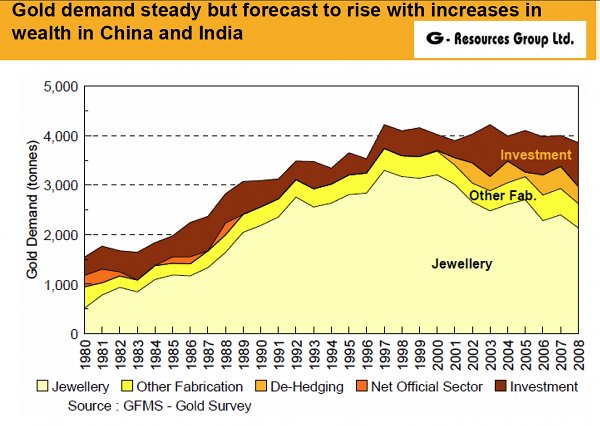 Figure 70: Gold demand from Erste report |
The gold consumption pattern in 1999 (USGS –OFR-02-303-gold) shows that jewelry is the largest use, followed by electronics, then coins.
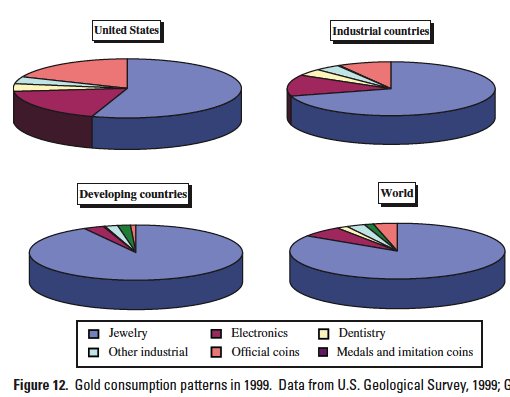 Figure 71: Gold consumption pattern in 1999 |
Mine supply provides the majority of the gold supply, followed by gold scrap and sales.
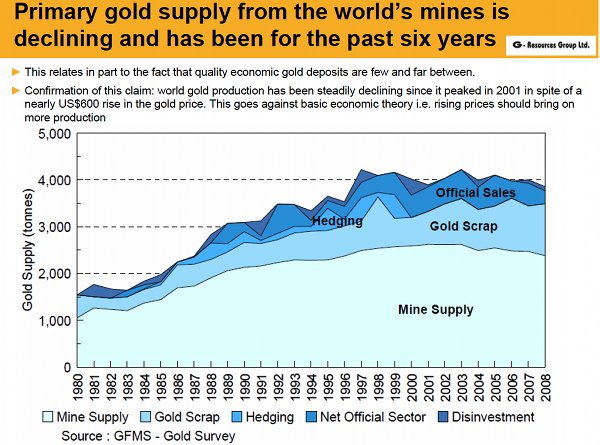 Figure 72: Gold supply 1980-2008 |
Official gold reserves
Gold reserves can either correspond to what is expected, from geological estimates, to be produced in mines, or the amount of gold in banks.
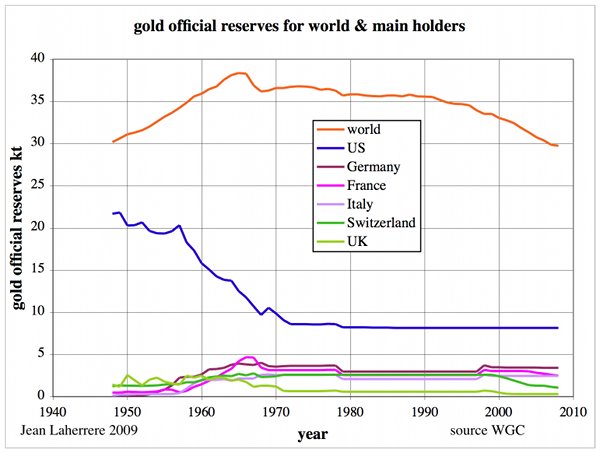 Figure 73: Official world gold « reserves » and main holders |
The price (London pm fix) of gold is displayed monthly in different currencies.
 Figure 74: Monthly gold price in different currencies 1971-2009 |
The gold price is compared to the oil price and the wheat price in nominal dollars. Gold price tends to follow oil prices, whereas the wheat price (which depends on oil for fertilizers, pesticides and machinery), was very close to oil until 1973, but afterwards has become much less connected.
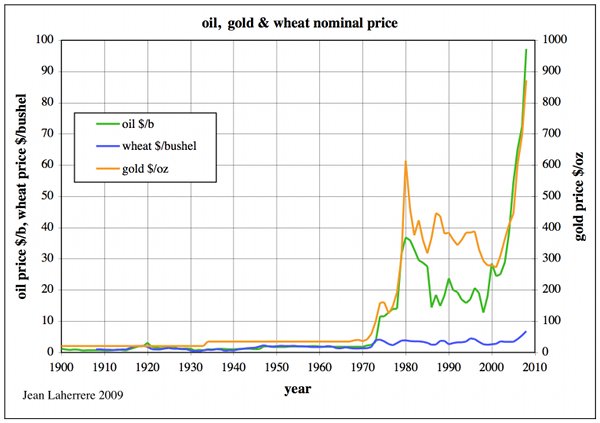 Figure 75: Gold, oil and wheat nominal price 1900-2008 |
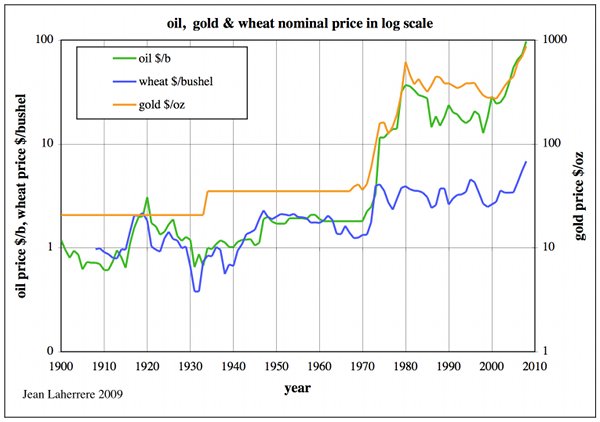 Figure 76: Gold, oil and wheat nominal price 1900-2008 in log scale |
Since 2007, the price of oil seems to depend upon the value of the dollar:
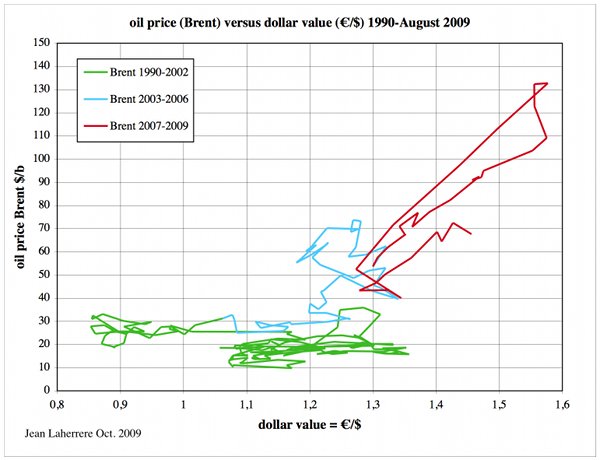 Figure 77: Oil price versus dollar value |
The oil price seems to be correlated with the gold price since 1900, except during the 1979-2000 period:
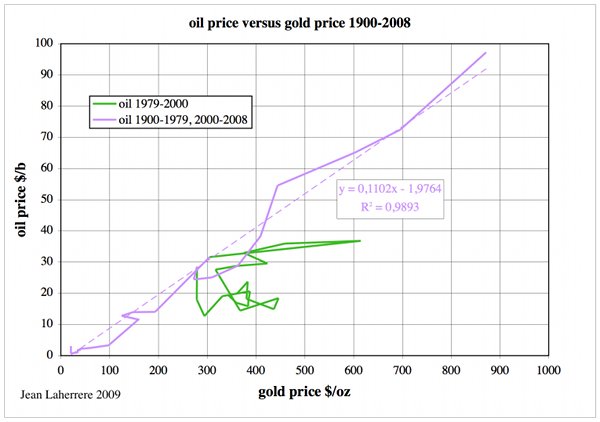 Figure 78: Annual oil price versus gold price 1900-2008 |
But the monthly values for 2009 seems to depart from the previous trend: is it going to return?
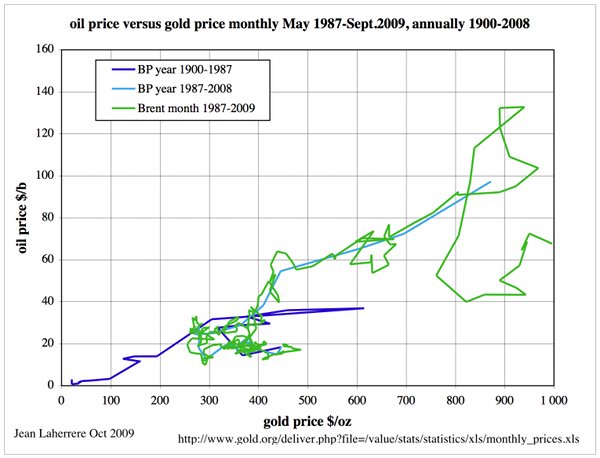 Figure 79: Annual oil price versus gold price 1900-2008, and monthly May1978-September 2009 |
Erste Bank displays the gold over Dow ratio since 1900, with bursts and back to earth runs.
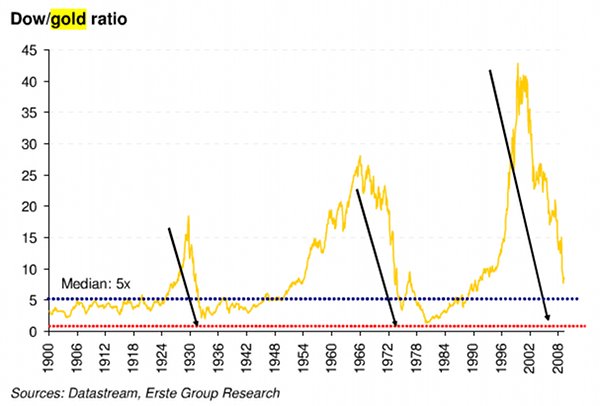 Figure 80: Dow Jones value over gold price ratio 1900-2008 |
Gold and oil annual production & forecast
The display of gold production and forecast for an ultimate of 250 kt is compared to oil (liquids) production and ultimates of 3 & 4 Tb.
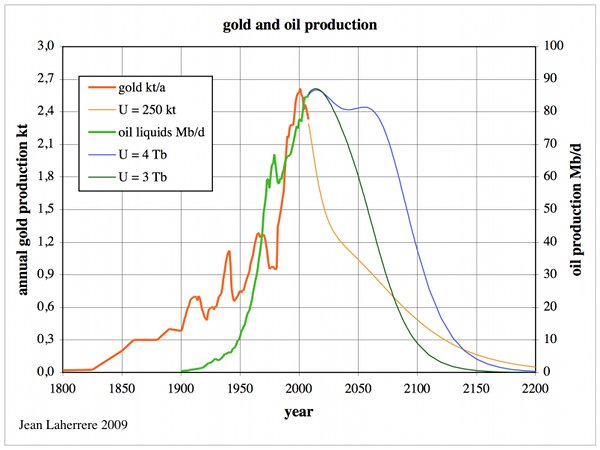 Figure 81: Gold and oil (liquids) production & forecasts 1800-2200 |
Conclusions
Gold production has a longer history than oil production, but both are likely to reach a peak during this decade: 2001 for gold and 2008 for oil (in fact, it is going to be a bumpy plateau instead of a peak), and both will cease to be extracted before 2200. Yet oil will be gone, converted into heat and ashes, while gold will remain as jewelry and bullion.
Excluding soil and water, which allows us to grow our food, oil and gold must be the two most important minerals of our present civilization. Their production will span for only a few centuries, much less than the western civilisation's lifetime.
It is amazing to think that we are presently at a key epoch (peak or plateau) of our civilisation in terms of supply and we do not realize it. Paul Valery wrote in 1931 “the time of a limited world begins”, but many do not accept this fact, always wanting to consume more.
It is time to change our way of life.
The first part of this work can be found here.
Personnel
Editors
Contributors
Peak Oil Primers
Archives
- November 2010 (3)
- October 2010 (6)
- September 2010 (4)
- August 2010 (7)
- July 2010 (6)
- June 2010 (7)
- May 2010 (2)
- April 2010 (8)
- March 2010 (4)
- February 2010 (6)
- January 2010 (3)
- December 2009 (5)
- November 2009 (8)
- October 2009 (12)
- September 2009 (6)
- August 2009 (5)
- July 2009 (11)
- June 2009 (8)
- May 2009 (16)
- April 2009 (10)
- March 2009 (7)
- February 2009 (10)
- January 2009 (15)
- December 2008 (9)
- November 2008 (9)
- October 2008 (9)
- September 2008 (13)
- August 2008 (10)
- July 2008 (14)
- June 2008 (23)
- May 2008 (16)
- April 2008 (12)
- March 2008 (16)
- February 2008 (9)
- January 2008 (13)
- December 2007 (13)
- November 2007 (16)
- October 2007 (22)
- September 2007 (8)
- August 2007 (9)
- July 2007 (16)
- June 2007 (8)
- May 2007 (7)
- April 2007 (7)
- March 2007 (10)
- February 2007 (10)
- January 2007 (12)
- December 2006 (9)
- November 2006 (15)
- October 2006 (4)
- September 2006 (5)
- August 2006 (5)
- July 2006 (9)
- June 2006 (5)
- May 2006 (10)
- April 2006 (9)
- March 2006 (13)
Vital Trivia
License

This work is licensed under a Creative Commons Attribution-Share Alike 3.0 United States License.
I have studied this "Bre-X" fraud a fair amount and some people think the fraud was abetted by a questionable technique from the field of geostatistics called kriging.
This presents a huge potential for bias by re-sampling from a few holes and not understanding the statistical independence of spatially separated data.
I have worked on this problem in a different subject area and can see how they can get it wrong. I wrote a bit about it here, and may do more on it if I find something significant:
http://mobjectivist.blogspot.com/2009/10/geostatistics-fraud.html
The good news is that this technique is not used in oil exploration very often.
Something else missing - new technology will allow us to create gold possibly even from the CO2 in the atmosphere, also i haven't seen anything about all that abiotic gold which is constantly being created:-)
"Gold production is reported to have started about 6000 years ago, but industrial production started around 1900. Gold cumulative production displays a real hockey stick!"
Maybe related to having mechanised labour??
Don't forget your butt as a source when it isn't producing flying monkeys. ;)
Well I've seen evidence of a recent gold
discovery accessible via a two day walk inside a national park. It looks like the source rock will assay well over 20 g/t. Like all good legends it is difficult to verify. If it turns out to be true it will probably be a minor occurrence.
The problems I see with predicting peak gold are supply factors
a) diminishing return on energy invested
b) increased recycling ratio
c) gold as an accessory to Sn,Ni,U,Ag,Cu etc
and demand factors
a) store-of-value switching
b) return to subsistence mentality.
My own view is that with Peak-almost-everything-else gold digging is a waste of effort better spent on food and energy security. If I found gold I'd sell it to buy large batteries or similar. I'd have something of long term value but the buyer would have something that may soon be useless.
I wouldn't hold much gold even if I could afford to.Boof is probably right -things such as atteries are probably safer bets if tshtf.
I am a little amused that the authors say gold is more important than coal ,aluminum, iron,phosphates and maybe a few other minerals.
I presume they mean within the context of what happens to the economy near term and just forget to specifically say so in which case I might agree with them.
I think we would still have developed pretty much the same industrial civilization as we have now if gold were only a laboratory curiousity.Of course the time frame might be a lot different as it might have taken longer to establish the concepts of money and currency.
The one thing that might throw off the gold production projections in a big way that is not seriously discussed is the possibility that maybe there is a lot of gold someplace mixed in with some other type of ore that will eventually be mined anyway, making it easy to extract the gld as a by product.
Maybe there is no "there there"-is it likely such ores exist in large quantities?
Copper, gold and silver (in that order of value)
http://www.fcx.com/operations/asia.htm
40 million troy ounces (1,245 tonnes) left.
Alan
I think stating this is a tad presumptuous, unless you refer to the parabolic fractal as a pure heuristic. If that is the case, it is not saying much since we I can fit just about any curve with that many parameters.
Starting from first principles and applying the maximum entropy principle, I can do much better than a pure heuristic. I placed the gold sizing plot (Fig.69) on top of a set of MEP profiles on the following figure. (note: it is safe to slide the plots around on a log-log plot as long as the decades are calibrated, since these are scale-invariant curves)
I have a more detailed writeup on this technique, which I refer to as Dispersive Aggregation, here:
http://mobjectivist.blogspot.com/2008/10/estimating-urr-from-dispersive-...
The approach shows very good generality (see the TOD post on Crude Complexity) and if I were just as presumptuous, I would say that "all natural objects" that show dispersion follow this profile.
At some point someone (besides me) will have to seriously looking at these dispersive forms -- since they start from first principles, we can both gain a good understanding AND can make some decent projections based on the dispersion parameters. That is something that the parabolic fractal really lacks.
I think I will also get the smackdown from Majorian for posting this chart, another one of my "eyeball" plots. Tough noogies
Apologies if I'm being dense, but where is your gold graphic?
It is buried in the comment source but Imageshack gave a 404 for this graphic.

I will try again
http://img31.imageshack.us/img31/2048/golddispersion.gif
The original curve reappeared. Must have been a server down. The extra one I posted was a quickie duplicate.
Why is it that Laherrere plots Rank versus Annual Production and you plot Size versus Rank?
I understand the concept of 80-20(20% of the producers produce 80% of the product--except out of 150 meaningful gold producers 10% produced 50%) of the product though it is not an empirical 'law' but a rule of thumb (or has Mandelbrot algebraically derived it?).
How does this work with oil production by country(2008)? Terrible.
Production Rank#1 KSA 10.8 mbpd
#2 Russia 9.8
#3 USA 8.5
#4 Iran 4.1
#5 China 3.9
#6 Canada 3.3
#7 Mexico 3.2
#8 UAE 3.0
#9 Kuwait 2.7
#10 Venezuela 2.6
In this case 20% of the producers(#1+#2) made 40% of the oil.
Needless to say there is zero correlation between reserve by country and production (Russia #2 producer is #8 in reserves, US #3 prod is #10 in reserves, etc.)
Think about the alleged fractal similarity properties of Pareto. 20% producers producing 80% of the product. Does this mean 20% of those 20% of those producers(4%) produce 80% of 80% or 64% of production, 53-1, etc.?
http://en.wikipedia.org/wiki/Pareto_principle
WHT, I criticized you for claiming to have derived the logistic curve from
your dispersive model for reserviors. It still looks like a mish-mash to me.
This isn't right, this isn't even wrong.--Wolfgang Pauli
PS, I just visited the dentist.
Due to proportional extraction, Production=k*Size, that is why.
In other words, the bigger the mine, the more you will extract per year.
What I am doing is very close to Pareto, it has an additional constant that defines the shape plus a maximum range. Some people call it Mandelbrot-Zipf or Zipf-Mandelbrot but Mandelbrot never derived it, just stated it.
Thanks for only giving me a slight smackdown.
I have to also address your points with respect to oil.
First point is that rank histograms do not work as well at small rank. This is a very noisy region corresponding to very small probabilities. Taleb calls this gray swan territory.
Second point is that countries are political boundaries and I wouldn't look at production by country as the best metric. Better to use reservoir sizes.
Third point is that 80/20 is really empirical (you often also see 90/10 rule). The actual ratio depends on the full fit for the data. A real Pareto integrates to infinity so you need some sort of maximum size which is somewhat obvious, but that tends to make this ratio vary as well.
Fourth is that we don't have the best statistics on the world reservoir size production. Of course, we all wish we had better reservoir size statistics.
Crystal-clear to me. I still stand by my derivation: http://www.theoildrum.com/node/4171
It's nice to have a good theoretical underpinning, as it really clarifies the big picture.
It gets to the point when you stop worrying why it wouldn't fit; instead you figure the world would have to turn itself upside down to not behave that way. As you can tell, I am a big believer in entropy.
It seems to me that all graphs of possible future production are likely upper bounds, assuming technology stays approximately as it is. It seems like oil supply is likely to be a limiting factor in future years production. Credit availability is also likely to affect mining expansion.
I doubt that demand for gold will increase greatly in future years. In the future, people's incomes will either stay roughly the same, or will drop in real terms, as the availability of oil to leverage the work we do declines. With the same or less income in total, it will be difficult for our desire to gold to push the demand for this one good very high--doing so will result in an offsetting decline in demand for other goods, such as food and clothing.
"With the same or less income in total, it will be difficult for our desire to gold to push the demand for this one good very high--doing so will result in an offsetting decline in demand for other goods, such as food and clothing."
Given that the main buyers of gold are likely to be governments (for trade, store of value) and investers with spare cash, who would like to protect themselves from government printing presses, I do not quite follow your line of reasoning.
The public demand in India & China will be affected by those factors, but they are likely to be a minority of gold demand. But even 5% or 10% of total demand can swing market prices and affect whether new mines open.
Example: A failed monsoon will be a bearish factor for gold, as poor and even middle class Indians sell gold for food. Perhaps a few dozen tonnes, but a factor.
Alan
The mining process IS the conversion of Energy into metals.
Clearly prior to the industrial age only human energy could be applied to the extraction process so extraction was tiny. Now we have multiplied demand, energy supply many times but set against this is the inevitable decline of resource quality...
It seems that has finally caught up.
Will decline in demand match decline in our ability to supply? If the value of Gold is linked to an increase in demand and that wanes won't price fall? What will the value of Gold be in a world where basic food is increasingly prized?
Nick.
I agree mining is the conversion of Energy into metals so I would think more expensive energy would tend to cause more expensive metals, Gold included. I don't see how a decrease in supply would cause a decrease in demand apart from a RISE in price.
I don't think it's a competition for value between gold and food any more than it is a competition for value between savings and consumption. I think if there is a battle for value it is between gold and fiat currencies, so that the value of gold in a world where food is increasing prized is determined largely by a person's willingness to trade that food for fiat currency.
Going forward, I don't see gold losing ground to fiat so unless our future economy has no money or savings and is pure goods and consumption--I think gold will continue to be a sound store of value.
Correct. This is the golden formula:
mgold = E / c²
Excellent article.
Oil equals potential value. Gold equals stored value.
two observations
the R value of gold and oil is .98 over the past century. You may as well say they are perfectly co-related. (this implies that if oil triples from here to $200 plus, then gold will triple)
So it is meaningless and misleading to price oil in dollars, or assume you can derive any knowledge by tracking oil price in dollars.
In fact, you could argue that the entire run up in oil prices over the past ten years was due to dollar inflation only.
The other observation is the price of wheat, and the breakdown of co-relation of wheat,gold,oil in the 1970s. America spends about 6% of budget on food. Just 50 years ago this was 20%+
and in most of the world today it is 20% - 30%
if food prices doubled in the US, what would that do to the economic recovery? tripled?
who knows how to farm? (apart from oil drum readers)
I think 3% of the population today are farmers, and 100 years ago it was 45%
who was the lady who said
"As God is my witness, I'll never be hungry again."
time will tell
Scarlett O Hara from Gone With The Wind.
There are some valuable lessons to be learned from this people's classic.
the other comment is the level of central bank gold reserves. central banks travel in herds, as we know, and what i learned recently was that in the 1980 run up in gold, 80% of the big buying was central bank driven.
the little guy did not have the means or the method to do it
so gold is suddenly back in fashion, and central banks are dazedly looking around and lumbering to their feet
how many tons will they need to buy?
i think the chart above gives the general trend, but not the amount.
Consider Figure 57. In 2090 there are only 2 main producers left with little output. The other 10 listed main producers have shut down between 2028 and 2085. Yet the world production is still fairly high. Where is this gold coming from?
I would hope you continue this series by looking at silver. If/when TSHTF gold as a commodity will be too expensive for the common Joe to use on a daily basis. Siver, especially silver rounds, has a much stronger history of use in the common person's daily commerce. "Pieces of eight" anyone?
This is a terrific post. It will take me some time to grasp all the "nuggets" of wisdom contained herein.
One question I have - what conclusion does one draw from the the Dow/Gold trend? It looks to me based on history, that it ought to bottom out soon, meaning gold will come down or the Dow will go up or both.
You assume things have to continue as they have done in the past. While that may be a generally reasonable assumption most of the time, it also excludes thinking the unthinkable. For example, what if the DOW becomes worthless? Further you assume causation where there does not necessarily have to be any. Correlation does not equal causation.
China recently announced that they intend to expand their gold holdings from just over 1000 metric tons to about 6000 metric tons over the next 4-5 years and to 10,000 metric tons over the next 10 years. On the 10 year time frame that is 900 metric tons per year. Gold production peaked in 1999 at just over 2500 tons per year (at really low prices historically) and has fallen since then despite a 500% rise in price. Thus, assuming we can stay even close to 2500 tons per year for the next 10 years, this means China must purchase almost 40% of all gold production annually (or purchase existing gold from another source). This is going to put severe upward pressure on the gold market for the foreseeable future, assuming China carries through on this statement and the Chinese government remains roughly intact. The DOW simply becomes a sideshow that may or may not have some correlation to gold prices.
1. HISTORICAL GOLD PRODUCTION
2. China to Increase Its Gold Reserves
Well, a % of the Dow is Gold related -and I would expect that to rise/be leveraged more than Gold, i.e. .1% > 1% for a 5 fold rise in underlying Gold price...
In the 70s some people made a killing on tiny Gold stocks that rose a 100 fold... any clues? :o)
Nick.
The scale of the correction down obfuscates the actual numbers -- historical a gold bottom is equal in value to the DOW. Meeting at 2000 or 5000 would be a major hit to the DOW either way. Even "coming close" like 2x or 3x would still be quite a ways for gold to rise or the DOW to fall, or probably both.
I would like to compliment Jean Laherrere on his skill and clarity using the English language. Some posters may forget that French is his native tongue. There was a time that I looked at some of the peer-reviewed and other articles that he published in French journals. I was unable to read French except for occasional words but the graphs were so outstanding that one could just 'look at the pictures"!
Because Jean is not a native English speaker, there were others involved in this post as well. Luis did quite a lot of work on it; I looked over the final result, since Luis' native language is Portuguese.
I appreciate how Laherrere looks at so many different topics. I have a firm belief that many of the dynamics we observe in economic activities share a common underpinning. The challenge is to unlock these behaviors. As Yogi said: "You can observe a lot just by watching".
I once had an e-mail exchange with Laherrere at a time that he was requesting examples of mathematical situations in nature similar to the Hubbert Curve. I suggested Farr's Law from 19th Century epidemiology. It had been applied to the AIDS epidemic. The application was controversial. Unfortunately it led to an inaccurate estimate of peak AIDS in the US, primarily because the unusual incubation period of HIV was not understood. A.D. Langmuir had been the most prominent epidemiologist in the US during much of the 20'th Century. Farr's Law remains useful in the study of flu and other infectious epidemics.
http://www.ncbi.nlm.nih.gov/pubmed/2308183
I could not find much on Farr's law. Farr was apparently a contemporary of Verhulst and this was well before people started to apply stochastic principles. If you can dig up the formulation, I definitely would be interested to see how I could apply it.