Oilwatch Monthly May 2009
Posted by Rembrandt on May 22, 2009 - 9:37am in The Oil Drum: Europe
The May 2009 edition of Oilwatch Monthly can be downloaded at this weblink (PDF, 2.0 MB, 28 pp).
The Oilwatch Monthly is a newsletter that is available free of charge with the latest data on oil supply, demand, oil stocks, spare capacity and exports. Readers who want to receive the Oilwatch Monthly in their e-mail box each month can subscribe at this weblink, by filling in their first name, last name, email adress and selecting Oilwatch Monthly in the mailing list box. To finalize your subscription push the 'inschrijven' button below the form.
A summary and latest graphics below the fold.
Latest Developments:
1) Conventional crude production - Latest available figures from the Energy Information Administration (EIA) show that crude oil production including lease condensates increased by 306,000 b/d from January to February 2009, resulting in a total production of crude oil including lease condensates of 71.91 million barrels per day. The all time high production record of crude oil stands at 74.83 million b/d reached in July 2008.
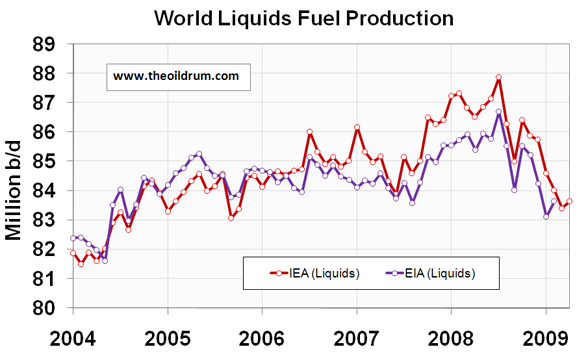
2) Total liquids production - In April 2009 world production of total liquids increased by 230,000 barrels per day from March according to the latest figures of the International Energy Agency (IEA), resulting in total world liquids production of 83.64 million b/d.
Average global production in 2009 up to April was 83.92 million b/d. In 2008 and 2007 an average of respectively 86.59 and 85.41 million b/d was produced. The US Energy Information Administration (EIA) in their International Petroleum Monthly puts average global 2008 production at 85.46 million b/d and average 2007 production at 84.43 million b/d.
3) OPEC Production - Total crude oil production excluding lease condensates of the OPEC cartel increased by 270,000 b/d to a level of 28.22 million b/d, from March to April 2009, according to the latest available estimate of the IEA. OPEC natural gas liquids production increased from March to April by 120,000 b/d to a level of 4.8 million b/d. Average total liquids production in OPEC countries in 2009 up to April was 33.03 million b/d, versus 36.09 million b/d in 2008, and 35.02 million b/d in 2007.
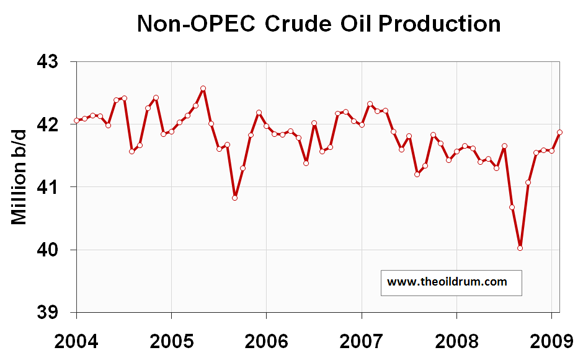
4) Non-OPEC Production - Total crude oil production including lease condensates of non-OPEC increased by 301,000 b/d from January 2009 to February 2009 to a level of 41.88 million b/d, according to the latest available estimate of the EIA. Average crude oil production of non-OPEC in 2008 was 41.31 million b/d, versus 41.80 million b/d in 2007 and 41.87 million b/d in 2006. Total non-OPEC liquids production decreased by 160,000 b/d to a level of 50.62 million b/d from March to April 2009, according to the latest figures of the IEA. Average total liquids production of non-OPEC up to April 2009 was 50.9 million b/d, versus 50.5 million b/d in 2008, and 50.41 million b/d in 2007.
5) OECD liquids demand - In March 2009 OECD oil consumption declined by 368,000 b/d from February 2009 according to the latest estimate from JODI, resulting in a total consumption level of 44.44 million b/d, and representing a year on year decline of 1.85 million b/d. Average consumption in 2009 through March 2009 was 44.89 million b/d, versus 46.16 million b/d in 2008.
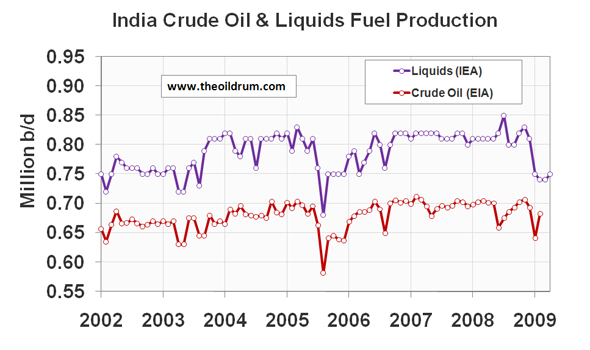
6) Chinese & Indian liquids demand - Chinese liquids consumption declined by 78,000 b/d from February to March 2009 to a level of 6.85 million b/d according to the latest estimate from the JODI database. Average consumption in 2008 was 6.92 million b/d. In 2005 China consumed on average 6.27 million b/d, growing to 6.78 million b/d in 2006 and 7.29 million b/d in 2007, but growth was impacted since July 2008. Consumption in India in March 2009 remained stable versus February levels around 2.67 million b/d. Indian oil consumption was 2.6 million b/d in 2008, versus an average of 2.43 million b/d in 2007 and 2.29 million b/d in 2006.
8) OPEC spare capacity - Total OPEC spare production capacity increased to 4.32 million b/d in April 2009 from a level of 4.27 million b/d in March according to the Energy Information Administration. Of total spare capacity 2.65 million b/d is estimated to come from Saudi Arabia, 0.24 million b/d from Qatar, 0.30 million b/d from Angola, 0.30 million b/d from Kuwait, 0.30 million b/d from the United Arabic Emirates, 0.10 million b/d from Iran, and 0.43 million b/d from other countries. According to the International Energy Agency total effective spare capacity (excluding Iraq, Venezuela and Nigeria) decreased to 5.13 million b/d in April 2009 from a level of 5.39 million b/d in March. The IEA estimates Saudi Arabia to be capable of producing an additional 3.05 million b/d within 90 days, the United Arab Emirates 0.61 million b/d, Angola 0.41 million b/d, Iran 0.25 million b/d, Libya 0.25 million b/d, Qatar 0.12 million b/d, and the other remaining countries 0.44 million b/d.
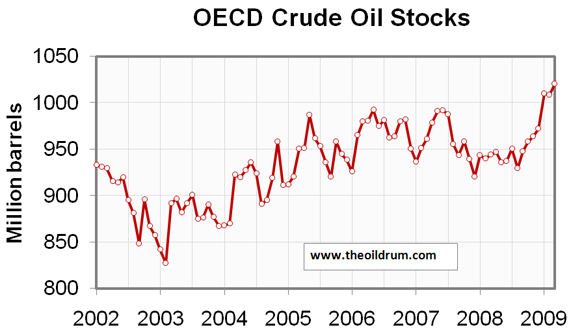
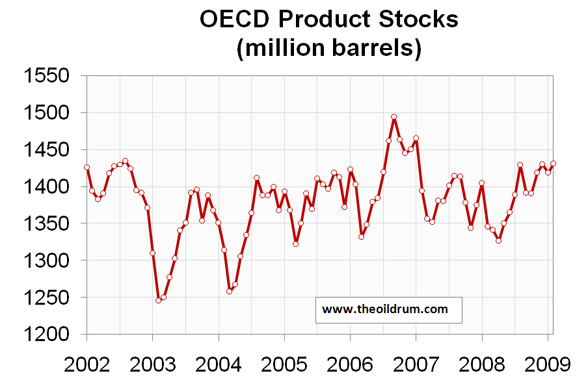
9) OECD oil stocks - Industrial inventories of crude oil in the OECD in March 2009 increased to a level of 1021 million barrels from 1009 million barrels in February 2009 according to latest IEA statistics. Total industrial product stocks in the OECD were 1432 million barrels in March 2009, remaining stable from February levels. Total product stocks are significantly higher than the five year average of 1383 million barrels.
Personnel
Editors
Contributors
Peak Oil Primers
Archives
- November 2010 (3)
- October 2010 (6)
- September 2010 (4)
- August 2010 (7)
- July 2010 (6)
- June 2010 (7)
- May 2010 (2)
- April 2010 (8)
- March 2010 (4)
- February 2010 (6)
- January 2010 (3)
- December 2009 (5)
- November 2009 (8)
- October 2009 (12)
- September 2009 (6)
- August 2009 (5)
- July 2009 (11)
- June 2009 (8)
- May 2009 (16)
- April 2009 (10)
- March 2009 (7)
- February 2009 (10)
- January 2009 (15)
- December 2008 (9)
- November 2008 (9)
- October 2008 (9)
- September 2008 (13)
- August 2008 (10)
- July 2008 (14)
- June 2008 (23)
- May 2008 (16)
- April 2008 (12)
- March 2008 (16)
- February 2008 (9)
- January 2008 (13)
- December 2007 (13)
- November 2007 (16)
- October 2007 (22)
- September 2007 (8)
- August 2007 (9)
- July 2007 (16)
- June 2007 (8)
- May 2007 (7)
- April 2007 (7)
- March 2007 (10)
- February 2007 (10)
- January 2007 (12)
- December 2006 (9)
- November 2006 (15)
- October 2006 (4)
- September 2006 (5)
- August 2006 (5)
- July 2006 (9)
- June 2006 (5)
- May 2006 (10)
- April 2006 (9)
- March 2006 (13)
Vital Trivia
License

This work is licensed under a Creative Commons Attribution-Share Alike 3.0 United States License.
Rembrandt,
Thanks for all your efforts producing your Oilwatch Monthly report including all 129 charts!
A significant part of world liquids production is natural gas plant liquids using the EIA data source.
http://www.eia.doe.gov/ipm/supply.html
I would have thought that world NGLs would have been increasing given new projects from Saudi Arabia and Qatar. Instead world production is struggling to be above 8 mbd as shown below.
World NGL Production to 2012 - click to enlarge
Saudi Arabia's NGL production has been falling from 1.44 mbd in 2007 to 1.43 mbd in 2008 to 1.31 mbd YTD Feb 2009. OPEC NGL has also fallen from 3.09 mbd in 2008 to 2.95 mbd YTD Feb 2009.
http://www.eia.doe.gov/ipm/supply.html
Saudi Arabia stated in its 2008 Annual Review, page 26, that the Hawiyah NGL plant started in second half of 2008 with capacity of 0.31 mbd NGL. The Khursaniyah gas plant is scheduled for completion in mid 2009 with capacity 0.28 mbd NGL.
http://www.saudiaramco.com/irj/go/km/docs/SaudiAramcoPublic/AnnualReview...
Given new NGL capacity startups from Saudi Arabia and Qatar don't you think that OPEC NGL production would have increased? Alternatively, do you think that OPEC's lower crude oil production has forced associated NGL production down?
@Thanks Ace for your insightful comment on NGL,
My guess is that OPEC's lower crude production has forced associated NGL production down. But that's just a guess.
More and more of the gas we are pumping is non-associated gas, and that seems to be drier gas, based on what Rune has said. Thus, the ratio to of natural gas plant liquids to natural gas production should be decreasing over time.
Also, of the two plants you mention, only one (Hawiyah) is currently on line with a capacity of 0.31 mbd. We don't know how late in 2008 it was added, or what percentage of capacity it is really at.
Hello TODers,
Since this keypost is lots of graphs and analysis [Thxs Rembrandt!], then perhaps this is a good spot to post a weblink to the latest graphs and analysis of "The Olduvai Gorge Theory Update" by Dr. Richard Duncan & contributors:
http://www.warsocialism.com/olduvai.htm
-------------------------
This article is featured in the Summer 2009 issue of The Social Contract Quarterly www.thesocialcontract.com.
Olduvai Theory: Toward Re-Equalizing the World Standard of Living
By Richard Duncan
Abstract
This study is based on: (1) historic population and energy data from 1965 to 2008 and (2) backup studies by several scientists. The Olduvai Theory is explained by disaggregating the World into the U.S., the OECD nations, and the non-OECD nations standards of living (SL). The U.S. SL peaked in 1973 (Figure 1). The World SL rapidly increased from 2000 to 2007 (Figure 2). This increase was caused by just a few non-OECD nations (Figure 3). The OECD SL peaked in 2005 (Figure 4). The Olduvai Theory shows each SL curve trending toward the same average SL value that the World had in 1930 (Figure 5).
----------------------------
I hope all TODers will take the time to read the full article.
For any TOD newbies: Many fundamental eco- & energy-thinkers are inside this article: Jay Forrester, M. King Hubbert, Dr. Colin J. Campbell, Walter Youngquist, Dr. Albert Bartlett, Charles G. Darwin, Sir Fred Hoyle, and an ***hat-tip to TopTODer Euan Mearns, too.***
Bob Shaw in Phx,Az Are Humans Smarter Than Yeast?
Oops, I almost forgot to credit LATOCer Roccman for posting the link.
I get address not found. Bad link?
Link is working now.
It's kind of misleading to keep re-branding "Olduvai Theory" the way he does. It was initially a very specific prediction about per capita energy consumption (that was also statistically invalid, but that's beside the point), whereas now it's about "equalizing standard of living".
Unfortunately, though, what he has not changed is a tendency to make unfounded assertions. For example:
"“Raising the quality of life,” means releasing stress, reducing crowding, reducing pollution, alleviating hunger, and treating ill health. But these pressures are exactly the sources of concern and actions that will control total population to keep it within the bounds of the fixed world within we live. If the pressures are relaxed, so is the concern about how we impinge on the environment. Population will then rise further until the pressures reappear with an intensity that can no longer be relieved."
That's a bold claim to make, but he offers no evidence to support it. Indeed, available evidence suggests that the claim is wrong; demographic transition has taken much of the world from high to low (or negative) population growth not despite higher standard of living but because of it. This is exactly the opposite of what Duncan is asserting as true and using as one of the cornerstones of his argument.
Like all past iterations of Duncan's argument, this one reads as an argument being made to fit a desired outcome. Indeed, that seems to be the main constant of his "Olduvai Theory": he has a desired conclusion in mind, and he keeps trying out different numbers and arguments in the hopes of finding some that support his conclusion. It's a deeply unscientific approach.
Hello Pitt the Elder,
Thxs for your reply. Yep, it is a theory, not a scientific law. But what do you think of the probability of his conclusions--it seems greater than 75% Thermo/Gene possible to me:
---------------------------
The Olduvai Scenario (Fig. 5): The U.S. SL falls by 90% from 2008 to 2030. The OECD SL falls by 86%. The non-OECD falls by 60%. The OECD SL melds with the non-OECD SL in 2030 putting the World SL at 3.53 boe/c in 2030. Conclusion 5: The World SL reaches the same value in 2030 that it had in 1930, giving Industrial Civilization a duration of 100 years.
Projections regarding the United States: (1) We will refuse to solve our own problems so Mother Nature will “solve” them for us. (2) Sooner or later industrial decline will cause population decline and, tit-for-tat feedback, population decline will cause industrial decline. (3) The U.S. population distribution in 2100 will look more like the rural geography of 1900 than like the urban geography of today. (4) Trying to stimulate – or even maintain – the present level of domestic demand of nonrenewable and renewable Earth resources will fail. (5) Multiculturalism will cause chaos during the transition to localism.
--------------------
I believe the key is full-on Peak Outreach [which includes pop control] for Optimal Overshoot Decline, and this is the entire thrust of my many postings. This could greatly help make it less worse than it has to be towards 2030 and beyond. But it is sure hard to get people's attention unless you are a President with a bully pulpit such as Carter's Sweater Speech back in the olden days.
IMO, a 90% USA SL reduction can be a relatively peace-able and do-able Paradigm Shift if we rapidly Kunstlerize, plus build out Alan's ideas and SpiderWebRiding. As posted before: wheelbarrows can be more powerful than a machete'.
I tend towards the fast-crash scenarios in beliefs, but I am working towards helping us all shooting the gap between a fast-crash and Archdruid Greer's grinding Catabolic Collapse.
I don't follow the Olduvai Theory for a slightly different reason. I think we need a better theory for oil depletion as an independent and isolated phenomenom. If we can nail this bit first then we can go on to model a more comprehensive scenario. IMO, we are not quite there yet.
It is very similar to climate change/global warming modelers who use their simulations to concentrate on mean temperature changes. They don't necessarily use the model to postulate on standards of living after a rise of temperature occurs. This is understandable as they have their hands full just getting the temperature predictions under control. I have the same feeling WRT Olduvai Theory -- I don't look at it too closely, as I prefer to work on the oil depletion by itself and try to get that right.
Hello WHT,
Thxs for responding. My intuitive viewpoint [might be wrong] is that the huddled masses can more readily perceive a decline in SL, therefore they would be much more amenable to Peak [Everything] Outreach versus the technical arcana of FF-depletion & climate change.
For example: my guess is that more people are aware of biotic extinction rates and the vast numbers of endangered species than the combined numbers of those aware of Peak Oil & Climate Change. Tv and other media seems to do a pretty good job of spreading this message as evidenced by the popularity of shows such as the Animal Planet, Nat Geo, Discovery, etc. People can emotionally relate to the loss of tigers, cheetahs, bats, possible future hunger, etc versus the obtuse nebulousness of Boe/Capita. People shoplifting honey, and/or stealing honey from beehives is a more concrete example of awareness of their SL decline. The rapid growth of gardening is another example of people seeking subconscious reconnection with their innate territoriality.
I agree that your great work on analysis and valuable additions of energy modeling is important to achieve future breakthroughs with top-level policy makers, but IMO: the MEGO** effect would kick in for most of the huddled masses because of our general innumeracy as explained by Dr. Albert Bartlett. Roadkill has an opposite response [we nearly all have to get a glimpse however brief], and I hope we can continue to detail this overall species decline trend as we go postPeak so that people cannot avert their eyes from what is actually occurring in real-time.
**My Eyes Glaze Over
You are exactly right. Yet I have veered toward the habit of only working on things that I can understand to the last detail. The dialectic trumps the rhetoric for me, and I will leave the populism to others.
Yes this is true. Some areas of the world have undergone a demographic transition and greatly increased their standard of living, greatly increased their education and even lifespans. So obviously all we have to do is bring the rest of the world up to the standard of living enjoyed in the West. Countries like Bangladesh, India, China, the rest of Asia and all of Africa needs to be industrialized. They need modern homes with modern heating and air conditioning. They need factories, they need high paying jobs, they need cars, they need trucks they need freeways....err...wait a minute.
Well hell Pitt, just how are we going to put the rest of the world through this demographic transition?
Ron P.
And the demographic transition has taken, in about 40 years, world population growth from a peak of approximately 2.0% growth per year to 1.1% or so. IMO, it better start doing a lot better than that.
More on the Demographic Transition. Duncan is mostly right and Pit is mostly wrong. No doubt that some who have raised their standard of living have also lowered their birth rate. However some countries like Saudi Arabia, Kuwait, Oman, and many other Middle Eastern countries have experienced a tremendous jump in population growth rate since their newfound wealth. Slightly higher fertility rates are only part of the reason.
And even in some countries where the fertility rates have slightly dropped they still are experiencing higher population growth. This is because of better medical care. Live birth rates are up. Women dying during childbirth are dramatically down, infant mortality rates are down, way down. And, last but not least, people are living a lot longer.
Saudi Arabia is a perfect example. They have a birth rate of 28.55 births per 1,000 and a death rate of only 2.49 deaths per 1,000. This is a dramatic change from the middle of the last century and all because of the demographic transition, that is the newfound wealth of their citizenry.
CIA World Factbook-Saudi Arabia
Ron P.
Darwinian,
I think I read some where that SA are using huge quantities of energy (mainly natural gas) for water desalination. Sustainable growth is this ?
If you're going to say that Duncan is mostly right and Pitt is mostly wrong, you should make some effort to quantify that claim. For example, what number of people live in countries where the demographic transition has taken place vs. where it hasn't. Putting forward Saudi Arabia as an essentially anecdotal example does not suffice to show that Duncan's assumptions are warranted.
What is "statistically invalid" about the Olduvai theory Pitt? Are you harping on that Simpson's Paradox bollux again?
I've called you on this before
http://www.theoildrum.com/node/4712/429446
Evidence is shorthand for convincing others one's idea is correct. It has no effect on the idea itself, which may be correct or incorrect, with or without evidence. Try replacing evidence with "balance of probability".
World population is projected to reach 9 billion by 2050. This projection may or may not be correct, but if correct, it seems to me much of the world still has +ve population growth.
You would be better off presenting the evidence than implying that Duncan doesn't need it.
"Balance of probability" is just a subcategory of "evidence". Analytic philosophers have tried for decades to agree on what kind of evidence warrants holding a belief (or idea), without reaching any consensus. Many follow Gettier in noticing that there is no type of justification that seems to lead to the truth on all occasions. On the other hand, the same philosophers have pretty much universally agreed that there is no virtue in being correct "by accident", and that instead one ought to have justification (aka "evidence") for one's beliefs, because this makes it more likely that they will turn out to be true.
It is furthermore meaningless to say that evidence has "no effect on the idea itself", since without looking at whether evidence bolsters the utility of an idea, we have no way of evaluating that idea's truth in the end. Kant pointed this out 200 years ago: that there is no purpose in postulating a type of objectivity that can't be examined subjectively, since we can't escape subjectivity.
If, as Pitt asserts, Duncan indeed has no evidence to support his claims, then I submit that it is unwise to pay much attention to Duncan's theory. That would just be gambling. Pretty much all thinkers on the subject would agree.
True, but it does not mean his claims are wrong. They may be wrong, but you have no proof they are wrong. If I saw someone punch a guy in the face and was asked to be witness, I have no evidence and I could not prove it occurred, but it does not mean that the guy wasn't punched.
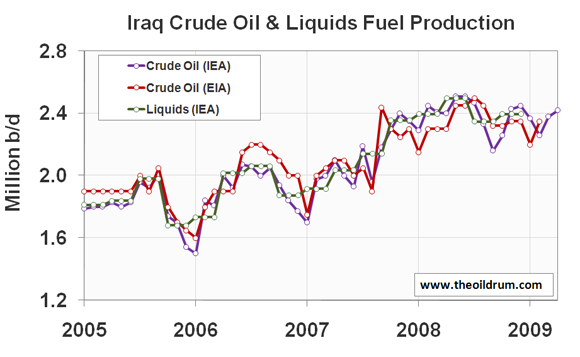
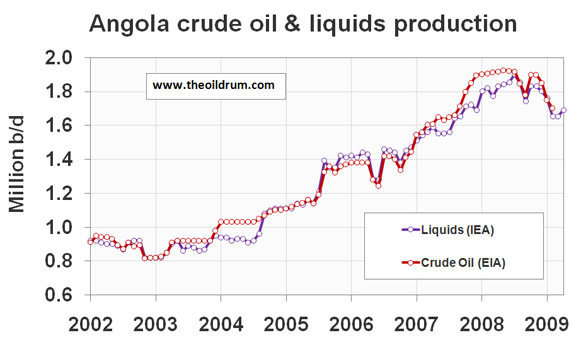
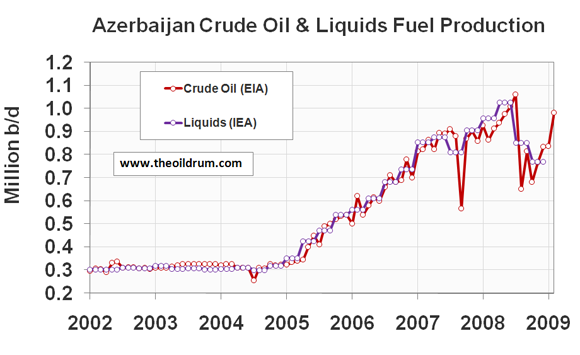
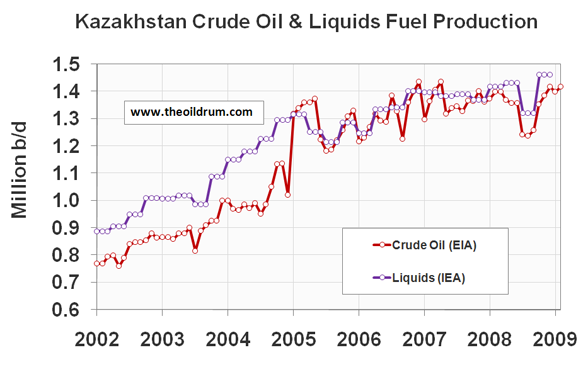
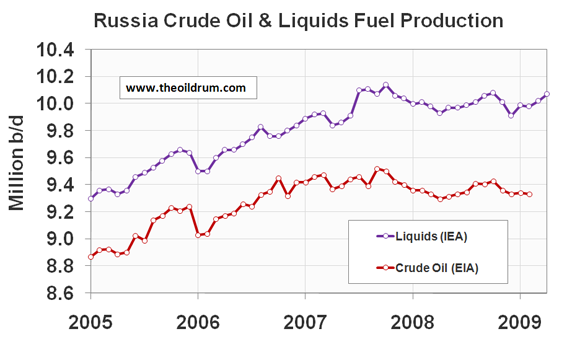
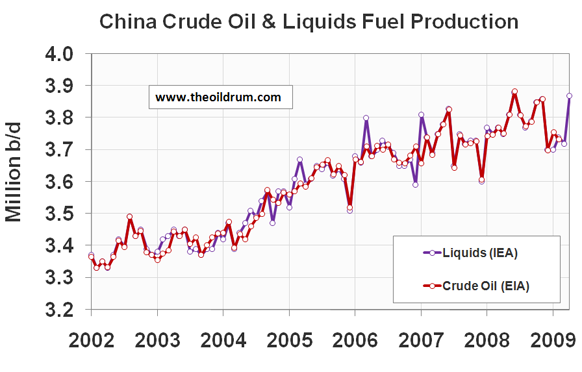
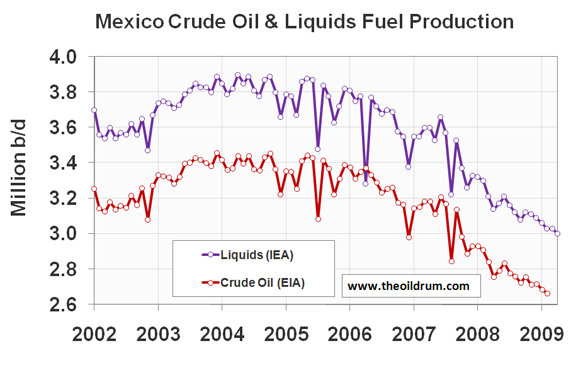
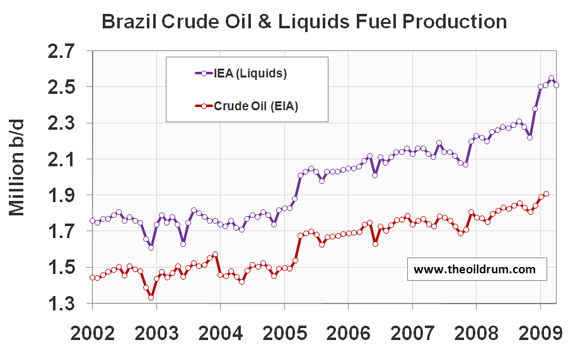
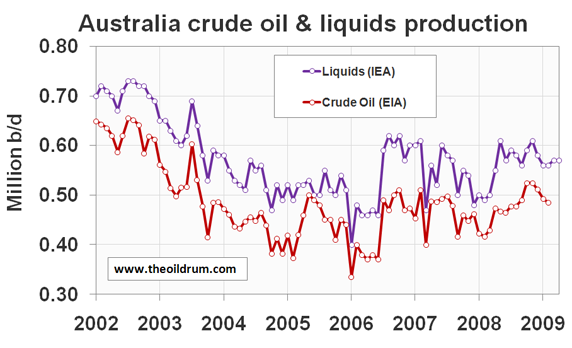
Operating from a Devils Advocate position, aside from a sharp decline in extraction from Mexico, and Nigeria (caused by militants) I don't see anything too alarming. Many of the countries shown are increasing production, like Angola, Brazil, China, Kazakhstan, and Iraq. Also, the Saudi's claim to be increasing production to 12.5 mbd. So is it possible that 05-08 was just 'A Peak', and there could be higher peaks in the future?
@Cslater8
You are basing this on the selective set of graphs in the article, not on the full assortment of 129 charts in the oilwatch monthly. There are many 'smaller' producers (below 1 million b/d) which face continued declining production including Argentina, Oman, Yemen, Syria, Indonesia, and Denmark. As well as some larger producers United Kingdom, Norway.
Also production in China and Iraq has not increased since the beginning of 2008. The recent uptick in Chinese production is due to IEA's common overestimate of the latest month for China (shown in Oilwatch Monthly's April 2008 editorial).
It is possible that there will be one more peak higher than the current july 2008 one, but it seems to be increasingly unlikely.
Read the entire report. 64 plus countries are in terminal decline. Saudi will never make 12.5 mbpd. When the world economy recovers, we will see the true picture of who can really produce oil. Now is a good time to get off of oil wherever possible. We have about 2 - 3 years left before the big decline starts. Since a lot of oil projects have been cancelled or put on hold, it may come sooner rather than later.
Thanks Rembrandt and Nowhwere for your informative replies. I shall seek a more complete picture based on all graphs.
Rembrandt
really great analysis
I was thinking about your export data and the problems you outline in getting accurate data.
I think this throws cold water on WT's ELM model, in that crude and refined products flow back and forth into and out of producer countries based on refinery capacity etc
Countries are not holistic entities that produce, refine, consume, then export the remainder, as the ELM would have us believe.
For the govt, who owns the oil, the oil is an asset to generate cash, which can be used as they see fit - i.e. to stay in power. Increasing internal consumption MAY happen, but see Venezuala and Nigeria, there is a strong chance that govt screw ups may mean that the population stays poor and the govt focuses on exports, not internal consumption, becuase exports generate cash.
So I think your analsysis shows, its a lot more complex than the ELM would lead us to beleive
There is absolutely nothing wrong with the ELM model from a logical point of view. If by throwing cold water on ELM that you are implying that it acts as a sort of "zero-sum" analysis of the situation, you may be correct. As oil gets exchanged between nations, things do indeed balance out. So, I think it is healthy to question whether ELM adds a lot to understanding the aggregate global oil production situation. Yet, ELM clearly has huge implications for the socio-political interactions between oil-producing and oil-consuming nations. You can't throw cold water on that aspect of ELM. I think WT places a big emphasis of that role of the model.
To simplify it even further, why should we expect major net oil exporters to show materially different net export declines from what we observed in Indonesia and the UK--two countries with profoundly different demographic factors, especially in regard to per capita income and rate of change in energy consumption? And even if there are some exceptions, what about the aggregate volume?
Indonesia went from their final production peak to zero net oil exports in 8 years, the UK in 7 years. Mexico and Venezuela are currently showing accelerating net export decline rates. Venezuela is going to take a little longer to approach zero than Indonesia, the UK and Mexico because their consumption relative to production, while increasing, is at a much lower percentage than the other countries.
These are some graphs Matt Mushalik sent me, showing only incremental changes in recent years using EIA data. This is a graph of world crude and condensate production, through February:
It indicates that the growing countries, shown at the bottom of the chart, are no longer growing by much - in fact they are quite flat. Recent drop-offs in production have been from a variety or sources--Saudi Arabia, and various countries that Matt categorizes as post-peak.
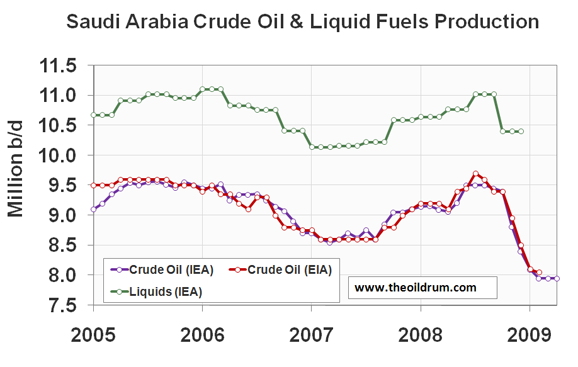
This graph shows OPEC production on a similar basis. It shows that the drop-off in recent production in OPEC is reflects significant declines from Saudi Arabia and Angola, with some smaller declines elsewhere.
Where are the straight forward graphs for world crude production? We have gone from including "liquids" to highlighting them to actually excluding the simple oil charts. Should we change the name of this site to "The Liquids Drum" and the movement to "Peak Liquids"?
The change for the last month looks statistically insignificant to me, particulalry given the high probability that they will be altered in coming months.
The Crude Oil (EIA) data is the oil data. IEA doesn't give data on that basis, so Rembrandt uses what is available.
The site is about "Energy and our Future", not "Oil" only.
Sorry to sound ungrateful. I just find the shifts in what is counted as being suspicious--more likely to obscure issues of "energy and our future" than illuminate them. We all know what crude oil is, even if it can vary a bit in quality. "Liquids" is so open ended as to be worse than meaningless, IMO. If it includes corn-based ethanol, then it is doing a kind of double or triple counting. If it includes more biofuels with better EROEI, then it is something less than double counting. If it is LNG, that's a whole different source with a whole different set of variables.
My gripe is really more with the agencies that put out these IMO intentionally obfuscatory data. I personally think we should not repeat them without noting the problems inherent in including "liquids" in these calculations, if we are going to report them at all.
@dohboi,
There are several charts in the oilwatch where the data is separated.
Took me about 90 seconds. Actually a bit longer because Imageshack is on the fritz, you get the idea.
Thanks, Dude. Your graph confirms my impression that we are on the other side of the curve, at about 2004 levels. Presumably we will be matching earlier and earlier years as we slip down the other side (unless this is just another bump in the plateau). It's a bit hard to figure this when the terms of comparison keep shifting.
Decline -4% now, -7% soon. Game over.
@Earnest Lux
The current decline is artificial due to OPEC production cuts. There will be at least one rebound between now and 2011.
How high would you guess that that rebound will go?
Rembrant, with due laymans deference to the crowd assembled:
I've taken a low pass filter to this graph, analysed the downslopes as an indicator - knowing that we are going into decline soonish, comment revised;
We have been in 1% decline since 2004, we are now in 2.5% decline and will go into 7% decline after the rebounds, by your timing 2011.
I know, my maths is bent, will try and get my scribbled on graph up tomorrow.
Looking through the Oil Watch Monthly PDF, I found several graphs of interest.
This one shows the weighted average price per barrel, in $ and Euros. The numbers don't look nearly as strange in Euros as $. The movement of the $ had a fairly big impact on prices.
This one shows Canadian oil production, including tar sands. I was told in 2008 that the failure of production to rise was the result of temporary problems, but it doesn't look like 2009 is doing much better.
This is a graph of Non-OPEC exports that looks strange to me. Is there any source of data showing which countries are supposedly increasing exports? Is there any chance the underlying data is wrong?
I don't think that export graph is, necessarily, all that strange.
1) As the "exporters'" economy slows they will have more to export (if their economy is slowing faster than their fields are depleting,) and
2) Brazil, and Indonesia are steadily increasing their biofuels exports.
Edit: Also, Saudi Arabia has increased its NGLs production by somewhere between .3 and .6 mbpd. This should, I would think, give them more oil to export.
I don't agree with the dollar vs euro graph for oil. Not that its not useful but I think the dynamics are to complex to be captured in a simple graph.
The question is are people holding dollars now paying more for oil than those that hold reserves in Euros ?
First and foremost you need to do the same thing with just Brent crude its real oil priced in Euros. Next you have various transportation costs that are non trivial and also of course different mixes of sources for the imported oil to various regions with different spreads vs the market price. Blending hides all of these factors and they are not small. The US used to have significant buying power despite weakening its dollar because of all the local importers around it. Mexico, Canada, Venezuela etc.
Whats interesting is if the dollar is weakening then at least for oil your generally better off most of the time holding your cash reserves in Euros and converting at the last minute.
The Euro is a strong enough currency that it has started to counter act the power of the petrodollar. Now of course if your converting you holding into Euros then this by definition puts downward pressure on the dollar as your using the Euro as a reserve currency. The Middle East actually uses more Euros than dollars for its imports exports so its a defacto member of the Eurozone. They are also generally more interested in Euros than dollars. Thus the dollar tends to get pushed out rudely when it weakens vs the Euro.
The reverse happens when the dollar is rising vs the Euro and you tend to get the Euro pushed down. So you also need the Forex exchange graph. And of course you can't leave out the Yen or other trading currencies. And these days you have no clue what kind of synthetic protection contract has been written to hedge forex changes.
Also from a macro economic view the relative strength of the Euro results in cheaper imports but more expensive exports vs the dollar thus its not clear if its and overall economic winner. Exporting economies generally want a weak currency even though it drives up import prices in exchange for increasing exports.
In general the EU has a tighter fiscal policy than the US thus when commodity prices start increasing what we tend to see is the Euro strengthening as its the one globally traded currency that acts more like a store of wealth vs the national currencies.
This is not because the Euro is great but because its a collective currency with its member nations having varying economic systems they simply lag in the race to devalue fiat currencies. By not being as fast as the sovereign nations with the printing press they get stuck as the defacto reserve currency when the presses start rolling and it tends to magnify overtime.
Rising oil prices tend to increase the velocity of money and ignite the implicit inflation that been caused by all the monetary inflation. The changes in flow of capitol are large enough that rising oil and even commodity prices can cause inflation even as the overall economy remains weak. I actually believe this will be the mechanism which will work to give the world the pains of inflation without the benefits.
Whats really interesting for the Eurozone is its going to either be forced to weaken the Euro significantly and potentially cause internal inflation or it will have to develop more internal trade at the expense of lowering trade with the US and China.
I'd not be surprised to see the Eurozone turn inward and allow the Euro to strengthen and focus on fostering trade amongst Eurozone members and defacto members like the Middle East and Russia. It makes sense for Europe to begin breaking the ties to the US and leverage the growing strength of the Euro to localize its economy.
@Gail,
As outlined in the Oilwatch itself, the exports graph is not based on a data source but computed by subtracting consumption from production in oil producing countries and counting the remainder as exports.
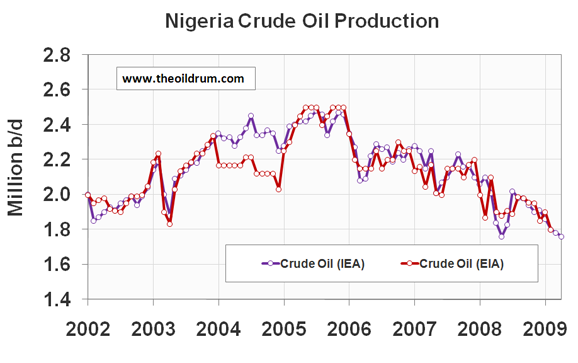
It looks to me like Nigeria has peaked.
I don't buy into militants being able to create such a consistent downturn in production.
Given the quality of Nigerian crude the peaking of Nigeria is important.
I wonder if the increased militant action is an effect, rather than a cause, of the lower production. With lower production, the government has less money (doubly so with the lower price). Not much money filtered back to the people, but what little did is now lower.
Good point if so Nigeria has one hell of a feedback loop if its really in decline.
Is it true that some still hold that peak oil occurred in 2005 (Deffeyes?) I know that different measures include and exclude different liquids. Would someone succinctly summarize current (though possibly conflicting) opinions are on what has peaked and when for the non-oil person? Maybe it's not such a small request.
One aspect of peak that I have been toying with is the idea that the discovery peak will have occurred at a fixed point independent of the grade of the crude oil. When prospectors discover oil there is really no way that they can distinguish between the quality of oil a priori so that all this goes into the same bucket.
However as we figured out how to get liquids from alternate sources, prospectors started to concentrate on other markers and the discovery peak for these alternate gets pushed further into the future from the crude peak.
When these two sources of liquid get put together, the crude component hits peak sooner, partly due to the earlier discovery peak and also due to better efficiency of extraction (i.e. higher decline rates). The alternate liquids will have a very broad peak that gets pushed into the future. This is partly due to the lower extraction rate and due to the discoveries generally happening later.
Bottom line is the first peak we have seen is the most desirable and most easily extractable crude putting it definitely around the year 2005. All the subsequent arguments about pinning down a peak concern possible plateauing and gaining lost ground by using the alternate sources. In either case, higher extraction rates seem a necessity to prevent us from declining too fast.
Thanks, WHT. You helped.
IMO, that is a clever thought process,WHT. Hope you can make a keypost out of it with your usual attention to statistical & graphical detail.
WHT
I agree 100% also there is a distinct segregation between land and sea resources.
This is obvious in the historical record. Also for offshore resources the viability of recovery at low flow rates is much lower than land resources.
And last but not least you probably have a local cherry picking effect the dispersive model is generally true but in any given year the best choices are favored over the worse ones.
This cherry picking is completely obvious in that the tar fields in Canada and Venezuela have been known since the 1950's or earlier but remained unexploited. Think of it as a sort of kick the can down the road effect as long as something better was available then the less desirable resources tended to filter out in time. So dispersive discovery and cherry picking can happen at the same time. The key is during the period that your thinking about exploiting a given resource other discoveries are made thus a poor prospect tend to be saved until last.
Btw this is effectively absolute proof peak oil is now. If we are exploiting the tar sands its game over.
I realize now that most people might not understand this.
WHT should get it in the time it takes to read the sentence.
And example is if you take a mix of differently sized stones and start vibrating the mix the largest stone will rise to the top. Local selection for the tightest packing results in long range order in the system. This is similar to the centrifugal effect.
http://en.wikipedia.org/wiki/Centrifugal_force
In a sense it looks like me and WHT have been arguing for a long time for no apparent reason it turns out all I'm saying is that long range order develops in the system even though it has local diffusion.
Not sure if I explained to the general reader.
The math is incredibly beautiful a fricking gradient forms on the time differential between discovery and exploitation. This is a long range order placed on a locally rand om system !
Locally random systems with a time differential in their actions spontaneously develop long range order.
Stunning hanging out on the oil drum has allowed me to solve one of the nastiest problems of complex systems.
Thanks WHT !
Just shake a bucket of sand pebbbles and gravel and you will get it :)
Try to explain again its just Hadley cells.
http://en.wikipedia.org/wiki/Hadley_cell
Oil extraction and indeed every complex system complex enough to have a simple time differential is capable of this sort of long range order.
Effectively what happens is if the feedback or response to a search is slower than the dispersive search patter new information can modify the response thus the time lag itself is sufficient to produce a long range gradient.
Local cherry picking eventually results in long range cherry picking thus when you finally scrape the bottom of the barrel i.e you don't know when you will discover the worst resource but once you do and its repeatedly deferred when you finally exploit it you know for certain your at the bottom.
The long time between discovery of the tar sands and their final exploitation absolutely in a mathematical sense means we have reached bottom. Beyond a shadow of a doubt its proved. Nothing mankind can do about it.
Sorry this is so basic I can't resist posting.
This implies that time actually does run forwards and backwards at the lowest levels Feynman path integrals are actually real. The reason time looks like it goes forward is because at the lowest levels it can and does go forward and in reverse. This creates a intrinsic gradient as time is effectively a thermodynamic quantity minimizing the change at a local level but resulting in irreversible changes shortly thereafter.
This delta is so absolutely basic that it not only can explain why our civilization is toast but it explains the flow of time itself. Its like calculus on steroids at any point in time all paths are taken an the one that minimizes the local change becomes real yet this ensures a long range gradient develops. Time is capable of bootstrapping the passage of time intrinsically simply because at the smallest of intervals it can and does run in both directions.
Don't know about the readers of the oildrum but I'm going to die a happy man.
I solved it.
Turns out the answer is 42 and 24 :)
Effectively its like a two mirrors with almost perfect reflection and a single photon.
I'm stating for a fact that if you take two mirrors that are perfectly reflecting with a single pinhole defect in one and inject a single photon that it will instantaneously pass through the pinhole defect in zero time. If you take two real mirrors and try the experiment multiple times you will detect the photons faster than the speed of light no matter how you average it. It will move through the space between the to mirrors and exit along the shortest path regardless of its initial injection angle.
Changing the injection angle will not result in a change of time at the detector.
You can do this with a laser and two real mirrors and you will see that regardless of the position of the lasers the first photon is detected within a constant time defined by the error in the experiment itself.
Offhand I think you may need so really huge mirrors or play some other games to pull it off in reality. For photons these mirrors might need to be light years across but you would have to game the experiment maybe multiple reflections to pull it into something that experimentally verifiable. I'd not be surprised for it to work that if you set up the perfect experimental conditions that gravitational forces would destroy the experiment :)
I have a hunch that mass itself prevents us from testing this.
Hello Memmel,
I am not the sharpest pencil in the box, so I am lost.
Imagine, for example, 0.0000000000000001 sec X 10 to the -100 power after the Big Bang. Are you saying that the speed of light had the capability to be 93 trillion miles in a year but the opposing mass was so huge that it was constrained down to let's say two inches as it had to push against this massive mirror by [tunneling and gradient sorting 100,000 miles into this mass before achieving reflection]?
The high reflective power of this mirror had to be time-gradient sorted over great distances to allow photons and other speedy forces to reach their mind-boggling speeds? and that this continuing reflective force is what is making the universe constantly expand not only in distance but time too? so that eventually a light year might be 100 trillion miles?
Hell, I don't understand what I just wrote--I am still lost!
Perhaps, an instantaneous change of direction has a time expansion component due to the necessary tunneling [gradient sorting] of a photon into a physical mass before it achieves reflection direction?
I am still lost!
Minor editing in bracket above to help clarify what I am trying to say, but I am still lost.
I don't know either. I do know that there is a relatively benign phenomena called phase speed or phase velocity where it can appear that something acts in what appears to be an instantaneous manner over large distances. This turns out to be all pretty pointless (and therefore benign as well) in that no information or energy is transferred over these distances. In other words it has absolutely no practical benefits.
The classic example of phase speed is a wavefront breaking on a beach. If the wave is coming in at an angle to the shoreline, you can follow the impact point as it travels along the beachfront. As the waves impact at a more and more perpendicular direction, the phase speed gets very high. The speed diverges to infinite when you get to exactly perpendicular. The phase speed is essentially k/cos(theta). Somebody would say that you can therefore exceed the speed of light, but you can't transmit information or energy this way so it is uninteresting.
To keep it on context, for oil depletion, there is an equivalent infinite phase speed example in an idealized context. Say you went from one barrel of oil left to none during a period of time. At the last instant the price of oil in a theoretical context would go to infinity according to some inane supply/demand curve. Again this is just divide-by-zero behavior and it doesn't transmit any useful info.
Let me know if that is the same concept that is being referred to, as alas, I am lost as well.
I am not sure how serious you are being here. But you just happened to describe one of our experiments. We have two nearly perfect mirrors, with one essentially given a pin hole. Experiments show that when we inject a photon, the time it comes out is random, with the uncertainty in the time growing with the certainty of the number of photons in the cavity. This is the energy/time heisenberg uncertainty. The photon does, as per QED ala Feynman, compute how to get out instantly. But the measurement of 'when' is random. Its pretty weird stuff, but how it pertains to time only going forward is a mystery to me. And it seems to be quite off topic for TOD.
These experiments test ideas of Quantum Electro Dynamics, Cavity QED is the subtopic. And its all part of a large field in physics called Quantum Optics.
Right
Generally its treated as one formalism but the key is that it sets up long range order in the system. I.e the system naturally forms a gradient. Looks like I made a small mistake yes the result is random not focused I have to wonder if both outcomes are not possible however. But the essence is the original information i.e how you inject the photon into the cavity is lost i.e it does not and cannot matter. I'm now not surprised the real answer is random :) But whats important is to get this random answer a long range gradient has been created in the system by this I mean the the physical system itself is incorporated into the solution instantaneously ala Feynman paths. Thus you get I don't know what to call it a probability gradient I guess instantly forms. Maybe call it the probability of a potential energy gradient forming. The system in a sense always leaks if it can and at the quantum level it always can. But the important point is this in my opinion intrinsically means that the system itself takes on long range order or becomes inhomogeneous or forms gradients how ever you want to explain it.
Its not off topic in the sense that the maximum power principle is often fostered as being and additional law for thermodynamics. Its more a result of if there is a gradient then you get a certain outcome. Thermodynamics is the removal of any gradient however given the above what I'm trying to say is the gradients cannot be removed they will arise spontaneously.
Take this example even the Big Bang the most homogeneous event we can imagine with a single force at a single point was not homogeneous this can be seen in the temperature flux in the microwave background thus even creating a universe fails to prevent the system from becoming non-homogeneous.
Thus concepts like maximum power are intrinsic because gradients are intrinsic i.e there is always some sort of probability gradient which I assume eventually results in a real energy gradient forming.
Complex systems become complex because they actually use or more correctly are these gradients.
Technically this means thermodynamics is rubbish but I probably should not go there :)
It works because as you noted the outcome is generally random in the experiment you explained. However as my big bang example shows the gradient can become real.
Take your example experiment if you pulse the photons into the cavity at a certain rate even though the time they take to exit is random at some rate your pulse time would show up in the output. I.e if you wait long enough between pulses your pulse interval patterns the data. At some point it becomes undetectable. Why ?
Say you take two of these cavities and tie the output of one as the input of the other and vice versa or think of it as a big loop of these devices.
Do they stay random or do they couple on some harmonic. Given I got the answer wrong the first time i.e its not instantaneous ejection but random I'm willing to argue I might get it right in this second case and suggest that the system will actually oscillate with a beat frequency. The frequency chosen is random but they will phase lock.
One has to wonder if the frequency is itself random I'd suggest that this itself has a probability distribution thats not smooth.
This is of course well know signal processing type stuff. A common example is feedback on and open mike.
Its not like we don't know all of this but I'm suggesting we underestimate the importance of these effects. In the case of the big bank our the creation of our universe the fact the system cannot be homogeneous eventually lead to us. At least from my perspective this is important.
The effect of dispersion on signals shows up in the (in)famous 1/f noise and also in the fat tails of TCP/IP latencies in imperfect (non-collision free) networks. These are both easy to explain w/o having to invoke Feynman path integrals AFAIC.
Correct but that does not prevent it from being fundamental :)
To be clear it not that we don't know this its that I don't think we understand its importance. Its really when you get into complex systems that this effect becomes really interesting what I like about trying to look at it this way is you really don't have any sort of division like you do with differential equations between the chaotic regime and stable systems. Temperature variations in a complex system of heated and cooled wires works the same way as with a simple two body thermal problem. For me at least it suggests its possible to bypass the trap of chaos by working in and information flow domain that might be solvable while the underlying real equation is effectively useless because the system is chaotic. This would only work if its really fundamental down to the basic level.
Selectivity effectively has to work like a physical force. Not that its application and use is not well understood but appreciation of the fact that it might actually be fundamental and thus offer a way around chaos is in my opinion new although information theory is moving forward rapidly it seems to the same conclusion.
Thus if it looks like a physical force acts like a physical force then it is one.
The Feynman path approach is thus the closest to treating selection as a true basic force just as important as charge.
I'm just going down that road to convince myself that its important enough that it might give us a way to solve really hard problems since unlike chaos all outcomes are not equal. In chaos theory as you change the initial conditions all paths are taken non are special. I'm of course suggesting that if you actually test the dynamics of real systems that they won't randomly distribute through phase space but actually cluster if there is a real selective force.
OK, then I will say that a Feynman Path Integral is just a pretentious way of describing a convolution over PDFs.
The problem here is we are using physics terminology in the context of what is straightforward applied probability. I devoured Feynman's lecture notes while in school, but am also a fan of the classic probability works by Feller and Cox and others.
LOL you can put it that way.
Yes in general one would expect that the real model will continue to be something like the shock model. Its just if the shocks are not discreet and have feedbacks and multiple possibilities exist that diverge in time etc then something else is needed.
In a real sense convolution over PDF's tends to shift the burden of the problem in a correct way but it still leaves the question open of what convolution and why ?
My opinion is something like Feynman path intergrals are import underlying the concept is really the believe that perfect knowledge exists somewhere in the system at the lowest levels the system itself perfectly understands its current situation and has already chosen its route.
Or job then becomes a matter of detecting and discarding unchosen routes. Theoretically the final set determined within the error of the system should not diverge.
It also suggest that to some extent if you have highly divergent outcomes and the noise in the data about the system is to high that some questions cannot really be answered early. And I think this is and important point. The statement that peak oil is a rearview mirror situation is really true. It can probably only be confirmed after the fact. We have plenty of predictions that span literally all possible paths so one will be shown to be correct however which one is almost irrelevent since you can't discard the other predictions ahead of time.
I'd argue that we won't know if we are going to have a fast collapse or a gentle decline until after the system takes one of these paths. If we had more perfect knowledge of the system then we might be able to determine which of these paths are taken. Right now both remain equally viable. Certainly we have seen a questionable increase in production in 2008 followed by a steep fall. Now the dilemma is whats real and why ?
The real evolution of the system continues to be obscured the only thing that seems increasingly certain is that it is reaching a decision point i.e we will know within a few years which of the paths is chosen.
Needless to say I think that the approach should be more of one instead of presenting a single outcome you should present a range of outcomes discard the ones that are reasonably false and limit the range. I.e follow Feynman's path formulation.
Then these decision points become clear i.e when the models differ and one can be discarded becomes clear. I think its increasingly clear that we probably have hit peak production for all intents and purposes. The shock of the price drop alone regardless of high fast or high prices rebound will ensure that future investment in oil production is muted. The current decline rates will soon ensure that we simply can't make it higher given any realistic numbers for later expansion of production.
Thus this price shock alone probably ensures peak is in.
However using your model the future evolution of oil production should be a flat to slowly rising production profile although we did not prevent peak oil we should have dramatically softened the short term decline rate in production.
My own model despite its lack of formal math has production continuing to crash this shock had a very brief effect and actually the hurricanes contributed as much as the economic crash. The world briefly had supply exceed demand enough to pool at best a few hundred barrels a few percent of the worlds daily production and production continues to fall rapidly.
On the demand side of the equation the system is hitting its intrinsic structural limits and demand flattens.
We have till now seen rising prices with slowly falling or flat production and demand falling or flat on a regional basis globally probably flat. Now if I'm right we are moving to a new regime with flat demand and rapidly falling production.
These two outcomes now diverge rapidly in time. It now becomes not a matter of years to see which is correct but down to a matter of months.
If oil prices increase rapidly real production has to be falling rapidly regardless of the official numbers. Your shock model in my opinion ensures that if its not then a real cushion now exists and prices should flatten and remain flat for years.
We shall see I have to support the fast collapse case as long as its viable we don't have a ground swell of support for it since its not rigorous. Whats important is not to argue over which model is correct but to look a bit further out and see that its really and issue of determining when a particular model can be discarded.
Even qualitative arguments are sufficient to discard a model most of the ones that claim ever increasing production increases for example can readily be discarded by considering the discovery curve alone you simply don't need a refined model to discount them.
Eventually you need perfect information to be predictive even if the remaining choices are highly divergent. This is not a result that you can get without following my approach. Lacking perfect information you can only determine points of divergence.
I still think that the Feynman Path Integral approach brings in the wave-particle duality unnecessarily into the discussion. Feynman stuck in an imaginary phase factor to stand for the effects of interference among the various QM-possible paths. The phase shifts accumulate over the different paths lead to a PDF of outcomes, with the most probable following the macroscopic principle of least action. The problem with quantum mechanics (QM) is that you don't really understand how it works unless you can take on a mindset of wave interferences, which corresponds to the uncertainty principle in action.
So please explain why you want to add in a exp(iS) factor to a regular stochastic convolution?
I would contend that if you cannot answer this under practical concrete terms, then it is just another heuristic that happens to match some observed behavior.
I think I should expand on what I said in my other reply.
Technically thermodynamics is incorrect.
Consider this simple problem.
Take a body at temperature T1 and a body at temperature T2 and put them in thermal contact.
Thermo says that the new system will take a temperature T3 thats T1 > T3 < T2.
Thats technically wrong. The right answer is if you have a body with the random temperature flux averaging to T1 and one with its random flux averaging to T2 and put them in contact
they will instantaneously know that the average of their random temperature flux should now be T3 ala QED. Thus they will set up local gradients to accomplish this averaging and exchange random flux until the average across the system is T3 or more correctly until you no longer know the original temperature difference.
So what actually happens is the original signal i.e the existence of a T1 and T2 becomes lost and you have no idea why the system is at T3 you no longer can extract what the original temperature difference was.
Again if you apply temporal order i.e you rapidly bring two systems in contact then break the contact you can until some point extract information about both systems.
The information flow ala long range gradients are in my opinion more important than the change in the physical variables even though we generally ignore it.
I don't know about creating long-range order. I use dispersion mainly to understand "fat tail" behavior. Any long-range order goes to zero, albeit much slower than a declining exponential.
I know that long-range order is one of those Holy Grail quests that many a solid-state physicist and material scientist engages in. The key to this goal is that discovering a new kind of long range order will manifest as some desirable behavior. This could lead to something important like new superconducting or magnetic properties.
That a particular kind of order shows up here, I am not really convinced. Especially since most of the long-range order behaviors are spatial and you are suggesting a temporal variation. In that case are you suggesting long-range oscillations in time?
Yes there is a temporal order that set in because the time between when a field is discovered and when it is produced is finite. Most approaches to peak oil simply time shift discovery forward by some delta but I'm arguing this is intrinsically incorrect and misses one of the fundamental aspects of the system.
Lets say I'm and exploration company working in to geologically distinct regions doing discovery. I discover X number of fields over say two years. The production company I'm working for has my discoveries in hand and in year 1 they start planning to exploit one of my known discoveries. In year 2 while the production plans are in the early stages for the discoveries found in year 1 we discover a really good field. What happens is the order of exploiting the fields gets reordered a field discovered later in time is exploited before a field discovered earlier. This short term temporal order or actually reordering of the exploiting of fields vs the discovery time eventually is selective i.e you do cherry pick.
I can give a very simple example.
Take a deck of cards lets assume is a random mix of say ten decks of cards.
Flip through the deck and only extract the red cards. Eventually you sort the deck into two piles of red and black cards. If we assume your only allowed to know if a card is red or back and we make it even harder and your not allowed to know when you sorted all the card i.e you don't know how many cards are in the deck so you don't know when you cycled through it then you don't know when you sorted out all the red cards but you did it.
The point is this temporal selection or short term selectivity eventually results in long range order imposed on the system. The outcome as I showed in my simple card picking example is dramatically different from randomly moving one card between two piles. In my example the system becomes sorted.
Thus its actually intrinsically wrong to model oil extraction as time shifted discovery since this hides the build up of long range order or selection in the system.
If discoveries are selected at all even over a short time span then eventually the system will naturally sort itself. Eventually of course this has a profound effect on the future time evolution of the system. In my card deck example local sorting works to make the probability of getting a red card drop regardless of if we know it or not.
Our lack of knowledge about the outcome does not change what we really did.
Thus this steady local temporal reordering of discoveries that allows you to choose to develop a discovery found later i.e local reordering actually leads to global sorting of the entire system in time.
Its simply incorrect to do simple time shifting of discoveries and thus you get the wrong answer if you do it. Given the time lag between discovery and when your committed to develop a resource is large i.e it spans several years say 3-4 if not more the filtering is not small and certainly not small over time as dispersive discovery proceeds. And to be clear you don't need to be aware of how much you have sorted the real system thats not required I'd argue for oil we obviously have imperfect knowledge of whats happened but its not critical.
The reason its fundamental is because your effectively able to go forward in time in a sense because between discovery and development you can see any new discoveries made before your committed your not working blindly making a discovery and simply putting it into production at some time X later. The fact that you effectively know the future ensures the system is sorted.
You make it sound as if the time-shifting of production from discoveries has to be deterministic. In the particular case of the Oil Shock Model, shifts are always stochastic. Saying a shift is (for example) 5 years in the model, will immediately transform this to a mean of 5 years with a standard deviation of 5 years, resulting in a damped exponential PDF of time shifts over a range of exploited fields. The shock model is the only model that even starts to appreciate the fact that the production does not follow a deterministic track. For example, the conventional derivation of the Logistic is completely deterministic.
Further, if I could pick one thing out, the stochastic time shifting of production actions from discoveries is the main premise behind the oil shock model. The technique of convolution is the mathematical tool behind getting the result correct when you have a dispersion in discoveries.
Memmel, I have no complaints about the discussion you are having but you are essentially reinforcing everything I have tried to say, but in a backhanded kind of way. The sorting that you are describing in a way is dispersion, but it is dispersion in the way that different sizes of particulates in a creek travel downstream. Yes you can say that bigger particles such rocks move slowly along the bottom and the more finely particulated silt goes much faster, but my point is that the statistics of most of these systems almost always work out this way. It really does not matter what the physical manifestation of the process is, some things just naturally pick up faster and some things move along more slowly. The fact that offshore fields have a higher latency than onshore fields just makes them a part of the statistical mix. And this was my original premise, and one that I will happily repeat each time.
If people want to extend this model to make it even more representative of reality, I think it would be neat. But, as of now, I am the only one besides Sam who have played around with this concept. Of course we can try and mathematically model this all by ourselves, but oftentimes one can make lots more progress if other people get their hands dirty.
Sorry to be clear your model is perfectly capable of what I'm saying. And yes to some extent you have addressed the issue.
But how do you quantify quality or this selection issue for the model ?
Land vs Offshore is obvious the delay in producing the tar sands is obvious but the heart or meat of the process is far from obvious most of the issues are not at the extremes like pebbles vs sand but more in grades of sand.
It is fairly clear to me that any selection pressure no matter how small changes the eventual outcome. We do have some information of barrels per feet drilled for example.
Costs per well etc.
Brute force drilling of more wells and developing more sophisticated methods can obscure the selection process for some time but it does not prevent it from occuring.
Looking here ..
http://en.wikipedia.org/wiki/Athabasca_Oil_Sands#History
Discovery loosely around 1888 you can make a case for strong development finally starting in 2003. A 115 year lag between discovery and development.
What about lesser cases whats the selection process how prevalent and then whats its longer term result ?
Just because its probably very important does not mean its trivial to quantify it.
You can read things like this.
http://primesourcepetroleum.com/riskcategories
This hints that deferred production of existing resources even to the point that they had wells drilled was at one time prevalent. What are the implications of this ?
I'd suggest it points to extensive selective pressure on how we have extracted petroleum. But what are the numbers ? How would you put it in your model where is the data we would need ?
Given the data we have I'd suggest you have done and admirable job. I've played around a bit and come up with what I think is a decent factor for this effect that I generally call the technology effect of probably a 25% deviation from symmetric production.
I.e if perfectly symmetric production peaks at 50% URR then if the selection effect is real we actually hit peak production globally at 75% URR. I've guessed it a bunch of different ways. The critical result is that most of the reserve additions are probably not real in the sense that this oil if its produced at all will be produced in a long tail at very low production rates. If this oil exists and if its extracted at all will be left to a civilization quite different from ours with different reasons to extract it. Its not correct to claim it in our reserve base. And it gives way to rosy a view on the future production profile.
But this is just a guess I think a good one but its not hard science. Yet if you look at my argument and look at all the data the data you can get access to they offer compelling support for this thesis. However its not enough to quantify the effect.
Thats fine as a first approximation and given the data we have its probably all we can do but if its not a stochastic process but a highly selective process then the results can diverge significantly over time. Thats all I'm saying. I'm just saying the error versus how production actually unfolds can be large my best estimate to date is 25% off.
You can for example look at Mexico and despite the claims given what I'm saying they are toast they will never develop their remaining oil reserves but the production rate is to low to make it compelling. And by never I mean never with their current society they will collapse first. The world is in the same exact shape as Mexico for exactly the same underlying cause oil production was and has been highly selective for decades.
Can we prove it ?
Dunno..
But I'm comfortable is pointing out that our current best model is probably wildly optimistic.
The reference that you blockquote is one qualitative view. All these bits of info are available and all one needs to do is piece them together in a quantitative srochsstic model. Continously amazed why no one else comes close to trying such an approach. Every once in a while I have to say this in case someone comes out of the woodwork, and references some obscure Sino journal from 1931.
Well looking back here since we have discussed this numerous times.
http://www.theoildrum.com/node/4171
And in particular here ..
http://www.theoildrum.com/node/4171#comment-368752
And assuming similar reserve growth/ disscovery situation applies globally even though the data is heavily contaminated.
If you look at historical oil production then in the 1980's with the sharp change is slope of production we have a gap open up where future production is brought online slower thus selective exploitation of discoveries is possible. Once you get ahead of the discovery curve because of lower increases in the rate of production and steady technical progress you stay ahead.
Actually the low oil prices through the 1990's make a lot of sense its not because we where swimming in oil but because we could delay bringing fields online until above ground conditions made them profitable. Continued discovery thus acted to add to the backlog and of course the technical advances are not limited to new fields but also applied to existing production.
All that really happened with because the production rate slowed down it gave us the wedge if you will to ensure we could exploit oil at relatively low prices.
As always I find the backdated reserve increases highly suspect given new discoveries dropped quite quickly we will soon see how much of that was just the super straw effect.
Also of course the oil shocks in the 70's and 80's probably spurred a lot of this technology advancement in both extraction capabilities and conservation to give us this wedge.
You can look here.
http://www.embarq.org/en/news/08/07/21/too-expensive-ignore-the-real-sto...
And see that a number of interesting events happened in the early 1980's.
My opinion on review remains the same we did not do what we claimed we did through the late 1980's and 1990's in a sense we simply rode the selective production wave until it ended. About 2000 or so.
On your own website you mention how good recession are for delaying peak.
I think that what this boils down to is that a recessionary shock is not simple it lowers immediate consumption but then it also allows technology and discovery to get ahead of the demand curve by a significant amount. So it adds a sort of positive shock well into the future after the recession is over.
But its really a false success because whats really happening is we are rapidly depleting our most accessible and easy to produce oil reserves as the overall discovery real discovery curve goes well into the past even as we had a short term glut of known discoveries that was sustained. The rapid change in the rate of increase of demand gave us almost 20 years of a free lunch that was probably poisoned.
So what your saying is in a sense more correct than you realize. Not only are recessions good but they set the stage for even more powerful shocks later in time.
They are too good :)
It doesn't count if TOD is the only place discusses the topic. That's a given and it's why we are exploring this stuff in the first place. The challenge is still open to find another research effort that parallels this effort. One applied mathematician in France, B.Michel, is doing some probability modeling but he is taking it in a different direction.
http://www.math.u-psud.fr/~michel/Article_Modele_Hubbert.pdf
Anyone that wants to do a comparative study is advised to look at Michel's work.
Very interesting line of thoughts.
That leads me to think, something like gaining energy with Maxwell demon could be possible.
I doubt it because the system will always ensure the laws of thermodynamics are met.
You do get a sort of result that if nothings exists something will exist but once something exists you no longer can create something from nothing :)
Effectively its a one shot deal you get to create a universe then your stuck with its laws.
I think it has a lot more to do with time which is the essence of the universe than with the physics of the universe. I think this is why relativity is so hard to integrate into quantum mechanics because it contains information about the universe itself that quantum mechanics uses in a different way. In a sense at the smallest quantum level our universe does not exist i.e quantum mechanics transcends the particular universe its embedded in.
Yet the time evolution or details of time which are our universe determine the form of quantum mechanics allowed in our particular case.
This our universe exists on a larger timescale then quantum mechanics and its really a sort of time filter on quantum events below this level there is no time and no real universe.
If I'm right then you never will get quantum gravity since its not a quantum phenomena but a time filter on quantum events outside of the realm of quantum mechanics.
This is really all I'm saying that the universe limits the timescale if you will when time is capable of running forward and backwards and this implicitly limits the scale of other variables. The universe basically forces quantum systems to collapse in a finite time. If the quantum particles refuse to do it it will create a energy gradient until they do. This is also why we see hints that parts of quantum mechanics work faster than the speed of light.
Its however not real because its below the granularity of our universe only the outcome is real and thats standard old physics.
"Locally random systems with a time differential in their actions spontaneously develop long range order."
This is something like what can be seen in language change. Do you have a reference for this, or did it just now bubble out of your very fertile brain?
Well self assembly of microscopic systems is and example. Crystal growth is the perfect example.
Otherwise I guess fertile brain effect.
And to repeat its not that we don't know this its just I'm asserting we don't attach enough importance to the phenomena. In complex systems it become effectively a law on par with any other physical law.
Onshore production globally peaked in 1982. If that doesn't convince folks that oil is finite I don't know what will.
Did not know that but yes the fact that onshore production peak was distinctly before overall peak suggest that the segregation is both real and significant.
What we don't know is how big. Given what you just said its undoubtedly big.
I of course have all the long been saying implicitly that its huge I just now think I can explain explicitly. Thus the global production profile has to be asymmetric given what you just said probably significantly so. 2009-1982 = 27 years. This implies that selection pressure actually is greater then dispersive discovery. We sorted out all of our land based discoveries and developed them till they peaked well before overall peak.
I.e simple time shifting of discovery cannot give you the right answer.
Now I'm not sure how this effect EROEI but it suggests that EROEI probably also changes in a non-linear way.
You cannot simply average in the EROEI of land based production because its past peak i.e its contribution is declining more rapidly then a simple average would suggest.
In fact I'd argue that you also get the wrong answer for the same local selection effect reasons. EROEI calculations suffer the same flaw as time shifting discovery. Simple averaging is not the right way to calculate EROEI decline.
I think you should be able to do this with North American NG production. If you split out the decline of traditional source vs UNG and do the EROEI estimates individually over time then the real effective EROEI in the future is actually much lower than simple averaging implies as the high EROEI sources are declining at a faster rate vs less desirable sources. These rate differences caused by my selection process imply that EROEI can go down much faster than a simple averaging implies.
Basically the time it takes to go from 40:1 to 20:1 to 10: halves at each interval.
Say it took 30 years to go from 40:1 to 20:1 well you go from 20:1 to 10:1 in 15 years and 10:1 to 1:1 in seven years. You hit the wall so fast that you can't expand development of the lower EROEI to overcome this.
I think this is why I have repeatedly implicitly rejected alternative energy scenarios.
Your trying to expand a low EROEI solution say 2:1 with your current base falling rapidly from 10:1 to 1:1. Its impossible to make it if you will since you run out of energy from your original source well before you can expand your alternatives.
I'd argue that you Nate Hagens could prove we absolutely cannot make it :)
It makes a sort of basic sense that we would have had to recognize this and bring in alternatives much earlier in the decline curve such that they could wedge in if you will. You actually don't have much time between when EROEI starts to decline and when it becomes impossible to develop less desirable alternatives.
Now I'm not all that sure how useful it is to prove beyond a shadow of a doubt that your dead :)
Its kind of like setting in a speeding car heading for a brick wall and figuring out the time of impact right before you hit the wall.
Hey if we keep going at this rate we are going to hit the wall in .... smack.
The '05 date is *temporarily* supplanted, but I wouldn't bet against it yet. Crude oil production on its own (not including other liquids) has a new peak in 2008 (check out the chart posted above by the dude), though I am hesitant to say that's a new peak until the EIA finalizes their data. There have been too many down-graded revisions in the last two years for me to quickly trust their new production numbers...
Trust in the sense of subprimed is contained type trust ?
http://uk.reuters.com/article/marketsNewsUS/idUKWBT00686520070420
If there is one fact I have gleaned from my fascination with the collapse of complex systems its that people that place their faith in the "official" number when a system is on the verge of collapse are 100% wrong.
I cannot say that I can figure out the right answer the distortion caused by the official response in and of itself makes that difficult. I have no problem admitting I can be wrong but I'm absolutely certain the "official" number is wrong.
Exactly. :)
Sorry, but your doing apples and oranges. What he specifically said was
but you are talking about all crude.
I.e, he's correct. The peak for easily extracted, high grade oil was and forever shall be 2005. Perhaps the only absolutely indisputable fact of Peak Oil other than the simplified point that, as a finite resource, it will peak.
The only possible caveat to this would be if in a very short time from now (say, 5 years?) Iraqi oil (supposedly a lot of sweet crude?) went to 6mbd AND the KSA decided to screw their fields up really badly and accelerate Gawar extraction, then you could get another geological peak, but neither is going to happen.
Iraq is still unstable and will be for years and the KSA is already on record with a conservative, long-term approach to their fields.
Say bye-bye to light, sweet crude peak.
Cheers
No, not apples and oranges--please check the chart I referred to. I was specifically referring to crude oil production, NOT aggregated liquid figures. The new peak for crude production is 2008, but I am very suspicious of that number considering the EIA's penchant for down-grading recent production numbers over time.
Dave, My "Beyond Oil" book by Deffeyes is in deep storage, but here is my recollection. Deffeyes used a variation of the logistic function to estimate the world URR. (this method works reasonably well for smaller, geographically homogenous regions). In it he calculated world URR of 2.1? trillion barrels. He then calculated how much had been used and interpolated we crossed 50% of that amount on Dec 16, 2005 (somewhat tongue in cheek). Therefore Deffeyes was never forecasting the month or year that oil production would peak and subsequently decline, but when we would have used 1/2 of the recoverable. Logic might suggest these happen at the same time, but technology and high prices probably made the 50% URR point come before the maximum production month/year.
From the (very old) post Peak Oil -Whom to Believe CERAiously:
After finding that I would trust that explanation more than what I wrote above. It's funny. I analyzed these distinctions 3-4 years ago and now see them as relatively unimportant. Far more urgent is figuring out how to align our wants and needs with our budget in time. And some of us have gargantuan perceived needs...
Hey people i make a ad to help poor people from climate change!... see the video and send it to all the people you know, together we can press the world leaders. See the video and send please!!! this is the link: http://www.youtube.com/watch?v=hHRYCjStKr8 (give 5 stars) together we can help!!... thank u very much
...
Hey people i make a ad to help poor people from climate change!... see the video and send it to all the people you know, together we can press the world leaders. See the video and send please!!! this is the link: http://www.youtube.com/watch?v=hHRYCjStKr8 (give 5 stars) together we can help!!