| Fuel theft explodes in Portugal | The Oil Drum: Europe | Mainstream Dutch analysts foresee oil supply constrained world |
Forecasts on Saudi Arabia liquids production
Posted by Luis de Sousa on July 29, 2008 - 9:45am in The Oil Drum: Europe

This is a guest post by Jean Laherrère
Acronyms
CP – Cumulative Production
U – Ultimate (Recoverable Reserves)
1P- Proven Reserves (95% probability of being produced)
2P – Proven + Probable Reserves (50% probability of being produced)
3P – Proven + Probable + Possible Reserves (5% probability of being produced)
E&P – Exploration and Production
Introduction
Reserves reporting in Saudi Arabia (SA), being unaudited as all OPEC reserves, are mainly political as confirmed by Sadad al Husseini (former VP of Aramco) with the 300 Gb referenced by OPEC being just a speculative number and not a proved one. Field production data are confidential, except for a few publications by Aramco to reply at Matt Simmons book “Twilight In The Desert”.
IHS is obliged to follow Aramco's reporting and has increased cumulative oil discovery from 313 Gb in 2004 to 395 Gb in 2006. It is difficult to check field reserves estimates with oil declines, because of production quotas and incomplete data, except for Abqaiq which was reported by the end of 2003 as being 73 % depleted (CP = 11.8 Gb or U = 16 Gb) .
Abqaiq's oil ultimate is about 15 Gb when calculated from the decline profile, when Baqi reported 16 Gb in 2004, Saleri 17 Gb in 2007 with wishful EOR. IHS reports 18 Gb (30 Gb OIP) in 2008 (plus 0,5 Gb condensate), but in 1993 was reporting 15 Gb. Old data (before the quotas fight) seem more reliable.
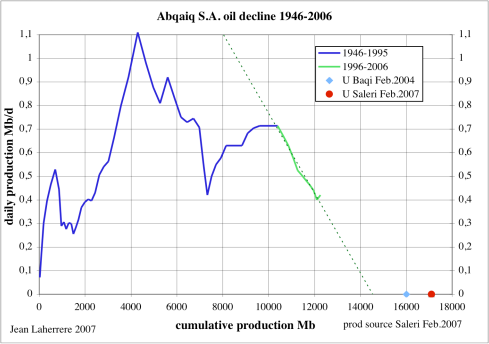
Figure 1: Abqaiq oil decline 1946-2006.
Old and new estimates
In the book Aramco and its world published by Aramco in 1980 before nationalisation, Saudi Arabia proved reserves were reported to be 113 Gb and probable reserves 65 Gb, with cumulative production by the end of 1979 being 38 Gb. 2P discovery was 216 Gb for Aramco in 1979. Since then, discovery have been negligible, as shown by the creaming curve (cumulative discoveries versus the cumulative number of New Field Wildcats - NFW). The first 40 NFW (1935-1968) found 360 Gb in 22 fields while the last 40 NFW (1994-2007) found only 6 Gb with 33 fields! From IHS data, the oil ultimate is about 400 Gb and natural gas ultimate about 65 Gboe (= 400 Tcf). Recent natural gas exploration by IOCs has been dry (6 NFW) and Total has withdrawn.

Figure 2: Saudi Arabia oil & gas creaming curve from IHS data 1935-2007.
Aramco (Baqi & Saleri 2005) reported as of end 2003:
All of this for an oil in place of 700 Gb. Saleri seemed to have forgotten that contingent resources are potentially producible one day and he assumes that all oil will be produced without leaving one drop in the ground (!) when the range is from 99% to 5%.
Aramco discovery as of end 2003 is then 2P 391 Gb, giving an increase from the 1980 estimate of +175 Gb, mainly for political reasons, because of the quotas fight.
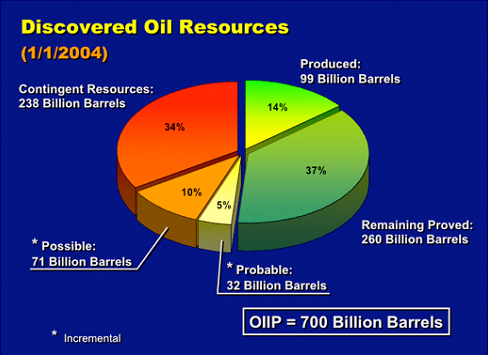
Figure 3: Aramco (Baqi & Saleri) reserves as of end 2003.
IHS was obliged to accept Aramco's field estimates and reports 396 Gb at the end 2007 . But Sadad al-Husseini (VP of E&P) when retired in 2007 stated that the 300 Gb proved reserves increase from 1985 to 1990 by OPEC are based on speculative resources and that Saudi Arabia's increase in 1990 was 90 Gb. In 1980 Aramco's 2P reserves were about reported 1P.
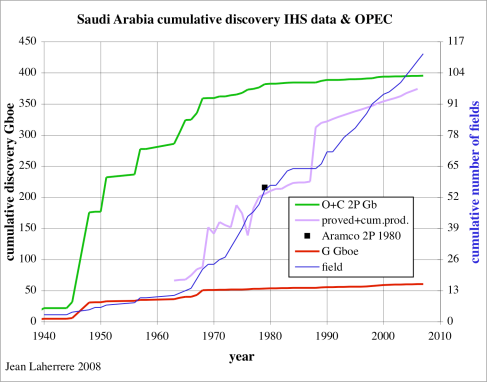
Figure 4: Saudi Arabia oil cumulative discovery and remaining plus produced.
What is the real ultimate?
Colin Campbell estimates Saudi Arabia's ultimate to be at 275 Gb. Production linearization is not reliable, ranging from 180 Gb to infinite depending on the selected period. The plot is linear only if the pattern is logistic but this is not the case because of above and below ground conditions.

Figure 5: Hubbert Linearization from OPEC production data.
Oil production seems to have been pushed very hard with new drilling. The comparison between oil production and number of rigs seems to show that oil production is at the peak, despite that the new drilling could be the redevelopment of fields like Khurais and Khusanyah.
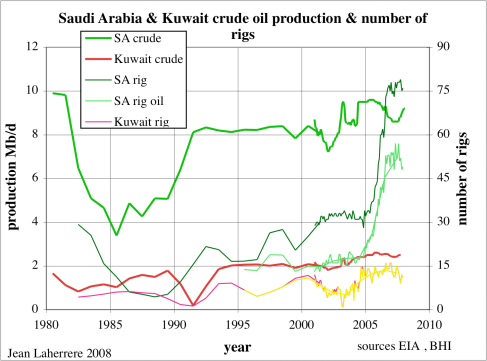
Figure 6: Saudi Arabia and Kuwait oil production and number of rigs.
Anyway King Abdallah has declared that, if new fields are discovered, they will be kept for the next generation.
I am inclined to choose 250 Gb for the oil ultimate with 110 already produced as of end 2006. Colin’s 275 Gb seems optimistic and the maximum is 300 Gb, far from IHS 400 Gb.
But there are also NGL (natural gas liquids, reported as natural gas plant liquids by USDOE/EIA) and it is hard to forecast NGL production which increases more than crude oil because it is outside OPEC's quotas and Saudi Arabia has high needs for gas (in water desalt plants).
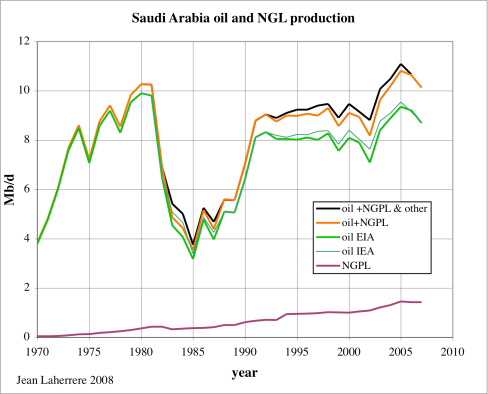
Figure 7: Saudi Arabia Crude Oil and NGL production.
Natural gas (NG) production data varies with sources. The ratio Mb NGPL to Tcf NG seems stable at 200 Mb per Tcf during the last 20 years.
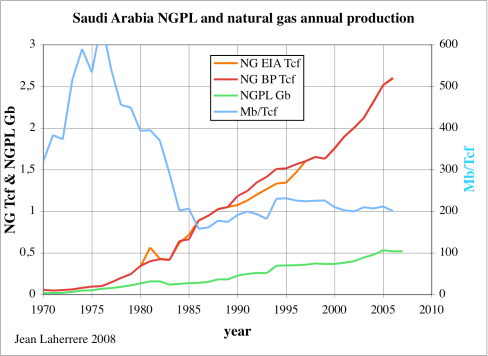
Figure 8: Saudi Arabia NG and NGPL production.
If the NG ultimate is 400 Tcf (assuming no overestimation as for oil because there's no quotas), the NGPL ultimate is about 80 000 Mb (400 x 200) or 80 Gb. The ultimate for Oil + NGL could be about 250 Gb + 80 Gb, rounded to 300 Gb.
Crude Oil+NGL production (CP 2007 = 122 Gb) is plotted assuming a plateau up to 2020 and a decline of 3%/a after 2020 with a 300 Gb ultimate, but the big problem is domestic oil consumption which is increasing with population. The oil consumption estimated in Figure 14 is plotted as the volume of production less consumption available for export, which could be zero in 2050.
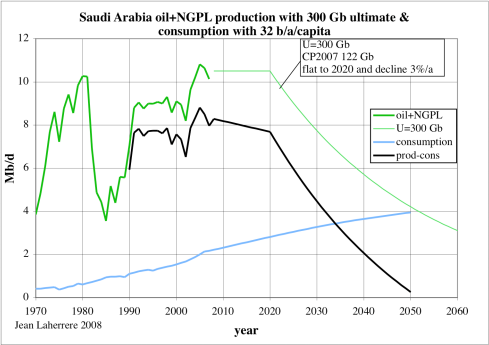
Figure 9: Saudi Arabia oil and NGL production forecast & consumption.
Oil consumption is plotted, estimated from population forecasts (UN 2006, USCB, PRB = population reference bureau) and per capita consumption.
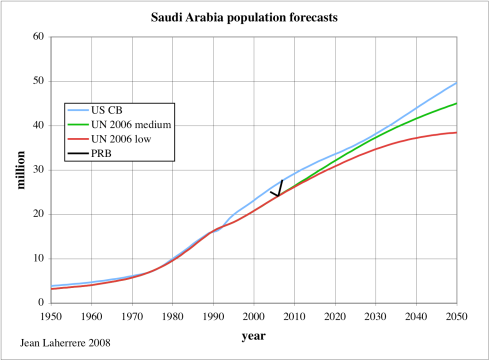
Figure 10: Saudi Arabia population forecasts.
Population forecasts are based on fertility rate forecasts, but Saudi Arabia's fertility rate is badly reported.
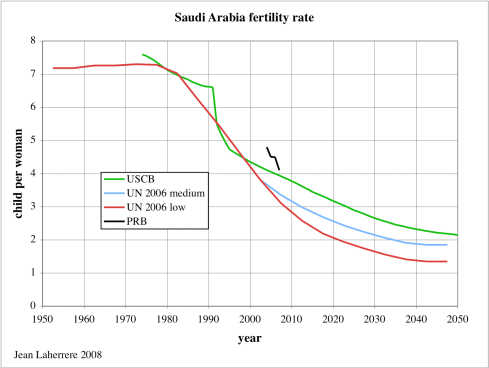
Figure 11: Saudi Arabia fertility rate.
Oil consumption per capita was about 25 annual barrels, but it has increased lately to 32 b because domestic gasoline price is well below the normal price: in 2006 gasoline was 0.16 $/l compared to a normal price of 0.58 $/l (USDOE/EIA study).

Figure 12: Country by country 2006 retail gasoline price versus cumulative oil consumption.
Oil consumption for the producing countries where gasoline price is well below the normal price increases more than the world's mean, meaning that their exportation will decrease rapidly.
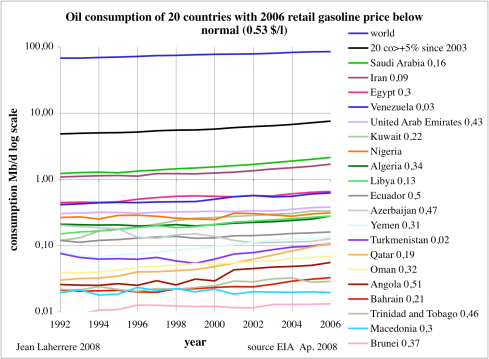
Figure 13: Oil consumption in 20 countries where 2006 retail gasoline price was below normal.
Saudi Arabia domestic oil consumption could reach 4 Mb/d in 2050 if consumption per capita stays at the present ratio of 32 b/a, but it has to decrease because Crude Oil+NGL production will be at this level (Figure 9).
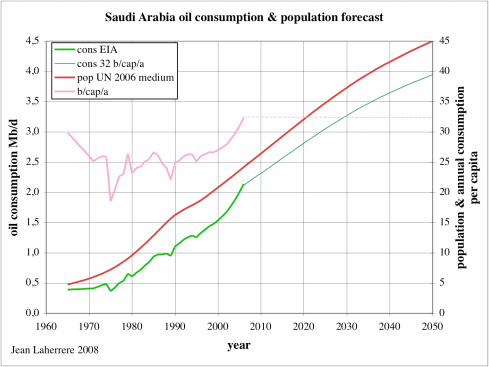
Figure 14: Saudi Arabia oil consumption and population (UN 2006 medium) forecast.
Conclusion
There are many uncertainties in liquids forecasts mainly because of the poor quality of the data for production and population. Saudi Arabia should improve the quality of these data in order to manage the coming crisis. Saudi Arabia could stop exporting oil in 2050 meaning that they will be in trouble to finance their budget.
Furthermore the world needs to know that Saudi Arabia cannot fulfill the wishes of many countries in increasing their oil imports.
CP – Cumulative Production
U – Ultimate (Recoverable Reserves)
1P- Proven Reserves (95% probability of being produced)
2P – Proven + Probable Reserves (50% probability of being produced)
3P – Proven + Probable + Possible Reserves (5% probability of being produced)
E&P – Exploration and Production
Introduction
Reserves reporting in Saudi Arabia (SA), being unaudited as all OPEC reserves, are mainly political as confirmed by Sadad al Husseini (former VP of Aramco) with the 300 Gb referenced by OPEC being just a speculative number and not a proved one. Field production data are confidential, except for a few publications by Aramco to reply at Matt Simmons book “Twilight In The Desert”.
IHS is obliged to follow Aramco's reporting and has increased cumulative oil discovery from 313 Gb in 2004 to 395 Gb in 2006. It is difficult to check field reserves estimates with oil declines, because of production quotas and incomplete data, except for Abqaiq which was reported by the end of 2003 as being 73 % depleted (CP = 11.8 Gb or U = 16 Gb) .
Abqaiq's oil ultimate is about 15 Gb when calculated from the decline profile, when Baqi reported 16 Gb in 2004, Saleri 17 Gb in 2007 with wishful EOR. IHS reports 18 Gb (30 Gb OIP) in 2008 (plus 0,5 Gb condensate), but in 1993 was reporting 15 Gb. Old data (before the quotas fight) seem more reliable.

Figure 1: Abqaiq oil decline 1946-2006.
Old and new estimates
In the book Aramco and its world published by Aramco in 1980 before nationalisation, Saudi Arabia proved reserves were reported to be 113 Gb and probable reserves 65 Gb, with cumulative production by the end of 1979 being 38 Gb. 2P discovery was 216 Gb for Aramco in 1979. Since then, discovery have been negligible, as shown by the creaming curve (cumulative discoveries versus the cumulative number of New Field Wildcats - NFW). The first 40 NFW (1935-1968) found 360 Gb in 22 fields while the last 40 NFW (1994-2007) found only 6 Gb with 33 fields! From IHS data, the oil ultimate is about 400 Gb and natural gas ultimate about 65 Gboe (= 400 Tcf). Recent natural gas exploration by IOCs has been dry (6 NFW) and Total has withdrawn.
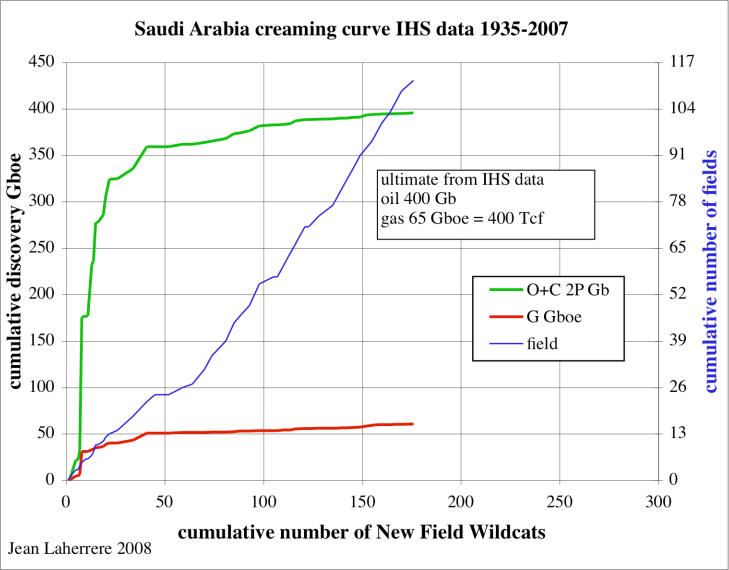
Figure 2: Saudi Arabia oil & gas creaming curve from IHS data 1935-2007.
Aramco (Baqi & Saleri 2005) reported as of end 2003:
- cumulative production (CP) = 99 Gb,
- remaining 1P = 260 Gb,
- 2P = 292 Gb,
- 3P =363 Gb and
- contingent resources 238 Gb
All of this for an oil in place of 700 Gb. Saleri seemed to have forgotten that contingent resources are potentially producible one day and he assumes that all oil will be produced without leaving one drop in the ground (!) when the range is from 99% to 5%.
Aramco discovery as of end 2003 is then 2P 391 Gb, giving an increase from the 1980 estimate of +175 Gb, mainly for political reasons, because of the quotas fight.
Figure 3: Aramco (Baqi & Saleri) reserves as of end 2003.
IHS was obliged to accept Aramco's field estimates and reports 396 Gb at the end 2007 . But Sadad al-Husseini (VP of E&P) when retired in 2007 stated that the 300 Gb proved reserves increase from 1985 to 1990 by OPEC are based on speculative resources and that Saudi Arabia's increase in 1990 was 90 Gb. In 1980 Aramco's 2P reserves were about reported 1P.

Figure 4: Saudi Arabia oil cumulative discovery and remaining plus produced.
What is the real ultimate?
Colin Campbell estimates Saudi Arabia's ultimate to be at 275 Gb. Production linearization is not reliable, ranging from 180 Gb to infinite depending on the selected period. The plot is linear only if the pattern is logistic but this is not the case because of above and below ground conditions.
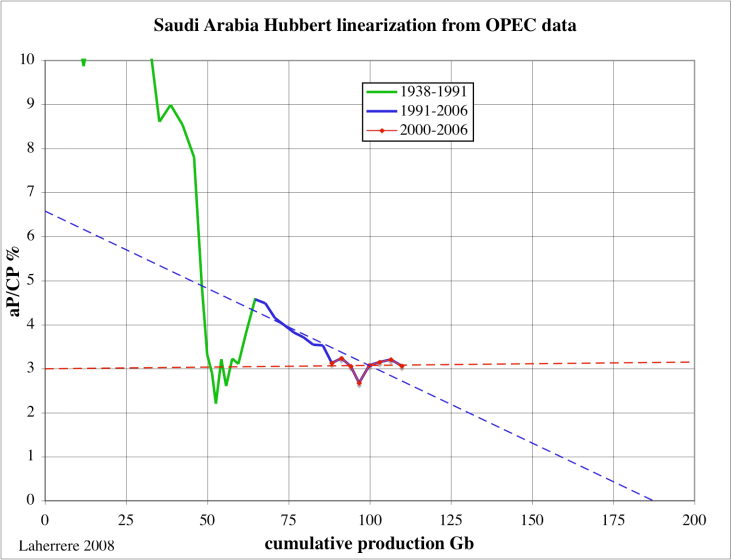
Figure 5: Hubbert Linearization from OPEC production data.
Oil production seems to have been pushed very hard with new drilling. The comparison between oil production and number of rigs seems to show that oil production is at the peak, despite that the new drilling could be the redevelopment of fields like Khurais and Khusanyah.

Figure 6: Saudi Arabia and Kuwait oil production and number of rigs.
Anyway King Abdallah has declared that, if new fields are discovered, they will be kept for the next generation.
I am inclined to choose 250 Gb for the oil ultimate with 110 already produced as of end 2006. Colin’s 275 Gb seems optimistic and the maximum is 300 Gb, far from IHS 400 Gb.
But there are also NGL (natural gas liquids, reported as natural gas plant liquids by USDOE/EIA) and it is hard to forecast NGL production which increases more than crude oil because it is outside OPEC's quotas and Saudi Arabia has high needs for gas (in water desalt plants).
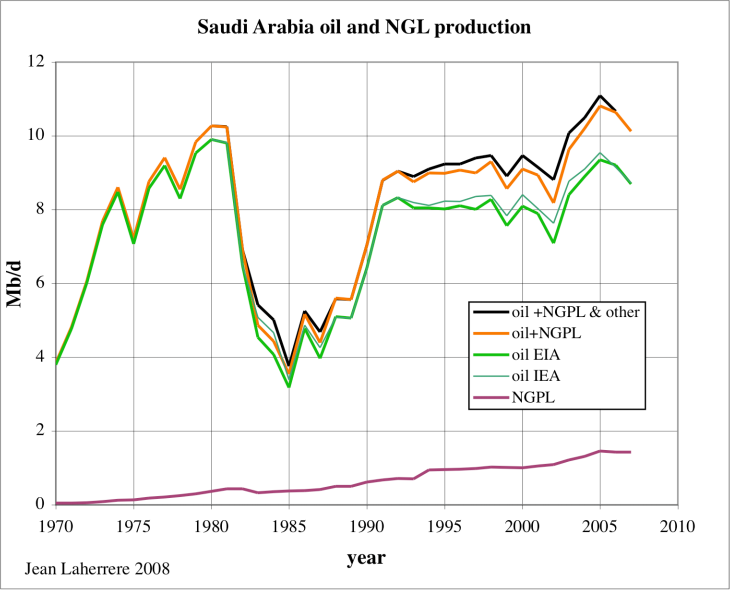
Figure 7: Saudi Arabia Crude Oil and NGL production.
Natural gas (NG) production data varies with sources. The ratio Mb NGPL to Tcf NG seems stable at 200 Mb per Tcf during the last 20 years.

Figure 8: Saudi Arabia NG and NGPL production.
If the NG ultimate is 400 Tcf (assuming no overestimation as for oil because there's no quotas), the NGPL ultimate is about 80 000 Mb (400 x 200) or 80 Gb. The ultimate for Oil + NGL could be about 250 Gb + 80 Gb, rounded to 300 Gb.
Crude Oil+NGL production (CP 2007 = 122 Gb) is plotted assuming a plateau up to 2020 and a decline of 3%/a after 2020 with a 300 Gb ultimate, but the big problem is domestic oil consumption which is increasing with population. The oil consumption estimated in Figure 14 is plotted as the volume of production less consumption available for export, which could be zero in 2050.
Figure 9: Saudi Arabia oil and NGL production forecast & consumption.
Oil consumption is plotted, estimated from population forecasts (UN 2006, USCB, PRB = population reference bureau) and per capita consumption.
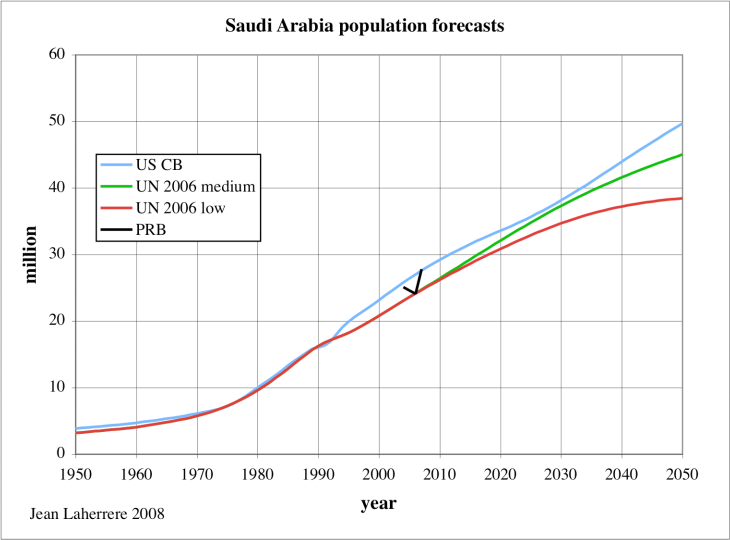
Figure 10: Saudi Arabia population forecasts.
Population forecasts are based on fertility rate forecasts, but Saudi Arabia's fertility rate is badly reported.
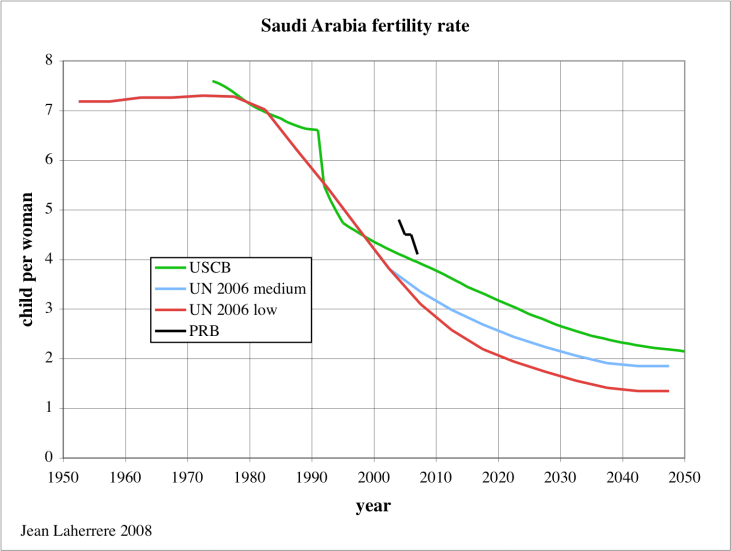
Figure 11: Saudi Arabia fertility rate.
Oil consumption per capita was about 25 annual barrels, but it has increased lately to 32 b because domestic gasoline price is well below the normal price: in 2006 gasoline was 0.16 $/l compared to a normal price of 0.58 $/l (USDOE/EIA study).
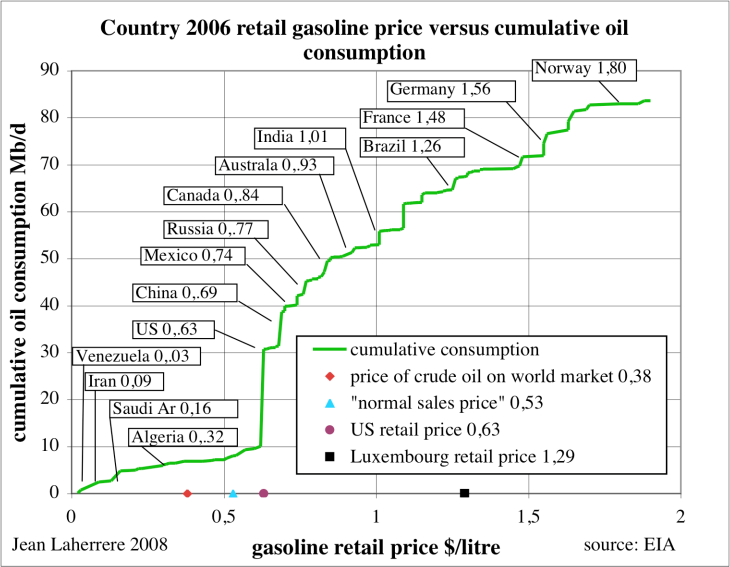
Figure 12: Country by country 2006 retail gasoline price versus cumulative oil consumption.
Oil consumption for the producing countries where gasoline price is well below the normal price increases more than the world's mean, meaning that their exportation will decrease rapidly.
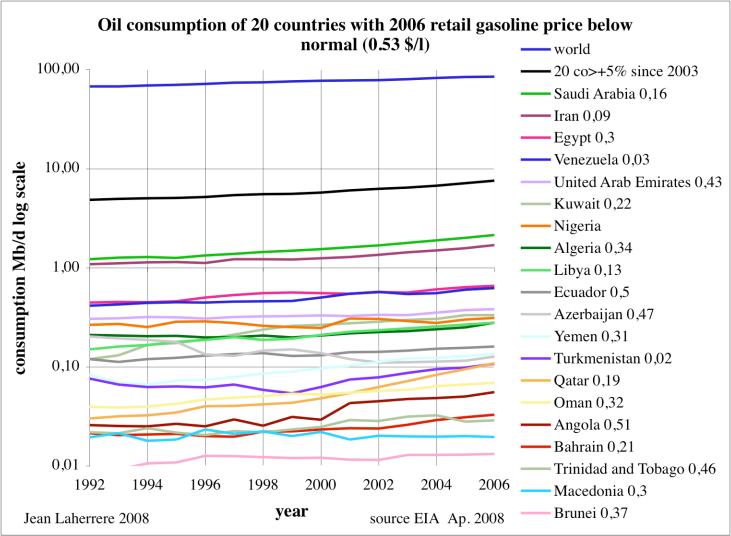
Figure 13: Oil consumption in 20 countries where 2006 retail gasoline price was below normal.
Saudi Arabia domestic oil consumption could reach 4 Mb/d in 2050 if consumption per capita stays at the present ratio of 32 b/a, but it has to decrease because Crude Oil+NGL production will be at this level (Figure 9).

Figure 14: Saudi Arabia oil consumption and population (UN 2006 medium) forecast.
Conclusion
There are many uncertainties in liquids forecasts mainly because of the poor quality of the data for production and population. Saudi Arabia should improve the quality of these data in order to manage the coming crisis. Saudi Arabia could stop exporting oil in 2050 meaning that they will be in trouble to finance their budget.
Furthermore the world needs to know that Saudi Arabia cannot fulfill the wishes of many countries in increasing their oil imports.
Personnel
Editors
Contributors
Peak Oil Primers
Archives
- November 2010 (3)
- October 2010 (6)
- September 2010 (4)
- August 2010 (7)
- July 2010 (6)
- June 2010 (7)
- May 2010 (2)
- April 2010 (8)
- March 2010 (4)
- February 2010 (6)
- January 2010 (3)
- December 2009 (5)
- November 2009 (8)
- October 2009 (12)
- September 2009 (6)
- August 2009 (5)
- July 2009 (11)
- June 2009 (8)
- May 2009 (16)
- April 2009 (10)
- March 2009 (7)
- February 2009 (10)
- January 2009 (15)
- December 2008 (9)
- November 2008 (9)
- October 2008 (9)
- September 2008 (13)
- August 2008 (10)
- July 2008 (14)
- June 2008 (23)
- May 2008 (16)
- April 2008 (12)
- March 2008 (16)
- February 2008 (9)
- January 2008 (13)
- December 2007 (13)
- November 2007 (16)
- October 2007 (22)
- September 2007 (8)
- August 2007 (9)
- July 2007 (16)
- June 2007 (8)
- May 2007 (7)
- April 2007 (7)
- March 2007 (10)
- February 2007 (10)
- January 2007 (12)
- December 2006 (9)
- November 2006 (15)
- October 2006 (4)
- September 2006 (5)
- August 2006 (5)
- July 2006 (9)
- June 2006 (5)
- May 2006 (10)
- April 2006 (9)
- March 2006 (13)
Vital Trivia
License

This work is licensed under a Creative Commons Attribution-Share Alike 3.0 United States License.
The Oil ELM in a nutshell/Banana 'Skin':
I live in a Banana Republic. Almost from the day I was born my mother fed me Bananas and I love them and cannot live without my daily Banana. Life is tough here in Bananaland but at least the government gives us almost free Bananas so life ain't so bad...
...and in a few years:
Just lately the government has said that OUR Bananas must go up in price as we are eating too many and need to send more to the rich Capitalist West. The cost of MY Bananas are going through the roof!! I cannot afford my daily Banana any more! Life is tough and my Bananas are going up as well! I AM UP IN ARMS!!
:o)
On a more serious note I read that KSA was investing heavily in heavy-oil refining capability I wonder if this has been taken into account?
Nick.
You have hit the nail (conundrum) on the head. The bananoil republics (and shiekhdoms)have given cheap subsidized oil to keep the masses happy. To not cut the subsidies means less (and more expensive) oil to supply the rich capitalist west (and China etc)as more is wasted locally. But if the masses don't get their daily fix of cheap bananoil then they will be up in arms (and the revolutions will bring out the radical elements- usually anti western) with a jump in oil prices on the turmoil.
I'm sure they would take issue with your use of the word "waste"
It's waste, whatever the commodity. An example, my relatives in Egypt buy subsidized bread so cheaply that they feed chickens with fresh bread. Bakers frequently ensure a batch of bread burns and is unsuitable for humans as the price for 2nd grade bread is higher than what they can sell fresh bread for. A loaf costs less than a cent (5 piastres), the same price that I paid 20 years ago when the Egyptian pound was near parity with the dollar and wheat was a quarter the price of now. It was subsidized then and is still subsidized even though the value of the flour is up twentyfold. Consumption is also up (higher population and more consumers substituting for more expensive food).
Egypt has the same problem with subsidized fuel. Subsidized 80 octane (about 80 cents/gallon) demand is way up and shortages have caused riots and knife fights at the pumps in Cairo last week
Is anyone else having problems with this site not loading, having to refresh half a dozen times, having to wait an average of 2 minutes for a page to finally load, etc?
I'm having serious problems with this site being intermittent...
Is anyone else having problems with this site not loading, having to refresh half a dozen times, etc?
Not quite correct. Subsidized or not, if you use your bananas in-country you boost your local economy.
The definition of a banana republic is a government that stiffs its citizens of their bananas to sell more to outsiders and keeps the money. The ELM model would be the antithesis of that.
You are the one misunderstanding, TJ. If a country does not stiffs their own people to sell their bananas to the USofA, then, by definition, it is a banana republic, and mainly, just asking for it. Just let me grab my gun and let's go get our fucking bananas!
Don't give W any ideas...
Banana Wars
We are, after all, at Peak Bananas, what with the Cavendish variety being killed off by fungus.
Bumper sticker: "Why are our bananas growing on their banana trees?"
It is self evident that the logistic method for swing producers has problems, but does that make it useless? In our early 2006 paper using Texas and the Lower 48 as a model for Saudi Arabia and the world, we noted that Saudi Arabia in 2005 was at about the same stage of depletion at which the prior swing producer, Texas, peaked. For Saudi Arabia, I believe that we used about 1991 to 2005 data inclusive. Given the vast number of uncertainties that we have to deal with as outsiders, in my opinion the relatively objective logistic method is the most plausible estimate of URR.
Note that the inflection upward in the Saudi logistic plot prior to 2005 was quite similar to what Texas showed pre-peak. It both cases it appeared to be the effect of a swing producer going to almost 100% of capacity. After peaking, Texas showed a steady linear progression on the logistic plot. The 2006, 2007 and 2008 Saudi data are going to show a logistic plot that is consistent with an URR of less than 200 Gb, (C+C). While Saudi Arabia has shown a production rebound in 2008, it is very likely that their 2008 annual production will be below their 2005 annual rate. If this is the case, Saudi Arabia will have shown three years of annual production below their 2005 rate, at about the same stage of depletion at which the prior swing producer, Texas, started declining. And like Texas in the Seventies, we have seen the following pattern in Saudi Arabia: Higher Crude Oil Prices + Increased Drilling = Lower Crude Oil Production.
We shall see what happens in 2009, but I suspect that 2005 will turn out to be the Saudi's final peak. In any case, I estimate if the Saudis wanted, and were able, to match their 2005 net export rate they would have to produce about 11.8 mbpd total liquids in 2009, versus their 2005 rate of 11.1 mbpd.
Texas & Lower 48 Paper
http://www.energybulletin.net/node/16459
Great work Wes. For me log normal plots tell the truth as best can be learned from the limitations. I know you understand the significance of a straight l/n plot but many don't understand the physical natural laws driving the reservoir dynamics. I'll bet more than a few are suspicious of such a straight and predictable projection. Once, on another thread, I tried to explain the accuracy of production forecasting when the decline curve reaches this point but I doubt I did much good.
Minor correction: all of the technical work was done by my frequent (and IMO, brilliant) coauthor, Khebab. I suspect that the logistic method is controversial because, in many cases, people simply don't like the resulting URR estimates, but my point is that I am not choosing an estimate for URR. The logistic (HL) method is predicting the URR. And while there is a degree of judgment involved in picking the parameters, I think that everyone would agree that Saudi Arabia started showing a linear progression in 1991.
westexas, what was the historical decline rate of Texas and the Lower 48 & how closely do you think Saudi Arabia may follow this? Sorry if this has already been mentioned on prevuous threads.
Texas has declined on average at about -4%/year and the Lower 48 at about -2%/year, although there have been periods of flat production and/or year over year increases in production (to levels below their peak rates).
The Saudi HL plot suggests that it will have a lower decline rate than Texas, and this is one of the reasons that I suggested, in early 2007, that Saudi Arabia could show a rebound in production, i.e., the initial production decline was steeper than what the HL model predicted. I believe that Khebab is showing a middle case total liquids decline rate of about -2.7%/year for Saudi Arabia.
I am somewhat suspicious about recent Saudi production numbers. I have speculated that they may be curtailing domestic refinery runs in order to boost reported crude oil exports, and planning to boost product imports. If this is the case, they may be having trouble importing enough diesel, since there have been widespread reports of Saudi farmers being out of diesel--with a farming group threatening to sue Saudi Aramco. Interesting enough, Saudi Aramco has denied that are any diesel shortages in the kingdom.
Hold on. You use KSA production numbers to do your linearization, and now the numbers aren't falling in line, you suspect the numbers instead of the HL?
I respect your work and agree in general with your conclusions, but this dogmatic attitude has to have an exit strategy - where/when are you wrong (on KSA URR and production)?
Thanks
As noted elsewhere, I thought that there was a good chance that the Saudis would show an increase in production, to a level below their 2005 rate. This premise is not incompatible with also suspecting that the Saudis might be using a little sleight of hand to temporarily augment the perception of the size of the rebound in production. Doesn't anyone else find it odd that Saudi farmers are threatening to sue Saudi Aramco because they can't get the fuel to run their irrigation pumps, while Saudi Aramco is asserting that there is no fuel shortage in the kingdom? My premise is that this is a short term situation, keyed to the US elections. I assume that the Saudis are "voting" for McCain.
In any case, if we assume about 9.4 mbpd (C+C) average annual for 2008, and if we use a C+C HL decline rate of about -3%/year, I estimate that Saudi Arabia will have produced about 10 Gb of crude oil in from 2006 to 2008 inclusive, while the HL decline estimate suggests that they should have produced 9.9 GB. If they had maintained their 2005 rate, they would have produced about 10.5 Gb.
To put 10 GB in three years in perspective, this is on the order of the largest oil field in the US, Prudhoe Bay (about 12 Gb of oil), and it is about twice the URR for the East Texas Field, the largest Lower 48 oil field. It took decades to fully deplete these two giant fields.
Is this sort of speculation/conspiracy theory the reason you call HL "relatively objective"?
If the numbers don't work, then adding speculation doesn't help convince.
BTW-the Saudis are also past Peak Water
""It is possible to save 1,300-1,500 cubic metres of water for every tonne of wheat produced," Qabbani said.
The phasing out of Saudi wheat production will have little impact on global prices, said Abdoulreza Abbassian, a Food and Agricultural Organisation grain analyst."
http://www.reuters.com/article/latestCrisis/idUSL08699206
So what few farmers are left can't get fuel.
...on reflection I think I would rather be living in a relatively wet country (UK) with no oil than a dry one with no water... There's a reason why deserts have no people in 'em...
Regards, Nick.
I assume that most people would think that 9.4 mbpd, based on what we know so far, is a plausible estimate for 2008 average annual Saudi production. As noted elsewhere, this would put the post-2005 cumulative production in close agreement with the HL estimate. So why don't the numbers work?
So why don't the numbers work?
The biggest issue is that the URR is creeping higher. I suspect that if you update through 2008, you will find that your URR has gone over 200 Gb. Thus, today's HL is not the same as the HL you did in 2005. In that case, you could call peak whenever you want: 2002? Sure, the numbers work. 2010? Ditto, depending upon your assumptions.
This is the same thing I noted in the case of Texas. Had you done the HL in 1960, you could have erroneously concluded that Texas was at peak. But the numbers kept changing, and of course Texas didn't peak until more than 10 years later.
And for the record, my objection is certainly not because I don't like what the HL says. My objection is based on the fact that I have actually gone back and backcast the numbers in the case of Texas, and in real time it would not have been possible to call the peak. There are no objective criteria defined that indicate peak. Is it at 52% of Qt? 60%? The difference there may be 10 years. But when there is that much leeway in defining the numbers, it is easy to come up with just about any answer you want.
Again, I think it would be very useful to update the 2005 paper and incorporate data through 2008. A good model must be able to incorporate new data, and it shouldn't give different answers if the model is robust. By ignoring the more recent data, you open yourself up to legitimate criticisms.
This will be the last post on the matter from me, as I have to step out for the day. Anyway, I didn't intend to carry on a long debate on this. Those are my observations after actually having run a number of HL cases (and also after having run numerous computer simulations during my career, and understanding what makes a robust model).
At this point in time, we can say that the two largest oil producers in the world are conforming to their respective HL models. This may change. Time will tell.
In Defense of the Hubbert Linearization Method (June, 2007)
http://graphoilogy.blogspot.com/2007/06/in-defense-of-hubbert-linearizat...
Robert, I agree with your comments. In any predictive framework, assumptions and unknowns, so far as they can be spotted, must be carefully noted. With SA HL numbers changing as they obviously have, I don't see a basis for confidently predicting URR. Note that for the Doomers, inconfidence in this respect doesn't mean the world won't end somehow else, so net overall doomer confidence should remain undisturbed.
I assume that the Saudis are "voting" for McCain.
If they are, it's under duress. Look at Pakistan.
It is self evident that the logistic method for swing producers has problems, but does that make it useless?
Depends on how big the problems are. You and Laherrère are clearly pretty far apart here.
The 2006, 2007 and 2008 Saudi data are going to show a logistic plot that is consistent with an URR of less than 200 Gb, (C+C).
But, the URR is going to show that it is creeping higher as you add those numbers in. You will also find % of Qt moving backward, not forward as you would expect if the HL was correct. That's what I discovered both when I backcast Texas from about 1960 forward, and when I did the HL for Saudi and added in the years following 2005. In other words, incorporation of new data indicates that the URR is not static per the HL.
It might be useful to update the paper, incorporate the data through 2007, (you could even estimate 2008 at this point) and indicate what is changing - and by how much. But what, I mean URR, % of Qt, etc.
As we have previously discussed, in the Texas/Lower 48 paper I never claimed that the pre-peak Texas HL plot was stable. I did note that if we looked at the total Texas plot, we could derive an estimate of at what stage of depletion that Texas peaked. We then took that number, around 57% of URR, and applied it to the far more stable Saudi HL plot, and as noted above, it is quite likely that Saudi Arabia is going to show three years of average annual production below their 2005 rate, at about the same stage of depletion at which Texas peaked. I suspect that 2009 will tell the tale.
So it safe to say the peak is "near", while striving to not definitively state a precise date?
It seems to me that if you can convincingly argue near-peak or past-peak for most major fields, and for the world overall, the precise data is not as important as the fact that we're about half done with oil.
Regardless of the date, and the exact shape of the peak, we're at the cusp of worldwide energy shifts, and I think we need to assume the worst and start work based on that. If it turns out we have a few more years, maybe we can stretch that to a decade or more of relatively productive transitions.
The sooner we "feel the pain" and do something about it, the less the eventual pain will be. I've given up on meaningful energy policy from the US gov't, as whatever they do is expensive and ill-conceived at best. It'll all have to get done by businesses and individuals, and high price signals really help that process along.
I think that Saudi Arabia's final peak was in 2005. I could of course be wrong.
Jeff,
You should use this result instead:
It leads to the following forecast which has a wide uncertainty interval in terms of flow rates but the upper limit is close to what Jean is saying:
The HSM is also pointing to a constant production scenario until 2020:
Khebab,
How do you generate your confidence intervals? And is it possible to do the same thing in Excel? Or are you using Matlab?
I used a bootstrap technique but there are other ways to do it. I have received your email, I'll see what I can do.
I believe that your HL plot in the Texas/Lower 48 paper was for C+C, but isn't your HL plot above for C+C+NGL?
BTW, what would you estimate the C+C decline rate to be based on the Texas/Lower 48 HL plot? I used the middle case for the top five (C+C+NGL) paper of -2.7%/year, and rounded up to -3%/year.
Is that correct? If not it seems Robert's questions above were validated by Khebab's graph as URR is creeping up.
Also, do you know what was decision making process behind adding the 80s into the fit?
I double checked the production curve. The Saudi HL graph in our Texas/Lower 48 HL paper is C+C. The above HL graph, from our top five net exporters paper, is C+C+NGL. BTW, Jean shows 2005 as the final C+C peak, and Ace was weighed in on the subject down the thread.
In my "Defense of" article, I noted that the Lower 48 production data through 1970 and the Russian production data through 1984 very accurately predicted the post-1970 Lower 48 and post-1984 Russian cumulative production (two regions with wildly different production profiles). If Robert had done his analysis on a stable HL plot like the Lower 48, he would have come up with different results, and the key point is that the Saudi HL plot is much more stable than the pre-peak Texas HL plot. I did analyze the pre-peak Texaas HL plot in detail in a followup article, which unfortunately led to frequent criticisms that we had "cherry picked" the data in our Texas/Lower 48 paper, which is absolutely false. Khebab used the 1991 to 2005 data, inclusive, in the Texas/Lower 48 paper. My point was that the inflection in the HL data, the "dogleg up," is an artifact of a swing producer going to virtually 100% of capacity (strictly speaking Texas did not go to 100% in 1972; two large fields were kept at lower production levels).
BTW, Stuart's objection, in March of 2007, to the Saudi HL model, was that the production decline to date was sharper than what the HL model predicted. I replied that this was one of the reasons that I expected to see a rebound in Saudi production, which we have seen (although I did say that they might rebound to "a level well below" their 2005 rate). IMO, 2009 will tell the tale as to whether 2005 was the final peak, but in any case depletion marches on, as does rising Saudi consumption. Jean didn't generate a net exports graph, but if he had, it would have showed declining net oil exports.
Here is the projected (low case, middle case, high case) net export graph for Saudi Arabia that Khebab did in our (Khebab/Brown) top five paper which I delivered at ASPO-USA in October:
If Robert had done his analysis on a stable HL plot like the Lower 48, he would have come up with different results
I did do the HL for the Lower 48, and you are correct that it was more stable. The problem then is, how do you define what is stable? I ran a lot of HLs for different areas, and the Lower 48 is an exception. What we have here is a model - without solidly objective criteria to determine when it is working - that is not highly reliable. As such, you have a recipe for being able to come up with practically any answer you want. If the numbers don't turn out to be as expected, we can always cite one more variable to explain away the discrepancy.
I assert that the HL is like a Ouija board. It is influenced by the person running the model such that many answers are possible. Otherwise, someone could define the terms that indicate when a region has peaked. This has not been done, and I doubt can be done with any degree of precision. So what do we have? A model that can only be judged to have worked years after the actual peak. That is, unless you can give hard numbers for concepts like "stable" and "% of Qt that indicates a peak."
In other words, the Lower 48 HL plot showed no material increase in URR with time. Regarding definitions, I think that everyone would agree that the Saudi HL plot is more stable than the pre-peak Texas HL plot.
In any case, as noted up the thread, the post-1970 Lower 48 and post-1984 Russian cumulative production numbers were quite accurately predicted by using the Lower 48 production through 1970 and the Russian production through 1984 to construct HL models. This has obvious implications for world production--which is showing a solid linear progression.
Furthermore, as you noted, the available data suggest that the more stable the HL plot, the more accurate the URR prediction--which has obvious implications for Saudi Arabia.
This is exactly what I mean. Define stability. Can you measure it? Is it based on some specific r-squared value? Those are the kinds of things that have to be nailed down before you can say "We have a predictive model."
In my life as a computer modeler, that model had to be correct again and again and again. If it wasn't, then I couldn't trust it to predict the right answers for me. On that basis, I see the HL as completely unreliable, because a model that works part of the time - with no objective way to determine whether it is working - is useless to me.
I'm sure that you could define a linear pattern in terms of amplitude change, and I think that Stuart has done some stability analysis, but the stable patterns are obvious to objective observers--Lower 48; North Sea; Mexico; Russia (until the Soviet collapse); Saudi Arabia and now the world.
But Saudi is not stable. If it was, it wouldn't be pushing the URR to higher values. You have in the past used Texas as a proxy for Saudi. Yet we know Texas would have given many false alarms. Now you suggest that the Lower 48 is stable. This is not objective. This is reading your own biases in, and picking data sets that confirm the biases. If the measurements are objective, you should be able to define exactly how an independent observer can use the HL to predict a peak and URR.
It's worth clearly distinguishing between production in Russia and production in the whole USSR.
Unless the data you're using disaggregates much better than the EIA data, that model was constructed from Soviet production, not Russian. Production in the former USSR has been 12-25% higher than Russian production since country-by-country data has been available, meaning that cumulative production has been 8-9Gbbl higher, and the HL fit is no longer looking so good.
You say that Russian production "caught up" in 2006, but that would mean that production in the former USSR - which is what the model actually predicts - was at that point about 8Gbbl (5%) over what was predicted, and that overproduction has been rising ever since. Moreover, while Russian production has started to decline, former-USSR production has been rising past former records, pushing the disparity even further.
Based on that, it's not clear that the USSR's data is supportive of HL's predictive powers.
I'll have to defer to Khebab. He came up with his best estimate for Russian production, versus the FSU.
You are basically correct, pre-1985 production from Russia only is not publicly available so using FSU data instead prior to 1985 will increase production probably between 5 and 10% .
Here is a chart from the ASPO showing Russia's production (C+C):
Here are the various datasets I have:
I tend to concur with your view as the graphics below. In the first graphic, the data is annual data AND for comparison I show where the linear flow would have to be to achieve a URR of 260 GB. The last "tail" data is what would be projected if the total year average for the KSA was 9.3 MMBPD, a number that has not yet been achieved in 2008 as an average for the YTD. As Robert points out elsewhere, it has the effect of shifting the curve to the right but only slightly. Flat production eventually shows up as a declining curve as the P/Q ratio gets smaller with each additional data point. And to continue to shift the curve "to the right" one has to have continual growth in production for quite sometime. Mathematically, what compounds the issue is that larger the production the faster the increase in sum value (Q) and the more difficult it becomes to sustain or increase the P/Q ratio.
Notice that this graphic projects to a value of ~213 GB. the arrow to the 2005 peak also moved in the translation from Excel to a JPEG. Thats the point just above the arrowhead.
The second graphic is the same data except using monthly as opposed to annual data. The curve has much more noise to it, but the linearization covers the same time frame (January 1990 to present). Note that the monthly data suggests a somewhat lower URR (~205) AND because of the larger number of datapoints is less influenced by a single or a small collection of production increases or decreases on a monthly basis. To shift this curve substantially, as noted above, would require production increases that are not characterisitic of any production curve that we have seen.
For fun, I increased the KSA output by an average of 100,000 BPD/month from now until the end of 2009 (so that production is over 11 million barrels per day and beating their November 1980 output record. It does shift the curve to a URR of ~240GB or roughly the amount used globally in a little more than one year. But as soon as this increase "stops" the curve begins it's decline once again. So, it is reasonable to ask, in the face of what we do and do not know, does any of this increase seem reasonable or even plausible?
And for real fun if you increase at a rate of 200,000 BPD/month so that production at the end of 2009, production is more than 12.5 million BPD, it shifts the curve a little further to the right to the value of 260 GB URR, but only 20 GB greater than the hypothetical immediately above even though the rate of increase is twice as high over the same period. And this production curve does not look like anything we've seen recently from the KSA.
"Ultimately," the big numbers get you!
I not know much about this subject but I like to share some simple thoughts, please forgive me for my ignorance:
First, a swing producer exist when there is an abundance (supply > demand at a reasonable price) so in order to stop price from falling the swing producer cut production, vice versa for the opposite. As soon as abundance is gone and tightness comes, when demand is greater than price there is no longer a swing producer because all the producers are producing at their maximum level to take advantage of the price.
Since the hubbert's linearization is I think based on the assumption that a producer will produce at its maximum level geologically possible therefore it not work for swing producers. There is no use of linearizing a swing producer. In order to get some useful information about flow rates and reserves must only linearize non-swing producers only. The swing producers must only linearize when they are no longer swing producers.
Second, all oil exporters which also have vast natural gas reserves (I think they all have that) would ultimately liquify their natural gas to be sold as liquids. So, in order to get useful information about prices, flow rates etc we must take in account natural gas reserves of an oil exporter as well as its oil reserves. Luckily there is no opec like thing for natural gas liquids so we can assume that govt declared reserves are correct. This thing help reducing chaos in our data and predictions that come due to uncorrect reporting of oil reserves by some govts.
No actually this is one of the more sensible things I've read in the comments. I think there is a danger for us to lose objectivity when we passionately believe something. That doesn't mean that we're wrong about everything we believe, rather we may find out later that one assumption has led to a series of mistakes. Maybe mistake is too strong of a word because I believe a lot of the analysis is good, but sometimes when you've invested a lot it's easy to lose sight of your initial assumptions.
Truthfully, I'm not convinced that KSA has peaked at this point. Even if they peak, it is as you say... they have been a swing producer in the past. The best evidence has been that they have been producing "all out", but that could also be a ploy (by under-investment or other means) to keep the prices high. I question Venezuela's and Russia's production numbers as well. It may never be possible to prove, but I can see potential for some strategy playing out between the large producers.
So in short: any model of cartel-based behavior or swing producer behavior is subject to discrepancy. The possibilities don't look good, if only because of the larger OPEC and OECD situation. The fear is that the KSA will be the straw that breaks the camel's back. I'm not sure that it's fair to judge them at all, regardless of whether they have misled. It's time to wake up from our 100+ year oil binge...
Sorry, but figure 12 needs some explication. Are you saying that tiny Norway (4,8 Mio. inhabitants) had a higher cumulative consumption than lets say France or the US? This wouldnt make sense to me.
looks like the consumption of Norway is actually very small (look at the consumption incremental bump, not the total consumption of the left hand side), however, the data in that graph looks very non-conclusive, because the US and China make up the lion's share and its hard to tell whether its price or economies driving the consumption at different prices.
great piece of work.
i think, though that you are being pessimistic on abqaiq. and we all know that abqaiq is important because it may be an analog for ghawar.
extrapolating the '96 to '06 data gives about 15 Gb, not in dispute.
looking at this graph and nothing more, it is apparent that an accelaration project was completed sometime prior to '96. eye-balling the entire graph and extrapolationg a trend would not make it difficult to get 18Gb(or more).
it would be instructive to see the data past '06. a plot of wor(water/oil ratio) vs cumulative might also be helpful.
My understanding is that KSA has huge heavy oil deposits they never have bothered with. Maybe now they will. And KSA is but one supplier. The obsessive hysteria about KSA does not strike me as a balanced world view, even within the oil sector.
Anyway, crude demand seems to be falling faster than supply. On the near horizon are automobiles, slated by nearly every major manufacturer, that will draw most of their power from electrical grids. And powering up grids can take zero oil.
Grid demand from non-auto sources looks like it will head south too. New LED lightbulbs, improved HVAC systems, better insulation, better building desings -- architects have learned to cut energy consumption radically.
In 20 years, the real question will be: Who will be left buying oil? Is there anyone reading this board that would prefer to spend $7 a gallon over plugging your car in? Is there anyone who would choose an old-fashioned incan light bulb over an LED, and LED that will last 20 years and uses 15 percent or less of the power of an incan?
The biggest risk right now to a cleaner and more prosperous world is an oil price collapse. The EV is the OPEC-killer, the death-ray for speculators.
Once the commodity funds start unloading positions, ouch, look out below. Oil below $120 today. Is $20 out there somewhere?
Not possible? Who would have thought $10 was possible in 1998, from the vantage point of 1980?
I would be glad to chat over your line of thinking in the drum beat. You ask several rhetorical questions. Why not test them against reality and see if they hold up? There are many places in the world that have gasoline over $8.00 per gallon. What is the ratio of electric vs petrol cars sold in those countries? And you can easily compare # of LED bulbs sold vs Incandescents. See you in the drum beat.
I am not sure what is the "drum beat." Do I get to dress up in hides?
I have wondered why Europe has not developed battery cars before. I guess lithium batteries recently came to viability. But you would think that France, all nuked up, would love battery cars. They are nearly home free now. Using our technology. Oh well.
LED bulbs are new too. Look for them to replace all others in next 10 years, unless something even better comes along.
The "Drumbeat" is theoildrum.com's daily collection of energy and resource related stories, managed and overseen by editor Leanan.
Regarding electric vehicles etc. the first issue is batteries - there are promising technologies out there but at this point they are all quite expensive. In order to be effective, not only do we need the energy and technology, but it needs to be cheap enough to reach at least a good % of the masses. If average person can't afford renewables, then we have social unrest that disrupts the energy transition. I encourage you to read the Drumbeat and other articles here over time to get a deeper flavor for the enormity of the energy problem we face.
Who says batteries are "not quite there." The GM Volt is slated for a 2010 launch, and other carmakers (including a Chinese maker) are planning EVs also right after that. I guess that does not mean this year, but surely we have a longer viewpoint that that.
Never underestimate the long-term effectiveness of the price mechanism in commodities markets.
Roughly 70 percent of oil in the U.S is used in transportation. Going to EVs means a radical reduction in demand. The EV appears commercially viable -- GM thinks so.
If gasoline goes up more, then it is certainly viable. And this is first-gen, at least on a mass-production commercial level.
Hey, we have scooters too.
Really, the EVs promise cleaner, quieter cities, and more consumer disposable income. I just don't see the downside. Yes, they will be smaller than a Hummer. I can live with that.
Hybrids are now (obviously) mainstream, and batteries for those apps are "there".
Full EVs are now in the role that hybrids were 5-10 years ago, and they will find a early-adopter cadre ready and willing to take them with warts and risks. I think EVs will be about as popular as CNG cars, and an EV with a limp-along gas engine would do better still.
Really, vehicles should appear across the continuum from all-gas to all-electric, with new niches for CNG-hybrids and multi-fuel hybrids as well.
The first EVs will likely be usable if sub-optimal, but the economies of scale for battery plants coupled with practical field experience and oil-prodded innovation will likely bring out 2nd and 3rd gen EVs in short order.
I saw an article here a few days ago where an officer commented that hybrids weren't up to snuff for cop cars. A Prius-style hybrid isn't, perhaps, but certainly the more powerful Lexus variants would get the job done. We just need some proliferation of hybrids into small trucks and gov't fleet vehicles. It'll come, once the battery production market rises to the occasion.
I think it's laughable that GM is closing SUV plants when they could be opening US- or Mexico-based battery plants, and converting the SUV plants to building city buses (in short supply) and work-vehicle hybrids (school buses, delivery vans, incomplete chassis, cop cars, postal service jeeps, and gov't fleet vehicles). I'd much rather see the gov't hand-out be a fleet-vehicle purchase order for the entire US gov't for EVs and hybrids, than a cash "R&D" handout. Heck, open it to any car company that will build them in the US, for that matter (with the exchange rate, only those bids would win anyway).
And five years after that you'd have lower income folks buying used hybrids with half-gone batteries for their cars, and junking the SUVs from this year.
All assuming we have five more years to get EVs solidly flowing onto the roads......maybe, maybe not.........
Mr. Fillmore,
Here is what the aggregate dollar vote believes of GM future prospects. And the peak oil folks are minority there I would assume.
ALTI nano is making a battery with 300 mile range with A123 - it looks like the prototype is going to work - I own stock in the company - but the battery will cost over $50,000. We need the same or higher energy gain we've gotten from fossil fuels OR gains in efficiency or conservation or we can't grow an economy. Period.
One downside that I see is the increased usage of electricity from the grid.
If a significant number of people switch to EV's the grid capacity must be increased. Doesn't that increase the use of coal and oil in power plants?
Also, if demand on the grid goes up, wouldn't cost per Kilowatt go up? And how do the utilities add capacity?
GReg
Not true, actually.
This has been studied in detail by the US DOE. They found that the current grid could support the charging of about 180M PHEVs without changes. The number of pure EVs would be lower, but still in the high tens of millions.
Coal, not oil. EVs are so much more efficient, though, that it's still a winning proposition in terms of energy use and pollution. Burning a gallon of gasoline to make electricity for an EV will let you drive twice as far as burning it in an equivalent gas-powered car.
It goes down, actually. IIRC, the reason is that the extra off-peak demand allows plants which are currently underutilized to operate more often, lowering the per-kWh cost of capital depreciation.
The study's worth a read; it shows in detail why the current grid is not an obstacle to large-scale adoption of EV/PHEV technology.
Before everyone starts swooning over batteries, perhaps we'd better look into the the potential supplies of rare metals that are used to make these things. I've seen a few articles that indicated that there are likely to be some big problems in this regard. Next thing you know we'll be talking about "peak metals mining." :-(
Before everyone starts swooning over batteries and EV's, perhaps we'd better look into the the potential supplies of rare metals that are used to make these things. I've seen a few articles that indicated that there are likely to be some big problems in this regard. Next thing you know we'll be talking about "peak metals mining." :-(
http://books.google.ca/books?id=zNicdkuulE4C&pg=PA608&lpg=PA608&dq=lithi...
I can see no logical reason why Lithium supplies might ever be a problem for battery manufacturers. If necessary (not presently), it can be extracted either from seawater or from many clays, where its oxides / etc is a common composite.
All you'd need to do is double the price for the raw mineral to find out how many resources of it you have. And how many batteries will the present 10 million tons of know highgrade economic-to-mine resources last?
http://minerals.usgs.gov/minerals/pubs/commodity/lithium/450302.pdf
BTW, the Lithium used to make batteries is recyclable / recoverable when the battery's life is done.
Like Nate wrote, the batteries are not quite there yet. But Tesla is planning to introduce a sedan in 2010 which will have a 305 mile range and 40 minute recharge time. With 8% per year improvement for battery technology, it might take another 7-10 years for EVs to be superior to ICEs in terms of range, convenience and cost.
The other issue is that the EVs would have had to compete with cheap oil, which is not quite out of sight. All the sunk costs for the massive petroleum infrastructure still give ICEs an advantage, but not for long. The same situation has favored coal over nuclear, especially since nuclear has had to cover all the externalities such as pollution, waste disposal and safety, but coal has not.
EVs are so obvious to us but still a stretch for most people. That will entirely turn around in the next ten years.
"But Tesla is planning to introduce a sedan in 2010 which will have a 305 mile range and 40 minute recharge time."
I do not believe this can be achieved in a car that will be affordable to the average car owner in the US.
Most full size cars (not SUV's) require around 65 HP or 48 KW to go 70 mph (average highway speed in the US - my guess). To travel 305 miles at this speed would require about 210 KW hours (305 mi /70 mph x 48 KW = 209 KW-Hrs). So if you put this much energy in the batteries in 40 minutes (0.667 Hrs) the current equals 1400 amps based on household voltage of 240 V, and this does not even account for the lost efficiency from fast charging (battery resistance remains constant while power goes up with the square of the charging current).
An overnight charge of 8 hours would lower the current to 109 amps which could be done, but this would cost me $33.60 because my KW-Hr rate is about $0.16. If a car gets 35 mpg the cost with gas at $4.00 per gallon is $34.90. The electric car had better not cost much more (maybe 25% is plausable?) than the gas powered car or the public will not bite. Now if gas costs $8.00/ gallon then the electric car wins, assuming electric rates do not go up as much as oil prices. But these fast charge rates will never be achieved due to capacity problems with homes power systems, even if KW-Hr in a full charge is cut in half.
Yeah, that's what I thought, too. And for only $30k. Check it out!
Hmmmm
I think you are about an order of magnitude out on 48KW for a steady state of 100 kph (I've seen figure of between 4-6Kw)
Neven
4 to 6 KW is 5.3 to 8.0 HP. That is about enough to move a 4000 lb car (including people & possesions) at about 15 kph. Maybe one of those ultralight one passenger cars can go 100 kph (63mph) on 6 KW, but not cars that can carry 4 passengers and run AC/lights/power accessories. AC alone draws 1 KW or more.
Not quite sure where you are getting these ridiculous numbers from but the energy consumption of vehicle in a steady state is more a function of wind resistance than rolling resistance (though this will change with vehicle mass) as for AC who needs it
Neven
Gas already cost more than $8/gallon in Europe and we are still at the beginning of the oil production plateau. In ten years, gas will cost 3 to 4 times what it does now and in 20 years, we will use less than half what we do now.
Who said we have to use home power systems? We are going to have to do a truely massive grid rebuild in the new twenty years. I do not know the numbers but I suspect the actual power demand will only be a fraction of what you estimate. What's wrong with ultra light materials? Electric motors can be extremely efficient and it should be possible to build extremely smart electric cars.
Are you sure they require that level of power constantly?
48kW at the wheel is about 350kW of gasoline (internal combustion engines are about 15% efficient in cars). At 121MJ/gal, that's about a gallon every 6 minutes, or 6.7mpg.
So 48kW at the wheels is much higher than the average power needs of a car going 70mph. Based on this analysis and a 20mpg average efficiency, it should need about a third of that, or 16kW.
For the 48mph EPA highway cycle, a car uses about half of its energy to overcome wind resistance, and so power consumption at 70mph would be about 50% higher (50% for moving + 100% for drag). The Tesla Roadster gets about 230mpg on the EPA highway cycle, meaning it takes 121MJ/gal / 3.6MJ/kWh / 234mi/gal = 0.144kWh/mi (about right), meaning it should take about 0.22kWh/mi @ 70mph, or an average power input of 15.4kW.
That's two different ways 16kW average power output at the wheel has been derived for travelling at 70mph, so it should be a reasonable estimate.
So, first keep in mind that a suggestion of X miles of range will be based on EPA testing, just like it is for every other vehicle. Based on the above, the EPA tests require about 2/3 the energy of driving at 70mph, so a 300 mile range would correspond to about 200 miles @ 70mph, or about 3 hours driving. 3 hours x 16kW = 48kWh, which is about the nameplate capacity of the battery system in the Tesla Roadster. The Roadster should only get about 150 miles @ 70mph, though, as its stated range is 220 miles, meaning we should increase battery size to account for losses (braking, steering, electrical systems) as well as perhaps not discharging the battery to 0% in order to improve lifetime.
Based on that, then, we'd need a battery with about 65kWh to get an EPA range of 300 miles and a calculated 70mph range of 200 miles.
Based on estimates of 8-9% improvement in battery power density per year, it'd take about 4 years to get this higher range with the same size of battery, which is not so far outside Tesla's timeline.
(For reference, and at a US-average $0.10/kWh, the electric car costs about $0.02/mi, vs. $0.16/mi for an equivalent 25mpg internal combustion car.)
Fast-charge at a gas station, slow-charge at home. Not ideal, but it beats the current situation, which is fast-charge at a station, no-charge at home.
That's ok, because the vast, vast majority of people don't need a car that does 300miles on a charge.
We buy cars with a range of 500+km because we don't want to go to the petrol station every day. This is not an issue if you can 'fuel up' at home, so a smaller range is more than viable.
The average distance someone in NA drives each year is in the region of 18,000km (Europe is more like 14,000km). This is just 70/53km a day (assuming 260 driving days a year). Assuming 125Wh/Km (the 'sweet spot' many home-built EV's aim for), that requires a battery pack of 12.5kWh. 10Wh, 40gram Headway LiFePO4 cells can be had for as little as 60c each in quantity (1000+), for a cost of a shade over $8000, and a pack weight of 100 kilos.
Add in about $10K for the inverter (if using AC equipment, DC is a lot cheaper, but has less frills) and motor, a grand or so for cables, switches, contrctors etc, and you have yourself a nice daily driver for around $$20,000 + donor car.
It's probably not a viable option for desperate people who need the cheapest car they can get their hands on, but if someone was in the market for a new car, a pure BEV is a more than viable option.
No, they don't. A Holden Commodore (parent car of the Pontiac GTO we exported to the US, Open/Vaxhal Monaro we export to Europe) requires about 10 - 15 HP to drive at 100kmh.
There's also the issue that ICE's are rated at peak power, whereas electric motors are rated at continous power. An elecrtic motor can quite hapilly operate at three or four times its continous rating for a few minutes (say, accellerating onto the highway), so a EV motor rated at 20HP can quite hapilly achieve 80HP for a short time. You just have to give them a cool-down time before hammering them again (but then, who drives their ICE at full throttle all the time?).
I also don't see 'having to' charge your car overnight to be a big deal. We charge our mobile phones, PDA's, laptops, etc overnight without thinking about it.
All that said, I don't think the BEV is a silver bullet. We won't be able to afford to maintain the existing road network to a high standard in the coming decades (perhaps only years), even where the roads are not subject to the Freeze/Thaw cycle, so investing in a BEV might not be the smartest thing to do. Much better policy would be to encourage Mass Transit, and conduct a huge build-out of it.
France has had a long interest in electric cars. The first car to do 100 kph was French and electric. Maybe the best were produced during the second world war when petrol supplies were almost completely cut off.
The web site Histoire du Vehicule Electrique is nicely illustrated
This page covers 1802- 1959
http://www.kartelec.com/f/mob/historique1.htm
Look for the CGE Tudor (250 km on one charge in 1942) and the Arzens 'Oeuf', also 1942.
This page covers 1960-1979
http://www.kartelec.com/f/mob/historique2.htm
It's all in French, but Babelfish seems to understand it.
BobE
Nothing like cheery optimism ... but it is unrealistic.
"On the near horizon are automobiles, slated by nearly every major manufacturer, that will draw most of their power from electrical grids."
Lessee, there are three hundred million vehicles in the US, how may plug-in electrics are we talking about? If we can get electric TRAINS in ten years it will take an all-out government/business enterprise equal to the Marshal Plan. All the new autos proposed for China and India have internal combustion power.
"And powering up grids can take zero oil."
Powering up grids takes SOMETHING; coal or nuclear. The pressure to cut back on coal emissions is strong and getting stronger; having New York City under fifty feet of water dosn't appeal to many on Wall Street. Nuclear plants take decades to build; why? Because every now and then one MELTS DOWN and that is a real buzz killer. Decades of neglect have taken a toll on the 'grid' anyway. Where will the money come to make it more robust? Fannie Mae?
"Grid demand from non-auto sources looks like it will head south too. New LED lightbulbs, improved HVAC systems, better insulation, better building desings -- architects have learned to cut energy consumption radically."
I'd like to see conservation outside of a university setting. Most buildings in the US are built by contractors with no training or knowledge of energy conservation, no design aptitude, and no infrastruture basis in the form of equipment or techniques. This is because of a lack of investment in energy efficient building techniques.
"In 20 years, the real question will be: Who will be left buying oil? Is there anyone reading this board that would prefer to spend $7 a gallon over plugging your car in? "
In twenty years, very few people will have cars. They will be too expensive to operate; that is, the entire 'car infrastructure' which includes car factories, car roadways, car bridges, car gas stations, car transporters, car repair and car parking ... all taken together are very complex and extraordinarily expensive; as parts of the whole decline, due to a lack of funds to constantly repair and rebuild them, ultimately the whole system itself will fail.
"The EV is the OPEC-killer, the death-ray for speculators."
One is not related to the other.
The EV does not scale; World production of cars is appx 20mil per year, hybrids (not true EV's) are about 500,000. The problem with hybrids and EV's generally is the poor performance of batteries. Add energy conversion (from carbon fuel to volts/amps), line and other inefficiencies and the hybrids are just as thirsty as regular internal combustion vehicles. They are not a solution.
What the point is reached when EV's are a sizeable percentage of the auto fleet, the total number of vehicles will be substantially diminished, by the mechanism described above. At that point, whether a car is a gasser or an EV will be irrelevant.
As JP Morgan observed, markets fluctuate. The commodities markets do this too. Speculators are chasing yield because of devaluing dollar and shrinking credit worldwide leaves them few alternatives to commodities-as-investments. Commodites fluctuate more than stocks or bonds because of the leverage in the commodities markets and the way the contracts are structured. But ... the overall long term trend in resources is higher and higher. Higher highs and higher lows.
No commodity will be priced lower than the cost of production, and the world wide demand is still insatiable. $20 oil is impossible because the dollar has lost so much value in the past five years. At the same time, America can cut back on driving and that savings will be offset by increased demand in China and other countries including the OPEC countries. Wait until Saudi Arabia gives women the right to drive, they will all buy new cars. They can afford them!
Steve, you forgot a zero. It's not 20mil per year but over 100mil (the European market alone must be 20mil). Otherwise I must depressingly agree with the gist of what you wrote.
Steve,
The 250 million cars and light trucks in the US travel an average of 50miles per day, 90%less than 80miles. If we assume that in the next 5 years most of the 15 million new vehicles sold are PHEV with a range of 40 miles on a 8KWh battery charge( Chevy Volt figures), with charging at work, shopping centers and home, these PHEV will use less than 10% of the present 25mpg fuel consumption. By 2020 would have 105 million PHEV's. Presently the newest 100million vehicles account 55% of the VMT, and would use the equivalent of about 6-7 million barrels of oil. This is about half of the present US oil imports.
This is assuming no improvements in batteries, no conservation by present car owners, no retro-fitting of existing vehicles.
If in the next 5 years, oil becomes even more expensive(say $8-16 per gallon), then you will probably see a much faster transition with both PHEV and EV vehicles being sold in larger numbers than present auto sales. It will just become too expensive to use 500 gallons per year in a SUV, when you can use 3000 KWh electricity($300-600).
I cannot see this pushing oil back to $20 a gallon, or even $50, because a lower oil price will slow the transition to EV.
The equivalent oil price to $8-$16 gas is what? $250-500 a barrel? The phrase Great Depression wouldn't begin to do the result justice. Massive unemployment in most countries; no consumer credit - who's going to be able to buy all these cars?
I don't believe that oil prices would sustain that level, simply because every buyer would have to drop out. But $120 is already proving high enough to grind to paste a lot of economic activity that people took for granted in the days of cheap oil.
Extreme volatility - prices ranging from say $70 to $200 in a 12 month period - would do more damage than a steady squeeze. Either way, most auto makers are already contracting and there is much worse to come.
Car ownership and car manufacturing are (were) a bubble. They might have owed their birth to human ingenuity and a desire to reach the far horizon but they owe their continued existence purely to their usefulness as a means of converting cheap energy into economic activity.
When oil stops being cheap, all other forms of fossil energy stop being cheap. When few people can afford cars and there are no more profits to be made from mass-producing them, the age of mass auto ownership will simply fade away.
It's pretty clear that a lot of people in the US need to join a 12 step group - autoholics anonymous.
The hand is writing on the wall - the days of the automobile are ending and we should just get over it.
"It's pretty clear that a lot of people in the US need to join a 12 step group - autoholics anonymous.
The hand is writing on the wall - the days of the automobile are ending and we should just get over it."
Agreed. The success of the automobile is its demise. Whether a percentage has an electric motor or a gasoline/diesel engine is not particularly relevant to overall energy consumption or carbon emissions. Cars are heavy and hard to push through the air; they need to be made in energy- guzzling factories, and they need roads and other infrastructure to support - both literally and figuratively - them. That, and their sheer numbers, makes them tremendously wasteful.
The real problem is the mis-investment - the 'sunk capital' - in infrastructure that is currently losing value to the point where it is becoming harder to leverage enough to finance transport alternatives. For example, the decline in real estate values is depressing tax revenues that pay for repairs, maintainence and improvements -as well as to pay for new commuter rail lines, for example. High costs for fuel are directly impacting municipalities; police and fire departments spend more for fuel which has to be paid for at the expense of something else. Even conservation at the pump - that little bit that has taken place in the last six months - has reduced gasoline tax revenues slated for highway repairs.
As primary values of real estate and commercial/industrial development decline and take tax revenues with them, the ability to keep the 'car grid' moving will be impacted. As houses lose value, the roads connecting the houses become less valuable at the same time.
Add to the uncertainty the depth and extent of the credit crisis and current political paralysis, it is hard to see how transitions to other transport will be funded.
There is always a silver lining somewhere:
http://freakonomics.blogs.nytimes.com/2008/07/30/reports-of-sail-freight...
The scary thing about this is that we're only at the beginning or perhaps middle of a bumpy plateau. Some might say the "real fun" hasn't yet begun. The amazing thing is that government isn't recognizing this for what it is. On the individual level, the neighborhood level, small town level, corporate level, and sometimes even the big town level, there is growing recognition of what is happening. There are still too many alternate theories without enough proof. Fingers are being pointed everywhere, but peak oil is still largely the stuff of wingnuts according to the mainstream media.
The banks and big corporations will suck everything dry until they can suck no more. Eventually the people will turn on them and no military in the world will be able to stop it.
The threat is more psychological than real. We'd have to have a Chernobyl every ten years to get to the same amount of deaths as Coal causes every year. The Pebble Bed Reactors China is expermienting with (originally a German design) canno't physically melt down. Physics won't allow it. Reprocessing the 'spent' fuel, is, however, a problem, as it's locked away so tightly.
I don't know if it will 'fail', but it's certainly not going to be front-and-centre (or even significant background noise).
EV's don't however, care much where their electricity comes from. If you drive an EV, there is no compelling reason for you to charge it from fossil-fuel-fired power. You could use rooftop solar, CSP, wave, wind, tidal, nuclear, geothermal, whatever. All electricity is equal.
It seems advancements in technology are not being addressed here. For example: A horizontal well at the top of the reservoir will produce almost a normal flow till the water (or other injection medium) gets to the horizontal pipe and then the fall off is precipitous and not like the lower 48 where this technology was not used early on. If horizontal wells are quite prevalent in some KSA fields, the result is GIGO.
"It seems advancements in technology are not being addressed here."
not here, in this specific article, but in many previous posts, this has been discussed. unfortunately, i am too lazy and not nimble enough computer-wise to cite you some examples.
"A horizontal well at the top of the reservoir will produce almost a normal flow till the water (or other injection medium) gets to the horizontal pipe and then the fall off is precipitous and not like the lower 48 ...."
this would be true in a completely homogeneous reservoir, one thing that ghawar is not is homogeneous.
many are forecasting a precipitous decline for ghawar and that may well be the case. ghawar is made up of thousands of wells, they wont all water out at one time. at least that is not the case in any fields i have knowledge of.
elwood,
As usual with the KSA it's almost impossible to verify but I’ve seen reports that they spent around $9 billion drilling horizontals in Ghawar in the late 90's. If true, that's one of my major concerns: if a big chunk of current production is coming from those hz's we could see a production drop in the short term way beyond anyone's expectation.
One of the major points Simmons made in latter portion of 'Twilight in the Desert', was; World demand for oil would continue to increase to 120 mbd by the year 2020, and the only oil producing country with potential spare capacity to meet that demand was Saudi Aramco. However he did not think they had that kind of spare capacity, and thus Peak Oil would occur sooner rather than later. (I'm paraphrasing).
His point was even if the Saudi's can maintain current oil production, it won't matter because demand will out-pace supply. This coincides with an earlier article here on TOD, which estimated current demand at 92.2 mbd, meaning if it was available at a cheaper price it would be readily consumed at that rate. So if we are to accept the 92.2 mbd estimate, then we can readily see why price per barrel is currently above 120 and has been as much as 145.
This means, the albeit interesting discussions regarding estimates of Saudi peak oil, are in this regard academic. They serve purpose and are interesting, yet Simmons point regarding a lack of spare capacity to meet a continued world demand, means Saudi peak oil is secondary to overall world peak production from a standpoint of spare capacity.
I think it's hard to predict what will happen regarding oil a month from now, much less 12 years from now. I think that he's basically on track, but we have to be careful about predicting too much. As has been shown many times, specific predictions he makes are often quite off.
If we pass this bumpy plateau and begin a downward slope worldwide, then prices will go up to $500/barrel and beyond. By the time that happens, it seems more and more doubtful that we'll be prepared for it with alternatives. Solutions do exist, but a critical mass of desire to implement them doesn't exist yet. Therein lies the problem.
I doubt we will ever reach the point where the demand is 120 mbd. My suspicions are based on the idea of equilibrium. Price will have to increase to the point that demand is lower (as in far lower than the demand that exists right now)... we are more likely to be looking at civil wars or NEW international resource wars before demand goes above the range of 85-95 mbpd. That means... very soon. Probably no later than 2010-2012. As for my own prediction here... this is really the sort of thing I'd be grateful to be wrong about. :)
The problem I continue to have, as an Average Joe with an average IQ, is the "future projections" of, say, graphs suchs as Figure 9.
Most of we simple folk, who stumble across posts such as this get a little overwhelmed with all the explanation and our eyes tend to wander straight for "the pictures". Show this graph to a random someone on the street and the first thing they'll point to is the long decline post 2010 and wonder, "What the?" They see (as do I) the track to the present day is full of dips and rises; how can complete disaster be extrapolated from that?
I'm not saying it won't happen - indeed, I'm 80% in the PO camp - just that to me it seems that such "educated guesses" only add to the arguement of why MS media won't jump onboard just yet; people will simply have trouble believing it... Who out there doesn't believe Super Funds won't bounce back?
Regards, Matt B
PS. I still think the phrase "Peak Oil" needs a rethink. It's about flow rate afterall, isn't it?
With a lot of circular logic, an unsupported premise, and much repetition. And by covering your eyes and holding your nose.
I play tennis every Tuesday night with a group of regulars - six teams of four, with a few reserves. If I were to plot our own team's results over the past ten seasons, it would show we've made the grand final six times, just missed three times, won it four, finished second-last only once.
If I were to plot next season's graph, with a declining track to the bottom of the ladder, who would believe it? I'd have to explain to the other five teams that our number one player's skills are on the wain (he's peaked), our number two's interstate more often (reduced supply) and our reserve player (spare capacity) has lost interest.
It's not about whether something's true or not, it's about whether it's immediately believable to other's that have never realised (or been taught) a basic premise; not all resources are renewable. Even if I could convince the others our team's in trouble, no doubt they'd just wait and see anyway.
Regards, Matt B
Perhaps there's a better way to present forecasts that come from left-field.
Iraq says they'll double production to 5mbpd in the next few years. Whether or not that comes to pass,Iraq could conceivably pump more oil than the Saudi's someday. Iraq has 2000 wells,compared to 1,000,000 or so in Texas.but its reserves are comparable to KSA.
Expect cellulol to make up much of the supply/demand shortfall in coming years. Dupont says commercial production in 2012. LS9 and Amyris even sooner. PHEV's are right around the corner. Wireless EV's are on the horizon. The question being asked should be,what will oil thug states do for money when fossil fuels become obsolete?
Perry 1961, It is obvious that EV's are right around the corner. But we aren't going to have additional power plants online any faster then we will have refineries for heavy crude. What are these Politicians smoking! I have a daughetr in California that has been through the Black outs and she says "keep your F-ing EV's away from here". We barely have enough power now in the west. They say "charge at night" LOL
http://oilenergystockvideos.blogspot.com
We don't necessarily need new power plants Money Man. The U.S. added 5000MW of wind power to the grid last year. We'll probably do better this year. I'm looking forward to the day when homes and businesses power the grid,instead of the other way around. Congress needs to get on the stick and mandate solar roofing in new construction. Tesla claims a 10X10 ft. solar panel will power its car. Maybe the panels should be marketed alongide the cars.
It wouldn't surprise me if Iraq has more oil left than Saudi Arabia, but I seriously doubt that Iraq will have a higher oil production rate than Saudi Arabia.
On June 30, 2008, Iraq Oil Minister Shahristani hoped that Iraq's production will reach "4.5 mbd by 2013 from its current level of 2.5 mbd".
http://www.upstreamonline.com/live/article158317.ece
Only a few days later on July 3, 2008, Shahristani "told lawmakers that short-term technical support contracts worth around $3 billion may not get signed" which will limit Iraq's ability to increase oil production.
http://www.upstreamonline.com/live/article158500.ece
Iraq may have significant remaining oil reserves but extracting that oil is not easy.
Iraq has produced about 32 Gb of crude & condensate to Dec 2007.
OPEC Annual Statistical Bulletin http://www.opec.org/library/
The creaming curve for Iraq below indicates a total URR of 130 Gb.
source: page 32 http://www.oilcrisis.com/LaHerrere/zurich.pdf
The black line in the chart below shows that Iraq could produce up to 8 mbd peak plateau, assuming no constraints. This is highly unlikely.
Colin Campbell has dropped his forecast peak production rate for Iraq from 4.5 mbd in December 2002 to only 2.65 mbd in June 2008. Campbell's peaks are assumed to peak plateaus in the chart below.
http://www.aspo-ireland.org/index.cfm/page/newsletter
The Iraq Oil Minister hopes that 4.5 mbd can be reached by 2013. The forecast below delays this production rate of 4.5 mbd by one year to 2014.
Given the instability in Iraq and the need to drill not only production wells but also the requirement to build necessary infrastructure, an upper bound peak plateau of 4.5 mbd for Iraq seems reasonable.
The point I was trying to make Ace,is that some countries are still capable of increasing production. They might or might not be able to offset declines from countries that've peaked. I don't think it'll matter one way or the other. Biofuel research has made gigantic strides lately. Pilot plants are being built all over the world. Commercial production of cellulol and biocrude is about three years off. I think those businesses will fill any gaps in crude production.
Jean and Luis,
Thank you for the informative story about Saudi Arabia!
Do you have an estimate for Saudi Arabia's recent oil initially in place (OIIP) and average economic recovery factor?
Jean Laherrere said that:
250 Gb appears possible, but given the available data, I will continue to assume a more pessimistic URR of 185 Gb.
The creaming curve below is indicating an OIIP of about 600 Gb for Saudi Arabia. This chart is from "Saudi Arabia - Can It Deliver?" by Jack Zagar, May 2005
www.cge.uevora.pt/aspo2005/abscom/ASPO2005_Zagar.ppt
The next chart is also from Zagar's presentation but shows more detail about OIIP by field and also the OIIP claimed by Saudi Aramco from their presentation on Feb 2004. The steady linear increase of Saudi Aramco's OIIP appears to increase by just enough annually to ensure that their year end remaining reserves remain constant at 260 Gb. In addition, Aramco's OIIP is much higher than Zagar's OIIP of about 580 Gb in 2005. My assumption is that Aramco's OIIP figures are artificially high and this view is shared by Zagar when he states in his presentation notes from slide 4 that:
Consequently, a reasonable assumption for Saudi Arabia's OIIP remains 600 Gb.
The average recovery factor for Saudi Arabia is likely to be between 30% to 37% as discussed in my story called "Saudi Arabia’s Crude Oil Reserves: Particulars or Propaganda?" June 15, 2008
http://www.theoildrum.com/node/4153
This indicates a crude oil/condensate URR of 180 Gb to 220 Gb for Saudi Arabia, based upon 600 Gb OIIP.
The following annual and monthly HL charts indicate URR of 185 Gb.
Prior to advanced horizontal well technology, the Saudi economic URR might have been only 160 Gb. Afterwards, this increased to a potential 185 Gb.
click to enlarge
The monthly HL also indicates 185 Gb. Please note that both of these HL charts give rough estimates only.
click to enlarge
Assuming 185 Gb URR for Saudi Arabia gives the forecast below and indicates that, despite Aramco's continuous media statements and more than a twofold increase in the oil price from 2005 to 2008, the average crude/condensate production rate in 2008 will be less than 2005, followed by a steady decline.
click to enlarge
ace,
i have the greatest respect for your work.
"The average recovery factor for Saudi Arabia is likely to be between 30% to 37% as discussed in my story called "Saudi Arabia’s Crude Oil Reserves: Particulars or Propaganda?" June 15, 2008"
but, i think you might be a little pessimistic on recovery factors.
abqaiq is discussed above. i believe that 50% recovery is a minimum extrapolation of the linear rate vs cumulative graph. i also believe that abqaiq is as good an analog as we will find for ghawar. so imo, ghawar will recover > 50% ooip. i dont know about the balance of the fields, but if these 2 giants are at 50%(or greater), i dont think their overall recovery will be as low as 30%. the 37% may be too low also.
elwoodelmore,
I am pessimistic but since there is no reliable data from Saudi Aramco, everyone continues to speculate. Abqaiq and parts of Ghawar may have very high recovery factors but some Saudi fields will have low recovery factors which implies a lower average recovery factor for all fields.
Abqaiq might have a recovery factor (RF) above 50%. IHS believes it's even higher. Table 1 below shows that Abqaiq's RF was 72% in 2004 and dropped to 60% in 2005. The IHS URR for Abqaiq in 2005 was 19 Gb which implies OIIP of 32 Gb.
Table 2 shows Abqaiq URR of only 11 Gb, based upon Saudi Aramco's Feb 2004 presentation by Nansen Saleri. If an OIIP of 32 Gb is used then the Abqaiq RF is only 34%. That means that we know with almost 100% certainty that Abqaiq's RF is somewhere between 34% and 72%.
IHS' RF changes significantly from 2004 to 2005. For example, Ghawar 2004 RF was 60% which increased to 70% in 2005 and OIIP also increased by 7 Gb creating a huge increase in Ghawar URR from 122 Gb to 147 Gb. The IHS weighted average RF for the top 12 fields increased from 53% in 2004 to 65% in 2005. How does IHS justify such increases other than it wants to please Saudi Aramco as it is probably a valuable customer?
Look at the difference between Wood MacKenzie Manifa URR of 4 Gb versus IHS 2005 23 Gb. This is huge variance. Same for Safaniya, WM 2005 25 Gb versus IHS 2005 55 Gb. If IHS and WM can't agree on Saudi data, it's no surprise that Matt Simmons is calling for energy data transparency.
http://postcarbon.org/files/JD_CV/ByJulian/2004%20Petro%20Review%20-%20S...
Both of the tables are sourced from pages 25 and 26 of Jean Laherrere's ASPO 2005 paper "Forecasting production from discovery"
http://www.peak-oil-crisis.com/Laherrere_PeakOilReportMay2005.pdf
Table 1
Jean Laherrere constructed Table 2 by using the depletion numbers from slide 15 of Saudi Aramco's Feb 2004 presentation by Saleri and Baqi.
http://www.saudiaramco.com/irj/go/km/docs/SaudiAramcoPublic/Speeches/Spe...
Table 2
Ace,
That 11 GB figure for the Abqaiq Ultimate in Table 2 is erroneous. I'm not sure where that came from, but from Saleri's 2006 presentation, the Abqaiq OIIP is 24.7, the amount produced to date was 12.2 (49% of OIIP), and the eventual recovery was predicted to be 17.1 (70% of OIIP). The Arab-D reservoir will be over 70%. The wild card is the recovery from the Hanifa.
JB
thank you for your response. just to make it clear, i am basing my guesses on an ooip of 30Gb for abqaiq and 170 - 190Gb for ghawar.
for ghawar, these figures are based on aramco pre '82 and more or less confirmed by the work of stuart, joules, euan mean, etal.
for abqaiq, i was just using the 30 Gb from jean's post. it seems unlikely, to me at least, that the ooip in abqaiq is as low as 24 Gb based only on the rate vs cumulative. recovery at '06 was more than 12 Gb.
IRAQ
Is still very contentious politics. The Empires capture of the resource seemed very sensible at the time.
Iraq will make damn sure it does not produce much oil until the enemy is gone. For them it is a double whammy, they have to pay for what others destroyed and still share their heritage with the aggressors. Better to pump slowly until all the oil is for their own account.
If the Empire keeps sucking and there is no exit strategy, it could really get nasty.
I once lived in an enslaved country and we were terrified that they would poison the water, or some equally undefendable ploy.
Graham