Why oil costs over $120 per barrel
Posted by Euan Mearns on May 30, 2008 - 9:44am in The Oil Drum: Europe
(New readers, click "there's more" below for the whole article...)
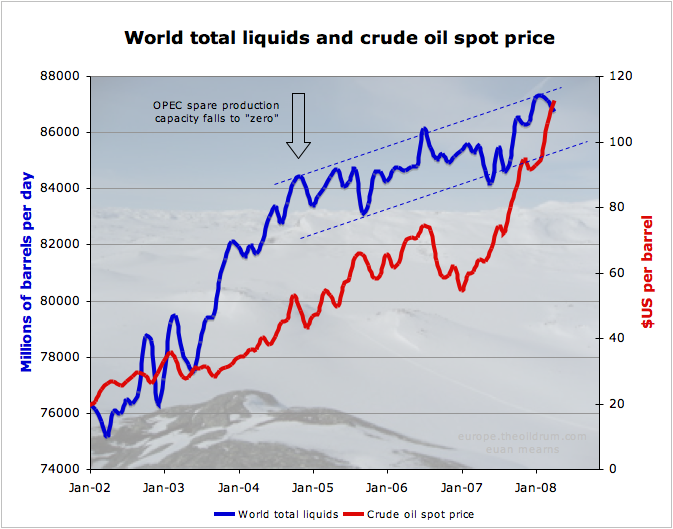
Global Total Liquids production and oil price, January 2002 to present. Production data from the IEA, data files supplied by Rembrandt Koppelaar. Monthly average WTI oil prices from Economagic.
With oil reaching $135 / barrel, Oil Drum readership exceeding 30,000 unique visitors per day and many wild stories circulating in the MSM as to why oil prices are so high this post strives to explain why oil prices are rising exponentially:
• Supply and demand
• Decline of older fields
• Declining net energy and energy density
• New mega-projects
• OPEC spare capacity
• Peak exports
Production and demand
The most significant feature of the chart up top is the dog leg in production growth in 2004. Prior to then the flow of new oil field projects combined with increasing utilisation of spare capacity allowed global oil production to grow and to meet much of the growth in demand.
In 2004, OPEC spare capacity fell close to zero (see below) and the world struggled for a number of reasons to bring on new supply to compensate for decline (see below). The slowing of production growth has meant new supplies are insufficient to meet growing demand and the price has gone up to balance the books. Higher prices stimulate conservation that may take the form of fuel efficiency (driving a smaller car) or abstinence (poor people being priced out of the energy market).
Every year a large number of new oil fields are brought on line. However, this does not directly translate to growth in supplies since amongst other things the production decline in existing fields needs to be replaced first:
new annual production capacity = consumption growth + annual decline + spare capacity growth
Decline
All oil wells, oil fields and oil provinces are exposed to a phenomenon called decline. Producing oil depressurises the sub-surface reservoirs and uses up the reserves. With time the proportion of water to oil that is produced in any well increases (increasing water cut) and this combined with depressurisation leads to declining oil flow rates.
Combined, these processes result in naturally declining production. It has been estimated that the global average decline rate is 4.5% per annum. (personal communication, Peter Jackson, CERA). What this means is that every year the global oil industry must bring on stream 3.8 million barrels per day new production just to compensate for decline (4.5% of 85 mmbpd). If less than 3.8 million bpd are commissioned then global oil production will fall and vice versa.

The higher global oil production rises, so rises the amount of new annual capacity required to compensate for decline.
As global oil production has risen, the annual new capacity required to offset decline has gone up too. Bearing in mind that all the best fields have already been produced, annual decline must be offset using second and third class oil fields. This task eventually becomes impossible and a production plateau is attained. That is where we are right now.
Net energy and energy density
The world has already used up a large proportion of its best oil reserves. These are the light sweet crude oil reserves produced on shore from first class reservoirs.
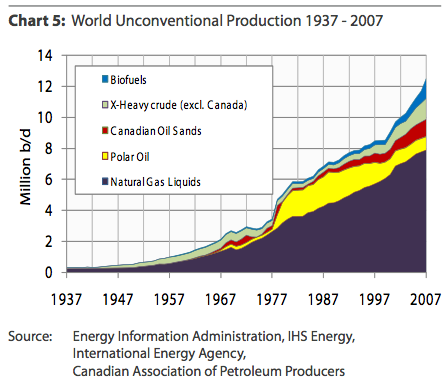
The proportion of low ERoEI liquids and low energy density liquids is growing exponentially. Source EIA and Oil Watch Monthly.
This chart shows that a growing proportion of world total liquid fuels production comprises second generation liquids - e.g. natural gas liquids, syncrude from tar sands and biofuels.. These are essentially synthetic liquids that need to be created and the process of creation uses energy. The term used to describe this concept is Energy Return on Energy Invested (ERoEI) and while historic oil production may have had large ERoEI numbers greater than 100, these synthetic liquids have low ERoEI. Around 1.2 in the case of temperate latitude ethanol and 5.0 in the case of syncrude produced from tar sand. The main point is that a steadily growing proportion of the global total liquids production is being used to produce these liquids leaving less for society to use than the bare figures may suggest.
ERoEI = (energy contained in fuel) / (energy used to produce fuel)
When the energy used to produce a fuel is larger than the fuel itself contains the ERoEI will be less than 1 and the whole exercise is rather pointless apart from in exceptional circumstances where energy quality is very important, e.g. in food production.
A second and equally serious issue lies in the energy density of the new liquids being produced. In energy terms, 1 barrel of ethanol or a barrel of liquefied natural gas is not the same as a barrel of crude oil. The latter contains significantly more energy. Hence measuring energy production by the volumes produced (barrels) is misleading and presents an over-optimistic picture.
As a rough approximation, the energy equivalence by volume of ethanol and LNG are as follows:
1 barrel of ethanol = 0.61 barrels of crude oil
1 barrel of LNG = 0.73 barrels of crude oil
In summary, the picture of rising liquids volume production up top is deceptive. With the passage of time the energy content of those liquids is falling steadily and the amount of energy used to produce them is rising. This means less energy for society to use at a higher cost.
31.8 billion barrels per year
The world now consumes 31.8 billion barrels of oil per year. 1978 was the last year that this volume of oil was discovered and more recently discovery has been running at less than 10 billion barrels per year. It is an utterly forlorn hope that exploration and new discoveries may alleviate the current supply crisis.
Mega projects
The inventory of past discoveries has not yet been used up and a list of new oil mega-projects first complied by Chris Skrebowski has been expanded and maintained by The OIl Drum in Wiki format.
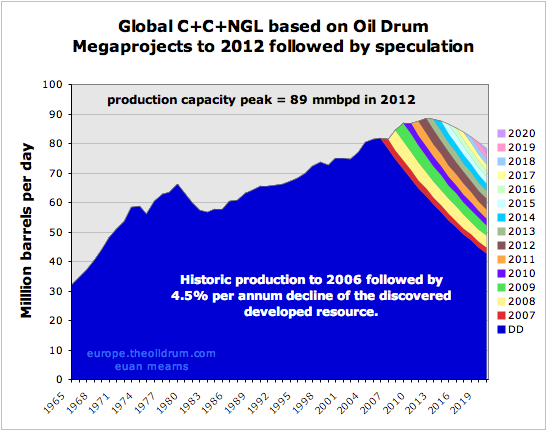
Global crude + condensate + NGL + syncrude scenario based on TOD mega-projects database as of 27 May 2008. This is not a definitive forecast since there is uncertainty over decline rate, project slippage and there is no allowance made for small projects. Beyond 2012 there is a planning horizon for projects and so beyond that date is pure speculation based on 10% per annum decline in new production capacity - and this may contribute to the apparent peak at that time. The 4.5% per annum decline rate is based on a personal communication with Peter Jackson (CERA) who conducted a comprehensive study of oil field decline last year. This decline is applied also to new production.
At face value, these mega-projects should be sufficient to ensure some production growth in the coming years.
However, the pattern of recent years has been project slippage owing to global shortages of materials, manpower and rampant oil service sector inflation. The pattern of slippage may continue and the promise of an increase in new supplies may remain just that – a promise.
Spare production capacity and OPEC
It is a feature of natural resource depletion that there is either a glut or a shortage. Managing this during the early years of resource exploitation causes all sorts of problems. On planet Earth we need to be thankful to OPEC for trying to manage this problem via their production-sharing cartel. For much of the period since OPEC formed in 1960, the world had excess productive capacity, i.e. production potential was higher than was utilised. Withholding this reserve capacity helped bolster prices and reduce demand. But with erratic additions of non-OPEC supply and a tendency for certain OPEC members to cheat on their quota, oil prices tended to swing in an unpredictable manner through the period 1960 to 2000.
Since 2000 this situation has changed. Global demand for oil has continued to increase and to meet this demand much of the OPEC spare capacity has been switched on so that all but Saudi Arabia are now producing flat out.

Global spare production capacity from this presentation by Lawrence Eagles of the IEA (link lost). Note how 8mmbpd spare capacity in 2002 had all but disappeared by 2004. It has since then grown slightly but is once again in decline.
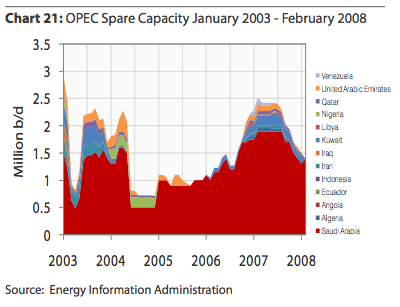
This more detailed and up-to-date picture from Rembrandt Koppelaar's excellent May edition of oil watch monthly shows spare capacity in sharp decline. Despite a healthy inventory of mega-projects, the world is quite simply not managing to bring on new supply fast enough to compensate for decline.
In order to grow spare capacity, the world each year must commission new capacity to compensate for decline and to accommodate increased demand:
spare capacity growth = new annual production capacity - (annual decline + consumption growth)
As demand continues to rise against static supply, the only solution is for prices to rise and to price poor people out of the oil consuming economy.
Much of the spare capacity held in Saudi Arabia is heavy sour crude oil and the world currently lacks capacity in specialised refineries to handle this crude.
Peak exports
Another important concept is to consider is oil exports as described here by Westexas and Khebab. Oil exporting countries have increasing wealth and are attracting massive inward investment and migration resulting in steadily rising oil consumption. Indonesia provides a classic example of a former export land whose rising consumption has totally consumed their oil exports. Indonesia, once part of the oil supply solution has become part of the oil demand problem and has just left OPEC.
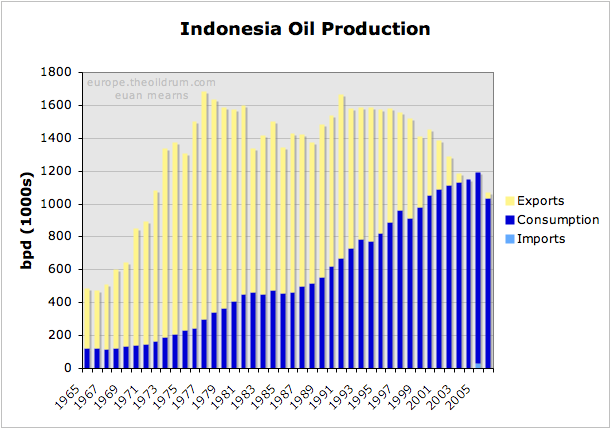
Rising demand and falling production has totally consumed Indonesia's oil exports in the space of 40 years. Indonesia's passion for bio-fuels is explained by this chart.
In 2006 Luis de Sousa produced this analysis of global oil exports. Those seeking an explanation for why oil now costs over $120 per barrel need look no further than this chart.

Luis de Sousa's analysis of net oil exports shows a peak in global oil exports in 2004/5 followed by a period of gradual decline until 2010. Net export decline then accelerates. If this analysis is correct then the current oil price / oil supply crisis will shortly get much worse. However, note that 4 important exporting countries - Iraq, Nigeria, Azebaijan and Kazakhstan - are not yet included in this analysis.
Oil is still cheap

At $2 per liter bottled spring water costs $318 per barrel.
Oil is still very cheap. Bottled spring water at $2 per litre works out at $318 per barrel. Oil is fundamental to our lives for transportation and a myriad products ranging from plastic to pesticides. Unlike spring water, oil is finite and costs significantly more to find and produce. The price of oil will continue to rise until the world as a whole decides it can do with less or until meaningful volumes of energy substitution take root.
Subsidies and taxation distort the market
Many of the world’s oil consumers do not pay the market price paid by the OECD. In Russia, the Middle East and China and many other countries oil and gasoline prices are subsidised. So the thirst of those consumers is not abated by current high spot price. Taxation in Europe and Japan also de-gears the impact of high oil price in those regions where high tax means that gasoline is already expensive. The impact of rising prices is felt less in these countries - though it is now beginning to bite.
Secondary factors and excuses
There are a range of secondary factors impacting the day to day fluctuations in oil price such as:
- Speculation
- Political unrest in producing countries
- The depreciation of the $US
- Prime exploration acreage that is off limits to OECD corporations
Speculation
Financial speculation in oil futures is being offered increasingly as the reason for high oil prices. True, speculation is rife. However, the futures market is a zero sum game. For every long position there is a short position and the price is ultimately struck by the individual who takes delivery of the oil - which is then refined and purchased by a consumer. For so long as consumers keep demanding oil at ever higher prices, the price will continue to rise.
The only way speculation could impact the oil price is under accumulation. Inventories of crude oil and refined products have been falling for a year (see figures 14 to 17).
Political unrest
True, political unrest in exporting countries such as Iraq and Nigeria means that less oil is being produced. But this situation has prevailed for many years now and is likely to get worse as energy poverty begins to bite.
The depreciation of the $US
True, the depreciation of the US$ has contributed to the rise in oil prices. But the oil price has risen in € too.
From Countdown to €100 oil by Jerome a Paris.
Off limits exploration
True, there are vast tracts of the USA that are under-explored in the ANWR and off the east and west coasts where the US has placed a high price on protecting their own environment. But it is not true that the Middle East and Russia are under-explored and that greater access to these areas by OECD companies would transform the current situation.
In summary these secondary factors touted by the MSM, politicians and oil companies are nothing more than an excuse and a distraction from the core problem which is demand growth running ahead of supply growth for over three years now. If the USA, Russia or Saudi Arabia could turn on the taps and produce an additional 3 mmbpd, the oil price would fall tomorrow. But they can't and the only way the oil price will come down is by reduced demand brought about by pricing poor people out of the energy market and by deepening recession.
Conclusion
We are now in the early stages of a full blown energy crisis that was predictable if not wholly avoidable. Politicians are awaking to the crisis now that escalating energy costs make its existence plain to see. It is highly unlikely that politicians will now grasp the gravity of the situation that the OECD and rest of the world faces and the responses will likely be ineffectual and too little too late.
The principal reason for current high oil price is the proximity of a peak in global oil production. Politicians must understand this and then grasp that natural gas and coal supplies will follow oil down by mid century. Reducing taxes on energy consumption right now is the wrong thing to do. Taxation structure needs to be adjusted to oblige energy producing companies to re-invest wind fall profits in alternative energy sources on a truly massive scale.
Energy efficiency should be the guiding beacon of all policy decisions and this must apply equally to energy production and energy consumption.
Personnel
Editors
Contributors
Peak Oil Primers
Archives
- November 2010 (3)
- October 2010 (6)
- September 2010 (4)
- August 2010 (7)
- July 2010 (6)
- June 2010 (7)
- May 2010 (2)
- April 2010 (8)
- March 2010 (4)
- February 2010 (6)
- January 2010 (3)
- December 2009 (5)
- November 2009 (8)
- October 2009 (12)
- September 2009 (6)
- August 2009 (5)
- July 2009 (11)
- June 2009 (8)
- May 2009 (16)
- April 2009 (10)
- March 2009 (7)
- February 2009 (10)
- January 2009 (15)
- December 2008 (9)
- November 2008 (9)
- October 2008 (9)
- September 2008 (13)
- August 2008 (10)
- July 2008 (14)
- June 2008 (23)
- May 2008 (16)
- April 2008 (12)
- March 2008 (16)
- February 2008 (9)
- January 2008 (13)
- December 2007 (13)
- November 2007 (16)
- October 2007 (22)
- September 2007 (8)
- August 2007 (9)
- July 2007 (16)
- June 2007 (8)
- May 2007 (7)
- April 2007 (7)
- March 2007 (10)
- February 2007 (10)
- January 2007 (12)
- December 2006 (9)
- November 2006 (15)
- October 2006 (4)
- September 2006 (5)
- August 2006 (5)
- July 2006 (9)
- June 2006 (5)
- May 2006 (10)
- April 2006 (9)
- March 2006 (13)
Vital Trivia
License

This work is licensed under a Creative Commons Attribution-Share Alike 3.0 United States License.
I wonder, will bottled water ever be cheaper than oil? How much oil is spent in piping and treating the water, bottling it and transporting it close to the consumer?
In terms of volume oil is by far the most traded commodity in the world today. What all those folks looking for scape goats need to understand is that 80 odd million barrels a day is really a big figure. Keeping that number for these last few years has been a tremendous task and a very special moment in Mankind's history.
Correct me if i'm wrong:
85 million barrels; 159 litres per barrel
Total litres = 13.5 billion litres
Estimated human population about 6.5 billion people.
Divinding 13.5 by 6.5 we have 2.07 litres produced per every human.
Meaning that if we'd passed the responssability to every human being in the planet of producing some kind of liquid that after some treatment could replace oil, every one had to produce daily 2 litres of such liquid.
I don't drink that much water per day.
MetaPico
You should drink 64 ounces of water everyday to keep your kidneys working fine and all the other running bady parts. If you don't then you are not Cycling your body like it should run.
But then again niether do I. But I am half camel, and I have had Kidney Stones, 3 times in the past 2 years.
Nothing we have can at this time equal the power production like OIL can, not water, not Urine, and not coca-cola..... So given the energy density of OIL, we better start making some life changes soon.
Charles.
2 litres a day! Even if I rendered down the wife, I figure that I'd only get about 13 litres of dripping. (Hmmm, I wonder though, maybe it would be worth it for one final week of driving pleasure!)
Desalination of seawater has a low energy consumption compared to the energy in oil.
This water could be bottled :-).
ca. 2003 stated price <8$/1000 Gallon
http://www.membranes-amta.org/media/pdf/desaltingcost.pdf
and approx the same here, where it is noted the importance of using updated energy costs.
http://cat.inist.fr/?aModele=afficheN&cpsidt=18585189
and a nice description from california on the kWh necessary for various techniques.
http://www.coastal.ca.gov/desalrpt/dchap1.html
kind regards/And1
for what it is worth
the 30+ billion plastic water bottles we bought in 2006 ...
Who is this we you speak of, Kemosabe?
So drink tapwater and dress in recycled paper coveralls that you can use as fuel every month or two when they become obnoxious for other folk to be around. Sheesh.
refer to the link for author and details.
Here in the uk I recently bought loads of Buxton water (best quality spring)in 1.5 litre bottles, from my local T*sh*tco and it cost 17p per litre, or 34p per litre at usual price. I have to conclude that the US dollar must be really worth 0.1 GB Pounds rather than the ~0.6 generally supposed.
The Bottled water issue is that 204 Dollars is a value added tax. I ran numbers for my Dad's Club soda per barrel, then took out the price on One barrel of Oil for the production costs of the One barrel of Club Soda.
I was really hit hard today when I went to Buy Eggs from Wally-World. Dang, I thought the prices were high a while ago.
I don't drive so I don't see the pennies flying out the door so much as I used to. I walked to the Local Wally-World this afternoon and again this evening from my 3rd Ex-wive's trailer and seeing that I either take a bus or walk everywhere I just notice that the Number of Cars seems to be there still and Wally-World was just as packed in. But I did notice the cost of Food going up and up.
"Food or Gas?" I was saying to anyone that could hear me while I walked the Isles in the local Wally-World....
Being recently disabled because of damage due from Blood Clots in 2005, I notice where my dollars go I am Glad I don't have to pay for a car too.
But sooner rather than Later and before the Election this is going to Blow up into a full blown crisis sooner than most MSM and Poli-tick-ians know.
Charles.
Bottled water is already much cheaper than oil. Just because water costs a buck a liter (or more) doesnt mean it costs $8 a gallon or $300 a barrel. Most of the cost of water is in the per unit price, and it doesnt scale linearly. If you were to buy a barrel of spring water, it would only cost you about $10-$30, depending on where you are. Most of that cost would be delivery.
In a sense, when you buy water, you are really buying oil. The oil it took to pump and package the water.
I get a flat of 35 1/2 liter bottles of water for $6 at Costco. What you pay for is convenience.
I lifted the price from this link here:
https://secure1.securewebexchange.com/aquamaestro.com/innerview.asp?cati...
One of the real issues here is the poor quality of water in our taps. In Aberdeen my wife and two kids refuse to drink the tap water which they claim is foul.
Bottled water wastes energy and produces so much waste.
The crude oil vs bottled water comparison argument is specious and getting annoying. If you're going to compare crude oil to water, don't compare it to bottled water but rather to tap water. Or better yet to the bulk cost of ocean or lake water. It is disingenuous to compare a processed and packaged product to a raw material.
A very good read. Does the graph showing the amounts of unconventional oil allow us to correct the all liquids graph for the lower energy values of the ethanol and natural gas liquids? This would allow us to see whether all liquids really is increasing? Just eye-balling the NGLs, it looks like all liquids should "really" be about 2 million bpd lower.
Peter.
|It is a quite concise intelligent and simple explanation of the problem... it is a good read.. like a lot of stuff at TOD
Is this stuff circulating by more direct lobbying means to the powers that be.
I see WT has MSM article lined up and all but what have "we" on the inside track. who do we have on the inside? anybody? Or is it just hit the media via osmosis?
Gordon Brown today was terrifyingly inept. I hope he was just posturing for public consumption but my take is he hasn't got a clue.
Not an out and out doomer but the current reactions are not confidence inspiring.
Boris
London
I think that a lot of journalists are Peak Oil aware, but the problem is the tiny--but slowly growing--number of Peak Oil aware journalists that are willing to write about it.
We need to keep in mind journalists can write only what editors allow. I've not heard a single comment about what the editors know or don't know or do or don't do.
Perhaps a more effective/efficient outreach might be to contact editors?
Cheers
can you embed in "write to them"?
Boris
London
Newspapers are businesses. The measly 1.50 they get to drive a Sunday paper to my remote location is nothing of what it takes to pay for it. Advertising is their source of revenue.
I think most editors would look at harping on PO as advertising revenue suicide.
When you really wrap your mind around this stuff, it is very scary, maybe the Mayans have it right "2012".
What sells? Sex, blood, violence... plenty of that could be coming soon!
Besides, this stuff is a bit addictive. Once they get their readers hooked on PO, they'll have 'em for life... though that may not be long...
He-he...
Cheers
"What sells? Sex, blood, violence... plenty of that could be coming soon!"
True!
"this stuff is a bit addictive"
Double Tripple true!!
I like your sense of humour, It will be needed.
Newspapers are businesses. The measly 1.50 they get to drive a Sunday paper to my remote location is nothing of what it takes to pay for it. Advertising is their source of revenue.
I think most editors would look at harping on PO as advertising revenue suicide.
When you really wrap your mind around this stuff, it is very scary, maybe the Mayans have it right "2012".
David Strahan has an article in today's Daily Telegraph, titled "sory Gordon but geology has us over a barrel". I think Gordon Brown may be waking up to reality as well. I think he has recently (very) been to Scotland to try and get North Sea oil production revived and may have been told some uncomfortable truths, though this is my cynicysm at work not necessarily factual!.
According to the same paper he is talking about tax concessions to help boost North Sea Investment. (words like "Horse shut bolted gate after" come to mind).
Which is a typical dud MSM headline for when you want to Pravdicate the issue. In contrast to, say, "We are now entering into an unprecedented and unending crisis". You'll never read that in any newspaper.
As for what our Prime Criminal says, it's traditional form for the government to blame natural forces for its woes. If the opposition were to start doing so too then that really would be a transformation.
Robin,
Point 1
Don't disagree with you, just pointed what was said. Headlines based on loose puns are just the name of the game i'm afraid, anoying as they may be.
Point 2
No problem here either. Infact to go further politicians will take credid for all things good, yet blame forces beyond their control for all things evil. We all know the UK's credit boom payed for the economic growth of the last decade, now, I fear its double bust for the next few to come. That's not Gordon's fault (sarcasm), it is the USA's!
point 3
Now you are asking for too much indeed!
Boris, from this side of the pond, Gordon looks like a blooming genius compared to the draft dodgers and congressional nitwits running this country. Absolutely superb and concise summary of the problem. Nothing most of us here at TOD don't already know but nonetheless a superb compilation of all relevant data distilled down to the basics. It is a classic monograph which will go into my "saved" folder.
I think I need to work with Rembrandt to see if we cannot come up with an energy density chart normalised , because I do suspect that the volume chart will at least be flattened in doing so.
This is a chart of liquids - shouldn't the analysis be of Liquids Returned on Liquids invested?
Aren't we dealing with the Oil/liquids crunch, not the energy crunch? E-ROI is certainly important for cost and long-term sustainability, but that's a different analysis. For instance, if we use coal (or natural gas, if you decide that NG isn't a liquid fuel) for ethanol distillation, then the Liquids Returned on Liquids invested is about 5:1.
I'm not sure it's fair to adjust the Liquids data for the low E-ROI of tar-sands and ethanol.
I'm not sugegsting adjusting for EROEI - though that would, I suspect be truely eye-opening - but for the fact that the energy contained in, say, 1 barrel of natural gas liquids is only 73% of the energy contained in a barrel of oil. So, it's not really counting apples and apples to add together crude oil barrels and NGL barrels,
Peter.
Russia and Saudi Arabia
Some other very important points. Russia seems to have reached a second production peak following recovery from collapse. Rising production in Russia since 2000 has helped global supplies a lot. This additional supply now going into reverse is a very serious problem.
And Saudi Arabia is struggling to raise production and / or spare capacity despite new mega projects suggesting that they too are fighting decline.
I am currently sworn to secrecy, but there will be a major MSM article coming out soon, hopefully this week, on net oil exports.
IMO, there is almost no chance that Saudi Arabia will, in 2008, match or exceed their 2005 annual production rate, which would mean three straight years of production below their 2005 rate, which leaves us looking toward 2009, while their consumption is increasing at a rapid clip, probably about +6%/year over the past five years, which has the predictable effect on net oil exports.
Westexas I was wondering if you would consider one valid change to export land.
Instead of consumption increasing forever in exporting countries we would expect it to level out at some consumption level. Lets say two or three times the level of consumption per capita in the US.
I played with it a bit and it does not make a huge difference but it does leave some countries with exports.
However we would expect the rate of growth to begin to decline as it hits these limits.
Given a population of 300 million for the US and a 25 mbd use rate we have .083 mbd/million people.
Saudi population is about 30 million so 2.49 mbd *3 = 7.47 mbd. So the max is probably between this or about 5mbd. This leaves about 2-3mbd or so of exports. Actually all other countries go to zero for the most part but we can expect the per-capita growth rate to slow as usage approaches and surpasses the per capita usage in the US. If Saudi Arabia stopped at levels similar to the US then they would have more exports.
Its actually done correctly here and I think some of your models have it presented correctly.
This paper has it right. And I did my rough one before I found this and its about right :)
http://graphoilogy.blogspot.com/2006/02/saudi-arabias-ability-to-export-...
The real kicker is people need to understand that simply having the people in the exporting countries increase their standard of living in line with what the US enjoys is sufficient to effectively stop world oil exports. I don't think a lot of people realize that oil exports actually require most countries to impoverish the citizens. Nigeria, Russia, Mexico etc none of these countries would have ever been oil exporters if the citizens enjoyed a standard of living close to ours. In effect the US was stealing the worlds oil and not compensating the citizens of these countries with a decent standard of living.
If the Saudis kick out the immigrant labor force, then the Saudi oil consumption will go down a little, and immigrant's home country's oil consumption will go down a lot. Ditto for the US and Europe.
If we have the choice of paying twice as much for the burger slinger at McDonalds, or walking to work...not to mention the immigrants in America aren't going to be happy about the dollar dropping against hard currencies like the Peso...
The energy usage of a country is a proxy for its population growth and rate of development. Population in KSA is rapidly exponential as the Graphoilogy site shows. The usage per capita is high but fairly constant at around 25.
Fig 4. is the kicker -even with lower growth rates NET exports still decline fairly rapidly. For a country further along the curve (higher % internal usage at time of peaking) the decline is even quicker as Jeff has repeatedly shown for Indonesia and UK... 7 or 8 years to 0...
Of course the whole point of the ELM is to show the negative effects that unconstrained internal energy usage in NET exporters can have on their exports but I believe this to be an unrealistic assumption
Even Chaiman Mow realised that unconstrained population growth was eventually going to bring the country to its knees -indeed his answer was even more draconian than anything that would be considered in the West.
How to incorporate in the model?
From here on out efficiency will be a key priority for the NET importers and that's pretty much where places like KSA get all their 'stuff' from. So I would add an efficiency 'fudge factor' going forward that eased the energy usage per capita downwards. For KSA it might go from say 25b/capita to the European average of ~12 at peak This would clearly enable a very good standard of living to be maintained and allow for the exporters having a sense of urgency in their energy usage policy...
[Another factor that is not being considered in the ELM is 'substitution'. For example what if KSA decides that, given $500/b oil it wants to go nuclear so that instead of simply burning oil it can export it? -I think this will have a really big effect on enabling exports to decline less dramatically, a 'substitution variable' would be needed but I have no idea how it would work...]
Regards, Nick.
I've previously suggested Phase One and Phase Two net export declines. In Phase One, the cash flow from export sales increases, even as volumes fall, because rising oil prices are offsetting the decline in volume. In Phase Two, rising oil prices can't offset the decline in volume. The transition from Phase One to Phase Two is probably where we would expect to see some lower rates of increase in consumption.
However, consider the ELM itself. I stipulated a 2.5%/year rate of increase in consumption (and a -5%/year production decline rate), which produced a peak export to zero export period of 9 years. If Export Land had a zero rate of increase in consumption, they would have gone to zero in 14 years, instead of 9, not a big difference.
It means they can continue to Export for about 50% longer...
It looks increasingly like the last 30+ years of US 'development' towards service economy, etc. is not a 'model' for 21st Century society but rather a by-product of the fact that they 'got there' first and where able to cream-off the lions share of NET global Oil/Energy...
Now that all the other economies are trying to emulate this 'transition' it will soon be shown for what it is: a fraud... The Economists are gonna love explaining this one to the seething masses...
Ooops!
Nick.
Unfortunately, Saudi Arabia is currently showing an accelerating rate of increase in consumption, up close to 10%/year over the original EIA estimated for 2006 (since revised upward), so that consumption is up at over +7%/year from the revised number, a five year rate of increase of about +6%/year, which would double their consumption in 12 years.
If there is such an article, and people believe it, what happens then? Goodbye to the world as we know it.
check out the WSJ website.
Well done! Wish I could read the rest... If anyone finds a source...
This wipes the lipstick right off the pig. Exports are declining at 2.5%? That cannot but accelerate minus major behavioral changes or magic, one or the other. The reality of the ELM = Peak Oil for net importers. It's as simple as that. Non-OPEC production was flat and/or falling before Russia started their nosedive. So, if the export trend is irreversible, so is Peak Lite. Or ELM-iPL: ExportLand Model-induced Peak Lite.
Welcome to the beginning of the end of the Oil Age.
Cheers
WSJ heh
well done
Boris
London
That Russia graph helped me put this in perspective. Russia has been responsible for between 570,000 and 660,000 barrels a year in new production the last six or seven years. Plus new Russian decline... Even 1% a year is another @ 100,000... Lordy... That's a change of -650k to -750k barrels a year...We're going to be looking at a million barrels a day less from Russia alone within a year or two.
And Mexico is dropping double digits a year...
But prices have nothing to do with decline...
People keep saying that but I don't see it in the graphs (as here). Is it based on some inside info instead?
Chart 69 shows 6 months of falling Russian production at a time of record prices. But true, this is not enough to call a second peak. From memory, Campbell, Laherrere, Duncan and Youngquist all have Russia hitting a second peak around now based on what they have already produced compared with their reserves. If Russia continues to fall for another 6 months then we may all be in very serious trouble.
Aha, I hadn't noticed chart 69! (I guess my IQ of 180 has become an Idiocy Quotient instead.) Thanks for the clarification.
http://www.tehrantimes.com/index_View.asp?code=169989
Russian oil exports fall 4.9% year over year
Our middle case has Russia approaching zero net oil exports in about 16 years.
Very good article. I think that a lot of the delusional thinking going on can be attributed to the manure being dumped on the public by ExxonMobil, Saudi Aramco/OPEC and CERA, et al, to-wit, that we don't have to worry about Peak Oil for decades--worst case.
Judging by his piece in the Financial Times today, Yergin has recently seen the light on the Road to Damascus.
A lot of what he was saying appeared to have been cut-and-pasted from Matt Simmons' publicity materials.
He even mentioned a study that CERA is supposed to have carried out two years ago on the likely effects of $150 barrel oil....
That was news to me and I suspect others here as well.
Does anyone know anything about that report, or was it just in-house ?
I'll repeat a "hypothetical" question I posed a few days ago. What if a journalist was asking hard questions about Yergin's price predictions, possibly with an article in mind on his numerous failed predictions? How would Danny boy react?
We can't save people who don't want to be saved. Unfortunately they will drag us with them. Attempts to make the media see the light are vanity, don't you think? Has anyone ever succeeded? What master do THEY serve? The consumption industry and they're not about to shoot the golden goose.
Today's (Saturday's) Independent devoted its front page to the decline of oil supply. Followed by three pages of reports and an editorial making clear it was due to peaking supply and we had to reduce dependency rather than cut taxes.
A week or two earlier their front page was "Are we running on empty?" followed by articles of wishfulthinking. A year or two back the Independent (again) had a similar shocking front page, but when I pointed it out to others in Tesco their brains just glazed over.
Today in the shop where I saw the Indy headline, no-one was taking the slightest notice of it. And outside I chatted with an intelligent man who remained absolutely convinced that some new techno-solution, some new source of energy would certainly be found in time and the city's grand redevelopment plans would come to pass.
I don't think it's a media/forces-of-darkness coverup. Rather it is just the eternal Noah's Ark syndrome. The Forces of Darkness are no less insane on this. They have the most to lose and so the stronger the psychodenial.
Thought you were "sworn to secrecy"? i would recommend not divulging anything beforehand.
I'm not naming names (I'm also talking about two different articles).
Unfortunately, the press still takes Yergin at his word. Now he says that in 2006 he came up with a scenario identical to what's happening. This of course is while he and CERA were predicting price declines.
"In 2006, when prices were about $US70 a barrel and temporarily falling, he developed a scenario in which they peaked at $US150 a barrel, bringing about the world's "fourth oil shock". While that was more a projection of what could happen rather than a prediction, events so far have largely followed the script."
Yergin does some CYA
The press has a new CERA:
"Now for the good news. This week, Australian Bureau of Agriculture and Resource Economics executive director Phillip Glyde said oil prices should ease during the next few years as non-Organisation of the Petroleum Exporting Countries supply increased and the growth in demand for oil slowed. ABARE's forecast in March was for prices to fall to $US67 ($70) a barrel during the next five years, although Glyde added this could change the next time the bureau looked at the figures."
Would this be the same ABARE that assumed for their forecasting back in 2001 that, for the period out to 2019-20, the price of black coal would continue to fall by 1.5% per year and that oil would continue to trade at US$23 per barrel?
It is galling to see this change in position and rewriting of history. These people have no shame.
where is the "we got it wrong.. very wrong" its not that difficult to say or humiliating if you think about it.
integrity is everything.. and I say that despite failing on many an occasion myself... but I know from experience I regret not sticking to the path of truth in hindsight.
you bright lads and laddettes at TOD need to steep up your game and seize a bigger share of the mantle
Boris
London
Could it be that the price for a barrel of oil should still not be as high as it is now. See here:
http://globaleconomicanalysis.blogspot.com/2008/05/quantifying-commoditi...
...then here:
http://globaleconomicanalysis.blogspot.com/2008/05/commodities-speculati...
I get more and more confused about the roll of speculation, and wonder if it doesn't have a larger impact on oil prices than discussed here.
I love Mish, but I'm not sure what he's actually trying to say in those posts.
I found this argument on spec and price between Rick Santelli and others on CNBC to be pretty informative: http://www.cnbc.com/id/15840232?video=753754816&play=1
It was discussed in yesterday's DB if you wish to see what others thought.
By the way, this is a great piece Euan.
Normally, Mish leans more toward peak oil, with a speculation subset, so his conclusions (if they were conclusions) have left me baffled. (Another thought was: If we have this type of speculation, and we stop it in its tracks, won't the price runups that the speculators caused lead to a collapse in those prices, at least in the near term?)
It would be nice if a financial news show, which just had two guests debating whether oil has to be delivered when a futures contract expires, would have a follow-up and give the correct answer. But it seems that in order to keep their talking heads happy, the shows that feature them never try and settle the disagreements.
Celticoil - the way I look at it is if oil had been below $50 for the last few years, demand would likely be a couple of million barrels per day higher than now. So the question is would the production be there to satisfy that demand given lower prices?
I believe not, and high prices are destroying demand on a daily basis - which has now got the attention of the politicians and media. For so long as The Economy holds together I also think that demand destruction will place a floor under the oil price since those priced out of the market already will take the opportunity to snap up that bargain barrel when it is available.
Speculators I suspect lie behind some of the short term volatility we see, such as today where the oil price has gone from $128.9 to $129.9 via $126
Thank you for your insights. We have logicalities leaping all over the place, the problem is grabbing the right logic!
The only logic that really needs to grabbed hold of is that we live on a finite world and infinite growthh is impossible in a finite system. There is only so much stuff be that oil, water, iron, land for agriculture, space for windmills, whatever. Eventually, we're going to hit a wall in our expansion.
Here's an example in China of unfulfilled demand.
http://cryptome.org/cn-fuel-low/cn-fuel-low.htm
He claims "All cities of China are like that".
It's just like the 70's... Now, just imagine the Chevelle's, El-Caminos and Lincoln Continentals in line instead of the subcompacts of today.
Oh, and this is a scene that will come to a pump near you within the next few years...
It's just like the 70's... Now, just imagine the Chevelle's, El-Caminos and Lincoln Continentals in line instead of the subcompacts of today.
Oh, and this is a scene that will come to a pump near you within the next few years...
Faith Birol has stated that there is a 12.5 mbpd shortfall between where we are now and where we should be in terms of oil production. The Energy Bulletin had an English translation of this article but removed it, with a promise of an authorized English language translation. No such translation has yet appeared.
Unauthorized translations do exist at multiple websites though:
International Energy Agency admits to 12.5 million barrel per day ...
Chief International Energy Agency ( IEA ) Economist Fatih Birol ...
Fatih Birol interview: 'Leave oil before it leaves us ...
I'm going out on a limb here, but what the hell! I think the price of oil and all energy sources are not now reflecting true costs. I claim that oil prices should be, and will be soon, higher still. The reason is fundamental physics - net energy. It takes time for the impact of declining EROEI to propagate through the economy and feed back to the various cost inputs to oil extraction, shipment, and refining. Rising energy prices always reflect in general inflation. Meaning that the cost of oil rigs, pipelines, transportation, and refining are all going up eventually, thus recursively adding to the base costs. Eventually this has to work its way into the price of oil and the vicious cycle continues.
There is no way to go but down (the economy) while under our current way of accounting for things. Money is sort of a free-floating means of measuring. A more physically realistic method would be to account for everything in BTUs (or make a dollar worth a given number of energy/work units). This would expose the feedback loop explicitly. It would put an end to all the silly speculation about what the reasons are for oil prices being this high.
See my discussion of an energy-based standard for currency at:
Question Everything
George
George,
The energy theory of value has been around for quite a while.
Check out the Technocracy Movement.
They still maintain a web site: http://www.technocracy.org/
Take a look at who provided some of the intellectual underpinnings, King Hubbert!
Some of his writings might interest you.
E. Swanson
Thanks BD.
I didn't know these guys were still in business! I wandered into a Technocracy office in Seattle back in the early '70s when I was a junior at U. Wash. in Seattle. I thought their program and ideas sounded cool. I remember getting into a long discussion with several of the members manning the office about energy. At that time they were advocating damming every conceivable river in the US! I had just written my first attempt at reconciling economics with physics via the relationship between money currency and 'free' energy (the energy available for work in any potential source). The paper was for an econ course (the TA who graded it gave me an A for original thought - the professor later downgraded it to a C since I clearly did not understand economics!)
I don't remember the Technocrat folks talking about energy accounting, but maybe they were using different terminology back then. In any case we had a great talk, but I was not completely happy with what seemed to me to be a total faith in science - what we would call scientism. I thought they might be clutching at straws and I wasn't clear on what the political implications were. They seemed to think a panel of scientists and engineers would 'rule' the land. I didn't so much mind that idea, I just thought it was naive given the general mass stupidity of the electorate (I could not have then imagined it getting as bad as it has).
Anyway, from a quick perusal of the Wikipedia article it looks like they have kept the faith, but updated some of their thoughts about how it will play out. Thanks again for the alert. I will try to dig into their energy accounting methodology to see if it comports with, say, some of the tenets of ecological economics, which is very much nearer to where I am.
George
George
The reason is fundamental physics - net energy. It takes time for the impact of declining EROEI to propagate through the economy and feed back to the various cost inputs to oil extraction, shipment, and refining.
It's like a freight train starting up, as each car starts moving, it picks up some slack at each car, eventually the whole train is moving. Each car makes a loud CRACK sound as the slack is taken up.
What you discribe is the financial equilvant. The CRACKing sound is people out of work, businesses closing etc of the costs makeing their way thru the system. Taking up whatever slack there is.
But this train is moving now, and picking up speed AND Momentum.
Dow Chemical's 20% increase across the board is another loud CRACK of slack being taken up and Financial Adjustments that causes thoughout the whole train. Speed is increasing the adjustments and it is now all in a feedback loop.
This is an elegant analogy, especially if you are a train buff like me!
I agree that the "bidding up" of commodities is responsible most of the recent drastic increase in the price of oil (i.e., price increase from $100 to $130/bbl) and is caused by the very weak dollar. Why I believe this is that the price of gold, food and other commodities have increased dramatically too - nearly lockstep with oil. If these other commodities increased a much smaller amount, then I would have thought that the price increase is solely caused by a crude oil supply shortfall.
The other reason why I believe that the price of crude oil is being driven by commodity trading is that crude oil stocks are not suffering. The U.S. crude oil stocks as well as those for the OECD are well supplied. I suspect that when the Fed starts increasing interest rates again, that the price of crude oil will drop back down to around $100/bbl.
One question I have about the calculation of depletion. Does the 4.5% depletion apply to just crude oil production, crude oil plus condensate, or to total liquids as you have applied them? It seems that CERA would only account for depletion in crude oil production, or perhaps to C+C, but probably not nonconventional oil and certainly not biofuels, but they could be calculating the figure that way.
Retsel
Use the "share this" applet to reddit, digg, and send this post to other sites.
Thanks.
PGoose: Can I suggest that you do a key post on how to do this, just to educate everyone? Yesterday I signed up to reddit and was staggered at how easy the process is of joining and voting. It then got me wondering - surely you must be able to marshall 100-200 readers on here to vote for every article you publish? I had never bothered to figure out how to do it until now, and it really is so absurdly easy.
*sigh* I've done it probably six or seven times over the past year...honestly, I think it's just hard for people to remember to do.
I have to say it PG, I don't like hearing you say *sigh*.
As I see it, TOD has 2 main purposes. The first is to provide information about Peak Oil, and allow discussion about it. It does this very well. Without it there would only be LATOC and PO.com, which serve different niches.
The second purpose is to get Peak Oil into the limelight. Unfortunately, as a person who has been PO aware since early 2005, I have seen the alternative media have zero success thus far penetrating the MSM. Increased coverage of Peak Oil in the MSM in recent weeks is completely due to the once unthinkable price that oil has ascended to.
PeakOil.com recently made a bit of a breakthrough. They are in the lead now. What are you gonna do about it? Keep asking and pleading? Or is it time to pull out your inner Caesar :)
If you're having trouble with the 'Share This' option:
http://reddit.com/info/6l55e
http://digg.com/world_news/Why_oil_costs_over_120_per_barrel
Another couple of charts I made. Not entirely sure what they mean yet. The top one picks out quite clearly two separate trends with the dog leg in 2004 when OPEC spare capacity went to zero.
The second shows a possible roll over in production (too early to say yet) but whenever we see production falling and prices rising sharply I'm pretty sure we will be past peak. In the past, a fall in production has often signaled soft demand and OPEC holding back and normally correlates with soft price. So production falling and price rising is one of my litmus tests for peak.
Euan, Very good summary. Have you created any charts taking into account the lower energy content of the unconventional liquids as reduced barrels equivalent, as you noted? It should make the above chart curve downward earlier and more sharply.
Fantastic article, Euan! You did an amazing job capturing the world's oil realities in the current age.
I'd like to reply to both your article and the graphs you posted above.
First the graphs...
This rapid increase in price coupled with falling world production in March and April was very concerning to me. It has looked like the peak oil scenario you noted above and, if it continues, seems the megaprojects are failing in a big way and trouble may be a bit nearer than new projects would indicate.
Megaprojects caverats...
When you consider that nearly 3 million barrels per day of the 7 million barrels per day of megaproject oil is supposed to come from Saudi Arabia (struggling to maintain production), Russia (in decline since October), Mexico (in unbroken decline for a number of years now), and Nigeria (in political turmoil), things don't look so rosy for increasing production against an approximate 3.8 million barrel per day decline rate.
A fun little thought experiment is matching the 4.5 percent decline rate to Russia, Saudi, and Mexico and adding in the projected megaprojects increases. The net result would be approx 200,000 bpd in new Russian oil, approx 700,000 barrels per day in new Saudi oil, and approximately 300,000 barrels per day in added Mexican oil. So far, this simply isn't happening.
Political unrest...
As for Nigeria, I wonder how any kind of increase can be factored in when the infrastructure needed to support increases is under constant assault. Oil infrastructure is very vulnerable to military attack and its geographic distribution makes it a nightmare to patrol and protect. Until the political environment in Nigeria changes, I would count it out of expanding production in any significant way.
Iraq, responsible for approx 900,000 barrels per day in megaprojects through the end of 2009, suffers similar potential trouble with instability both threatening current production as well as putting at risk any possible expansion. More recent stability in Iraq is encouraging. But it's difficult to count on the situation remaining stable given the current political environment.
In the end, you just have to wonder if the entire megaprojects summary for 2008 represents a paper tiger?
Demand destruction finally takes a bite...
Did you see the recent reports on US oil demand falling by 900,000 barrels per day year on year in the first quarter of 08? This 4 percent or more decline in the US market is likely due to economic contraction in the auto (less driving and new SUV purchases), trucking (less trucks more trains), and air industries (massive cuts in flights/routes) as well as increasing efficiencies -- more small car/hybrid/motorcycle/scooter purchases, more people walking, biking, or taking public transport, shift to trains, and airlines purchasing or making use of more efficient air transport where possible.
What is yet to be seen is to what degree demand destruction in the US impacts economies exporting goods to the US market -- primarily China/India. If the impact is great enough, it is possible we could finally see curbing growth or even flattening in these regions.
Jeffrey Brown's Export Land Model...
is waiting in the wings and about to take center stage. Add the reduced energy of oil substitutes and the net effect is Peak Oil light even at plateau in world production. I'll be very interested to see the MSM report on ELM related issues. Please post it here in flying colors when it comes out!
Conclusion -- Oil Price Fights Demand for production capacity
Seems that the enviroment of demand destruction is finally here. So the world now has an effective means to fight high prices -- pain = less use of oil.
Out of this environment, the factors become a bit more complex.
1.Constrained total world production pushes prices higher
2.Reduced world exports pushes prices higher
3.New energy sources have a mitigating effect on high prices but are not a panacea
4. People use less oil, purchase more efficient machinery, and attempt to shift to non-oil based transport wherever possible.
5. Raging world oil demand becomes anemic world oil demand. Areas of rising demand include Middle East, Russia, China, India. Areas of falling demand include the OECD and the US.
So at what price does demand go to flat or falling? At what point does reduced demand reduce prices? At what price does the current market reach a balance? Will high prices ever result in significant new supply/substitutes? And at what point does constrained and/or dwindling supply push the price yet higher?
I think the above is the cycle we're seeing develop within the markets. It's a little different than raging demand hits a supply wall, pushing prices higher. Here the primary forces are supply constraint and demand destruction. Most economists have nightmares about this kind of scenario. But here we sit.
Back of the napkin new oil price bottom: $90 per barrel.
Back of the napkin new price ceiling: $160 per barrel.
Back of the napkin peak liquids top of curve (bumpy plateau): 2005 -- 2012.
Back of the napkin estimated dates for start of gentle decline: 2008 to 2009.
Back of the napkin estimated date for start of hard decline: Sometime around 2012.
ELM date for start of net decline in world oil exports (Jeffrey Brown is the ELM guru. Jeffrey please correct me if I spread disinformation!): 2005.
One final point to make. With credit in trouble, real estate values falling, and banks at risk, there is less money out there chasing more expensive goods. This is different from the cycle of stagflation where more, rapidly devalued, money chases scarce goods. So in a very weird event, oil prices may fall marginally even as the purchasing power of consumers dwindles by a greater degree. Not deflation. Not stagflation. But conflation.
Robert - thanks for you thoughtful comment. No doubt we have significant demand destruction now. I suspect this started among poor folks / countries back in 2002 and began to bite 2004 and now OECD middle classes are beginning to feel the pinch.
So yes we will start to conserve and be more efficient. I think there is a version of Jevon's paradox that we don't yet understand in this environment which is that energy efficiency cannot lead to greater consumption but will instead lead to higher prices. If we all drive cars that do 60 mpgs then we can afford to pay twice as much for the fuel.
As for your back of napkin estimates. I stick with my 2012±3 years for all liquids peak - this will need the confluence of a few mega projects all coming on together! And I see the ceiling and floor a bit higher than you - $110 to $180 - but this is based just on gut feel.
Hard decline is the scary issue which I have until now placed at the back of my mind. But we need to be concerned that we may be on the cusp of hard decline in exports.
"If we all drive cars that do 60 mpgs then we can afford to pay twice as much for the fuel."
Sure. Similarly, we're willing to pay a great deal for diamonds, because we buy very, very few of them.
PHEV's and EV's are now cheaper than ICE's (with large volume production, which is coming in the next 2-3 years) - we're on the cusp of a whole new type of transportation.
Nick, how are you figuring the statement that they are cheaper than ICE's?
Is that counting fuel costs?
What assumptions are you making for the type of vehicle, range etc?
Not that I would disagree that it may be possible, particularly for EVs, but I would be interested in how youa re running the figures.
"how are you figuring the statement that they are cheaper than ICE's?"
Ok, here goes.
First, let's simplify, and assume we simply add additional battery capacity to a Prius (and a plug, which is trivial). I would argue that a serial hybrid (like the Chevy Volt) is less complex than a parallel (and therefore less expensive in large, mature volumes), but that's not necessary to demonstrate the point.
OK, at 45MPG and $3/gallon, a Prius costs 6.7 cents/mile.
Now, good quality cobalt-based small-format batteries, as used in the Tesla, cost $400/KWH. Iron-phosphate is less expensive, and large formats are less expensive. The plug-in Prius is planned by Toyota for 2 years from now, which gives us another 2 years of the normal 8-10% annual cost reduction seen with li-ion's. Large scale PHEV battery production will instantly raise the volume of production for these 2nd generation li-ions to very large levels compared to conventional li-ion, reducing costs further. That gives us a reasonable forecast of $300/KWH (if this seems too aggressive, perhaps you'll grant that this is very likely several years later, when PHEV's have gone beyond early adopters, are ramping up to much higher production volumes, and batteries are that much more mature).
A123system's batteries can handle 5,000 discharges at 100% depth of discharge. If we assume 250 per year we have a battery that will last the life of the car. At a 10:1 capitalization rate (to account for interest, depreciation and obsolescence), we're paying $30/KWH per year, for 250 discharges, or $.12 per KWH discharged.
At .25kwh/mile, that's $.03 per mile, less than half the Prius cost. If we double the battery size to account for GM's conservative decision to only use 50% of the battery capacity (this is similar to the Prius, and almost certainly unnecessary, but GM's taking no chances at all), we're still at $.06/mile.
Now, charging will be done almost exclusively at night. Utilities are required to offer time-of-use power pricing by the 2005 energy statue, but many don't publicize it. OTOH, PG&E, SCE and Exelon are pushing it. PGE&E's night time pricing (like most CA electricity) is more expensive, starting at $.08/KWH, OTOH gas is also more expensive there.
So, add $.04/KWH for night time electricity (and 4 KWH/mile) for a cost of $.01/mile for power, and we're at $.07/mile, or rough parity.
Of course, taxi's and other fleet operators are likely to recharge more than 250 times per year, dramatically raising payback. For the average driver, add in CO2 costs, and other external intangibles like independence from the ME, and the ability to weather gas shortages and you have a compelling case.
And that assumes $3 gas, and a Prius as a benchmark - $4 gas, and a 22MPG vehicle (the US average) would make the case that much more compelling.
---------------------------------------
Hence my original point - light vehicles are going to change dramatically.
Electrification of light vehicle transportation is cost-effective at $1.75/gallon (for conventional lead-acid batteries) and at $3/gallon for more convenient li-ion batteries, but electric vehicles (either PHEV's or EV's) faced serious barriers to entry in the form of very large investments (capital, emotional, career, etc, etc).
This period of prolonged high oil prices will provide the impetus to push through this barrier. Once the barrier is crossed, costs will come down due to economy of scale, and PHEV/EV's will be forever entrenched. They are likely to follow ever falling cost curves, and largely replace fuel-based transportation.
How this will play out for the whole world (and overall depletion curves) is a tough question, as the US is the clear leader in adoption of hybrids, PHEV's and EV's (Japan sells them, and China is developing PHEVs and EVs), but I see fundamental change ahead for the US.
___________________________
You might ask "What about the cost of converting a car from ICE to battery?"
Here we don't have OEM vehicles and batteries, with large production volumes. Conversions are more expensive, both because of the inefficiency of retrofits, and the much higher cost of batteries at retail which weren't really designed for the purpose.
Tesla is, of course, buying in fairly large volume. They don't promise more than 500 deep discharge cycles (though they're clearly hoping for substantially more).
A123systems batteries have good specs and are fairly widely available, but not in large formats - these are reserved for large buyers like GM, at the moment. Hobbyists are using them for motorcycles (Killacycle) and bicycles, and A123systems offers a pricey Prius conversion. Retail prices are a bit high for a 10 KWH conversion at this point, in my view, but it's doable.
Your best bet for a car conversion (which can handle weight better than a bike) might be lead-acid (though they'll likely give less acceleration, and be less convenient weight and volume-wise). You could use Trojan T-105's - they would cost roughly $800 for 10KWH, and give you roughly 3-400 deep discharge cycles: that's about 20 cents per KWH-discharge, or 5-8 cents per mile. That's roughly comparable to a 30MPG car with $2 gas.
I'd also look into Firefly Energies: they don't seem to be available to consumers yet (they're selling to Husqvarna and truckers), but it should be very soon. They should offer 4-5 times better cycle life and better power density vs conventional SLA, at roughly twice the price, so the cost/KWH should roughly drop in half.
I like that- those costings are very conservative.
Toyota may not be wedded to over-specifying in the same way as GM, and anyway if they decided to use ultracapacitors they could safeguard against deep discharge more easily.
GM has recently affirmed that they are hoping to come in at the original $30k estimate, although they appear to be counting in a $7k tax rebate they are angling for, but just the same that is way better than the circa $48k they were recently saying they might have to charge, and the new cost estimates seem to be due to improved forecasts of battery costs.
There is also 'wriggle room' in that lead acid batteries with ultra-capacitors could be used, possibly by Chinese manufacturers, with much better cost efficiency.
I am not sure how long the US will be the market leader, as both Denmark and Israel in combination with Renault-Nissan are installing power points and battery changing systems throughout their small countries, and EV vehicles are far simpler than plug-in hybrids.
I think it will be awhile before it is worth considering converting my car to electric in the UK, as the government seems to have decided to hold down household expenditure on energy by the simple expedient of not having any available.
An electric bike is a possibility, providing it is foldable, but the theft rate of them will be enormous.
"I am not sure how long the US will be the market leader"
It's very hard to forecast. The more difficult question is poorer customers in developed countries, and poorer areas like India, Africa and S. America, which rely on older vehicles (and, in the case of SA, has traditionally imported used cars from the US), so new electric vehicles may take a while to get to them them. India and China at least have strong high-tech sectors. Poorer customers in the US may have to rely on carpooling and mass-transit for a while...
"that is way better than the circa $48k they were recently saying they might have to charge"
That was a mis-quote - the only other public comments GM has made was Lutz's comment a while ago that costs seemed to be rising closer to $40K than $30K. I think it's all really a question of how development costs are amortized, and how large an early-adopter premium GM thinks it can get away with (and, of course, the tax credit).
"An electric bike is a possibility, providing it is foldable, but the theft rate of them will be enormous."
A modest battery wouldn't be too expensive - do you think theft rates would be higher than for ICE motorized vehicles? I would note that electric bikes are almost certainly better cost and CO2 emissions-wise than person-powered bikes - retail food is expensive and high-emissions!
I was just basing my $48k figure on what a site I read yesterday said - doubtless it was in error.
On using electric vehicles in third world countries, in on of CNN's excellent Eco-solutions pieces they looked at Nepal, where there is a cottage industry to build electric taxis, which are very popular with the drivers even though somewhat more expensive than ICEs.
As long as you can get hold of the batteries and motors the fundamental simplicity of EV's seems well adapted to the Third world.
As for theft in the UK, bike thefts here are massive, and even chained up they have wheels parts stolen. Unlike cars, they can't be shut up.
Batteries would be a fine target, so the practicalities of ownership are rather difficult here.
My guess is that if running cars becomes impractical, large stores will go providing guarded storage for bikes whilst you shop.
"the fundamental simplicity of EV's seems well adapted to the Third world."
Makes sense - that's encouraging.
"As for theft in the UK, bike thefts here are massive, and even chained up they have wheels parts stolen. Unlike cars, they can't be shut up.""
Wow.
"shut up" means garaged?
"if running cars becomes impractical"
hmmm. Brings us back to finance questions, perhaps. I've a couple of thoughts on which I'd like to get feedback.
First, Alan mentioned the other day that France had a good balance of trade. I just accepted that, but I took a look later, and it looks to me like France has a 2.5% trade gap (of GDP), which is fairly large - mostly from energy.
2nd, let me repeat something I just posted elsewhere:
World financial stability and growth is really all a question of how well oil exporters recycle their petrodollars.
If they follow the example of Norway, and sterilize at least some of their oil money by buying and holding oil importer debt (like T-bills), global trade will do just fine. Debt will balloon, but it won't matter - oil importing countries can keep their economies afloat by using the borrowed money to reduce taxes. Eventually the debt would be used, when oil exporters ran out of oil exports.
If, on the other hand, they keep their current strategy of excessive domestic spending, and pursuit of illusory high returns (like through mortgages via Collateralized Debt Obligations, or commodities(!!)), they'll keep creating domestic inflation, asset bubbles, and world financial system instability.
By shut up I just mean locked up when it is in the street - car theft was huge here, but has somewhat decreased as security on cars has been improved.
Alan's information is old - they went through a major fitness program to get the Euro going, but are now much slacker, far behind Germany:
http://www.banque-france.fr/gb/publications/telechar/bulletin/130edito.pdf
I am not familiar with their budget deficit and so on - governments are now expert in hiding the true state of affairs, and researching them is a major undertaking.
I do not expect the Euro to survive - at least not with all present members.
Whatever the finances of France, the finances of places like Italy, Spain and Greece are quite shocking, and probably could not live in a united currency block with Germany and the Netherlands even without very high priced oil - look at the contribution of their tourist trade.
With different economies pulling in different directions, national responsibility for setting budgets and their deficits and without a large central taxation structure there is, in my view, simply no way that the Euro will go on.
To stay in a currency block with Germany France is likely to do whatever is needed, as they have in the past, even if it means a major recession.
They have inflated their economy too much, but it has good strengths.
On your second point, the likely trend in oil exporters seems to be something of a mix, with perhaps places like Kuwait prepared to use sensible measures, but many just intent on spending and partying in London until the money runs out.
I do not know enough to comment in any more detail.
It's from the Wiki page on the Volt, and refers to this article:
The road to higher auto-fuel economy - BusinessWeek.com- msnbc.com
Page 2:
In the News: Chevy Volt for under 30k? LOL if only.
Since it's looking like no one will ever drawn in the reins on oil price again, after five years of body blows to GDP I'd expect a more reasonable ceiling for the average ODEC citizen's transportation purchases to be more along the lines of $3K. Sic semper power windows!
Yes, and a direct followup question to GM found that Businessweek misquoted Lutz - see http://gm-volt.com/2008/04/28/how-much-will-the-chevy-volt-cost/ .
Any new, low-volume program should be expected to lose money in the first years - the Prius did. You have to absorb losses for several years before production volumes get high enough to bring down production costs - it's a chicken and egg problem.
Below $30K, 2.5 years from now, is right about the inflation-adjusted average price of $28K for new vehicles currently.
Great, we'll know the MSRP when it debuts - in Nov. 2010, in an avalanche of production:
That's your man Lutz talking, of course. Globe and Mail PHEVs will be fortunate to have a game to change in the first place; I'm betting on motorcycles, scooters and electric bikes to see us through peak oil.
Well, there's no question these things take time. OTOH, as people are fond of saying, it's hard to understand exponential functions: they start out slow, and pick up steam unexpectedly later.
In the next several years there will be a lot of PHEV/EV's introduced, including from GM, Toyota, Nissan, as well as smaller companies.
GM has made a point of saying that they accept Peak Oil, and that the Volt is central to their recovery and growth strategy.
The leaders in the EV revolution are likely to be the more dynamic countries in the Third World, for several reasons:
It is a lot easier to build EV vehicles on a small scale than ICE cars - they are not so complicated and lighter materials such as carbon fibre are preferable to metal, with it's heavy and expensive metal-bashing machines.
Producing the batteries and motors, tyres etc needs big business, but the assembly can be much more informal.
In this connection Western countries are at a great disadvantage for early adoption, since it takes years and many millions of dollars for type approval.
Further, for many in the Third world, the expectations are lower, since they are not moving down from an ICE but up to their first car, or more likely a covered trike, such as would not pass safety tests in the West.
Many of the electric bikes in China don't use the high performance lithium batteries, but manage with the much cheaper lead-acid, which in incarnations like the Firefly or lead-acid plus capacitor combination should in any case be able to give fairly decent performance for these very light vehicles, and in many areas such as India a PV roof to them would provide a useful supplement to the power on something so light.
In some developed countries other than the US conditions are also more favourable.
Switching their cars to EV, for instance, at least in energy generation terms, would be a trivial exercise for France, uniquely amongst countries, as they have excess nuclear power at off peak times already.
Doubtless they will build more nuclear to make up for expensive natural gas, but they are well set-up already.
These factors, together with the much shorter average distances travelled which make electric transport easier, likely mean that the US will be a laggard rather than a leader in EV adoption, with Japan, China, India, Indonesia and Europe moving faster.
Do we have any data on this? I haven't seen any good data. The US has a lot of small EV's, like golf-carts, which don't get much attention.
AFAIK, the US is in front on hybrids and PHEV's, and China is moving fast as well (China has a lot of electric bikes, as well). Europe is very slow on hybrids (in part due to a commitment to diesel), which is a convenient transitional form to PHEV's and EV's.
Safety regulations are a factor (GM has Volt prototypes running now, but it will take another 2.3 years to get to production, and probably at least 1 year is due to safety concerns), but I don't see that as making a big difference in the longer run - once the design is approved, it's just a matter of capex lags, which happen everywhere. Also, some developing countries have terrible bureaucracy - India, for instance, makes companies tear their hair out - I really wouldn't assume that India will be faster than the US.
The US and Europe have electrical grids that are more than adequate - not so much elsewhere (Japan's infrastructure is good, but their power costs are high, in part due to imported oil for generation).
My wild guess: I would think that the US, China and Japan would be in front, with Europe close behind and everyone else lagging a fair amount.
I haven't got any data, and in any case am not really sure what would be the best metric to measure.
As you say Europe has not been very dynamic in the EV and especially the PHEV car field, and has been distracted by hydrogen and fuel cells as well as diesel.
They are probably in a bit of a different position to the US though, as many of their small cars would make reasonably successful EVs anyway.
At least Peugeot has already got type approval for it's 106:
http://www.autobloggreen.com/2007/07/25/do-you-want-to-try-an-electric-c...
A lot of the existing fleet is also light enough so that a fairly good conversion could also be done if petrol goes through the roof.
Renault is also well advanced with plans for electric vehicles:
http://thefraserdomain.typepad.com/energy/2008/01/renault-nissan.html#more
Denmark will also have a 20,000 point recharging network:
http://www.msnbc.msn.com/id/23832749/
In Japan, I would argue that Toyota is by far the leader in hybrids, as the Volt is still on the drawing boards.
They are talking about a plug-in and if oil prices go higher I have no doubt that they will do so, and more confidence in their engineering than GM.
Mitsubishi is well advanced on electric cars:
http://www.popularmechanics.com/blogs/automotive_news/4255023.html
This is due out in 2009, well before the Volt.
http://techon.nikkeibp.co.jp/english/NEWS_EN/20080124/146156/
The higher price of electricity in Japan does not seem relevant to me since petrol is also very expensive, and the cost of the electricity for the car is trivial even at Japanese rates, especially considering the mow mileage the Japanese do.
They currently generate 40% of electricity with nuclear and plan to expand that - doubtless high oil costs will move these plans into high gear.
China is at the heart of battery production.
After the Olympics it seems likely that it will greatly reduce petrol subsidies. Little movement is perhaps to be expected immediately, as this should coincide with the onset of severe recession in the West, possibly restraining oil prices in combination with many countries reducing subsidies.
Fairly soon though, perhaps when the penny drops that oil is not going to get cheap, they are ideally placed to rapidly produce EV cars. trikes, and everything that moves.
For the time being at least coal will power the stations that power them.
In India high priced oil seems likely to lead to an even more unreliable grid.
Since you can power some sort of electric trike on a couple of square meters of increasingly cheap solar collector, what better way to avoid it's vagueries?
India is a long way south, and for most of the year solar is an excellent resource.
During the monsoon you really need to be using amorphous silicon, but as against that perhaps for those couple of months people might buy their power from people with a generator.
Expectations of reliability are by no means as high as in Europe or America anyway.
I would see the countries where drivers do high mileage and that are currently very car dependent, the US, Australia and Canada, as lagging in EV's, although perhaps they might go to PHEVs if they are available.
"Europe...has been distracted by hydrogen and fuel cells as well as diesel."
I think diesel is the biggie, at roughly 50% of the market. Hydrogen fuel cell vehicles are limited to symbolic test fleets, as they are in the US.
"They are probably in a bit of a different position to the US though, as many of their small cars would make reasonably successful EVs"
The US has just as many small cars per capita as Europe (though "small" isn't quite as small), it's just that there are a lot more bigger cars. I would note that hybrids are the ideal thing to convert. I'm not that excited about ICE to EV conversions - I haven't seen anything that's all that cost-effective. I'd be delighted to be informed otherwise. Perhaps that will change, as people apply ingenuity - perhaps in-wheel motors...
"I would argue that Toyota is by far the leader in hybrids"
No question.
"the Volt is still on the drawing boards."
Well, the Volt is a PHEV, so it would leapfrog Toyota.
"They are talking about a plug-in and if oil prices go higher I have no doubt that they will do so"
There's no question that Toyota will do a plug-in. They've just been delaying while they get better batteries.
"more confidence in their engineering than GM."
Toyota's had real QA problems lately, and GM has improved (while still a bit behind Toyota). I don't think anybody (who's deeply into cars) questions GM's engineering ability. Even if their manufacturing QA isn't quite as good, it's still more than good enough. QA is a relative thing - GM is ahead of where Toyota was 10 years ago. Even Consumer Reports has acknowledge the relative changes.
"The higher price of electricity in Japan does not seem relevant to me "
hmmm. My point is that the Japanese grid and supply doesn't seem quite as robust as that of Europe or the US. OTOH, I imagine it'll be good enough. I would note that nuclear will have quite a long lag-time.
"China is at the heart of battery production."
Yeah, China is serious about PHEV/EV's.
"In India ...you can power some sort of electric trike on a couple of square meters of increasingly cheap solar"
Yes, I think electric bikes will be big. OTOH, large scale solar is a bit of a longer term proposition (10 years or more), given scaleup time.
"I would see the countries where drivers do high mileage and that are currently very car dependent, the US, Australia and Canada, as lagging in EV's, although perhaps they might go to PHEVs if they are available."
Yes, PHEV's will be greatly preferred to EV's in those countries. OTOH, a PHEV-40 like the Volt would reduce fuel consumption by 80-99%.
Fuel cells cars strike me as greenwashing. They are crazily expensive, even for prototypes.
Making them work would require multiple breakthoughs, in membrane technologies, in hydrogen production and in storage.
I take your point on ICE to EV conversions - probably not worth the bother, even if you only do a couple of miles a day and can't get petrol.
The production lines for some of the small cars could be altered though, and they have type approved the Peugeot 106 and obviously some of the Renault's.
It was not really GMs engineers that gave me pause, but the management that gives them the direction under which they specify their systems.
I am pretty confident that once Toyota commit, it will happen.
GM realigns policy much more often.
I am not too up on the reliability of the Japanese grid, although I know that they had some recent problems due to an earthquake affecting some reactors.
With Japanese social cohesiveness though I would have thought that the stability of the grid would be improved by EVs not made worse.
If Japanese people were asked to leave their cars at home to provide additional power to the grid they would do so, unlike in America or Europe.
Let's look at some figures for scaling up PV production to run Indian trikes.
They would often be more suitable than bikes, as Indians frequently have to use them to transport goods and their families.
If we put a solar array on the trike, it might cover a couple of square meters.
At an efficiency of 15%, it should peak at about 300watts, enough for a full car, let alone the very light structure we are talking about here.
Of course, that will reduce early in the day and late at night, and go to nil in the dark, but you would not use it all the time.
An electric bike should be able to be powered on perhaps a 1 square meter panel, kept at home of course and needing other batteries if you use the bike all day, but 150 watts should be fine.
Since we are anyway talking about 3-5 years to ramp up, then we might be talking about a couple of million trikes and maybe 5 million bikes annually.
Some will run from the grid anyway, so we might need around 5GW of solar cells a year.
That does not sound like a fantastic amount.
"Fuel cells cars strike me as greenwashing. "
No question.
"GM realigns policy much more often."
Yes, but they seem awfully committed now. They've publicly acknowledged PO, and said that PHEV's are the future of the company & GM's highest priority. They're spending freely, putting about $1B into it, and have hundreds of engineers working 16-24 hours.
RE: India, if you want to travel 20 miles per day, then you'd probably need 2 KWH's per day @.1KWH/mile. At 5 hours equivalent insolation you'd need 400Wp, which right now would cost about $2,000 (or very roughly $.25/kwh). Now, we know that this includes a big scarcity premium, but that scarcity premium wouldn't go away for a good 10 years with this kind of demand all around the world (IOW, solar still needs to grow for a while to get to something like 50-100GWp/year).
$2K would be pretty stiff for an average indian family. I suspect India would be beter off concentrating on expanding wind power (at roughly $.06/KWH wholesale), in the next 5-10 years.
Some of the new solar technologies, thin film especially, are on the point of explosive growth and are not limited by silicon production.
http://www.bi-me.com/main.php?id=20744&t=1&c=34&cg=4&mset=1011
Once the technology is proven and the first factory built, building others is fairly straightforward.
I don't really agree with your arguments on shortage sustaining price either.
Present prices are sustained by two very rich markets, Germany and Japan, where solar PV is heavily subsidised, and there in no possibility of substantial new markets operating on the same terms.
I would expect to see a step change in prices, which is sustainable due to the rapid cost reductions.
The increasing cost of oil will do the rest - once the technology is known and good enough, the factory build can be very fast indeed.
I don;t know if you would still need to buy inverters, if so that would put the price up quite a bit, or if the bikes and trikes could run on DC current.
Still, you are probably right and the Indian grid would do most of the powering initially.
Meanwhile GM says 19,000 U.S. factory workers take buyouts.
Who are they planning to have make these Volts? GM is still losing money hand over fist. Their bond rating is in the tank. People are getting nervous about further lending to the perpetual money loser of Detroit. Meanwhile Wagoner has overseen a 75% drop in share price of the company since he took over.
Does he even have two years left in GM before it folds?
"Does he even have two years left in GM before it folds?"
It's a good question, but GM wouldn't "fold", they'd go into the form of bankruptcy that eliminates debt, and keep operating.
GM would very likely emerge stronger, with a better ability to invest in the Volt and it's successors.
yeah a bit like Worldcom did with $300k of my money !!!
You claimed that
but your analysis covers mainly the operational cost, not the cost of the vehicle.
You also state:
which is a nice bit of handwaving. A Prius is not an EV, but an ICE powered vehicle. The batteries are designed and sized to assist in the power peaks and allow for regeneration of braking energy, permitting the ICE to be smaller and more highly optimized for efficiency. The batteries are not permitted to discharge very far, which you may believe is too conservative, but apparently the engineers disagreed. Anyway, just sticking on a plug and charger does not a PHEV make.
If you add additional batteries appropriate for extended EV mode function, then you have a vehicle with 2 complete drivetrains and energy storage systems. Maximum weight, complexity, and cost, minimum passenger and cargo space - the worst of both worlds.
As to potential cost of the vehicle, an electric motor is mechanically simpler than and ICE, but of course we have a huge experience making inexpensive ICEs. If you consider two vehicles of similar size and specification, and a chassis built with similar materials, the EV would likely be way too heavy to have a decent range, and would require a large battery pack - this is why designers move to lightweight (expensive) materials for EV chassis, and/or make them very small. There is no free lunch. Given similar cost, size, and specification one can use either a very small ICE or an electric motor - if the vehicle is allowed to be very small with very limited performance (as are most EVs), then a tiny ICE would yield an inexpensive and efficient solution. I seriously doubt that an EV with batteries would be significantly cheaper to make or operate, but the entire question is irrelevant.
In an excellent article detailing the fundamental reasons behind the present cost of oil, the comments immediately return to the only possible solution we can conceive: more cars. We have squandered the vast majority of our original fossil fuel wealth on automobiles and the car culture, and we cannot continue this failed approach. Some day we will understand just how big a price we've paid to all have our own personal automobiles. Perhaps a few more ice-free arctic summers will be enough to release the methane and drive that point home for real - the ultimate final bill.
Electric trains, with short haul personal local transport provided by foot, bicycle, or very tiny vehicles of high efficiency, are the best solution when transportation is required. Not traveling so much works better yet. The car culture cannot be sustained, regardless of power source - but I have no doubt we will try anyway, whatever the cost.
"your analysis covers mainly the operational cost, not the cost of the vehicle. "
Actually, it only dealt with the ROI of a larger battery. A serial PHEV would have lower maintenance costs, as well, due to it's greater simplicity.
"A Prius is not an EV, but an ICE powered vehicle. "
A Prius is both an EV, and an ICE powered vehicle. It has two parallel powertrains, which are largely redundant. In a way it's an elegant design, but it's designed to optimize a very small battery (battery costs were much higher in 1997). A serial PHEV with a larger battery would be better all around.
"The batteries are designed and sized to assist in the power peaks and allow for regeneration of braking energy, permitting the ICE to be smaller and more highly optimized for efficiency. "
True. The electric powertrain is powered by both the ICE and by otherwise wasted kinetic energy. The ICE is optimized, but it still has to vary widely in it's RPM, and be sized to handle the full power needs of the vehicle.
"The batteries are not permitted to discharge very far, which you may believe is too conservative, but apparently the engineers disagreed. "
No, I think it was wise for the Toyota engineers to keep the range of Depth of Discharge between roughly 30 and 70% - NIMH is more fragile than 2nd gen li-ion, and this was a new application. In any case, I used the same conservative assumption in my cost estimate.
"Anyway, just sticking on a plug and charger does not a PHEV make. "
Sure it does. It's not optimal, but it's very workable.
"If you add additional batteries appropriate for extended EV mode function, then you have a vehicle with 2 complete drivetrains and energy storage systems. Maximum weight, complexity, and cost, minimum passenger and cargo space - the worst of both worlds."
I agree. That's why this is a conservative, worst-case analysis - a serial PHEV design, like the Volt, would be much more cost-effective.
"we have a huge experience making inexpensive ICEs."
We have huge experience making inexpensive electric motors. There are billions of electric motors in the world, from your electric pencil sharpener to the motor in a diesel hybrid freight train.
"the EV would likely be way too heavy to have a decent range"
First, we're talking about PHEV's. 2nd, without the battery, an EV would be lighter than an ICE vehicle - it's the battery that is the weight problem, which means that overall an EV doesn't increase in weight as much as you might think (for instance, a Tesla has 900 lbs of battery, but only weighs about 300 lbs more than an equivalent Lotus Elise). 3rd, weight is important for ICE range, not EV range, where we have regenerative braking - weight in an EV is a design inconvenience, not a range issue. It turns out air friction is more important in EV's (coefficient of drag, and cross-section).
"designers move to lightweight (expensive) materials for EV chassis"
Can you give examples? The Tesla didn't - they optimized for weight, but not as far as that might suggest.
"the comments immediately return to the only possible solution we can conceive: more cars"
Not at all. It's just important to point out that cars are perfectly viable. I would prefer a world with fantastic mass transit, and shared cars (see zipcar.com), but others disagree, and of course, that has tradeoffs of it's own.
"We have squandered the vast majority of our original fossil fuel wealth on automobiles and the car culture, and we cannot continue this failed approach"
How does this relate to PHEV/EV's? We can power them on low-carbon electricity quite nicely (PHEV's like the Volt would eliminate 80% of fuel with no change in driving patterns, and 99% would be relatively easy to do.
A hybrid, whether series or parallel, is an ICE powered vehicle. There is no other source of energy, all of it comes from the fossil fuel.
The Tesla is an great example of the problems with an EV, as the design compromises needed to make an expensive performance toy are quite different than to make a cost effective small sedan, for instance. There is a reason you do not find an extruded aluminum chassis under Honda Civic or Toyota Yaris - it costs too much. Further, in a sports car it is acceptable to have zero luggage or cargo capacity, but in a real car it is not. They did not build a sports car first by chance, they did it precisely because the compromises inherent in an EV were acceptable in this type of vehicle. And that includes the high price.
I never said we have little experience building electric motors - I'm an electrical engineer - my point was that the cost advantages of using an electric motor will not be that large, as both are mature technologies.
Lastly, I do not buy that we can switch in quantity to EVs without more generation capacity, and I believe this will come from coal - hence my comments on the costs of the personal automobile.
"A hybrid, whether series or parallel, is an ICE powered vehicle. "
Depends on your point of view - you can consider the source of energy the kinetic energy, that otherwise would be wasted. In any case, the Prius has a pure electric power train, albeit integrated with an ICE (as opposed to the Honda IMA, for instance).
"an expensive performance toy "
It's expensive in large part because wealthy early adopters are paying for R&D (small production volumes are the other major factor - the batteries only cost $20K). Extruded aluminum is more expensive, but does it add more than $500 (as a wild guess) per unit?
"They did not build a sports car first by chance"
Definitely.
"the compromises inherent in an EV "
The space required by batteries is the major compromise, and that's really a design inconvenience - in a larger vehicle there are plenty of places to put them, especially without an ICE and all of it's endless supporting equipment.
"the cost advantages of using an electric motor will not be that large"
The point is that an electric motor doesn't require cooling, and lubrication, carburetion, and fuel pumps, etc, etc. Hydraulics can be replaced with electrical equipment (drive by wire). Things are much simpler, more compact, and cheaper (in large production volume).
"I do not buy that we can switch in quantity to EVs without more generation capacity, and I believe this will come from coal "
I'll repeat my reply to Jerome A Paris:
"where do you see all the electricity needed to power all these cars coming from?"
Well, in the US (with which I'm most familiar) it's relatively easy. To replace all ICE VMT with electric would only require an increase in KWH's of 17%. Over 20 years that's less than 1% per year.
That could come from wind. Wind has a really nice synergy with PHEV/EV's, as it's biggest problem is lack of night-time demand (when PHEV/EV's would charge), and it's 2nd biggest is intermittency, which PHEV/EV dynamic charging would soak up. The cost is not large, very roughly $200 in amortized capital costs per year for wind capacity per vehicle (10% capitalization factor x 12,000 miles / 4 miles/KWH / 30% capacity factor / 8,760 hours x $1.8/watt), which is much, much less than fuel in the long-term.
It could come from conservation: I think people would be happy to trade a reduction of 17% in electrical consumption for transportation. It could come from nuclear or solar, if they can scale up fast enough (solar is very likely to - it's peak production could displace other generation that could be used at night, or even stored, and about nuclear...I'm not sure).
Now, one might object that high-CO2 coal is the swing producer, and I would answer that that's not really the case: the synergy between wind and PHEV/EV's means that PHEV/EV's would actually enable much more wind than otherwise. Without PHEV/EV's wind probably faces a 15-20% limit to market share, but with them I could see 40% easily.
Factually inaccurate. The electric may be generated by hydropower, wind, solar or nuclear, none of which are fossil fuels.
The power usage by electric cars is a fraction of that from ICE vehicles, and they can be charged off-peak, so it is doubtful if France, for instance, will need to increase it's nuclear fleet at all to run all it's cars as EV's.
Of course they are. that is why it is a silly comparison to make.
You should be comparing the Tesla to a Ferrari or a Lotus, and apart from a restricted range it does very well - not bad for the first of a kind.
A better car to look at is the Th!nk or the Mitsubishi which should be out in 2009, and are also small cars:
http://www.gizmag.com/ukp14000-thnk-city-electric-car-ready-for-showroom...
UKP14,000 TH!NK city electric car ready for showrooms
http://www.greencarcongress.com/2007/10/new-li-ion-batt.html
Green Car Congress: New Li-Ion Battery Extends Range of iMiEV by 20-30%
Electrical motors may be a mature technology, but batteries are not, and most of the likely improvements in performance will come from that.
You can also do without a lot of the components of an ICE, and greatly improve reliability.
Just how much more generating capacity do you think would be needed, considering that you only need around 250watt/hours/mile?
Why can't you charge them off peak?
Here is how a Time of Demand charging system worked in California:
http://www.iop.org/EJ/article/1748-9326/3/1/014003/erl8_1_014003.pdf
erl8_1_014003.pdf
With the slightly more sophisticated V2G system then even a modest number of EV's could actually help balance the grid.
Both wind and solar would also be well suited to provide power for EV's, not just coal.
This comment was about hybrids, whether series or parallel, and it is entirely accurate. Also, the idea that somehow the source of energy is kinetic energy is nonsense - the hybrid can recapture energy that would be wasted in a conventional ICE, but that energy came from the fossil fuel powering the ICE in the hybrid. There isn't any wiggle room here, the prime mover is an ICE, period.
And yes, the Tesla should be compared to other, irrelevant toys, which is what it is. Ditch the aluminum chassis, and use something cheap and mass-producible. Stretch the chassis so it can accommodate 4 people and some luggage (seats, glass, etc.). It started at about 2700lbs - now what's it weigh? Where do the batteries go?
I would love to see a head to head comparison of vehicles of similar size, passenger/cargo capacity, price, and performance, EV against ICE. We'll let the EV be as heavy as needed. Let's pick a small 4-passenger hatchback (Honda Fit sized). I'll put a 40hp, 2 or 3 cylinder in it. Even with a cooling system and all the supporting equipment (which are far from endless), your EV will have a very hard time competing. I'm betting the EV will be more expensive to produce, it will be of limited range (probably very limited given the size, price, and space requirements). It will have regenerative braking, but it's gonna need it - and if your drive does not require a lot of braking (as is mine), it won't help anyway.
I don't buy V2G either without major changes to the grid. I do not see how one designs a coordinated protection scheme with large numbers of sources all over the grid - at least not one that looks anything like what is common practice now. Do you realize that most US distribuition substations use electro-mechanical protective relays that may be older than you are?
And if it helps with balance, then it does so at the cost that your particular battery may not be charged at any given time you may need it. If current cannot be pulled back out of the battery, then it cannot help stabilize.
I'm done with this discussion, as I see a lot of hopes and dreams - that battery technology will improve fast enough, that non-fossil fueled electricity will come on line fast enough, that people will be disciplined enough to charge their cars only at night, that V2G will work on the present grid design, that the cost and range of EVs can be become competitive in time, etc.
EVs will be made, and they do have place as short range utility vehicles. I do not believe they will ever supplant the modern ICE automobile in number or in the way they are used - and this is a good thing. And it will take a long time before they are a common sight, because in reality we're all broke. Fortunately I've got my Hyunadai Accent I bought in '99 when gas was free in the US, but many will be stuck with their new Tahoes.
We need a new plan, not a re-hash of the old one.
Not all electricity is produced using fossil fuel, so your comment regarding EV's just using fossil fuels indirectly is still entirely false.
The grid in America may need upgrading for V2G, although it should be pointed out that not all of us live in America and the discussion was about EV cars in general, but the saving of umpteen billions a day on oil imports would perhaps go some way to paying for it.
Batteries would not be discharged completely in a V2G system, but relatively small discharges could provide one heck of a lot of power when a peak hit.
As for the hopes and dreams, what I have actually provided is data of behaviour when just a plain vanilla TOU is used in California - behaviour changed in numerically quantifiable ways. You have provided assertion.
Just what are you intending to run these petrol cars on and retain the same range and performance as oil gets progressively short?
No one is trying to say a EV performs as well as an ICE, but it performs a lot better than an ICE you haven't got petrol for.
And there are possibilities to improve range and performance, which we have detailed.
Gotta say I completely agree with this statement. We have other energy sources -- some of which are rapidly expanding. The oil only argument is a bit 19th century. V2G is, in my opinion, the best way to make a transition away from oil as it's easier to build diverse supply into the grid. Although, in my opinion, the grid energy expansion should primarily be wind, solar and nuclear. More coal would be terrible as we have declining resource quality and astronomical prices already. Not to mention the fact that coal emissions are poisonous and have a terrible impact on climate.
So if everything went well, they could handle a 6% penetration of PHEVs with a 20mi electric only range before they needed to add capacity. But it's OK because that isn't likely to happen
Granted, they'd do better with a 20mi range EV, as it would be lighter and require less energy to move 20mi.
The fundamental problem remains - you are trying to lug something that weighs 10-15 times as much as you do everywhere you go.
I am not suggesting that we plan on having lots of gasoline/diesel to run our cars on, I'm suggesting we need to look for better solutions than cars that run on indirect burning of fossil fuel (yes, that is where most of it comes from). The attempt to switch to EVs will chew up infrastructure resources better spent on electric light rail - and Europe is already better positioned in that regard. Make the easy switch to cheap, small, and even more efficient ICE cars for those who need something new in the transition phase, and then park the damn things and take a train. Do not waste time on an EV extension of the car-culture nightmare.
I'm tired - good night!
What was the source of your quotes?
"Obtaining a fleet of millions of PHEVs within 10 years would probably require strong pro-PHEV policies or substantial fuel savings from all-electric operation."
That's an odd statement, as "substantial fuel savings" would certainly come - probably 50% reduction in fuel consumption.
"they could handle a 6% penetration of PHEVs with a 20mi electric only range before they needed to add capacity"
So we add some wind capacity - not a big deal.
"The fundamental problem remains - you are trying to lug something that weighs 10-15 times as much as you do everywhere you go. "
And, yet, a Prius doesn't use any more than an electric train, and that's with only 1 passenger, and much, much greater flexibility (ever tried taking a dog on a train??). A Prius only takes 2-3 times more energy than an electric bike, due to much greater efficiency. And, you get protection from the elements, multiple passengers, cargo, safety, etc.
"cars that run on indirect burning of fossil fuel (yes, that is where most of it comes from)."
Sure, for a hybrid. Not for a PHEV, or EV, which would charge at night, the home of wind and nuclear.
"The attempt to switch to EVs will chew up infrastructure resources better spent on electric light rail"
PHEV's won't cost any more than our current vehicles, if we phase them in by attrition.
"Europe is already better positioned in that regard. "
But Europeans drive quite a lot - about 50% as much as Americans per capita, with much smaller distances. Rail works quite well for commuting, and inter-center-city travel, quite badly for other things.
"Do not waste time on an EV extension of the car-culture nightmare."
I like trains, so on a public policy level I wish you well, but this sounds a bit like wishful thinking.
The source of my quote was the link provided by DaveMart, for which I was admonished for not providing equivalent data.
You have much more faith in the future conversion of our electrical generation from fossil fuels to renewable than I do.
"You have much more faith in the future conversion of our electrical generation from fossil fuels to renewable than I do."
Well, I have faith in the conversion of consumption from fuels to renewable electricity. I hope I've encouraged you a bit.
On this score, I think we can take encouragement from the last great oil-to-electricity conversion, in the late 1800's: the move from kerosene to electricity for interior lighting. Electricity was cheaper and cleaner, and the conversion was very fast and thorough, despite the need for substantial capital investment. Oil markets were briefly in serious trouble, until gasoline for ICE's came along. Looks pretty similar, I think.
OTOH, I'm not that optimistic about overall conversion from fossil fuels to renewable electricity. PHEV/EV charging will take mostly at night, where there is wind & nuclear preferentially; and I think we'll succeed at stopping most new coal construction, at least in the US. But, I would be a bit surprised if we were willing to pay the cost to make existing coal plants obsolete before their natural death. It could happen - perhaps people will be willing to pay a premium for their electricity in order to clean it up.
I'm more worried about climate change than I am about peak oil.
"the prime mover is an ICE"
Not really. This is sounding a bit theological.
Take an analogy: is wind really solar power, because it's prime mover is solar? You could think of it that way, but it wouldn't really be useful.
Similarly, it doesn't really matter whether the power plant for your electricity is onboard, or in the next county, or whether it uses coal or gasoline: if your powertrain is electrical, it's an electric car. So, a Prius is an electric car 1/3 of the time, and an ICE 2/3's of the time.
Now, why is this important? Because the Prius is a proof-of-concept for large scale, cost-effective electric cars. It's like an amphibian with feet, starting to walk on land: 2/3 fish, 1/3 land animal.
"Tesla... Stretch the chassis so it can accommodate 4 people and some luggage (seats, glass, etc.). It started at about 2700lbs - now what's it weigh? Where do the batteries go?
Wherever it's convenient to put them - under the floor, or in front of what would be the firewall - you'll find some space when you lose the ICE & supporting equipment.
"the EV will be more expensive to produce"
Probably a little, but it's lifecycle costs will be much lower.
"it will be of limited range"
Well, until battery prices come down, PHEV's will be much more optimal - they have no range problem.
You seem to be attacking EV's, but I'm not talking about EV's: EV's will take rather longer to be cost-effective.
"I don't buy V2G either "
Well, PG&E does. OTOH, V2G isn't necessary to gain the benefits of PHEV/EV's.
"And if it helps with balance, then it does so at the cost that your particular battery may not be charged at any given time you may need it. "
No, just dynamically charging when there's surplus power will help with balance.
"I see a lot of hopes and dreams - that battery technology will improve fast enough"
It's already here. It would be great if it got cheaper (as it will), but that's not essential.
"non-fossil fueled electricity will come on line fast enough"
It's already here: wind was 20% of new generation last year, and it's doubling every 2 years.
"that people will be disciplined enough to charge their cars only at night"
It just takes Time of Day pricing - if you have differential pricing on cell phone minutes, you pay attention to it. The principle is no different - people pay attention to pricing.
"that the cost and range of EVs can be become competitive in time"
PHEV's just need volume production - it's the same with anything new.
I rather doubt that (you mean *energy* usage by the way). Consider firstly going up a hill. The weight of an electric with its heavy batteries is not going to be much lighter than an ICE. The energy is distance risen times force (aka weight).
Secondly, whizzing along fast - the energy usage is basically aerofriction independent of fuel source. Thirdly, moderate on the flat - energy determined by tyre rolling resistance.
Only by greater efficiency of motive powering, or a lot of regeneration on lots of downhills or stop/starts, could the electric use much less energy than the ICE.
"I rather doubt that (you mean *energy* usage by the way)."
He was talking about BTU input (fuel consumption), you're talking about output. The average US light vehicle can go 22 miles on 1 gallon of gas, while an EV can go 140 miles on the same BTU's worth of electricity.
"Consider firstly going up a hill."
Actually, this doesn't consume energy at all, just converts it into gravitational potential energy, which an EV can recover when going back downhill with regeneratative braking.
"Only by greater efficiency of motive powering, or a lot of regeneration on lots of downhills or stop/starts, could the electric use much less energy than the ICE."
Which an EV will indeed do, as discussed above - to the tune of about 6:1 (in the US).
This is incorrect. While Lead-acid-based battery packs are heavy, and top out vehicle range at about 60km before you start breaking all sorts of GVM regs, Lithium Ion batteries weight much less. A Li-ion pack weighing not much more than 100 kilos (or about the same as your average fuel tank + fuel) will give a range of about 150km. This is more than sufficient for almost all uses.
Nick, where do you see all the electricity needed to power all these cars coming from?
"where do you see all the electricity needed to power all these cars coming from?"
Well, in the US (with which I'm most familiar) it's relatively easy. To replace all ICE VMT with electric would only require an increase in KWH's of 17%. Over 20 years that's less than 1% per year.
That could come from wind. Wind has a really nice synergy with PHEV/EV's, as it's biggest problem is lack of night-time demand (when PHEV/EV's would charge), and it's 2nd biggest is intermittency, which PHEV/EV dynamic charging would soak up. The cost is not large, very roughly $200 in amortized capital costs per year for wind capacity per vehicle (10% capitalization factor x 12,000 miles / 4 miles/KWH / 30% capacity factor / 8,760 hours x $1.8/watt), which is much, much less than fuel in the long-term.
It could come from conservation: I think people would be happy to trade a reduction of 17% in electrical consumption for transportation. It could come from nuclear or solar, if they can scale up fast enough (solar is very likely to - it's peak production could displace other generation that could be used at night, or even stored, and about nuclear...I'm not sure).
Now, one might object that high-CO2 coal is the swing producer, and I would answer that that's not really the case: the synergy between wind and PHEV/EV's means that PHEV/EV's would actually enable much more wind than otherwise. Without PHEV/EV's wind probably faces a 15-20% limit to market share, but with them I could see 40% easily.
I agree with you in that there is major and growing incentive to bring an affordable set of EVs to market. Where I disagree is the speed at which this transformation will take place. To replace the entire market on a crash basis would take between 15-20 years. If we nationalized and revamped our entire infrastructure we might be able to do it in 10. If we let markets manage it alone, even with current and future price incentives, you're probably looking at 25-35 years before a complete turnover IF CURRENT INFRASTRUCTURE CAN BE MAINTAINED.
There are serious bottlenecks to reaching the entire market when it comes to EVs. As a case in point, take a look at the Prius. A new, disruptive, technology that Toyota produced as a loss leader. One of the largest (almost as much interior room as a sedan) very high fuel efficiency vehicles (40-50 mpg) on the road. In six years we have 1 million+ worldwide. Total hybrids in the same period have managed to hit about 1.5 million worldwide.
Substantial, certainly. It helps decrease demand, add efficiency, and provide a nice alternative to conventional ICEs. I would look at Hyrbrids to continue to capture larger chunks of the market. Furthermore, I'd look at EVs to start to do the same.
So the question in my mind is -- can all these very efficient or non-fossil fuel vehicles capture enough of the market, fast enough, to beat the decline rate and help hold our transportation infrastructure together. In my opinion, that's the race the auto industry is in and any major automaker that doesn't shift to this game will be a dead duck in less than ten years.
That's my humble opinion. But I don't think this transition will be easy or a certain thing. Even at plateau, Jeffrey Brown's ELM takes about 1.5 percent per year. If we have net declines on top of that, it could be a very steep slope to race. What we don't know is how steep the cliff is at the end of the plateau, nor how soon we will reach that point.
So while it seems there may be a nice, soothing, light at the end of the dark tunnel, we'd better be very careful that's not just a freight train coming our way instead (nod to Mettallica for very cool lyrics).
On the whole, my viewpoint is somewhat similar, with a few differences.
First, as you note, Prius production initially was at a loss, during a period of low gas prices. Volumes started very low, and were always behind demand. Now, production has doubled roughly every 20 months since then, and that rate of growth continues (and appears very sustainable). Hybrids are likely to largely transform into PHEV's in about 2 years, so the two growth curves are essentially the same. Hybrids are currently at 3% of new US light vehicles.
At that rate, the US can be at 15% in 5 years, and 75% at 10. The overall fleet could effectively be at 50% in 15 years (50% of fleet VMT is provided by vehicles less than 6 years old).
2nd, 90% of the problems caused by PO are due to the transfer of wealth from importers to exporters - overall world GDP has and is likely to continue to be unaffected by very high oil prices. Recycling of petrodollars is running into some problems (e.g., mortgage lending) but it's likely to continue in some form (t-bills, directly or indirectly, if nothing else), and oil importers will get through the transition, albeit with considerable debt to exporters (which exporters will need, as they run out of exports).
Jevon is a tricky fellow and it's best not to count him out even in good times. So what you say may well be true. For my part, I am wondering if demand destruction + greater efficiency can move fast enough against production declines and export declines to result in a maintained or increased cushion of spare capacity.
And though it is true that demand destruction began to occur in 2002, it's now starting to impact the big players to produce a larger net effect. If 4 percent of all OECD demand took a hit (as in the US this year), that's nearly 2 million barrels per day off the top in one year. Without any mischief from Jevon, world oil production and export declines would have to match demand declines to keep prices at near current levels. All things being equal, net output declines will have to beat net demand declines to push prices higher. And if demand destruction + efficiency beats oil decline rates, we may well see prices edge down.
And as far as Asia goes, demand there can't go on forever. They are still heavily dependent on exports. With globalization of trade beginning to fragment, their economies will eventually take a hit. In 2002 it cost about $2,000 to ship a 40 foot container overseas. Today that price is $8000. In the US, steel imports from China alone are down 20 percent year on year. With current trends, we should see economic contraction in China regardless of subsidies within the next few years. Same with India.
Now it is possible that increased demand from the Middle East may take up some of the slack. But the economies of the Middle East can't grow fast enough to match OECD decline, especially when much of the OECD can do well enough going local in a pinch. So the knock-on effect of increased inflation with create problems and crimp the otherwise profound benefits of a rapid influx of money. In short, the reversal of globalization will hit the Middle East very hard as it struggles to diversify its infrastrucure when relying, for so long, on oil as its primary source of revenue. For the Middle East to save globalism would, indeed, be a case of the tail wagging the dog.
So I think the net prognosis for demand, going forward, must be flattening and then falling.
I don't have your talent with graphs but I wanted to make a visual point so here goes:
2004 - 2008 Oil Market Driving Forces:
+ + Demand
+/-- Supply
(rapidly increasing demand, flat or falling supply [falling supply takes into account net exports])
2008 - 2010
+/- Demand
- Supply
(flattening demand with potential to fall before the end of the period, contracting supply)
2010 - 2012
- Demand
- Supply
(falling demand, falling supply)
2012+
-- Demand
-- Supply
(rapidly falling demand, rapidly falling supply)
Pretty much in line with what I'm thinking. 2011-2012 are the bad years but still normal after than pretty much unknown. It will be tough for sure but it really depends on how the world responds to our current situation.
Well since response, so far, has been mostly reaction I don't know how well the future will evolve. Hopefully, we'll see some real leadership soon.
The current chicanery in government pushing to control prices by lassoing speculators and levitating the dollar will help our economies short term but hurt more long-term. But very shortly afterward, lower prices would bring on more demand in the face of falling supply. So we're back to square 1. Or, in the event that price is artificially lowered in the US and price is retracted in Europe through tax cuts, we'll see demand control through shortages.
So high price or shortage. Take your pick. Our government seems to only want to address symptoms, not root causes.
It's really all a question of how well oil exporters recycle their petrodollars.
If they follow the example of Norway, and sterilize at least some of their oil money by buying and holding oil importer debt (like T-bills), global trade will do just fine. Debt will balloon, but it won't matter - oil importing countries can keep their economies afloat by using the borrowed money to reduce taxes. Eventually the debt would be used, when oil exporters run out of oil exports.
If, on the other hand, they keep their current strategy of excessive domestic spending, and pursuit of illusory high returns (like through mortgages via Collateralized Debt Obligations, or commodities(!!)), they'll keep creating domestic inflation, asset bubbles, and world financial system instability.
The best way they could invest the money is by spending it on local infrastructure. With shipping costs bound to rise, it's going to hurt them more and more to import. Already the cost of fuel to ship goods overseas adds about a 9% tax. Now I don't think they're going to entirely avoid imports. But it would do well for them to reduce their need as much as possible.
I do agree that playing the Wall Street gambling machine will likely hurt far more than investment in T-Bills etc. But with oil putting downward pressure on the dollar is the T-Bill really such a grand investment after all? I guess it would help when it comes time to import US produced food, though.
But the Middle East is in a very tough spot short and long term. Short term they have rapid growth pangs, political instability due to increased competition and tension over oil supply, and a rather tight window in which to make their oil revenue pay. Long term they have diminishing export returns and a follow-on bust to end all busts. Due to non-hydrocarbon resource scarcity in that part of the world, their challenge to develop sustainable infrastructure is much more dire than even our own despite the fact that ours is more immediate.
Correct at the end of the day North America and Europe are in general in good shape over a 20 year window vs everyone else with the exception of Russia and Brazil. Every other country consumer or producer seems to have some very fatal flaws they have to deal with.
Europe can go the nuclear route and actually has enough infrastructure to cut oil usage if forced.
The US still has large coal reserves and both Brazil and Russia are rich in natural resources including oil.
And all four have diverse economies.
Brazil and Russia have some serious issues with concentration of wealth but in my opinion the US at least will probably end up with Brazilian like demographics. Europe dunno probably the same despite attempts to not go down that route. But 20 years from now the rest of the world would look at Brazil demographics with envy.
"The best way they could invest the money is by spending it on local infrastructure."
Up to a certain point, beyond which they'll just get inflation and infrastructure that is unwise, like wheat in the desert, and oil fired electrical generation.
"With shipping costs bound to rise, it's going to hurt them more and more to import. Already the cost of fuel to ship goods overseas adds about a 9% tax. "
Could you expand on this? This sounds like a much larger premium than I would have expected.
"But the Middle East is in a very tough spot short and long term. "
I agree. They need to be very careful, which is hard for even the most disciplined and organized of governments. Their lack of democracy and free markets is likely to give them a lot of unsustainable vanity construction.
"Up to a certain point..."
Agreed. What I mean by local infrastructure include the following:
1. More renewable energy infrastructure so they can stop burning oil and natural gas to produce electricity.
2. More chemical plants. The future value of oil is in products not fuels. They can do well by trading fertilizer for food in the net scheme.
3. Local trading centers where these sorts of things can be exchanged.
4. Non-fossil fuel desalination.
5. Metals production infrastructure for local use.
6. They will have to enter some long-term trading arrangements to help establish a food security regime.
Now I'm not saying all these rational acts will take place. But that's the way I'd plan to deal with the crisis in the Middle East if I had any say whatsoever.
"Could you expand on this? This sounds like a much larger premium than I would have expected."
According to CIBC each 1 percent increase in the price of oil adds a .4 percent cost to international shipping. This is the hidden fuel tarrif of globalism. According to an article written in 2006, the total amortized 'fuel tarrif' on international shipping amounted to about 5 percent. This at $50 per barrel oil. With oil now about 150 percent higher that rate would be around 11 percent. So my 9 percent would be an older number from a month or two ago. Furthermore, you've got about a 4.5% average world tarrif rate to add on top of that totalling 15.5%. So we've gone from about 6.5% total tarrif + fuel costs in 2000 to the 15.5% added today. This wipes out much of the gains liberalization of trade policy put into place. In short, it's much more expensive to ship goods. In this environment, exporters take a pretty tough hit as importers turn back to local/domestic markets.
Source article: http://www.salon.com/tech/htww/2006/01/31/transport/
"I agree. They need to be very careful, which is hard for even the most disciplined and organized of governments. Their lack of democracy and free markets is likely to give them a lot of unsustainable vanity construction."
I agree as well. Hopefully, for the poor souls who live in that region, their leaders will be a bit more responsible than they have in the past.
"What I mean by local infrastructure include the following"
Yes. An interesting note - some of what KSA plans to use internal oil consumption for would be energy-intensive exports: aluminum, fertilizer, chemicals. This strategy would mitigate to some extent the impact of the ELM effect, especially for natural gas.
"According to CIBC each 1 percent increase in the price of oil adds a .4 percent cost to international shipping. "
hmm - I'll have to study this further. We need to remember that most shippers are non-US, and so their costs will mostly be substantially lower, due to currency effects. Further, there are a lot of efficiency and substitution strategies that weren't important when bunker fuel was very cheap, such as supplemental wind power, low-friction paints, better engines, bigger ships. Heck, a 25% reduction in speed reduces fuel costs by 50%.
I think this chart goes part of the way to illustrate your point with which I am in general agreement.
It shows demand destruction in OECD with slack being taken up by non-OECD. Trying to work out the demand of several hundred million new consumers using oil energy efficiency is a challenge.
One thing for sure, we have moved into phase 1 of the PO scenario where the OECD waste is being culled by high price. Phase 2 will be shortages.
Whilst I try to resist the dark side, I can think of two ways right now how we could lose 1 to 5 million bpd production:
1. Sabotage
2. OPEC flexing its muscle (which it isn't IMO doing right now) to maintain price even if faced with rapidly falling demand.
And I can't think of any way of boosting supply apart from dipping into the strategic reserves - keep the party going another 6 months.
" I can think of two ways right now how we could lose 1 to 5 million bpd production:
1. Sabotage"
That would consist of an emergency. In that case, I can imagine the US moving to an emergency footing, and implementing emergency conservation measures: mandatory carpooling could save 1-5M bpd relatively(!) easily.
The silly thing about all of this is that if the US were willing to swallow it's pride it could deal with it's oil problems relatively easily.
At the start of WWII Roosevelt called in car manufacturers and told them "Yesterday, you made cars. Today you make tanks." We could do the same (a little more slowly) with smaller cars, PHEV's and EV's, with carpooling to get us through the transition.
Great chart! Man, you're a wizard for putting these things together!
I do wonder about those new consumers. How long will they have access to new oil in the current climate? Maybe to zero within a four year window?
OPEC price control on the upside is astronomical. But you wonder how much oil they can take off the market in the current situation without provoking severe response. Some who want to hold oil off the market might cheat a little. But, in my opinion, I don't think they want to arouse the anger of world powers.
Sabotage is happening now = Nigeria. If it happened in Saudi, then the SWRHTF. It's the nuke card for Al-Qaeda and sympathizers. So I don't know if they'd pull it. I also wonder about how effective AQ is currently. We've seen very little lately but that has been no effective guide in the past.
Euan, I posted this in the wrong place, but wished to comment here that it seems possible to me that prices in nominal terms may fall, but that will not mean that we are any better off.
Present levels of prices must mean recession, or more properly depression, which is surely going to knock the oil price.
In those circumstances the drop in oil prices would not lead to increased consumption, as export markets are destroyed for goods to pay for them.
Additionally the lower than expected returns to the oil exporters, many of whom are suffering from rapidly declining absolute volume of oil exports and need increasing prices to make up.
This all adds up to a deflationary spiral, although it might be masked by inflation of the money supply and hyperinflation in some countries.
In this environment financing higher technology oil extraction methods and renewables or nuclear would be very difficult.
So oil prices might fall, but the degree of demand destruction needed to cause this would mean that we are not going to like it.
Real oil prices in relation to the much reduced new incomes would continue to rise, in line with the depletion projections, ie it would take a rising share of the new, lower level of production to pay for less oil, just as though it had risen to $400/barrel, $800/barrel and so on.
For oil exporters though they will just be getting a larger share of the much reduced production of other goods by oil importers, and their absolute takings would also decrease.
The housing bubble has also been blamed on speculation.
If speculators could only impact prices by accumulation there should have been some evidence of them withholding houses from the market i.e. a drop in houses available for sale as the bubble inflated. Is there any evidence of this?
There's plenty of evidence of speculators buying multiple houses with the intention of reselling them. Since unlike oil, house supply is elastic in a six month time frame, the speculators caused an oversupply, thus the current collapsing prices
Alan. Gordon Brown is to blame for the UK housing bubble by removing mortgage repayments from the way inflation is calculated - cpi v rpi. In doing so, interest rates were kept low while we had "hyperinflation" in the property market that has helped fuel everything else.
We have gross over-supply in the property market. We had accumulation by way of individuals wanting to own 2 and not 1 property and speculators in the buy to let market. This over supply is now being put up for sale since those who have accumulated have discovered they cannot afford to finance their greed.
Does anyone have 10 billion bbls of oil in storage (120 days supply) waiting to flood the market?
Only two ? In America your not a red blooded speculator unless you have zero down no doc loans on at least six houses and a few condo's. And real men speculators rent them them out collect the rent and never make a payment. And if your really good you get a HELOC for 100k on each house. The best use straw buyers for the scam so your name is never even on the properties.
Two phht. You guys don't know how to blow a bubble.
I've seen Gordon Brown blamed for wrecking Britain's pension system, and now the housing crisis. Jeez, where did Britain find this guy?
Kirkaldy - just outside of Grangemouth.
Blaming Gordon Brown exclusively for the house price boom may appeal to right-wingers, but it's not entirely fair or accurate. There was a very similar house price bubble between 1982 and 1990 when Gordon was still in short trousers (politically speaking), and an even steeper one between 1970 and 1973 when he was still in a romper suit.
In recent times a lot can be traced back to the banks and building societies becoming much more liberal in their supply of funds for house purchases - it used to be the case that they would not lend more than 3x one salary, but those times are long gone and excessive money supply has very aggressively stoked the fire of house price growth.
I'm sure that the change from RPI to CPI has exacerbated the problem, but it's naive to suggest that it is the only factor - unless you've got some sort of political point to make? Let's at least try and keep this objective...
he's enough to make me join the Scottish Nationalists, even though I have no connection to the place.
alan, my two cents [or less], says that speculation doesn't add to the price of anything. The only way for price to increase is for the demand to be greater than the available uncontrolled supply. Since speculators can only hope to control a small percentage of any commodity [say < 25%], they cannot have beenn resposnsible for the housing bubble as the builders were bringing moreI think of it as the same probles as everybod wanting to leave a closed area at once -- if money will get a better place in line, the more money will do better. Thus the housing bubble.
Now, with oil, the same logic applies, but the situation is different in that each day's supply is used that day, so the suppliers increase prices until the supply isn't all used.
In the housing case, speculators were hoping to take advantage of the mania, and many have been burned.
In the case of oil, since they don't physically hold any oil, they can't possibly be responsible for the shortages that drive the price upwards.
Yes at the hight of the housing boom speculators were buying multiple houses with the intent to flip them in a few months. Also many people bought larger houses than they "needed" as an investment. Both of these amount to holding housing space off the market.
Goodtower, the only reason that prices go up is that the demand is greater than the supply. If hordes of people hadn't stampeded into buying a house, he demand would not have supported the market and prices would not have risen so quickly if at all.
The idea that a small group of 'speculators' could reduce supply of houses enough to cause massive price increases does not meet a sensibility test. The number of houses bought by speculators could not have approached even 10%; it would have tied up too much capital. The bubble was simply a mania - too many thought they could get rich by buying a house.
The 'tipping point' in the housing bubble occurred when there was a lot of new supply, and a larger proportion of lower-paid people were provided with the conditions (easy loans, interest holidays, etc) where they could "own" a place that was as good or even better than they could rent - and certainly bigger. Historically it has been the reverse - many people would rent an apartment in a city, for example, that they could never realistically afford to own or pay off.
And this in turn is largely the result of favourable tax treatment for mortgages.
Landlords are not charities, and on some level rents are likely to cover costs.
This has been obscured by the rising price of houses, so they were hoping to make their money on capital appreciation.
Building regulations also tend to make people buy a more highly specified property than they would choose if the fiscal regime were more equitable.
The start of the housing bubble is mortgages being largely tax deductible,whereas rent is not.
This kind of deeply regressive measure is what got us in trouble.
I don't disagree. My point was that people bought bigger houses than they needed or could afford.
Excellent post.
This is just what I have been looking for. I have so many people I will share this with.
Thanks!
Euan, I remember when Stuart was posting data on Saudi oil fields and you were commonly in disagreement with his data. You were not "convinced" at the time about the severity of the problem. I have always thought when you and Robert Rapier full blown admit that "WE ARE THERE", it was time to really be scared.
Well...this post pretty much says it, doesn't it?
This is your admission to "yes, we are there"!
Really, I think there can be no doubt about being past peak unless production and exports were to rise for more than 3 months running.
WextTexas,
You want to know why peak oil aware journalists can't get the message out? Let me recount some recent personal experience. I'm what's called 'an old hand', have been published in 31 magazines, also done analysis of everything from IT to finance to commodities. I currently write for about 3 magazines and am the editor of an Asian feed grain publication.
Recently, I decided to cover a topic that the magazine had not touched before I arrived on the scene: fertilizer. With fertilizer costs up by several hundred percent over two years, I did a piece that tied grain production to fertilizer and, by direct implication, natural gas, which accounts for 80% to 90% of some fertilizer production costs.
I then pointed out in the article how, within one to two decades, peaking natural gas supplies could force countries to choose between heating their homes or making fertilizer, thereby triggering a global famine. I implied that in some respects, famine and much higher grain prices had been barely avoided by the relocation of fertilizer plants from natural gas poor North America to the middle east.
With farmers from America to Pakistan screaming about fertilizer prices and shortages, the publisher said the article was not relevant to a feed grain magazine and I had to re-angle the article. I manage to get the message through anyway but really, it was put right there in front of him, graphs and all but he could not make a simple connection between fossil fuels, fertilizer, food prices and food shortages.
I shared this story with colleagues who told me that mainstream media is even more difficult. We are dealing with a highly delusional denial of the entire situation.
I made this same comment elsewhere: while I read many, many comments on the various TOD sites about *reporters* not covering the story or having a clue about the issue. Editors make those choices, however, not writers, as far as what makes the cut. Perhaps we should be targeting editors more so than reporters?
Cheers
Euan,
Your first chart is interesting, but does not include a demand curve. Therefore, you are only telling half of the story.
In the interest of luring some of those 30,000 eyeballs a day, I explained the economics of the oil price rise a couple weeks back in The Age of Aquarius.
I used EIA data, which gives a much clearer picture of what's going on than the IEA data. I'm not exactly sure of why these two data sources are so far out of sync.
-- Dave
Dave,
Yours is an interesting article telling much the same story as I am from a slightly different angle. I have a problem quantifying / plotting demand since this is strongly dependent upon price and likely subject to significant time lag.
I still believe that peak oil will be defined by demand and suspect that this concept is one that stood between us and CERA. CERA see vast resources but fail to realise that we lack resources to exploit them.
What we really need is a chart that shows sensitivity of demand for oil v price on a global average - but that's near impossible to work out since large slices of consumption are subsidised.
So in short I agree that understanding demand is key - but how to do that in a price volatile, tax variable and subsidised environment is a very tough call.
And it is here that the market will prevail - the only algorithm we have right now to solve this problem - IMHO.
Not to say that we cannot second guess the structural parameters of the market and intervene to the benefit of humanity.
Best,
Euan
"What we really need is a chart that shows sensitivity of demand for oil v price on a global average "
This is a complex question, indeed.
Elasticity also varies over 1) time (i.e., people don't adjust if they think the price won't stay high, and even so, larger adjustments are easier over time); 2) absolute cost level (i.e., the change from $30 to $60 is less important than the change from $70 to $100); and with respect to substitutes available (Prius supply growth is limited, and PHEV's and EV's aren't really available now, but they certainly will be in a couple of years).
Not only that, but the US dollar is dramatically overvalued vs the Chinese Yuan. Any prediction of oil prices in US dollars needs to start with a prediction of the Yuan/US dollar exchange rate e.g. circa 2013. The way things are going, every month there are less arguments for keeping the Yuan weak and more arguments for China letting it loose to scoop up the available oil. Yuan strengthening will be like rocket fuel for oil prices.
Euan, great analysis, much appreciated. Re global decline rates in a recent Keynote Speech Dr Robert Hirsch quoted decline rate assumptions as 4.5% (CERA), 8% (Schlumberger) and 10% (Simmons). Dr Hirsch believed the Schlumberger number was the best assumption 'as they have access to much of the data'. The CERA figure of 4.5% which you've used here is the most conservative. Do you think there's a possibility that it's nearer 8% (in which case we have a much bigger problem)?
Understanding the actual decline rate is fundamentally important. The CERA figure recognises that a significant amount of production comes from new fields that may still be on build up - so they have not actually started to decline yet. And so while individual fields may be declining at 8 to 12% the aggregate including fields in build up is much lower.
I don't think its possible for global average decline to be as high as 10% - if that were the case we would be hurtling down the slope right now. But 5 to 6% may be possible - and that may partly explain why the flow on new projects struggles to lift production.
And in answer to another comment up the thread - correct that decline should not be applied to tar sands and ethanol in the same way as to oil and condensate - but for ease of presentation using a blanket figure is OK I think since syncrude and ethanol are a small part of the whole. NGL's are often associated with oil production and will decline in similar way. NGL's from areas like Qatar are in build up - and are therefore captured by the CERA aggregate approach.
Euan,
Thanks for your story on oil prices!
I agree that understanding future demand is key and will never be precise. I base my forecast demand partly on IEA's forecast demand figures combined with subjective judgement. More subjective judgement and some mathematics are used to develop a price forecast which changes monthly and is shown below. One thing is for certain - demand destruction will occur by long term rising prices.
Price Forecast May 2008 - click to enlarge
The main component of total liquids above is crude and condensate production. This is shown below and indicates a peak plateau of 74 mbd from 2005 to 2008. For comparison, the green curve forecast uses Colin Campbell's more optimistic remaining URR than my estimate.
Crude and Condensate Forecast May 2008 - click to enlarge
Ace - working out how demand will evolve is near intractable. I think is likely to be extremely heterogeneous. In the ME they will continue to drive gas guzzlers like there is no tomorrow whilst back home many will already be taking the bus. All part of new world order that is in the process of forming.
Your top chart is as good as any to give an illustrative feel for what might happen. Will the world really be demanding 79 mmbpd at $250 per barrel in 2012? Maybe.
Maybe what we need are a series of demand curves starting in 2000 for different constant price assumptions - 40, 60, 80 $ bbl etc and see how these project into the future and to then see when they cross the supply curve. Supply has not been significantly impacted by high price IMO.
I had extensive email correspondence with the Energimann who warns of a possible dislocation - and we can't discount that - demand and price collapsing. Or an event causing supply collapse and a price super spike. Virtually impossible to forecast.
Thanks Euan - that answers my questions - I could not see prices of $500/barrel and so on being sustainable without collapse, and so collapse in oil price too.
As you say though, difficult to model - but it looks as though we will find out, unfortunately.
[deleted]
I always look forward to your charts, they are a most poignant and useful summary. Does the price chart include any compensation for inflation? Not to say it should, but to know what doodles to draw on it for my own reference.
The price chart assumes an inflation rate of 9%/yr so the price in 2012 is in 2012 dollars, not 2008 dollars. This inflation rate may seem high but unlike official US Government figures it includes food and energy. This 9%/yr is also much less than the estimated true inflation of just over 11% from John Williams' Shadowstats.
http://www.shadowstats.com/alternate_data
Other assumptions include an inelastic price elasticity of demand of 0.10 which remains constant until 2012. To take into account long run demand destruction, only half of the supply demand gap is used for calculating the price increase. An alternative method is to increase the price elasticity over time so that the long run price elasticity is greater than the short run price elasticity. See page 24 of this report for more information.
http://cta.ornl.gov/cta/Publications/Reports/ORNL_TM2005_45.pdf
A serious weakness of using price elasticities is selecting the initial price and quantity which are used to calculate the forecast price. In this case, the quantity or supply has been relatively constant. However, the recent price has been exceptionally volatile in an increasing trend and the unit of price measure, the USD, has been volatile in a decreasing trend.
http://quotes.ino.com/chart/?s=NYBOT_DX
http://en.wikipedia.org/wiki/Price_elasticity_of_demand
Selection of the initial price is subjective. The weighted average oil price in Jan 2007 was $50 and on May 23, 2008 it was $123.
http://tonto.eia.doe.gov/dnav/pet/xls/pet_pri_wco_k_w.xls
I have used an initial price of $99 to forecast the price, as I am assuming that some of the recent price increase is due to investment demand. If I used $123 the price forecast would be much steeper. Instead of using the words "price forecast" it probably should be called a "price projection".
The price forecast does not take into account price shocks from planned/unplanned maintenance, terrorist attacks, wars, hurricanes, oil pipeline leaks, voluntary production cuts, hoarding, further project delays, labour shortages, oil tax changes or fuel price control changes. The price forecast does not include investment demand. A price elasticity of supply is not used because the supply forecast is based on production decline rates and depletion rates of remaining recoverable reserves.
The increasing price is causing demand destruction among the OECD countries so that non OECD countries can increase their consumption. From the IEA Table 2 of May 2008 OMR: OECD decreasing demand (total liquids) for 2005, 49.7 mbd; 2006, 49.3 mbd; 2007, 49.1 mb; and 2008e, 48.8 mbd. China's increasing demand for 2005, 6.7 mbd; 2006, 7.2 mbd; 2007, 7.6 mbd; and 2008e, 7.9 mbd. The Middle East countries, Latin America and India are also showing strong demand increases.
The demand forecast in the price chart above is based on a bottom up forecast of 18 regions/countries and is reasonable but does not include the possible effect of a deep global recession. As total liquids supply decreases, panic and hoarding could result causing increased price volatility and temporary price spikes. My price forecast is a rough estimate and is for a weighted average oil price. It would not surprise me if light sweet crudes such as Tapis exceed $150/barrel by the end of the year. If there was a sudden supply interruption from Iran or Nigeria, Tapis might reach $200/barrel this year. Today Tapis opened at $132.
http://www.upstreamonline.com/market_data/?id=markets_crude
Sounds like your also not trying to include export land ?
I think that would be a very important addition.
I second that Memmel
Thank you. Knowing more about your methodology makes the graph even more useful.
Cryptome posted
http://cryptome.org/cn-fuel-low/cn-fuel-low.htm
I wonder if or when liquid fuel shortages will hit the US.
Price of oil increased in 1980.
Commodities investor Jim Rogers shorted oil in 1980.
cheers
I hear a lot of talk about $130/barrel oil being a bubble. In most commodities bubbles though supply increases or people switch to alternatives. Oil is not experiencing a supply increase and there are very few alternatives so I just don't get the whole bubble explanation. At $130/barrrel we've got 42 US gallons to a barrel which means $3.09 crude cost. How much is the refining margin and so forth? I want to know how to calculate the rough gas station price from the crude cost. Thanks!
If it is a bubble, then it has been going on for some years now. So there must be a lot of oil stored in tanks around the world, to keep the price up.
This is not true, so the bubble theory does not 'cut wood', as we say here in my part of the world.
However, if demand is outstripping supply and price elasticity is low, then prices can go very high for a short time. So the fact that oil went from $100 to $135 in 5 months is a bubble in my opinion.
Price elasticity starts to change if people understand that the high prices are here to stay. That takes at least 6 months to start and for oil may take as long as 5 years before it fully works out.
So I agree that it is not so clear that prices in the long run (+3 years) also keep going up.
The biggist oil well is conservation. I think that you can cut your oil use with 30% without any significant trouble and another 30% with minor trouble. As soon as we start doing that, price will stabilize.
This is the best summary of the peak oil problematic I've read ever, and I must have read hundreds. It's crisp, clear, concise, comprehensible to the educated layperson, just the right level of technicality, great visual display of quantitative information etc. etc.
Anybody trying to raise awareness of peak oil should take this posting as a point of departure.
I'll be passing it on to my colleagues at the European Commission via the institution's internal website, where for over four years I have endeavoured -- with total futility -- to draw attention to the reality of oil depletion. Perhaps the penny will at long last begin to drop.
Thanks.
Thank you Carolus. I set a very high price on this kind of information being disseminated among our policy makers. I've been blogging with Andris Piebalgs - but have yet to see an any glimmer of receptiveness.
Perhaps a nit-picky concern, but early in the discussion you state that "the price has gone up to balance the books". Balancing the books is typically used in an accounting setting to show that debits equals credits. Used in this context, it may be read to suggest that people in the oil markets are somehow using the supply-demand scenario to ensure that their books are balanced (perhaps covering off-book expenses).
I think what you meant to state is that the price is rising to establish a market equilibrium between buyers and sellers.
Hi Euan,
A great summary for thinking people, now can you produce a version for the Sun newspaper?
Best hopes for people who think.
UK oil production had twin peaks and now everything is going down the tubes:-)
On a more serious note I set myself the task of writing this in 1 hour and 1000 words and failed miserably on both counts. The first draft about 1500 words written in 1 hour at Bristol airport 3 weeks ago.
But if anyone wanted to try and condense this into a red top article be my guest.
Great job! For someone like myself who doesn't have a background in petroleum economics or geology, this article is a clear and excellent summary. Some questions, though. 1) Ethanol and NGL's have lower energy densities than crude oil, and therefore distort the interpretation of the all liquids graph. However, what about light crude vs. heavy crude? Does heavy crude have a lower energy density than light crude, and if so, by what approximate amount? Does heavy crude produce fewer gallons of gasoline, diesel, etc. than light crude? If the world's production is shifting from light to heavy, does this affect the interpretation of the all liquids graph in terms of net energy available? 2) Does anybody know where to find a graph of world all liquids production converted to energy equivalence to take into account the varying energy densities of things like ethanol, etc.?
In answer to some of your questions.
1. I suspect that the energy density difference between light crude and heavy crude is quite small. But the refining fractions you get are quite different as described by Robert Rapier in this companion post today on TOD.
http://www.theoildrum.com/node/4038
2. We do not yet have an all liquids energy density chart - but we'll make one and have it ready next week.
Is not still the case that a pair of gaussian curves is regularly depicted on page three?
In terms of why oil prices are so high, there is a lot of explanatory power (in my opinion) from a philosophical standpoint in the Paradox of Value, proposed by Adam Smith -- that is: why is it, that diamonds, which are frivolous, are expensive, while water, which is necessary for life, is inexpensive? The answer is explained by most economists by the marginal theory of value. As water is in a surplus (or was) each additional "unit" is not worth too much. Diamonds however are scarce. Once oil become scarce -- a situation we see today (somewhat arguably, but most likely the case) the price for each additional unit of oil goes up significantly. In other words oil is very "price inelastic."
In Australia at the moment there is a noisy hoo-hah in politics and the media about the merits of a national fuel price watch scheme and whether the federal government should reduce either or both the fuel excise and the GST on fuel.We are looking at all of 5 cents/litre reduction.Hopefully none of this will come about but there is a great deal of hot air being emitted.Maybe we could harness this stuff to power something.
But seriously,I have been around for a while in various occupations dealing with people in some rather sticky situations so I am not surprised when I see bizarre reactions to reality.
But this sort of en masse running around like chickens with their heads cut off ,especially in the "leadership" echelons of our society has me wondering whether to laugh or cry.
Maybe TOD can line up one or two philosophers or psychologists who are prepared to have a stab at explaining this phenomenen.
The terms chicken and headless take on a new meaning when applied to the current stock of Global Political Followers.
Oil Drum editor Nate Hagens writes on both psychology and philosophy in relation to this problem and has published many excellent articles here on TOD. Though be warned, you need to work hard at getting beneath the skin of humanity.
Follow the link to a menu of Nate's articles.
Euan,
in general I like the article but I do think that the anti-Dollar decline argument "the oil price has risen in Euro too..." kinda misses the point as the Euro itself is a fiat currency that is being inflated away -only not to the extent of the Dollar.
Its a bit tricky to measure the oil price against some constant 'yardstick' as everything is floating in value -there is no yeardstick. The CPI figures are probably fudged so 'adjusting for inflation with CPI' will probably not be accurate. Some might use Ounces of Gold...
One things for sure: a dollar doesn't buy what it used to, in fact you now need $130+ of 'em to get a barrel of oil...
[Edit: consider the impact if exporting Nations 'devalued' their commodity by the same amount that the dollar money supply increased -each year 'a barrel' of oil got 15% less in volume... It would not be very long before importing nations would be saying "Hey, I used to be able to fill up a supertanker with a million dollars woth of oil, now I can only fill a tug boat..." :o)]
Nick.
Whenever someone starts spouting off about fiat currencies it makes me want to shake them and yell.
All currencies are fiat, including gold. The benefit of gold, when it was chosen, is that it:
1. Doesn't corrode.
2. Is dense and therefore doesn't take up a lot of space.
3. Had no value.
Read #3 again. Gold was too soft to be useful for anything. Now we use it as a conductor, but for the most part it is still useless. That is why it makes a good medium of exchange. No one is going to melt it down to make a coffee pot out of it.
--
JimFive
Exactly right.
I think it is generally understood that all currencies are fiat in that they are issued by a government or some authority (usually with the power to levy taxes) and have no value in themselves, i.e. the currency, a small piece of metal or paper, has a given value of more than the scrap value. If the scrap value of metal currency is more than the given value then it will often be melted down regardless of any laws to the contrary.
Since these currencies are therefore easy to create the issuing government needs to take care not to reduce the value too quickly or devalue the currency otherwise there will be a run on the currency and it will rapidly become worthless, see Zimbabwe.
It is generally in governments interests to have a steady gradual devaluation so that today's bills may be paid with tomorrow's currency of a lower value. Hence the amount of money in circulation will steadily be increased. Governments will use tricks to hide this amount of money such as creating inflation indexes that do not measure the full inflation. Thus today using the term "fiat currency" is often a form of insult.
On the other hand, gold and silver are extremely difficult to procure, plus points 1& 2 above and so have proved for millenia to have enduring value. One might argue that unless they had value people would not have gone to great lengths to obtain them in the first place.
When a currency is backed by gold it is a fixed relation to the gold and generally over time there is deflation in the price of goods as they are produced more efficiently. Interest rates may be very steady. The exception of course was when a government wanted to go to war or otherwise spend more money than could reasonably be taxed or borrowed when they would come off the gold standard.
You can have a deflationary economy with fiat money. What your talking about is actually store of value which is not the same as money. What you need going forward is a economy based on the concept of store of value.
In terms of currency this generally means one of the best uses for money would be to put it in a jar and bury it in the backyard. If its acting is a store of value its later purchasing power would be the same or higher then today assuming some deflation in a effort to convince people to dig up their jars.
Money would then only be spent to survive or on businesses that produce a true benefit. Interest is not really needed since under these conditions it makes more sense for the lender to partake in the profit/loss of the business venture. This means banking itself would be done using ELP principals. Banks would economize localize and produce. What they would really work as under this scenario is a way for people to pool money for investment instead of just putting the money under a mattress. In a sense all banks would be investment banks/credit unions. They would also obviously work as vaults for storing money even if its in electronic form.
By eliminating interest payments which are not tied to the profit/loss of a business and forcing lenders to accept the risk/rewards of a business venture directly you get a purer form of capitalism. If you think about it interest payments are really only a way to shield a lender from losses with payments from the winners.
This is done in exchange for excepting a lower profit margin if borrowed money is used to create a very successful business. However the problem with it is it keeps lenders from getting deeply involved in the reason they are loaning money and they resort to impersonal templates and guidelines which can fail spectacularly.
One might argue that, but one would be wrong. You need to read #3 again, gold has no value. Another way of saying that is gold has no utility. Something is valuable because of what one can do with it. Gold/silver have value only because the government (or your trading partner) has declared that they will be accepted as payment, that is, they have value by fiat. People go to great lengths to obtain them because of that declaration, not the other way around.
The difficulty of procurement of gold tends to encourage a less inflationary economy but it also means that only gold miners can increase wealth. Everyone else is just shuffling money around. In a non-backed economy anyone who can create a product can create wealth by getting the government (or their agents--the banks) to loan them money.
With several problems inherent in the fact that a sufficiently resourceful third party can control the money supply of your country. Also, this ignores population increases leading to de facto inflation if demand grows faster than efficiency.
--
JimFive
By that definition the penny and the nickel are no longer fiat money. Their scrap value is greater than their face value.
Euan,
good piece of work and interesting observations.
I think what we are witnessing these days are a true bidding war for oil which will end with "last man standing". I have no doubt that present oil prices are hurting economies that are huge importers of oil. The paradox here is that if the recent run up in oil prices accelerates and deepens the recessionary effects on some big economies (like the US and UK) could, with a time lag, see oil consumption start to decline thus bringing oil supply and demand back into balance creating a temporarily downward pressure on oil prices.
This happened back in 1979 and during the following recession the US consumption dropped with approximately 20 % over a 5 year period. Question here is would Chindia be affected of this recession? or would they be able to increase their consumption at the same rate that other economies decreased their?
History has a nasty tendency to repeat itself, but this time there are some differences which I think will make matters worse.
If this unbalance between supply and demand continues for some time my guess is that we will experience more contangos in the near future.
Best
I don't think the real bidding war has started one would expect exports of finished products to drop off first.
Why would Europe bid agianst the US for oil then export gasoline ? I think at best we are seeing a bidding war to some extent develop between China/India and the rest of the world. Otherwise I think the real bidding war starts after exports fall off and regions are focused on meeting local demand. This is probably at least a year or even two away.
The problem with the bidding war is that oil consumption in the third world is not that high anyway and the governments will have to subsidize some oil usage if only for cooking and crops and moving goods. The wealthy in these countries will continue to purchase oil and they represent a good part of the demand. They often have more money then most Americans. Third world energy usage is as distorted as incomes with the top 10% probably accounting for 50% of the demand.
China can at least for a while subsidize usage using its cash reserves. India is a bit more fragile. In any case the current prices are squeezing fewer and fewer consumers out of the market and leaving more which have fairly deep cash reserves.
As long as we have enough oil products exported and exports continue to hold I think the remaining consumers will just pay higher prices with demand only slowly dropping. Its a bit later on when oil production/ oil exports drop to the point that a persistent shortage start traveling the world and regions cut back on exports because of local shortages that the real bidding war heat up. So as long as exports of finished products continue they will be used to soften a local shortage but it will cause one somewhere else in the world.
So if we start seeing persistently low gasoline imports into the US then its a safe bet that the real bidding war is about to start.
This curtailing of exports of gasoline to the US is what I actually expect will be the real problem the US will face. It can buy as much oil as it can refine but if it does then other countries don't have enough to send extra gasoline to the US.
It could start this summer but I think it won't be until 2009 before serious problems develop acquiring exported gasoline. This is my double export land model which sets on top of Westexas's oil export land model.
We should expect it to develop a lot faster than dropping oil exports.
In any case this will force oil up to a price level which will cause American consumers to seriously cut back on oil probably around 500+ a barrel. I expect a brief pause at this level as American and European consumers finally cut obviously wasteful use of gasoline. And yes I think it will take 10 a gallon or more for gasoline in the US and 15 plus in Europe before people start seriously turning away from cars.
We probably get a slight breather at this point since the pressure on oil prices was to find a price level which forced conservation of obviously wasteful practices.
However it won't last long if I'm even reasonably close about decline rates or even using more moderate predictions we can expect the next problem will be getting oil to refine for local use. Now we hit the real wall as exports/production declines have reached the point that we don't have enough oil period.
I'm guessing this could be around 2011-2012. This is pretty much Westexas's export land issue but the modification I'm making shows a finished product export land crisis developing first and it may have already started this seems to be true for diesel. It seems to be following the pattern I'm predicting spot shortages with exports from other regions leading to shortages in those regions. This fall we can expect the diesel export market to begin breaking down and a significant premium associated with exported diesel our outright banning of diesel exports as countries try and harvest their crops. Gasoline should be next.
In fact this double export land model could account for basically all of the premium we are seeing for diesel over gasoline. If true then we can expect diesel to now have a permanent spread in price higher than gasoline.
In any case Westexas's model is in my opinion probably understating the effects of export land on countries such as the US that depend on large imports of finished products.
Hmm.
I got a 4qu audio from the fbi.
What to do?
Us seniors are working on this.
Maybe we need to sent wayne another email?
In Farsi?
When I was young in the 1950s the first self-service gasoline was introduced in California at (US$)$0.199/gal and gold was at $35.00/oz. An ounce of gold could buy about 175 gal of gasoline. Now with gasoline in Northern Nevada at about $4.00/gal and gold at about $900/oz, an oz of gold would buy about 225 gal of gasoline. Gasoline appears to be still inexpensive. The US$, however, is no longer worth much; about 4% of its 1950 value.
Very useful info and perspective. thank you.
You would be correct in your assessment if people regularly trades with gold instead of dollars. Or if dollar were tied to the gold standard.
However this is not true. So the real price has indeed gone up and the real measure would be to use inflation adjusted dollars.
I disagree the real measure is inflation adjust wages not price inflation. If the purchasing power of the consumer is gong down then the real price of oil is increasing. This eliminates reducing the cost of oil because increased oil costs lead to price inflation without wage inflation. In short inflation adjustment to the oil price actually hide a lot of the real impact thats in rising food prices etc.
Since wages have changed slowly over the last ten years the adjustment is small. In any case the real measure is cost of oil vs percentage income. Given that the US is starting to develop Brazil like demographics even better is to look at it vs the bottom 25% top 25% etc weighted by population.
By converting to a percentage of income basis you can also include the indirect food costs etc and see the real
costs. At the end of the day since most of the economy is driven by discretionary spending not fundamentals the move to just purchasing food/clothing/shelter/transportation is what matters.
Has anyone else noticed in the US, an ad running on TV with a woman walking on a map of the US declaring that we have more than enough reserves for the next 60 years of natural gas, oil, and coal. She never looks at the camera and speaks with a steadfast clarity, obviously attempting to sell us on her statements. I watched it a few times and then began to wonder who was playing that ad because it doesn't sell a product. In tiny letters in the lower left hand corner for just a few seconds, it reads:
Dept. of Energy
So evidently our federal government has decided that we all need a pep talk to assail our fears of rising fuel costs, and or peak oil. If you havent' noticed it before, watch for the ad - you'll get a kick out of it.
Yeah, it is practically complete propoganda because it is probably correct but it is very misleading to the average American. It keeps saying 60 years, but afterwards and less emphasized for 15 million homes or whatever which is obviously not all of America. The 60 years is repeated to give people a sense of assurance that these peak oil type problems seem to be years away, no reason to panic. Also it refers to reserves or maybe even resource numbers, and doesn't even dispel the notion (obvious to a peak oiler) that you may have oil and gas for a long time but the flow rates may not be enough to meet necessary demand. The misconception between stocks and flow rates seems to be something that only the hardcore energy analyst and peakster's would understand and not go for, the average American however, would likely eat it up. It's all about misleading but telling the truth at the same time.. same thing as lying in my opinion..
I think that in the UK at least, non product-linked propaganda like this might backfire because even if most people didn't appreciate the difference between reserves and flow rates, they would be cynical of the motives of the advert provider and it might alert them to the possibility of shortage by reverse psychology. It would for me!
There's an example I have here. There have been over the last couple of years public information television adverts asking people to save energy by insulating their homes, turning down thermostats, running less hot water etc. I think the pretext is climate change, which is valid of course, but it made me immediately think of our declining North Sea gas supplies.
People are immediately cynical of government motives here.
Carbon, Coventry - UK
Having been born to English parents, then emigrating to the US, I can appreciate what you are saying about UK culture. I learned early in childhood that most Americans are so patriotic they presume the best of their government, however UK culture does tend to be more analytical and discerning of what might be considered propaganda.
Thanks to the other poster explaining that the ad refers to 15 million homes. I was so mezmerised by the arrogant approach of the ad that I missed that critical point.
That's pretty bad. They put on this big ad with all this bragadosia and for what? For a small percentage of US homes. Outrageous approach to informing people, but par for the course over the last 8 years.
Sword you are exactly right.
All you have to explain to the people is that it is just like having $5 million in the bank BUT only being able to withdraw $5 a month.
Would it really make any difference if you had $10 million in the bank if you still could only draw out $5 a month?
That's the basic difference between reserves and Daily production.
Reserves = money in bank
Flow = How much you can withdraw per day.
It's the flow rate baby if you want to live the lifestyle.
Maybe it's new in your area, but it's been running in my area (Northern California) for more than a month and we commented on it earlier. I believe she mouths off a web site ... learnmore or something like that. If you track down the sponsors of that web site you find it is an oil and gas consortium (a.k.s. Big Oil). So yes, pure and effective propaganda.
Strange and unexpected phenomena will occur on our adventure into Peak Oil. For example, the sudden and unpredicted de-coupling of gasoline prices from crude oil in the USA. In contrast, diesel has continued in lock-step with crude.
As painful as the road before us may be, a free market will be less painful than a directed or highly regulated market.
Here is my situation; Retired, fixed income, Social Security, Pension, no stocks or bonds or savings to speak of. A new mortgage fixed of course, I am no fool. I reached my gas limit at 3 skins a gallon and stopped going anywhere or doing anything, no tv, no loss and holed up in my mortgaged house. I am a hermit now. It makes no matter how high gas goes for me. I have a 2001 Toyota 4Runner that is very thirsty. I am hoping for a nuclear attack on US soil so I can chuck it all. I am ready, been there done that. Adios!
Looks like the impossible has happened.
http://www.bunkerworld.com/news/2008/05/71812
My prediction was that bunker fuel could eventually cost more than crude oil since we needed the refined
products more.
Not quite exactly right yet but in this case subsidized diesel is now cheaper than bunker fuel.
This is fairly close to what I was arguing. Expect more strange prices in the future.
Whats interesting is this probably will lead to a fairly large black market in countries with subsidized fuel
prices.
Said by Euan Mearns:
I think Russia has a tax on oil exports, but the internal price of gasoline is largely set by the free market. Russians are feeling the pain of the increasing cost of gasoline. They are also getting higher prices for imports, food and everything else whose price is affected by crude oil. Demand destruction should happen in Russia coincident with increasing revenue from oil exports. Which one will prevail?
Drivers Seethe as Gas Prices Climb, The Moscow Times, May 29, 2008:
Their math is a little off. ($3.60 / gallon) / (3.785 l/gal) = 95 cents/l with an exchange rate of 23.64 ruble/dollar.
Nevertheless, an excellent post.
Russia has a tax (commonly called 'export duty') on both oil and product exports. Gasoline and diesel exports are taxed at about 70% of crude oil, on a per ton basis. (The idea behind this is to encourage refining vs. crude exports.) The export duty can be viewed as an implicit subsidy. However, the subsidy is canceled out by the excise tax on fuel which oil companies pass on to customers. Plus, there is a VAT of 18%. All in all, the price at the pump for high-octane gas (92, 95, 98) is about the same as in the US, at least in Russia's major cities.
Two factors are contributing to Russian inflation. One is the cost of energy. This is non-monetary so some people don't count this as inflation. The other is the Central Bank buying up dollars by printing more roubles to keep the rouble from appreciating, much like China is doing. In USD terms, Russian prices can easily jump 25% to 40% y-o-y in 2008. But GDP is growing largely thanks to non-oil sectors, and incomes have been growing ahead of labor productivity. Judging by what international automakers are doing in Russia, I doubt there is going to be a major drop in car sales.
Very nice Euan. I will recommend this post to anyone I meet who complains about the price of petrol.
We live in S Spain...where we buy 5 litre bottles of spring water for €0.58....where do you get your $2 per litre of spring water from? On our price a barrel of water would be €18.44 (approx $28)..
The counterargument for higher prices is that as prices go even higher - demand will fall (already see signs of cutting back) - economies will slow - accelerating fall in demand..speculative investors will sell...
however the longer term arguments for higher oil remain...
Comparing the price of oil to bottled spring water proves nothing. Why not compare it to diamonds or gold to prove oil is cheap? Comparing things that are different and have different uses is silly.
The article repeats the oft heard complaint that the energy content of a barrel of ethanol is less than that of a barrel of oil. By ignoring price, which in a perfect market would price ethanol appropriately, EROEI believers continually make this error.
Price compensates for the less energy content if it is not manipulated or artificially held high as in the case of ethanol.
Hoping that there is a tax structure that will give incentives to the oil producers to make massive investments in alternative energy is a pipe dream. They have demonstrated that they view alternatives just as the article does: they are not as good as oil. Why then should they invest in alternatives instead of oil? Oil producers will invest some in oil production, but most profits or tax incentives will feed the liquidation of the oil business though stock repurchases, dividends, and management bonuses.
The correct thing to do is to tax the hell out of oil and use the money to subsidize alternatives, mass transit and other efficiency measures.
I think the whole idea with the water comparison and other things like soda is to show how under-valued oil is based on what It can do. Can a barrel of Soda propel a 3500lb piece of machinery 800 miles in the timespan of only a few hours. Oil and it's derivatives are some of the most energy dense substances on earth and are therefore very important to modern society, we take for granted how many invisible slaves are actually serving our everyday needs.
EROEI believers are simply believers in the laws of Thermodynamics. It's pretty ignorant and hypocritical to deny the laws of Thermodynamics then drive around your car, use your microwave, turn on your tv and then get on your computer which we would not have without understanding the laws of thermodynamics. That is like someone advocating being a vegetarian while they shove bacon and sausage patties in their mouth, it makes you question their credibility.
There is no such thing as a perfect market, and no law of economics that says ethanol will be priced appropriately. Believing that all units of energy from different sources will be priced the same is just bad logic. Gasoline is produced in a completely different way than ethanol is. The producers of a product have to pass on the cost of production to the price of a good, and the cost of production can be looked at from an EROI standpoint. Fact is in the perfect market you advocate, nobody would produce ethanol. I'm not sure if you realize this but corn ethanol would not be profitable if it were not for subsidies. That is because the cost of production are higher than the appropriate price you speak of.
Ethanol prices are artificially held low, are you an idiot, or does the perfect market involve tons of government subsidies?
I agree for the most part about the behavior of oil companies. They may invest some in alternative energy but not enough to make a huge difference.
Taxing oil companies to subsidize and invest in alternatives is probably a decent idea, however only if we invest in true alternatives that can work completely free of fossil fuels, anything else is just burning money away. Kind of funny you advocate the free market in the first part and finish by saying we should tax and subsidize the hell out of everything. Just saying...
First, all due credit must go to Euan Mearns for an interesting and informative article, and the charts are fascinating, although they may leave an impression considerably different than the post itself wished to leave.
Take the first chart, which seems to indicate that the more production goes up over time the higher the price goes!
The relation of this chart to the conclusion that was drawn in the text seemed nothing short of absolutely baffling:
http://www.theoildrum.com/files/luis_exports.png
From this chart, the author says "Those seeking an explanation for why oil now costs over $120 per barrel need look no further than this chart." (?????) There is indeed a dip out at the year 2008 mark, but it is so small as to be essentially on the edge of measurement error, and we have seen dips like this many times before. The real Export Land Model(ELM) the all time big daddy that should have proven peak (if dips in exports is to be used as evidence) would have been 1977 to 1985 (8 years!)of declining exports! So deep was that drop, if you use the chart that Euan shows us, that oil exports were at a low in 1985 that had not been seen since 1970, 15 years before!!
Surely then, the sentence quoted from Euan's post would have been much more supportable by the evidence in the late 1970's than it would be today:
"The principal reason for current high oil price is the proximity of a peak in global oil production."
Of course, we know now that the world was nowhere near peak in the late 1970's (although many folks at the time thought it was and press hurled article after article at us assuring us it was {wonder why the "iron triangle" could not silence the MSM then?})
All this to say once more what we all know and what I have said many times here on TOD, even though it is still somehow very discomforting to many around here:
(a)Price is no proof of peak (or lack of peak)
(b)Oil production is no proof of peak (or lack of peak)
(c)the twin axioms above is what makes peak so very dangerous. There will be no advance notice, and as Matthew Simmons often tells us (and then somethimes forgets when he is caught up in the moment) peak is ONLY visible in the rearview mirror.
Peak oil may have already occured. Or it may not occur for 30 or 40 years or more. There is simply no way to know, and thus, it is almost impossible to plan and to build consensus on planning. When peak oil does in fact occur (if it has not already) we probably won't know it for at least a decade or more after the fact. Peak itself can be dealt with. But the lack of knowledge, the almost total blindness, is the real devil in Peak Oil which makes it one of the most difficult challenges we have faced in modern times. We have to be prepared for multiple scenarios ranging from absolute shortage to massive oil glut, and all on very short notice, something that is very difficult if not impossible to do.
RC
Roger - its good to get some probing. To answer a couple of your points.
There are complexities in the top chart to which you refer. When supply is not constrained then rises and falls in production reflect demand and price goes up and down with demand - in a very general sense and with some time lags. When supply becomes totally constrained - in fact if it starts to fall in the face of strong demand we will see sharply higher prices with falling production. What this does to demand is hard to calculate.
The dive in exports of the 1970/80s needs to be seen in the context of withheld production by OPEC , hence growing reserve capacity combined with growth in OECD indigenous supplies in the North Sea and N Slope - so that feature has completely different significance to now where OECD production is very unlikely going to rise and OPEC reserve capacity is close to zero.
If we see a future glut of oil it will IMO be due to a collapse in demand. But that will be job done - peak oil brought about by a fragile world economy unable to pay the true cost of energy.
I think the links between the discovery curve and the production curve provide a degree of certainty. However, I agree that governments will respond to this issue reactively.
Euan, you said "I think the links between the discovery curve and the production curve provide a degree of certainty."
I think you are correct in that the lack of discovery provides as good an indicator as one going to get. I just wish it could provide a greater degree of certainty. Beginning in a period around 1985 world oil prices fell to historic low prices inflation adjusted, so I just one who was out there in those lean years (lean decades actually) even looking for new discoveries? What was the point in spending money on discovery when you could not even sell what you had for a decent price?
Either way, at today's prices everybody should be looking now. Only time will tell whether or not there is much to find. Regarding OPEC, getting reliable numbers is almost impossible. I have sometimes refered to the current situation as a "silent embargo". Post 9/11/01, the Saudi's have talked a good game, but pretty much went their own way. Given the displeasure they have clearly expressed concerning our Iraq adventure, I don't think they feel they owe us any explanations. In the 1970's, OPEC told us they were going to use the oil weapon and they did. Could it be that in new century, they are playing a much more coy game and are using the oil weapon, but this time, they just didn't bother to tell us?
RC
Roger, on the exploration front I don't hold out too much hope. Colin Campbell has been very careful in his analysis to include a realistic figure for yet to find. The reality is that give or take a little noise the discovery curve is going down. The discoveries in the Santos Basin (Brazil) last year and this - Petrobras, Repsol and BG Group - are great news for these companies and Brazil, but even with 10 to 15 Gbs recoverable this is a drop in the ocean. The North Sea is now like a pin cushion. Sure we'll see new discoveries - even giants - but we need 5 a year - not 1 every 5 years.
The Norwegians I speculate may have kept some prime acreage in the N Sea unlicensed - S of the Oseberg Field - and may pull a giant rabbit out of the hat there one day. But by then the world will have changed.
My own belief is that OPEC is pumping flat out. So a real concern to have right now is that they do use discretionary production cuts to protect their reservoirs and their future. I don't think they are doing that right now.
My gut feeling is that if OPEC was playing the Oil Weapon, most of them would not be still producing at or above Quota.
Off subject.
Could you tell me what's happening to the UK
power grid?
http://news.bbc.co.uk/1/hi/uk/7422817.stm
British Energy races against time after worst power cuts in a decade
http://www.guardian.co.uk/business/2008/may/28/britishenergygroupbusines...
Sounds exciting.
Underinvestment and fragility. Resiliance sacrificied in the name of efficiency. I'm unable to give a detailed answer right here. Sizewell B (nuclear) in England tripped and a few minutes later Longannet (coal) in Scotland tripped.
The grid and its stability are outside my area - but we hope to have a post on this in a few weeks.
yeah but the difference is the spare capacity issue... production and export
I get where your coming from but on balance I think your being too unspecific about the "complexities"
in a pure unrestrained geological sense peak could be way off with out interference "above ground"
in point of fact I'm sure it is
a massive oil glut is a disaster is it not?
Boris
London
What was the size of the Chinese economy the last time there was a massive oil glut?
Boris of London asks,
"a massive oil glut is a disaster is it not?"
It absolutely would be for the U.S. anyway. We are now pouring roughly 3/4 of a trillion dollars out of the country buying oil. Add the more than quarter of a trillion dollars we are spending on the war in Iraq, and you have a trillion dollars per year leaving the country, not even counting the consumer goods we are buying from around the world, everything from German cars to Chinese underwear and plastic toys and Japanese electronics. The trillion is just to keep the energy coming to us. Even if peak oil is some years away, we face a financial catastrophe. We will run out of money long before the world runs out of oil, even at current prices. If the price of oil were to rise much more, the cash flow problem would become critical very soon. Peak or no peak, the U.S. is in an unsustainable situation that calls for emergency mitigation NOW. I am sure the U.K. is in no better shape as the North Sea seems to have pretty much seen it's best days, and the decline rate continues to accelerate. Frankly, we do not need to cry "PEAK!" to be able to say "EMERGENCY NOW".
RC
this is essentially what Euan says..
the above ground stuff matters and will be a factor in "discovering" the global peak.
the more complex the region/basin multiple is the more prone it is to above ground distortion of some lovely bell curve..
globally thats quite a lot of messing with the curve..
but there you go.. the size of the "margin" effected above ground will determine global peak as it superimposes on the curve of geology... so to speak.
I totally agree with you
I think the term "foothills of global energy crisis" is a very good term and I think you agree with it too.
There was a post at PO.com the other day (forget the poster but not the quote)
paraphrasing
on an aside I saw a talking head on sqwarkbox almost quote off euans post today..
Boris
London
Where's that flood of KSA oil you promised two years ago, Roger? I'm still waiting...
GreyZone, how's it been?
You asked an interesting question, and one that gives me a few moments to reflect, but only a few (I don't have to tell you that I sometimes go long...:-)
You asked "Where's that flood of KSA oil you promised two years ago, Roger? I'm still waiting...".
I am sure that's an accurate portrayal of what I said, but it's close enough in certain ways to my contention that the KSA still possibly had some aces up it's sleeves, and would wait until they had "flushed up" the competition, whether that be other oil producers or the renewables, and they open up with new oil to drive the price down, and that we should be cautious of such a possibility and be somewhat prepared for it.
GreyZone makes the point that this has not happened yet, and in that he is without a doubt correct. On the other hand we have seen no signs of desperation on the part of the KSA, they seem to be running pretty much on plan, maybe not our plan, but their plan.
If the release and upward production of KSA oil does not occur, then we can only assume one of the following:
-KSA simply cannot deliver the goods. This is the "Twilight In the Desert" argument, and postulates that KSA is much like Texas after U.S. peak, it simply cannot, no matter how much effort and money is put on the line deliver more oil. If this is the case, then the Saudi's would try to stretch production by careful management of the oil fields, and prices would climb causing demand destruction, which KSA wouldn't mind a bit, as they could hide the fact that they were at the limit. In other words, about what we see to this point.
Second option-KSA still does not feel tha the competition has been "flushed up". They are delaying on capital expenditure, and allowing nations and firms to sink money into expensive new oil production projects, renewable energy projects, and very expensive capital intensive projects such as tar sands, coal to liquids, gas to liquids, ethanol, etc. Then when these projects are on the edge of turning profitable and really generating a return on investment, the Saudi's will be ready with new production to pour cheap oil into the market and bankrupt all competition. If this is the case, then KSA would simply talk a good game, spend enough money to keep oil production at about current levels, and know that new demand for oil in countries like China and India would drive the price up. In other words, about what we see to this point.
So, which is it? How can the consuming nations of the world know how to plan? How long can the KSA "sit on it's hands" if it chooses to? Remember, to this point they have seen only gain and no pain. It is the giant oil consuming nations that have felt the pain.
Remember that the last time oil production fell for repeated years and by a large amount, the world did not recover to old levels of production and consumption, to the old "peak" for some 14 years.
This game will not be played out overnight. So back to GreyZone's question, "Where's that flood of KSA oil you promised two years ago, Roger? I'm still waiting..." I would reply that we all are still waiting. And we may wait for a long time. It may never occur because it can't, this is it, the real and final peak. Or it may occur at the absolute threshhold of pain for the consuming nations, 2,3,5 or even more years form now. The problem is, we have no way to know how long the wait may be, or how it will end.
The danger KSA faces is if the alternatives, the good ones, actually work. Then the world can begin to do what it must do for at least a dozen reasons other than "peak oil" and that is move away from oil. If this is to happen, and the alternatives do work, KSA may reason that they might as well find out now. And we know it must happen.
The age of oil as the driving fuel of world prosperity is over. But like an elephant that is shot but can still run miles on momentum, oil will be with us for many decades. With or without the alternative energy programs, oil will be needed in large quantities for a long time to come. The Kingdom of Saudi Arabia can afford to play a waiting game. The consuming nations cannot. But we must be aware that in any action we take, whether it is to fund and build alternative energy programs or whether it is to attempt to out wait our suppliers, there is considerable risk. Any scenario we can put forth will certainly be wrong. So to correct what GreyZone said, I have never "promised" a flood of Saudi oil. What I said was do not dismiss the possibility. What we cannot know is whether it will happen, or when. What we also cannot know is that it will not happen.
I still stay with my prior posts on this subject: What we know is that we simply cannot know.
RC
Hi X,
I think you may be missing a point here. Euen is telling a story. Much like a good story should be, he has tried to make it interesting. The use of metaphors is a wonderful tool for reaching an audience.
The tragedy is that a society can value bottled water more highly than a liter of oil. There could be some hope if we as a society took heed of how the power of advertising can rob us of our brains.
I think that TOD hopes that we can use this same power to become PO aware and save ourselves from the coming disaster. Nobody else is going to save us.
Taxing a commodity excessively is not a solution,as the British found out when Gandhi toppled their rule in India over the tax on salt. Or the US Boston Tea Party tax, for that matter.
You are correct that all the players in the Oil-game will run off with whatever they can get long before they ever try to actually fund any solutions. The politicians will be the first to stick out their hands.
Very unfortunately, we are absolutely our own problem, and incapable of any voluntary change. We keep hoping that somebody else will take care of things, and then we will whine and complain when they try.
I think that these current gas prices are ridiculous and only benefiting a certain few who are profiteering over the misery of many. How could such a small group of a few hold so much power over many?
This gas crisis is so out of hand, that I've resorted to drastic measures. Recently I converted my 04 Cadillac to utilize water as fuel from an easy to install kit, I obtained online from a company called Water For Fuel
That's nothing, I heat my home with SPAM!
Super article Euan. Thanks!
Thank you for posting this analysis, it is well researched and very interesting.
One friendly comment, comparing the price of bottled water with oil is a false comparison, statistics people have a name for this sort of thing. These are not free variables, they are closely related and connected directly. This does not prove the "cheapness" of anything, oil, water, or opinions. Please rethink what you are trying to show or represent. What would the price of bottled water be if oil was 300+ $/barrel?
I strongly agree that the price of hydrocarbons is tremendously undervalued.
Bill, you are not the only person to comment on this - so it clearly requires some thought.
Baratunde loves Euan's piece yesterday (and TOD in general): "Milkshakes Are Harder To Come By: Why Oil Costs Over $120 Per Barrel"
http://www.dailykos.com/story/2008/5/29/134254/584/893/524914
http://baratunde.com/blog/archives/2008/05/milkshakes_are_harder_to_come...
http://www.jackandjillpolitics.com/2008/05/milkshakes-are-harder-to-come...
Go to one of those links and give him some love...
I have been doing a swag on the megaprojects wiki data, putting in arbitrary estimates of the effects of :
a)a later peak of projects coming on stream in the current year
b)some projects being delayed vs schedule
c)some projects dissapointing in terms of actual vs expected peak production.
The main impact is to shift some of each years planned additions into later years. One seemingly reasonable set of guesses gives production capacity by year after a 4.5%/yr decline in prior year capacity as 87, 88, 88, 89, 90, 87, 85 mb/d for 08, 09, 10, 11, 12, 13, 14 respectively. The peak year clearly shifts to 2012, with a sharp fall off afterwards. One could alternatively come up with a bit earlier and a bit higher peak.
Note these estimates are arrived at by adding an adjusted megaprojects contribution to a 2007 "all liquids" production of 86 mb/d.
Clearly these numbers are low because they do not include growth of "other liquids". The available oil for importers is high because there is no attempt to estimate declining exports.
2013 qnd 2014 are low because they do not take into account new projects not yet in available data. However since discoveries/yr of greater then 0.5 Gb went to about zero after 2003, they are probably not much low.
Gasoline prices in the USA are now at the level of share of discretionary household income that was reached during the 1979-81 peak (and deisel is much higher), which caused a sharp decline in demand, so we should expect a drop in demand in OECD countries going forward. Even subsidized countries like China are going to be strained, because they will not be able to afford the growing subsidy. Demand declines in the next weeks/months are going to correspond with significant megaprojects new capacity, which will be bearish for prices, and only a little bearish pressure will pop the speculative bubble referenced here http://globaleconomicanalysis.blogspot.com/2008/05/quantifying-commoditi....
My guesses is an early drop in prices, with temporary overshoot, that could bring the price below $100/b before the end of 2008, at least briefly. Murray
Demand and export land march on. Even if Chinese demand growth begins to slow it will be years before it goes negative much less to zero. For example the housing bubble peaked in 2005 and commercial construction is just now getting hammered it will be 2010 before everything is seriously slow thats 5 years.
Chinese growth the same internal demand is building still so it will help cushion slowing exports. Also the Chinese still produce a lot of cheap goods so former Target shoppers will visit Wall Mart etc. People will shift demand to the cheaper goods but its still Chinese imports for the most part.
Also as far as China goes it has a huge surplus of cash it can burn through this and go into debt before it really has to cut subsidies. This could be years and of course near the end they could easily slowly ease off the subsidy level. And they have a large internal production thats effectively sold at cost which is much lower than the world price so its both a oil and cash subsidy. Look at Indonesia for example and see how long its taken them to move off subsidies and they are in a far worse cash situation. Egypt for that matter.
It will take time for the juggernaut that is the global economy to slow so I don't see potential demand dropping enough to result in lower oil prices anytime soon. Assuming 5 years to slow down gives 2013 as the date that potential demand and prices will meet and we will pretty much have zero potential demand.
This is the earliest that I can see supply and demand starting to meet and price increases maybe slowing.
It all depends on what supply will be like then. I'd say it will continue to go up until demand begins falling permanently as people move away from oil and don't go back.
Also overall the rest of the worlds demand is probably a lot more resilient then in the US. In the US you have some obvious uses that can be curtailed such as oversize SUV's, Motorhomes, driving vacations etc.
But the US cutting some fat is probably not enough to ensure prices drop. And the people that pull back are only the ones that are in financial strain. Net result is more of a flattening of demand in the US going forward with at best a very slow decline.
I don't see housing and gasoline as analogous. Large SUV and truck sales have already plunged in the USA. Very quick reaction. Also use of public transit is soaring, albeit from very low levels. Sure the rest of OECD has less room to move, but that is more likely to mean less movement than later movememnt. For the USA there is likely a trigger level at near $4.00/gal, based on the 1979-81 experience, and we are there. Countries with subsidized prices will experience some delay, but that will be months, not years if oil prices stay this high. Even China will act to at least curb demand growth rate. Murray
The plunge in truck sales is certainly tightly linked to the collapses of the housing market so you have two forces against large truck sales. Also the used market for trucks is flooded with commercial and private trucks owned by construction workers. The SUV sales are also probably tied to the same reason since sales of all high end cars have plunged as the housing bubble popped. Most of the 40k plus large SUV's where probably purchased with HELOC money. As with untangling export land and production numbers ( assuming reported production is suspect ) you have the same problem with large truck/ SUV sales. However even though they are selling at a discount in the secondary market they are still selling. After the dot.com bust computer equipment, office equipment etc was available cheap and depressed new sales for years.
As far as hybrids, small cars etc the base sales where very low until recently so growth is expected this is a much better indication of purchasing because of concerns about fuel prices. But you need to look at the growth of the overall small car market. I'd suspect if you consider all the cars that Americans consider fuel efficient you will find that EV sales have taken sales away from other types of small cars. Whats important is if more fuel efficient sales have caused the mid-size sedan market to decrease. I think we should see some effect.
Overall new car sales are shrinking sales of status/luxury cars the fastest and you do have a lot of selection pressure for prudent consumers now since the idiots are being taken out by the housing bust.
In general the same people that buy a prius are the ones who practice more conservative money management.
And last but not least the overall shrinking of the new car market does not bode well for fleet changes to increase efficiency historical rollover has probably slowed to a crawl. Its much cheaper to keep a less fuel efficient car and pay more for gas then to take on a new car payment and insurance. Gas will have to go up a lot more before these fuel inefficient cars are removed from the fleet and crushed.
And last but not least the consumer thats having problems at 4 dollars a gallon is not the one buying brand new cars but generally used cars. You really need to look at the used car market to get a handle on this.
I'm not saying American are not getting more aware of gasoline prices and changing just that right now the whole iron triangle as WT puts it is being disrupted with overlapping causes and effects.
I think the net result will be new car sales will slow to a trickle and what is sold will be fuel efficient.
However opposing this will be a very low fleet turnover with a large number of less fuel efficient cars staying in the fleet for a lot longer so the net change is probably a lot smaller than people expect.
As the economy goes deeper in the mire you should start seeing mileage affected by churn in the s/h car market which will have the effect of reducing consumption.
For high mileage drivers whilst a new car might not be worthwhile, picking up a s/h car which will go a long way on little petrol will become a priority for many, and the high prices those will fetch will lead some of those who are very low mileage such as the old to take the money and take a bus.
Those forced out of their homes are also likely to need the money, and sell the car which is worth something, buy an old gas-guzzler and rarely drive it.
So the fleet will still churn to some degree, and gas will be economised at great cost to the poor even with low new vehicle sales.
In much of Europe with relatively high vehicle excise duties many, especially the old, will simply sell their small cars, which the high mileage drivers will snap up, and catch a bus, which in some parts like the UK is free for the over 60's.
Don't disagree different viewpoint but same effect a lot of the efficiency will come from parking/crushing the biggest gas hogs not from roll over of fleet inventory. But the premium for a fuel efficiency has to fit within the costs of continuing to drive a less fuel efficient car. This is easy for the largest SUV/Trucks but the mid sized cars 30mpg or so drops the advantage quite a bit. 20 mgp vs 40 mgp is easy but 30 vs 40 is not.
Also of course another big effect may be a movement back to the city center this could dramatically cut fuel usage. The combination of purchasing a 40mpg car and halving the commute distance is pretty good. If you add in ditching the house payment by selling or walking away you get another big boost.
The only monkey wrench with people moving is that today you have in general dual income households and finding a place that can reduce both commutes at the same time is difficult. And of course this adds pressure on rents and homes in desirable commuting areas.
Right now at least for the US I'd attribute 99% of our fuel savings to the collapse of the housing industry not attempts at conservation. Even if you just look at the number of Realtors who drive large cars to show houses the reduction here is enough much less looking through all housing related driving.
Maybe answer this question.
http://wiki.answers.com/Q/What_is_the_average_number_of_miles_driven_by_...
http://realtytimes.com/rtpages/20060705_moreagents..htm
California has 500,000 real estate agents assuming they have cut driving by like 70% since houses are not selling and you get the bulk of the current savings in fuel right there.
So I repeat to date all we can see is the collapse of the housing market and associated fallout.
I'm sure that your getting similar numbers in Spain and England etc.
In the Asian markets which don't depend on driving as much to show homes your not seeing these declines.
In England we are probably around 6-12 months behind the US in the housing slump, and so that will not kick in until later.
I'm not sure that any drop in consumption of petrol here in the UK will have much to do with real estate dealers - most people have work done on their house when they move in though, and those builders drive big trucks, so a slowdown in sales and building will decrease money spent on petrol.
Neither the US nor the UK are really in recession or depression yet though, and as jobs get scarce and unemployment rises is when I expect the serious demand destruction.
Sorry. Your theory seems likely, so I called 3 local new car dealers. Here in Charleston SC we have not been hit by the housing slump like major parts of Ca and Fl. The stories I got were pretty consistent. Relatively few contractors (only the big ones) buy new trucks, most buy used ones. Real estate agents almost all lease, and there is some effort to break leases. Really big SUVs and dual cab trucks are bought by people with money, and sales of eg Cadillac Escalade fell sharply over a year ago when gasoline got to $3.00/gal for a short time and then had some recovery. Over the last 3 weeks or so, you can't move a new gas guzzler, and they are trying not to accept them as trade-ins any more.
Also we have a major annual cultural event in Charleston called the Spoleto Festival, which normally draws a lot of tourists, and it is on right now. Ticket sales are way down, hotel bookings are way down, and the festival will lose money for the first time in over a decade. The organizers ascribe the fall off to high gas prices as the primary reason, and these are people that can normally afford fairly costly event tickets. If the relatively well off are reacting this way, what about the not-so-well off? I don't think you can make a case for even a frew months delay, let alone a few years, at least in the USA. Murray
Well first off I disagree about Charleston not getting hit by the housing slump.
Its over 15 months supply.
http://www.michelereneau.com/
And this shows a decline in prices.
http://www.charlestononlinehomes.com/blogs/howard_arnoff/default.aspx
Foreclosures up 65%.
http://www.charlestononlinehomes.com/blogs/howard_arnoff/archive/2008/05...
Your assumption is wrong about being stable.
So you have already been hit its just that the rest of the stats trail the current state of affairs.
Also of course the places that fall later probably will fall faster. The pacific northwest seems to be catching up fast with CA for example.
And the ability to get loans is national not regional. I think you will find out in a few months that the housing market has pretty much frozen solid nationally outside of people with equity still selling in CA/FL since the prices are still high and buying in cheaper areas. Even with the drop in prices CA/FL are still insanely high. Charlestons stats should worsen rapidly over the coming months but once transaction rates plummet most of the damage is already done since no money is being exchanged. Its a velocity issue first and foremost.
I have yet to really make a point about all this. But my point is that drops in consumption coming from the housing bust are a one shot deal not a long term trend. Also right now its only the worst abuses being shaken out. Once drops from the housing bust are over and the purchase of insane cars SUV/RV's etc the remaining demand is VERY sticky. So for now at least extrapolating the current situation into the future is not a good thing. The next round of demand dropping is orders of magnitude more sticky.
Also its a lot easier to blame high gas prices for than to admit your flat broke and are probably going into foreclosure soon.
I think you will see demand remain constant going into fall and early 2009 even as oil prices climb.
Most of the gains from the housing bust and its slowdown and the end of stupid SUV/RV purchases will be behind us. By this fall we will have a clearer picture about how much was a one time gain from this and how much of our demand destruction is coming from people making serious and continuous efforts to conserve.
The reason this is important is that the next round of destruction will require major life style changes. Not buying a stupid car and not taking so many trips is easy enough to do. Moving or changing your commuting style is a lot more difficult.
"Moving or changing your commuting style is a lot more difficult."
True, but carpooling is mostly difficult because it's embarrassing. When enough people need to carpool I suspect there will be a social crystallization/tipping point, where it becomes acceptable.
There's a synergy between AGW mitigation and PO adaptation: you can say you're making a change to help the environment, and avoid the embarrassment of economic adaptation - I think that's one reason AGW mitigation is becoming popular.
I agree I suspect car pooling to combat global warming will become socially acceptable in direct proportion to gasoline prices :)
I think a real sustainable movement if you will is still in the future. Its coming the backlash against consumption is building but we are not there yet and more importantly I think gasoline prices will have to climb a lot higher before the US begins to reject the Oil/Car/Housing iron triangle. Right now overall the public is blaming primarily the oil companies for there problems but I think we will see a rising backlash agianst automakers ( People are already making this known via purchases ). And finally housing with more and more people becoming interested in lifestyles that don't require driving.
However I don't think this belated realization of what we have done will prevent the US and the world from experiencing some serious pain. And I don't think it will be enough to save the middle class. Sure we will make the social changes but they will be in a society thats increasingly polarized between rich and poor. Also a growing population of fairly well educated former middle class people with a chip on their shoulder is a breeding ground for revolution. You get three pissed off groups. The poor who see they will never make it.
The former middle class agitating for a move to sustainable living. And finally the most dangerous group the ones who want to resume a consumption lifestyle by taking it away from the rich.
Anyhow all this is for next year and later this year we have the housing bust and the end of the most flagrant abuses.
Next year it gets much more difficult.
" I don't think this belated realization of what we have done will prevent the US and the world from experiencing some serious pain."
I agree.
"And I don't think it will be enough to save the middle class. "
I can't see that much pain. Building enough wind to provide all of US power needs would only cost about $3T (roughly the cost of the Iraq war!!!). That's 2.5% of GDP for 12 years. We can replace all of our ICE vehicles over about 20 years, for no real premium over BAU.
The real question is how long we keep transferring $.5T/year in wealth to oil exporters...
"The SUV sales are also probably tied to the same reason since sales of all high end cars have plunged as the housing bubble popped."
Large SUV sales have fallen 30-40%, while luxury vehicles have fallen 13%. see http://www.bloomberg.com/apps/news?pid=20601103&sid=aXgObEkELJcw&refer=us
" historical rollover has probably slowed to a crawl"
New car sales have dropped 8.9% from last year, almost entirely due to falling pickup and SUV sales - car sales have changed very little, and the car mix has shifted from mid-size to compact (delayed by the lag in car production mix).
Cars less than 6 years old account for 50% of VMT. Turnover may slow down, but more efficient vehicles will get higher VMT, whatever their age - Dad will stop driving the SUV, and take back the Corolla from the teenager in the house.
So simple math 13% of SUV sales are related to overall fall offs.
However the 40k mark is a bit of a bummer a lot of SUV's come in right below that.
Found this.
http://www.theautochannel.com/news/2008/05/05/086070.html
http://www.iht.com/articles/2008/05/27/business/auto.php
And of course you have the simple issue that cheaper cars are often smaller and more fuel efficient.
If people can no longer get loans for the luxury models just moving down to cheaper cars will
result in increase in fuel efficiency.
In any case its wrong to target gas prices esp since the recent runnup is new.
Its a factor and probably at least 50% of the current situation but certainly the housing bust
and related tightening credit for auto's is playing a large role. They all have significant
weight. And finally the purchase of a home for a family is probably more closely tied to SUV
purchases than luxury car purchases. So the coupling if you will is probably higher.
The BMW etc or luxury sports car market is probably more coupled with the HELOC loan market which is just now taking a serious dive with HELOC's being cancelled. I think you will see luxury brands begin to fall off and approach the same drops as we
are seeing now for SUV's but with a bit of time delay.
My best guess is that right now we are probably seeing all factors contributing about equally.
This would be car loan problems, Housing bust, Gas prices.
Gasoline prices will become increasingly important however as gas climbs over 5 dollars and at the same time large cars/SUV's bought during the housing boom are dumped on the used market and low new sales ensure no more.
This article on RV sales sums it up nicely.
http://www.mcall.com/news/local/all-a1_5rvs.6427560may29,0,6244220.story
That 1st article was interesting: "In March 2008, average wholesale prices of used cars and trucks were 2.4 percent lower than in the year-ago month, ADESA Analytical Services said. Prices of luxury cars dropped 2.5 percent, and prices of luxury SUVs fell 9.3 percent."
So, used luxury cars are off at the same rate as overall used vehicles, and luxury SUV's are at a much greater discount. Given that SUV's are half the market (and we can assume that lower priced SUV's have also fallen disproportionately quickly), it looks like SUV prices have fallen, and the rest have stayed the same or actually risen. Which is what we'd expect from the new vehicle numbers, where cars have stayed level (with compacts and subcompacts taking market share from mid-size), and light trucks (pickups and SUV's) have crashed.
However I'd suggest if you plot the trend i.e this article for example
http://www.marketwatch.com/News/Story/Story.aspx?guid=%7BCC4F9C40-693D-4...
You will find that SUV sales closely followed housing even though high gasoline prices have been blamed.
2005 was on average the peak for the housing market and SUV sales started declining around the peak.
But not directly as we see but understand liar loans where still prevalent well into 2007.
http://www.sfgate.com/cgi-bin/article.cgi?f=/c/a/2007/05/20/MNG2NPU9FD1.DTL
I can't find the data you would need to figure it out.
Its basically SUV sales prices for new used vs housing prices by area vs gasoline prices.
If you find the data I suspect you will find its more closely coupled to say foreclosure data for example
then high gasoline prices. However because of high gasoline prices we can expect the large SUV market to not recover and the used market to be even more depressed with the combination of dumping of these SUV's and high prices.
http://www.amazon.com/gp/blog/A28DJWXSMYDZNT
The nominal increase in gasoline is probably not the cause its a large secondary effect.
See this.
http://www.topix.com/content/trb/2008/05/luxury-suv-owners-feeling-the-p...
This is a symptom of the mortgage market meltdown and being broke not high gasoline prices.
In fact to be delinquent in Q4 of 07 one would assume people stopped payments earlier.
Note that this is not correlated with a major jump in gasoline costs.
Well, could be.
OTOH, luxury SUV's have fallen in both sales and prices, while other luxury vehicle sales and prices have stayed stable.
Overall car sales are stable, while large SUV sales have crashed.
I'm sure housing declines and overall economic conditions are important, but people are buying cars, and not SUV's - the only straightforward explanation is gas prices.
But maybe not correct.
Well my opinion is that people could not afford the SUV's in the first place much less the gasoline for them.
Certainly gasoline prices are playing a role but the real truth is people simply could not afford the premium they where paying for these more luxurious cars in the first place. And here I'm talking about the car payments not the running costs.
The thesis is that the overall car market is shrinking and SUV purchases are shrinking but where more closely tied to the Housing bubble than gasoline prices on the growth side. Gasoline is for sure influencing decisions to walk away from both the SUV and the house and ensuring that SUV sales will not recover.
However whats important is that the assertion that current prices are causing significant demand destruction.
I'd say that the majority of the recent changes have more to do with Americans finally purchasing cars they can afford and of course taking into account gasoline costs. However this does not mean people are not able to absorb much higher gasoline costs in the future and once the housing bubble SUV craze is behind us I think you will find the remaining demand quite sticky even as gasoline prices increase.
Again the only reason the more complex explanation is important is because the gains in efficiency from the collapsing housing bubble and ending the SUV craze are becoming quite small. Housing starts are at or below historical lows SUV purchases are getting down towards levels that are closer to baseline purchases from customers that are insensitive to gasoline prices i.e wealthier individuals etc.
We can go farther back to see the beginnings of the SUV craze.
http://www.edmunds.com/insideline/do/Drives/Comparos/articleId=43904
http://www.washedashore.com/rants/DGOVs/dgovs.html
Overall we are returning to the distribution of cars types sold before this happened.
The end of the housing bubble and high gasoline prices have both contributed to killing
off this snobbery but don't confuse this with real conservation.
And the farther you go back in time the better to correlation between rising home prices and SUV's.
Time will tell of course but if I'm right future demand in the US will remain robust well past 4 dollars a gallon.
Look at this maybe its clearer.
Miles traveled.
I can't find SUV/Truck sales but they came on in the late 1980 until now.
It seems closely correlated with housing sales.
Instead of gasoline prices.
Memmel: IMO your analysis is right on-even at 20000 miles per annum and 15 mpg, a $1 rise in gas prices is only $111/month so people had to have been stretched to the limit for it to hurt.
Thanks I did finally find a bit dated one with SUV figures they pretty much also follow home sales.
Its in the pdf.
http://www-cta.ornl.gov/cta/Publications/Reports/ORNL_TM_2000_147.pdf
We do know that the housing market is getting obliterated however given this analysis :)
And it makes sense that if we stop building ever further out suburbs that gasoline usage would stagnate.
Both from a drop in usage by the industry itself and simply because people are no longer moving further out.
And also I've been correlating SUV purchases with home purchases. Even a simple drive around a few apt complex's and housing subdivisions would show that large Trucks and SUV's are far more commonly owned by home owners vs apt dwellers. Trucks being something of a exception if your talking about apt dwellers working in the housing industry. But SUV's for sure.
I'm not sure you can separate out the effects to any great extent.
The fall in demand for SUV's and luxury cars will hit the economy hard, and that in turn will reduce demand and maybe help to restrain petrol prices, but OTOH more people being unemployed or not earning so much will lead to more housing repossessions, and further falls in housing prices creating more problems for the financial institutions and making them reluctant to lend.
The poor fiscal position would be difficult enough to deal with anyway, without supply shortages of oil and as it is something akin to a death spiral seems likely.
IMO demand will fall all right, as the economy is destroyed, but the fundamental shortage of oil will cause fuel prices to rise on any hint of a global upturn, this aborting any recovery.
In my view present prices are enough to cause major recession in both the US and UK, and it is that which will destroy demand as people loose their jobs and creditworthiness.
The stronger fiscal positions of other countries such as Japan and China may mean that oil prices up to perhaps $200/barrel are still sustained.
I agree in general the main point is I see little or no chance for demand destruction to result in lower prices at best it may slow the increase in prices temporarily. Regardless of if its a result of depletion or financial mismanagement. The absolute retraction of entire industries may give a locally lower or industry specific lower fuel use but this is this is barely above the noise and historically seems to have only resulted in a plateau in demand most of the time. Esp if you look at oil demand today vs population etc.
Sorry one more link from 2004.
http://money.cnn.com/2004/05/17/pf/autos/suvs_gas/
We know after the fact that in 2004 the housing bubble was starting to get close to its top in many areas in 2005. So the 2004 sales slowdown is better correlated with housing than gasoline prices which eventually rose much higher.
Sorry for the scattering of links I can't seem to find a nice database of yearly sales.
Maybe if someone could say get housing data/ suv data etc for various areas we could discern the truth.
Oil prices have lost about $7 in the last week, about 5%. What effect will this have on gas prices, if any, or do current gasoline prices (in the Pacific NW about $4 a gallon, regular) have a way to go to catch up with $126 a barrel oil (current Brent)?
I suspect the recent sharp run up is not yet in the price of gasoline - and so the even more recent 5% correction won't be either.
Oil prices cannot continue to rise exponentially - and we have clearly reached a pain threshold for the OECD.
Next round is public sector workers seeking pay rises IMO. And you know where that leads.
Let's hear it from the economists:
Understanding Crude Oil Prices, James D Hamilton (May 22nd, 2008)
Some of you might enjoy this.

It will require you to install the Blink3D plugin for your browser (Vista / XP SP2 only )
http://www.louiscolan.co.uk/ClockOil1/OilClock1.htm
Here at Forthcoming UK Energy Deficit (FCUKED) we have been saying since 2002 that there are two Peak Oil Points
POP 1 - Peak Oil (Global)
POP 2 - which precedes the above which is that moment when folks realise that POP 1 is going to happen.
We have all reached POP 2
If Gormless Gordon gives you a call, tell him.
pure speculation i think, but speculators are about to lose all of their money, due to rising of instability in several countries due to oil prices, i think soon oil price will fall to about 70 dollars