Oilwatch Monthly - April 2008
Posted by Rembrandt on April 21, 2008 - 10:00am in The Oil Drum: Europe
The April 2008 edition of Oilwatch Monthly can be downloaded at this weblink (PDF, 1.65 MB, 21 pp).

A summary and latest graphics below the fold.
Latest Developments:
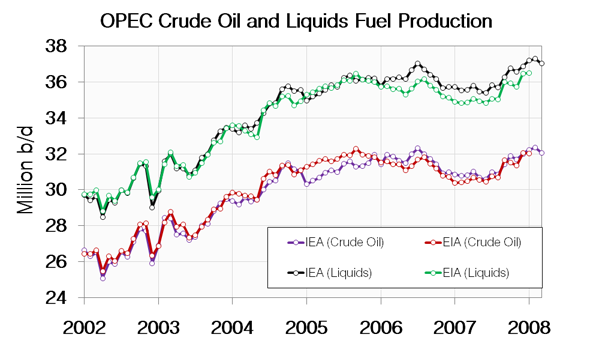
1) Total liquids In March world production of total liquids decreased by 100,000 barrels per day from February according to the latest figures of the International Energy Agency (IEA). Resulting in total world liquids production of 87.34 million b/d. Average global production in 2007 was 85.41 million b/d according to the IEA. In the first three months of 2008 an average of 87.34 million b/d was produced. The EIA in their International Petroleum Monthly puts the average global 2007 production at 84.60 million b/d and January 2008 production at 85.80 million b/d.
2) Conventional crude - Latest available figures from the Energy Information Administration (EIA) show that crude oil production including lease condensates increased by 194,000 b/d from December 2007 to January 2008. Total production in January broke a new all time high production record at 74.47 million b/d, 168,000 b/d higher than the previous all time high crude oil production of 74.30 million b/d reached in May 2005.
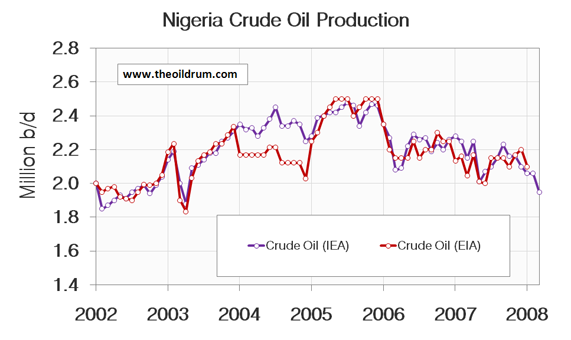
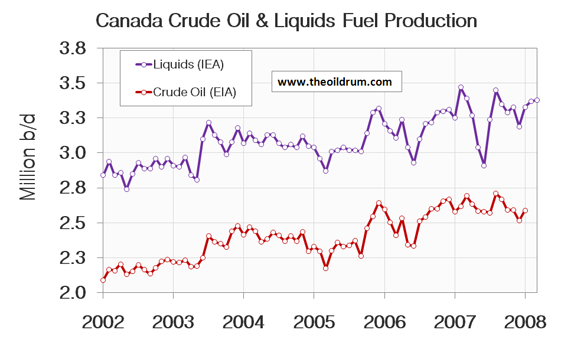
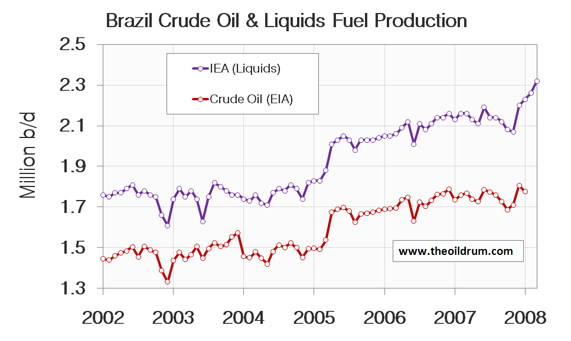
A selection of charts from this edition:


Personnel
Editors
Contributors
Peak Oil Primers
Archives
- November 2010 (3)
- October 2010 (6)
- September 2010 (4)
- August 2010 (7)
- July 2010 (6)
- June 2010 (7)
- May 2010 (2)
- April 2010 (8)
- March 2010 (4)
- February 2010 (6)
- January 2010 (3)
- December 2009 (5)
- November 2009 (8)
- October 2009 (12)
- September 2009 (6)
- August 2009 (5)
- July 2009 (11)
- June 2009 (8)
- May 2009 (16)
- April 2009 (10)
- March 2009 (7)
- February 2009 (10)
- January 2009 (15)
- December 2008 (9)
- November 2008 (9)
- October 2008 (9)
- September 2008 (13)
- August 2008 (10)
- July 2008 (14)
- June 2008 (23)
- May 2008 (16)
- April 2008 (12)
- March 2008 (16)
- February 2008 (9)
- January 2008 (13)
- December 2007 (13)
- November 2007 (16)
- October 2007 (22)
- September 2007 (8)
- August 2007 (9)
- July 2007 (16)
- June 2007 (8)
- May 2007 (7)
- April 2007 (7)
- March 2007 (10)
- February 2007 (10)
- January 2007 (12)
- December 2006 (9)
- November 2006 (15)
- October 2006 (4)
- September 2006 (5)
- August 2006 (5)
- July 2006 (9)
- June 2006 (5)
- May 2006 (10)
- April 2006 (9)
- March 2006 (13)
Vital Trivia
License

This work is licensed under a Creative Commons Attribution-Share Alike 3.0 United States License.
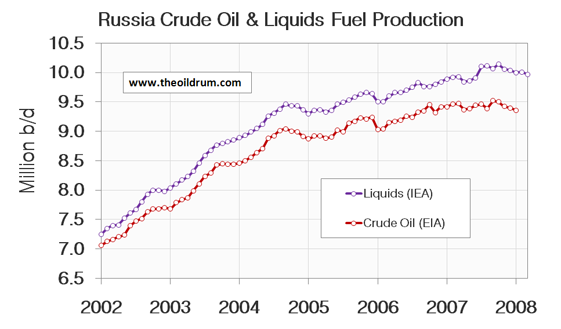
My gut feel is that Russia is the key chart in that bunch. Particularly if we see a 'Mexican wave' in 2008 Russian production.
Agreed. The Russian data always looks more rigorous than some other countries too, a high level of agreement between IEA and EIA and little monthly variance. The last nine months is starting to become a significant trend
Who'll be the first to use the new all time high production record at 74.47 million b/d as "proof" to debunk Peak Oil?
If I recall from comments for the last report, C+C was including Tar Sands. If that was/is the case, nobody with a brain would be saying that because minus Tar Sands, the peak is still May 2005.
Tar sands are to oil what peanuts are to peanut butter, no? The two are not, and never will be, equal. Include Tar Sands in all liquids with my blessings, but to do so with crude is bull.
Cheers
Since Economic Growth is Energy Growth times Energy Efficiency Growth, May 2005 is still the end of Economic Growth.
The economy has momentum. Without increasing energy or increasing efficiency that momentum is decaying. This momentum decay is visible in home foreclosures:

Most succintly put. Where is this originally posted?
And why aren't more of us promoting this PO attribute?
Carl
Who'll be the first to use the new all time high production record at 74.47 million b/d as "proof" to debunk Peak Oil?
This is why the peak oil crowd should stop jumping up and down everytime there is a slight decline in oil production from one month to the next.
It's also why pump-and-dump ethanol stock shysters should shut up and go away.
K100-
Go back to reading Ayn Rand, and no masturbating.
I haven't checked in here in some time--is this was TOD:E has turned into?
Of course the peak oil camp (which definitely includes me) shouldn't trumpet every month with a lack of a new high as proof of anything, just as the deniers shouldn't make a big deal out of the numbers quoted above. Doing so is equivalent to the incessant claims of the global warming deniers that there's nothing to GW because it happens to be cooler than normal outside their window on a given day.
Everyone involved in these conversations needs to keep in mind which battles are worth fighting, and which ones are just a silly waste of time. Getting more people to pay attention to peak oil is a very worthwhile cause, but petty nastiness and getting hyped up over one month's numbers (not that hightrekker did the latter) do nothing to achieve that goal.
Lou-
Point well taken--
Civility and tolerance will attract more readers and possibly lead to increased knowledge on this very critical subject.
I will refrain from kneejerk responses-
best
hightrekker
Yes, thank you, a voice of rationality. I thought K100 had a good point.
You need to review Keithster100's posting history, coupled with his famed pumping of particular ethanol stocks, right here on TOD, which he shortly thereafter dumped as soon as other buyers were propping his price up to where he wanted to sell. And note that those stocks subsequently fell. Long time posters here are aware of what he is while newer posters may not know.
As for what debunkers will say, they already said it in the prior thread that announced this new "high" where it was also discussed that these agencies are now rolling in tar sands to C&C production numbers. That is obviously NOT C&C so it distorts the picture. Remove tar sands and the C&C number is down almost a million barrels from May 2005.
Um no, can't really agree with you.
1. Whoever this guy is, his history doesn't necessarily invalidate his remark. As I mentioned in another post somewhere, just because big business thinks it is going to make a fast buck out of global warming mitigation, doesn't mean global warming is suddenly invalidated.
2. Last I heard, there is no law against writing a load of baloney, promoting yourself or your interests, or anything like that on the internet. If anyone bought ethanol stocks and lost money, it really is their own darned fault. All the information is available. The scientific papers have been written and published. If someone can't put that information together and figure out that corn ethanol is a big scam, that's their problem, I have no sympathy for them whatsoever.
Agreed - Russia the smoking gun.
This is great work Rembrandt - did any stinking rich hedge fund ever buy you a new lap top yet?
Euan, have you contacted a Norwegian Real Estate agent as you promised during our last lunch at ASPO-Houston ?
Best Hopes for Norwegian farmland,
Alan
Not yet - but my wife has been offered an adjunct professors position in Norway which is a good starting point.
This is the GBP - NOK exchange rate:
http://uk.finance.yahoo.com/currency/convert?from=GBP&to=NOK&amt=1&t=5y
As I've said many times, the GBP and USD are in fierce competition for basket case currency of the decade.
Euan
Euan,
What was that question you asked me during the Q&A at ASPO-USA?
I can't recall Jeffrey - did it have something to do with Exports?
What evidence do you have for imminent declines in oil production from Russia and the UAE?
Our (Khebab/Brown) middle case is that Russia will be approaching zero net oil exports in about 16 years (initial estimated 10 year decline rate shown):
The other problem for Europe, at least in terms of proximity to exporters, is to the west. Our middle case shows Norway approaching zero net oil exports in the same time frame as Russia:
Of course, here in the states, I expect Mexico, the #3 source of imported crude for the US, to be approaching zero net oil exports within 6 years.
It was a good question then Jeffery - what was the answer?
I may be redundant, but I am consistent--HL my friend, HL--and I first stated my HL based concerns about the top three net oil exports in January, 2006. At present, all three of them--Saudi Arabia; Russia and Norway--are showing annual and/or monthly declines in oil production. Of course, Norway is not really in dispute, but the other two were, and are.
My position is that the HL estimates should be assumed to be approximately correct, until proven otherwise.
And how's the UAE doing?
If memory serves, actually pretty much flat for 2007, but we shall see what happens in 2008. Total net exports from the top five dropped by 800,000 bpd in 2006 (EIA). I estimate that they dropped by about one mbpd in 2007, which as the model predicted, is an accelerating decline rate.
Regarding Russia, there was a lot of "smoke" in 2007--crude production had been flat between 9.4 and 9.5 mbpd since 10/06 and there were several reports of rising water cuts.
Hi Jeffrey.
I'm curious, how come you don't make more use of charts 19-24 of Rembrandt's report? There is a lot of noise in the "total liquids" because (I presume)of biofuels. But exports are in a nosedive and would seem to prove that your Export Land Model is not only correct, but is having a decisive effect: especially since the US sucks up half of all imports.
yours, jim
Nope still using the same one. I ordered a stinking fast new computer though but that will still take a few weeks to arrive.
I love this report. Could you add one more graph for Exports? I have seen such a graph once. It provided a clear view that producing country use of oil is exceeding any small gain in production.
From: http://netoilexports.blogspot.com/
(prices rounded)
@BillJames
There are several graphs for exports in the Oilwatch Monthly itself. What additional graphs are you hinting at?
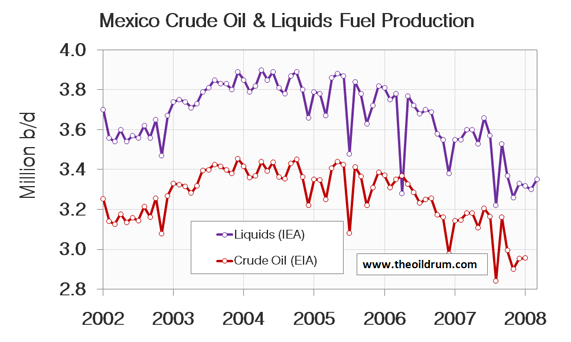
Someone please explain how in April 2006 Mexico's liquids are less the crude???
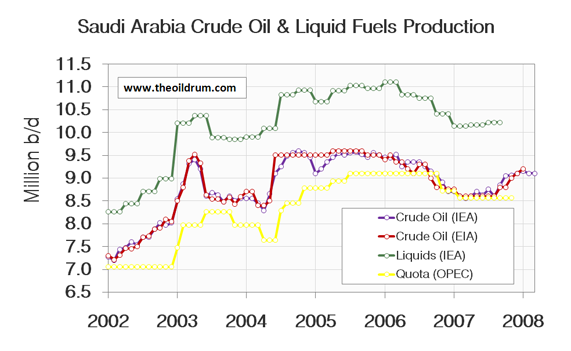
Interesting to note that Saudi Arabia is flat. In recent weeks they have said that they will increase production 20% and then a day or three ago they said they will not increase production because demand will drop and alternatives will kick in. It looks like KSA can't get it up and won't admit it. But everyone can see that it is flaccid.
Different reporting agencies used different data sets. The crude number was from EIA, liquids from IEA.
Mexico's liquids less than the crude? That doesn't show in the graph were liquids are more then the crude so I wonder where you get this idea from?
Rembrandt
How can I view the right side of the graphs? They cut off about 2006 in my browser. Changing text size does not help.
depending on which computer I use, laptop, PC or at work I have this problem and have desired a soltuion for quite a while. Usually I just click on the charts and save them then open them up on my pc but this is unsatisfactory.
Right click on the graphs and "open image in new window".
"open image in new window is greyed out" but thanks.
Thats exactly what I do, Gail, as sometimes the image must be squeezed to fit available space, or just gets cropped.
I use K-Meleon ( aka "Firefox Lite" ).
Its "standard operating procedure" for me to open up interesting charts in a new window so I can expand them for clarity and zoom in on interesting portions.
I thank the editors of The Oil Drum for making this site so "clean" and free of proprietary protocols. Those of us on dialup and those of us not using the latest version of proprietary software are extremely appreciative to find a site of this quality that does not require use of it.
I have yet to have anything from this site foul up on my end, albeit it is quite common for me to get hung up on commercial sites where images which will not display/save or active-X/javascript things result in hung pageloads and terribly rendered displays. I have seen too many business sites whose programming would not have earned a passing grade at our local community college's HTML class.
Download the entire PDF file to your computer and read it there. It's much more comprehensive anyway and the PDF viewer will resize the charts for the page correctly.
in IE / Opera or Firefox (Windows) : File Menu -> Print Preview
This uses the Print CSS layout file and formats the margins differently, enabling you to see the whole of the pictures (at least on this article).
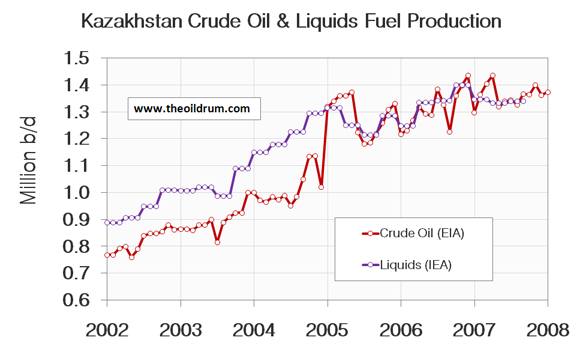
At what date does IEA all liquids cut off? From the graphs, it looks like it is different dates for different data sets. For some data, it goes through March 2008, but for some others, it seems to stop in late 2007 (Azerbaijan and Kazakhstan).
Also, you show IEA crude oil for Saudi Arabia and Nigeria. I take it that the IEA only shows crude oil for occasional countries.
IEA all liquids goes until march 2008 for all non-opec countries.
IEA crude oil goes until march 2008 for all OPEC countries.
IEA OPEC natural gas liquids + condensates is aggregated for OPEC until march 2008.
Thanks for the charts; good information as always.
I notice the recent uptick in production corresponds with higher prices. Are you aware of any specific efforts to model the effect of price on production?
In Texas in the Seventies, in response to a 1,000% increase in oil prices and the biggest drilling boom in state history, oil production fell, going from 3.5 mbpd in 1972 to 2.5 mbpd in 1982.
On our mathematical models, Saudi Arabia, the successor swing producer, in 2005 was at about the same stage of at which the prior swing producer, Texas, peaked, in 1972.
The two years of annual production declines that we have seen in Saudi Arabia (with somewhat of a recent rebound to a level below their 2005 peak) are suggestive of a final peak, but it is not yet conclusive.
However, we can say that Saudi Arabia is showing the same kind of post-peak response to higher oil prices that we saw in Texas:
Higher Oil Prices + Increased Drilling = Lower Crude Oil Production
In post-peak regions, we don't stop finding oil fields, but we can't offset the declines from the older, larger fields, at least not with conventional production.
Pepper2000,
Just to be clear, the declines from the older fields can't be offset because each well has to make a profit.
If each well only costs $100 to drill you can soon make your money back, so the wells can be very close together and the flow rates from a field can be high.
The easy oil is found first, as oil gets harder and harder to find the costs rise.
If it costs $200 million to drill a well in deep water you have to get >$200 million worth of oil out of that hole, so the holes will be far apart, and if the oil is thick and the rock is tight you may never make a profit - beware of claims that billions of barrels of oil have been discovered in deep water, they may be profitable to recover to use as energy (ie: reserves) or not (ie: resources that might be used for some other, more expensive, purpose.)
Peak oil is about diminishing, profitable, flow rates.
Also beware of one month's statistics, as you can see from the graphs as well as being 'noisy' the IEA and EIA data are normally different (at least one of them is wrong) no error bars are given and the numbers are often revised at a later date. When/if the numbers are revised nobody complains, so, in my opinion, are liable to manipulation for political reasons.
The only data we know for sure is the price we pay at the pump to fill our cars.
Xeroid I'm becoming increasingly skeptical of the current production numbers.
The reason is you can easily look at Oil tanker spot prices and they are not increasing.
They did surge back in January a bit but in my opinion this was probably primarly oil from draw down of storage in the producing countries not production. We now have the case of fairly low tanker rates and high oil prices. If the current report was a real production high and production was increasing. We would see lower oil prices and higher tanker rates.
http://lloydslist.com/ll/news/tumbling-vlcc-rates-remain-under-pressure/...
http://www.lloydslist.com/ll/news/vlcc-rates-for-asia-and-north-america-...
And if you do see rising rates we have a very nice peak oil feedback loop going on in shipping crude. So pure tanker rates are not the only thing to look at you also have to track bunker fuel prices and discount its effect.
http://www.bloomberg.com/apps/news?pid=20601116&sid=aZgMPeJE0pKI&refer=a...
http://www.bloomberg.com/apps/quote?ticker=BUNKSI38%3AIND
In my opinion high prices and fairly low tanker rates means exports are dropping. Also I don't think this is pure export land but its really tough to disambiguate export land, padded production reports, emptying storage and real production.
Bottom line whatever the underlying reason we do not seem to be seeing real increases in exports.
As several posters have mentioned Tar Sand production should be removed at least for our accounting needs and in general I don't think they have a huge effect on world oil prices.
Looking at all the data in my opinion whats happened is back in January somebody emptied some stored oil and it helped over the short term but now I simply don't believe the current production reports.
Even with export land issues if production was increasing then the effects of export land would be decreasing. I think the truth is production is decreasing and exports are decreasing even faster because of export land. Bunker fuel usage is significant and so is VLCC traffic you simply don't get VLCC rates fairly low and bunker fuel going skyward if we have the oil production thats being reported. The price signal indicates this.
Some variation on the same story that has already been reported:
http://www2.irna.ir/en/news/view/menu-234/0804219113103246.htm
Rome, April 21, Islamic Republic News Agency
Saudis Reluctant to Raise Output
And I forgot the North Sea, which peaked in 1999, at about the same stage of depletion at which the US Lower 48 peaked.
Brent crude oil prices (annual average) in 2007 were four times higher than in 1999, yet crude oil production has fallen at -4.5%/year since 1999.
1) Total liquids In March world production of total liquids decreased by 100,000 barrels per day from February according to the latest figures of the International Energy Agency (IEA). Resulting in total world liquids production of 87.34 million b/d, which is the all time maximum liquids production.
How does one decrease one's way to an all time maximum?
I was asking myself that question.. I sometimes wonder if these numbers mean anything anymore, I mean + or - 1 mbpd error? We won't know peak liquids has hit till It's gone and past for a long while I'm thinking..
Here is the rule of thumb I use. We won't know that peak oil has happened until its two standard deviations from the mean. Thats when we get down 2mbpd from peak given a deviation of +/- 1mbd
http://en.wikipedia.org/wiki/Normal_distribution
I was wondering about the same thing and have arrived at a possible solution: the monthly number decreased compared to February, and 2008 Q1 output was the highest for a quarter (3 months) ever.
That's possible. Still bad wording though.
And BTW, I do NOT trust IEA data at all. Even EIA data is questionable - but much better. (And I'm from Europe...)
It doesn't decrease to a maximum since it is an error on my side that now has been corrected.
Total production in January broke a new all time high production record at 74.47 million b/d, 168,000 b/d higher than the previous all time high crude oil production of 74.30 million b/d reached in May 2005.
It's possibly worth noting that per-capita oil production was higher in May 2005 than in January 2008. This is still higher than 1982 through 1993 (eyeballing Rembrandt's spiffy new Chart 0 in the report). All of those values are much lower than the high in 1979.
May 2005
74,300,000 b/d
6,441,086,152 people
b/year/person = 4.2104
l/day/person = 1.354
January 2008
74,470,000 b/d
6,645,439,274 people
b/year/person = 4.0903
l/day/person = 1.315
I got the population by interpolating (linearly) from the US Census world population data. There's a discrepancy between my numbers and Rembrandt's graph (his is slightly over 2 for those dates), I'm not sure why that is.
Chris
I don't know that I would separate tar sands from crude oil. I figure that if it can run a car, a truck, a tractor, or an airliner, it's oil. Synfuels, methanol, coal oil, LPG, whatever. If it pours and burns, it works for me.
Peak light crude per capita was way back in the early seventies, back when oil first started going up in price in 1971. That's when EROEI first went really negative, when the Saudis started ramping up the last cheap oil on the planet. After that it's been all downhill.
But does it matter? Methanol from stranded natural gas at 4$ a gallon is really not that different from offshore heavy sour oil that has been produced and cracked for an equivalent price.
Apparently these are the Saudi official reserves statements and estimates of recoverable:
http://nextbigfuture.com/2008/04/saudi-arabias-state-future-oil-goals.html
I don't know where Matthew Simmons gets his data from but in his last speach April 8th 2008, he still maintains the 2005 record holds.
New data was released on 11 or 12 april 2008 if I recall correctly that showed that the 2005 record was broken.
Rembrandt
Partly because the data are subject to revision, I think that it makes sense to look the cumulative shortfall between what the world would have produced at the 5/05 rate, and what we actually produced (C+C). The January EIA data showed that this shortfall narrowed, for the first time since 5/05, from about 710 mb to 706 mb.
http://www.eia.doe.gov/emeu/ipsr/t44.xls
Just getting interested myself in average figures for months and years recently I looked at the EIA all liquids number which has us stuck at at a plateau of 84.6 million barrel for 2005-2007 up till now although some months were way below and some way above. This sort of gets rid of all the statistical noise. Once we are off that plateau for a year by like 1-2 million barrels, or a couple standard deviation from average margin of error, like Memmel says, then the plateau is over and the PO argument is won, hands down. By then there iwll be blood in the streets of course so winning academic arguments will not be very satisfying. Oh well.
74.47 million barrels is not 168,000 barrels higher than 74.30 million barrels. It is 147,000 barrels higher.