| DrumBeat: December 18, 2007 | The Oil Drum | New SEC Concept Floated to Change Way E&P Companies Book Reserves |
Oilwatch Monthly - December 2007
Posted by Rembrandt on December 18, 2007 - 11:08am in The Oil Drum: Europe
The December edition of Oilwatch Monthly can be downloaded at this weblink (PDF, 1.6 MB, 21 pp).
A summary and latest graphics below the fold.
Latest Developments:
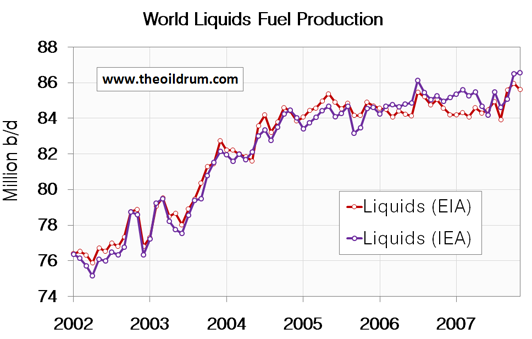
1) Plateau production - Both the International Energy Agency (IEA) and Energy Information Administration (EIA) figures show that the plateau of global liquids production that began in 2005 recently ended due to a large production increase of 1.4 million b/d in September/October. This production increase has been sustained during October/November.
2) Total liquids - In November world production of total liquids increased by 55,000 barrels per day from October according to the latest figures of the International Energy Agency (IEA). Resulting in total world liquids production of 86.55 million b/d, which is the all time maximum liquids production.
3) Conventional crude - Latest available figures from the Energy Information Administration (EIA) show that crude oil production including lease condensates increased by 891,000 b/d from August to September. Total production in September was estimated at 73.49 million b/d, which is 800,000 b/d lower than the all time high crude oil production of 74.30 million b/d reached in May 2005.
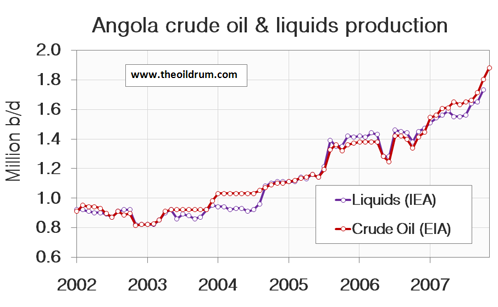
A selection of charts from this edition:


Personnel
Editors
Contributors
Peak Oil Primers
Archives
- November 2010 (3)
- October 2010 (6)
- September 2010 (4)
- August 2010 (7)
- July 2010 (6)
- June 2010 (7)
- May 2010 (2)
- April 2010 (8)
- March 2010 (4)
- February 2010 (6)
- January 2010 (3)
- December 2009 (5)
- November 2009 (8)
- October 2009 (12)
- September 2009 (6)
- August 2009 (5)
- July 2009 (11)
- June 2009 (8)
- May 2009 (16)
- April 2009 (10)
- March 2009 (7)
- February 2009 (10)
- January 2009 (15)
- December 2008 (9)
- November 2008 (9)
- October 2008 (9)
- September 2008 (13)
- August 2008 (10)
- July 2008 (14)
- June 2008 (23)
- May 2008 (16)
- April 2008 (12)
- March 2008 (16)
- February 2008 (9)
- January 2008 (13)
- December 2007 (13)
- November 2007 (16)
- October 2007 (22)
- September 2007 (8)
- August 2007 (9)
- July 2007 (16)
- June 2007 (8)
- May 2007 (7)
- April 2007 (7)
- March 2007 (10)
- February 2007 (10)
- January 2007 (12)
- December 2006 (9)
- November 2006 (15)
- October 2006 (4)
- September 2006 (5)
- August 2006 (5)
- July 2006 (9)
- June 2006 (5)
- May 2006 (10)
- April 2006 (9)
- March 2006 (13)
Vital Trivia
License

This work is licensed under a Creative Commons Attribution-Share Alike 3.0 United States License.
http://www.portfolio.com/executives/features/2007/12/14/Lukoil-Chief-Leo...
The Oil Czar
by Matthew Malone Dec 14 2007
The head of one of Russia's largest oil and gas companies discusses the futility of predicting oil prices.
So Yeltsin/Gorbi were apparatchiks of sorts, Putin was a KGB man with a university thesis on controlling the globe strategically using oil and gas, which he has pretty much accomplished as far as possible and now Medvedev is an oil man. This is a logical transition with Putin as chief advisor till Medvedev gets up to snuff.
You post makes no sense at all. Russia hardly controls the world. You can compare number of military bases outside of the country (I think Russia might have 3 or 4). On this comparison Russia probably has less then 1% of US military bases. Same with oil or gas. Russia produces relatively small piece of overall pie as far as oil (or total energy) goes, far less then majority that would be required for "controlling the globe". I would argue that again as an example US controls far more of oil resources then Russia does.
Maybe you meant to say that "evil Putin figured a way to keep Russia independent"?
True! The West likes Gorbatchev, who dismantled the USSR.
They liked Yeltsin, who ruined the economy.
But now they hate Putin, because ... because they don't like to see a strong Russia.
Putin is not perfect, but this is probably the FIRST Russian leader, after so long, that, after all, really did something positive for his country. That's why people in Russia love him.
G.W.B. and his neo-cons are simply pathetic. They want to teach Putin democracy and how to rule - Putin has 75% support in his country, while fool Bush has less than 25% in the USA.
Proof to me that Russia isn't doing "democracy" the "American" way.
Hi,
I know it is fun to bash the US, but Putin is another of a long line of Russian/Soviet thugs who kill dissidents, most recently Alexander Litvinko.
http://en.wikipedia.org/wiki/Alexander_Litvinenko
There is a good reason that the former Eastern block/Soviet countries want to join NATO. They escaped an evil empire that murdered on an inconceivable scale.
Dave
Whereas our thugs now just torture folks from other countries?
Just because Russia may be bad, doesn't mean we're much better. So we choose to be glad we're stuck in the lesser of two evils, with our version presently headed much down the path theirs was then.
I was in East Berlin in about 1982 once, only for a day so it's not like I got more than a "feel" for it. Indeed, their system seemed to produce a lot of people who hated the occupying Russian forces and were not the happiest. Not everybody in the west loved American forces stationed there either. Examples on both sides that I observed acted like smug conquerors much of the time.
The one real advantage I thought the eastern version had then was virtually no advertising, except for political propaganda and there really wasn't as much of that as there was Sony propaganda on the other side. It was the only time I ever experienced a city without a lot of billboards and branding messages.
Both systems were/are based on a form of materialism that, extended out, essentially ends up with the planet exploited, and probably dead. One might have taken a lot longer, but it's a half dozen of one, half dozen of another.
I may not have a good answer for what would work better, but I don't believe what we're doing now is particularly good or likely to be long-lived.
We're slaves to work identities. They pretended to work for the good of the state.
Medvedev as an oil man will concetrate hopefully on renewing infrastructure in the industry and investing in new developments. Putin can do the rest of the work as Prime Minister. Russian internal stability with rule of law, business development, prosperity and the stability of Russian oil and gas production is critical of peace in The West.
I thought the other day that Putin was in a quandary after his party won the elections. He was so popular that he could easily rule his whole life and change the constitution. However the moment he made that move his legitimacy, the whole basis of his popularity wouldhave been withdrawn. As long as he is seen as legitimate and democratic, playing by the rules, Mr. Clean in a sea of corrupt politicans, protecting the country, his actions will be legitimized. The moment he tries to cash out and become "Dictator for Life" his legitimacy is out the window. So he had to take a lesser job with likely almost the same power as before. His popularity and influence come from his personal integrity as much as from his office. We see what Bush has done with the title of President and this statement no longer seems completely naive.
He is probably the most competent and normal leader of Russia since Peter the Great. There have been so many idiots and weaklings and mad men along the way.
We should all stop looking at Russia all from ideological slant or in terms of our recent relationship to Russia. We need a stable partnership with a happy, prosperous country and these leaders are the best you can ever expect to get.
Putin's university thesis of leveraging oil and gas for geostrategic influence seems a logical basis for foregin policy as it is really all they have at the moment. Total global domnination in the US sense would be completely unreasonable as a goal. This has only brought the US to the verge of collapse similar to the situation the Soviet Union had by supporting East Bloc and 3rd world countries with weapons and economic subsidies whiole maintaining a huge weapons programs. Maybe we could compare the current Russian and US situation to the Byzantine and Western Roman empires. In the East they scaled back in time and concentrated on the basics and survived nicely for 1000 years more while in the West they jsut kept up appearances and tried to maintain a massive empire which guaranteed collpase. Maybe USA is like Rome forcing itself into collapse by ignoring reality while Russia will remain modest and self contained maintain stability well into the future.
75% approval rating for Putin? what figures are you thinking of?
the ones the KGB fixed, or the ones the Russian Mob fixed?
maybe the ones Gazprom took.
those perhaps?
I honestly doubt Putin has an approval rating that high, maybe 60% but 75? about as likely as finding oil under Washington DC.
Russia has a lot of nukes and oil. But not much else.
75% still is nowhere close to Saddam Hussein. He had 99% according to official poll, so Putin has a ways to go. He's on the right track though.
what kind of job is the us doing "controlling" oil in a country like say.....................iraq ? and at what cost ?
http://www.kommersant.com/p836972/hydrocarbons/
Dec. 17, 2007
Bankers See Grim Outlook for Russian Oil
ANALYSIS-Europe refiners look to Russia as N.Sea oil fades
Tue Dec 18, 2007 1:19pm GMT
By Ikuko Kao
Our middle case shows both Norway and Russia approaching zero net oil exports by 2024. I have acknowledged that the Russian outlook may be too pessimistic because of frontier basins, but my WAG is that the new basins are to Russia as Alaska was to the US--very helpful, but it doesn't fundamentally change the long term picture.
Gotta love a billionaire who's angling for more government support. If only we were all so needy.
The story from western media outlets is that there is not enough investment in oil field development in Russia and other countries were western corporations don't rule the oil industry. Fedun is just repeating the propaganda. Investment will not create oil that is not there.
Rembrandt - this is truly amazing work. I'm glad your old second hand lap top is still struggling on and wonder what all these free loading multi-billion $ corporations will do when it eventually croaks?
My feeling is that we are still on an undulating slowly rising plateau. Stuart's moving averages were trending down, and I suspect that they will now start to trend up. I think we'll see this ragged plateau rising to about 90 mmbpd by 15 nov 2011. At that point every sinew of the oil industry will be strained and tired and the system will break and begin its relentless decline.
A few notable points;
UAE - I've heard rumors they have production shut down for offshore maintenance. Can anyone elaborate? Most of UAE production is onshore. Amongst all ME OPEC states I think UAE likely has the most suspect reserves - and so wonder to what extent they've pushed some reservoirs over the brink?
Kuwait - seems to have had another rush of blood to the head.
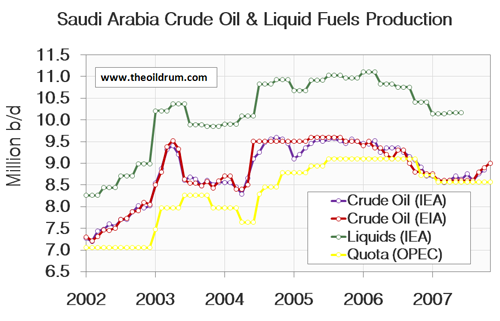
Saudi - is ticking up again - I wonder if they are now marketing more sour heavy crude - with ongoing upgrading of global refining capacity?
LNG and NGL - there seem to be a number of countries ticking up with NGL's
Azerbaijan - wtf is going on there?
UK and Norway - both up, coming out of summer maintenance.
I'd tend to see this as multiple cycles in different parts of the industry that have just come into phase to produce this spikelet. If demand falters and prices weaken then you'll see KSA and Kuwait cutting back post haste.
As for 2008. My feeling there, is that we most likely have delayed projects always rolling up into the front year. And so anticipate about 5 mmbpd new capacity in 2008 - enough for average production to rise to about 86 mmbpd. And a year from now we'll be looking at 8 mmbpd new capacity in 09. I think I may spend some time scrutinising the 08 mega projects.
ACE work
Euan,
Re UAE shutting down production for maintenance. See:
UAE forced to slash oil output by a quarter (Arabian Business, Sun 23 Sep)
http://www.arabianbusiness.com/index.php?option=com_content&view=article...
Article: Scheduled maintenance at three of the UAE's largest oilfields will cut oil output by 600,000 barrels per day (bpd) in November, the Abu Dhabi National Oil Company (Adnoc) said in a statement on Sunday.
Adnoc's statement confirmed work widely expected by the industry and reported by Reuters in August. At its peak, the maintenance would cut 810,000 bpd of output from the world's sixth-largest oil exporter, oil traders said last month.
The output reduction as detailed by Adnoc was about a quarter of the UAE's output. The Opec member produced about 2.56 million bpd in August, according to a Reuters survey.
Adnoc will also do work at the 415,000 bpd Ruwais refinery from December 22 to February 25, cutting crude processing by a total of 5 million barrels during the maintenance period, Adnoc said.
... ADNOC gave no details on the length of the oilfield maintenance. Industry sources said last month the work would last for two to three weeks and start in late October.
The state oil firm also gave no details on the units to undergo work at Ruwais, the UAE's largest refinery. An industry source in August said Adnoc's refining arm Takreer would undertake work on a crude distillation unit and a diesel-making hydrocracking unit, shutting in around 150,000 bpd.
Thanks Doug. It strikes me as being a bit odd. In the North Sea, production drops every year for maintenance. There is nothing like this before in the 2002 - 2007 record of UAE. I would have thought a rolling maintenance program would be more likely. Using the same crew, moving from one field to the next, all the while trying to maximise production. This is one to watch.
It's a pure WAG, but I wonder if they are having problems with saltwater/bacterial corrosion (as at Prudhoe Bay) and/or they are having to dramatically increase their ability to handle (and reinject) produced saltwater.
Same idea I had water handling would be a reason to have to shutdown most of the production. I'd guess it has to be something critical thats being upgraded.
My feeling is water handling facilities too. If this is off shore then it is basically water clean up and tip it over the side - but if they're producing more water - then they also need to inject more - and that's major engineering in the offshore environment.
I second this sentiment, and add: any hedge fund out there that has profited from analysis from this site, please send Rembrandt a new laptop. Email editors box for address. No other renumeration required...;)
For real!
"Why is it that the greatest danger to mankind is only addressed by people who are doing it on their spare time, and can’t get any funding for it from the government, industry, investors, or anybody else? They have to do it on their own time and with their own money!" -- Charlie Hall, ASPO Houston 10/17/07
I have long contended that this situation is a travesty, and that the investing community should step up and fund the work of ASPO and TOD and other deserving analysts. It's enlightened self-interest, if nothing more. Any interested parties please write me privately. I have ideas about how to do it...
Beautiful, and highly useful work, Rembrandt. Thank you! I will stash these charts away for future reference.
--Chris Nelder
Energy Analyst, journalist getreallist.com
Given that the Kuwaitis are supposed to be producing at a "sustainable" level these days -- i.e. that they have been apparently limiting their production voluntarily to conserve for the future -- the sudden up-tick in recent months is quite striking.
I suspect they got their arms twisted at OPEC, to produce a temporary surge.
I suspect that the OPEC "surge" strategy was calculated to prevent the world economy from stalling on high oil prices, given that they expect an increase in production from new projects in 2008. It looks to me that it was a smart move, in terms of their own medium-term interests.
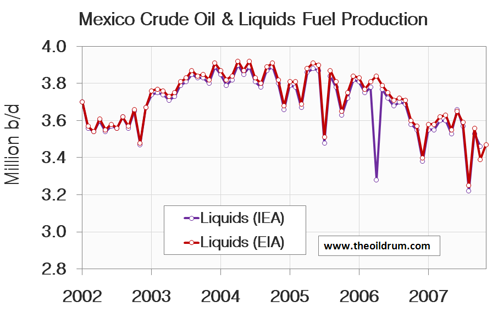
What about the Mexican production? The graph that is displayed differs from the one shown in the pdf-file.
Additionally I wonder: total liquids and crude oil are equal or at least almost 100% correlated. Just one drop in total liquids is not mirrored in the crude oil production. Can anyone explain this to me?
The graph displayed shows the EIA STEO figures, the one in the pdf the EIA IPM figures.
Sorry for any confusion, I was playing around with these two datasets a bit.
EIA crude oil production still shows a slightly declining trend. Around 500 kb/d of the September increase came from the North Sea and Mexico, both areas we know are in terminal decline. This will not last long.
Yes, we'll have to work out what the statistical definition is of a spike compared to a peak.
Although the MegaProjects database is and will be a fantastic asset we still are not certain what the numbers mean since we don't have reliable forecasts for preceding years. I suspect that past years also looked similarly rosy from forecasted data and reality turned out less. Its a resource that will be invaluable going forward but we are not quite sure what it really means yet.
Next you can be fairly certain that extensive infield drilling has contributed a lot to stemming declines over the last several years we have no accurate accounting of how much redevelopment and accelerated development is left in existing fields. I happen to think that has been a critical factor in maintaining our current production levels. And would not be surprised to see this winding down in 2008.
So my best guess is that in 2008 we will see a slowing in infield development resulting in increased decline rates coupled with more fields in decline so we should see a increase in the underlying decline rate. If things go well and the large increases in production are real and not just a result of better accounting then we could well make it through 2008 flat or with slightly increased production.
Regardless by the end of 2008 we will hopefully have enough data both ways to really understand whats happening world wide with existing production and also how successful we are at bring on new production.
On the financial side this long period of high prices should have been enough to ensure that market forces are robust enough that if significant new production can be brought online and decline rates are low then we should begin increasing production again by the end of the year.
So overall assuming the world economy does not degrade dramatically we should be able to have a very good understanding of where world oil production will be like by the end of 2008.
My opinion is of course that we will see both accelerated declines and that the projected new production actually comes in less probably 30-50% less than we have currently projected so we will if we have peaked I think end the year in a situation where its practically impossible to overcome decline.
The key factor continues to be what the world decline rate is. It seems that at a technical level we probably cannot bring on more than about 10mpd of new oil production online from new fields and infield drilling in any given year and I don't expect this to change much often it seems that the real result is less but never from what I can tell does it seem to be a lot more at least since 2000 or so. One reason I'm suspicious we will get the 7mbpd of new production plus infield drilling which would put us well over any thing we have done in the past. We might have done this in 2003-2004 but I think spare capacity played a big role in that jump of about 4mbpd in total production.
For my part, I think it's telling that conventional crude is still struggling to return to 2005 levels and that most of the gains seem to be coming from oil equivalent liquids.
The rush at this point appears to be to bring everything possible to market no matter what the cost as 85 - 95 dollar a barrel oil supports almost all products -- conventional and non-conventional alike.
Seems to me that everyone is doing their best to launch off the plateau and are, as noted in the comment above, 'straining with every sinew.'
So it looks like we're off to the races. I think that each month from this point forward will provide more information. Back of the napkin possibilities:
1. We may well see a demand destruction based recession in 08 and, if supplies maintain, a partial relaxing in price. Demand destruction will do some pretty unsettling things to the world economy, though and options for growth are severely limited by the plateau if it continues.
2. Somehow the bubble continues to expand in 08 and demand and economic growth extend along with it. In the short run this will look prettier but the long tail will whip back far more painfully if oil supply do not substantially expand.
3. Supply manages to claw its way forward at a tortured pace putting world economic growth on shaky legs running more slowly forward.
4. Supply bells out and goes down again as depletion rates bite into the markets and new projects fail to keep up. The predicted recession deepens, inflation kicks in worldwide, oil prices remain high despite demand destruction and stagflation sets in.
5. A rush to efficiency and alternative energy sources in this first 'realized peak oil year' begins. Some added efficiencies and conservations help make up for some of the negative pressures of high oil prices and limited supply. But gains will be long term and ablated by any realized reductions in world oil supply.
6. Regardless of these and other possible scenarios it seems the great race to stand still has begun...
Yes but does it not really come down to what the real base depletion rate/production decline rate is without new production and in field drilling ?
As you mention we really have thrown a lot of resources at oil production over the last few years and the net result is we have at best managed to stand still.
With simple calculations its reasonable to guess that depletion rates of 10-20% and base production decline rates of 8-10% are not unreasonable.
This means about 8-9 mbpd of new/infield drilling each year is needed to stand still on production and say 10 or more mpbd of new production to make up for the high depletion rates. We seem to be depleting faster than production rate is declining. So if this is even reasonable we may be getting to the point that we need close to 20mbpd of new production from all sources each year just to stay close to where we are now.
The point is production rate can stay fairly constant from the time a field is brought up to max production until the field is close to about 80%+ depleted.
It stands to reason that we should be able to keep production rates high and even increasing well past 50% URR with enough investment given our current technology. This is a variant of your 2-3.
So your 2 and 3 are pretty much the current consensus but its not clear yet to me at least that they are the most probable.
Thank you for posting this. The slight uptick in liquids is interesting. Hello Red Queen, welcome to our world.
If technology is really the main driver now then we can expect a "undulating plateau" followed by a steep drop off. If its not and we are around 50% URR then given our current technical expertise we can expect production to continue to increase or at least hold steady till past 80% URR. I do not agree with peak production and 50% URR being equal given the advances in extraction. Even HL which gives inflated results if extraction rates are increasing from technology is giving peak production at 60% URR.
In many cases we can extract oil 500%-1000% faster today then we could in the 1950's-1970's. The latest MRC wells gives a flow rate 5-10 times higher than a traditional vertical well extraction methods.
The extraction rates you've quoted are scary. Wouldn't this result in short term gains in exchange for a much more severe long term crash in individual well production? Are these rates being applied to older, giant, wells like those in Saudi?
Throughout 2007, from spring to summer to fall, the same mantra has been repeated here - "the next 3 months will be telling". The idea that the next 3 or 6 months will finally reveal The Truth about peak oil has been ongoing, and yet, the months go by, and the situation has not gotten clearer. This latest uptick in production is again clouding the issue, and the arrival of a few megaprojects in 2008 seem likely to continue to cloud the issue.
I'm guessing 2008 will be a lot like 2007 - volatile prices, continuing uncertainty as to the real production capacity of OPEC and Saudi Arabia in particular, economies living on the knife edge of every pipeline explosion, every menacing word from D.C./Iran/Israel/Turkey, every hurricane and ice storm, every fed rate cut. It stinks, but it seems like all we can do is sit back and wait.
We can argue "why," but it's a virtual certainty that the current top five net oil exporters are going to show an accelerating decline rate in net exports in 2007 versus 2006. Basically, their net exports appear to be collectively dropping at about a million barrels per day per year, from about 23.6 mbpd in 2005. I'm estimating about 21.6 mbpd for 2007.
Our middle case shows them collectively approaching zero net exports in 2031 (peak to zero in 26 years). One of the oddities about net export math is that the decline is close to a linear decline, approximating a fixed volume per year, which is an accelerating annual decline rate.
Note that a drop of about one mbpd per year from the 2005 level gets one to zero around 2029.
We shall see if the pattern holds in 2008.
WT: do we have monthly oil production data spanning, say 4 years around the US lower 48 peak? Was there a limited rebound of production as the system noticed it was peaking? The same thing might happen at global level.
I'm not aware of any monthly data, but the annual data for both Texas and the overall Lower 48 show basically flat production for the first two years after the peak. For example, rounding off to the nearest 0.1 mbpd, Texas was as follows:
1972: 3.5 mbpd
1973: 3.4
1974: 3.4
The long term Texas net decline rate has been about -4%/year. This is net after very intense drilling, secondary and tertiary recovery techniques, advanced seismic, etc. We can make money finding and producing smaller fields, but we can't bring production back to the peak level.
Monthly would be interesting. I've thought about doing HL plots on monthly data.
KSA's monthly production actually swings quite a bit +/- 1mbpd for example.
http://www.economagic.com/em-cgi/data.exe/doeme/paprpsa
That is until recently. Makes me think the latest numbers we get are bogus.
Well it depends on the models at some point they diverge.
Basically we have 3 models.
1.) The current situation was caused by technical problems lack of investment when oil was cheap. So its temporary and we should begin to grow.
2.) 50% URR and Peak production are equal and most models have us going in a fairly slow decline.
3.)We are pumping flat out and capable of keeping production up in most fields till they are past 80% URR. We can even see slight increases in this model but once it starts down it drops sharply.
No one but CERA claims that we can stay constant for decades. Until we diverge we don't know which model is correct. However the longer we stay close to this plateau the more I feel that a steep drop is coming. The plateau indicates to me that we are close to flat out and have been for some time thus its a matter of when we hit the wall.
If I'm right and we are depleting at between 10-20% per year then we are already on borrowed time. I think that the US and the North Sea are already in steep decline. A lot of the middle east should start about now so in 3-6 months we probably will see a surprising drop in production. But understand the model I'm using has us keeping production close to the current right up to around 90% depleted. So its really hard to figure out the exact time we should collapse.
If we are 80% depleted then its the end of 2008 early 2009.
If its 85% at the beginning of 2007 then its effectively now. We are pumping 30 or so GB a year and we have I estimate 100-150GB of oil left we can extract at a reasonably high production rate and I'm figuring we won't get much more out before we obviously start down.
This is using M K. Hubberts estimate of 1250 GB or reserves.
And we have pumped around 1100 GB or so now.
1250*.90 = 1125 before steep decline.
So given the accounting slop in global extraction over time we probably only know what we have extracted to +/- 10 GB.
I know it sounds large but the cumulative error is large over time since I'm sure its riddled with systematic errors.
Needless to say given the uncertainties if I'm right I can't see us getting through 2008 or early 2009 at the absolute latest before we go into steep decline.
Slight increase right before we go into steep decline make sense. Gas caps are blown down. Saudi start shipping it worst oil. Storage is drawn down etc etc. The strong market pressure is capable of inducing a small surge right at the end. Think of it like a airplane pulling up right before a dive or a fishing fleet going all out one last season after a horrible catch and high prices. The market will ring out most of the inefficiencies in the system right to the bitter end. The infamous doglegs in the HL models are a example of this sort of behavior. Needless to say I actually find the recent small increases disturbing.
About EIA:
Short-Term Energy Outlook
September = 85.58
International Petroleum Monthly (table 1.4)
September = 84.93
The only data that can be believed from the EIA is the IPM (table 1.4), the data from the Short-Term Energy outlook tends to be overly optimistic. I would not believe the EIA numbers from September, October, and November that Rembrant quotes because they are esentially forecasts, the total liquids EIA number for September should be 84.93 mbpd as Pollux notes above.
Good Point, Ill send an email to the EIA to find out what exactly makes up the difference.
The amazing thing is this:
EIA (Int'l Petroleum Monthly Dec 12th)
August: 72,517 mb/d
September: 73,499 mb/d
Sep/Aug increase +981 kb/d crude
IEA (Monthly OMR 13/12/07)
August: 84,560 mb/d
September: 85,020 mb/d
Sep/Aug increase +460 kb/d all liquids
Something is wrong here. How can EIA crude go up twice the IEA liquids? We need to wait until the statistics settle into something more reliable before we come to any conclusions.
For supposedly peaking this year, China making a surge in all liquids production.....
Rounding off to 0.1 mbpd, China's year to date C+C production is the same as 2006, about 3.7 mbpd.
As we discussed before, and as Matt Simmons pointed out, a fair amount of surging NGL production is probably the result of a surge of gas production from oil field gas caps (as Euan pointed out, the Brent Field for example) being blown down in the final stages of depletion of the field.
Kind of like a blow off top in stock market??
Or a light bulb burns brightest right before it goes out.
kinda like the rally often seen right before one's death.
Kind of like the Ferocious Flatulent Finale
as Matt Simmons pointed out, a fair amount of surging NGL production is probably the result of a surge of gas production from oil field gas caps (as Euan pointed out, the Brent Field for example) being blown down in the final stages of depletion of the field.
How much is the "fair amount"? You've said this many times, but haven't produced any evidence to support it, at least that I've seen. Certainly *some* NGL is due to oil field gas caps. Do you have any evidence to show that *most* NGL is due to oil field gas gaps, or that a *fraction significant enough to make a difference* is due to oil field gas caps? My impression is that the vast majority of NGL is a byproduct of gas production, which is still growing strong worldwide.
One of the most significant issues with NGL is the variation in its composition from area to area. It seems NGL captures everything from ethane (C2H6) up to hexane / heptane (C6 and C7). The 6 and 7 are liquids at Standard Temperature and Pressure (STP) and are genuine condensates. N Sea NGL contains about 30% of this liquid component, the rest being "wet gas" C2 through C5. Middle East NGL, on the other hand is dominated by ethane - C2H6 - a light gas, only liquid because it is frozen out in a processing plant.
You may be right about the surge in NGL being due to growing gas production. But a cautionary note - where is gas production growing? We hear a lot about N Africa, Qatar, Nigeria etc. Less about falling gas production in the UK and Holland and static gas production in N America and Russia. This may actually be linked to LNG plants, where the gas is cooled for liquefaction - the longer chain C2s to C5s will be a by product of this process. If you are simply piping the gas to market you may not bother to separate these fractions if the feed gas is already lean.
Its certainly the case in the UK that some of our gas is coming from late field life gas cap blow down etc - and this is about to start in Norway with a new pipeline link been built (the Tampen Link) to feed this gas cap gas into the UK via the existing FLAGS pipeline system.
I think you should look at Figure 2 when you make your comment about whether or not we are off the plateau. There is a small up-tick at the end, and at may go higher when October and November data is in, but it is not clear that crude oil production will be materially higher than in 2005. Non-crude is helpful, but it is lower-energy than crude oil.
Do you have a graph of Iraq's production? I was under the impression that part of the uptick is Iraq getting back to pre-war levels of production.
Given the increasing volumetric importance of condensates, NGLs, biofuels, etc in the total liquids numbers, it would be meaningful to include a chart that showed the output in energy equivalent terms exressed as barrels of oil.
IE if NGLs have only 70% of the btu's of a barrel of oil, 100 kbpd of NGL production should show only as 70 kbpd of oil equivalent production.
Just to ensure we are comparing apples with apples......
I think the EIA data is BOE.
It isn't. Not unless everyone reports BOE.
From memory, NGLs are about 60% as energy dense as crude, and represent ~8Mb/d of production. If they were discounted to account for energy density, that'd knock over 3Mb/d off the total, and the difference between EIA and everyone else would be enormous.
It's not that enormous, so that can't be what they're doing.
@Gail the Actuary
From a 2007 perspective your comments are correct that we need to be watching for what happens to conventional crude. But given the amount of capacity expected for 2008/2009 I think we could see some venturing off the plateau. Depending on how one defines the plateau that is.
The Graph for Iraq's production is in the PDF, on page 13 or 14 I think.
http://science.reddit.com/info/63byq/comments/
thanks for your support.
I just read the transcript of David Strahan's interview with Henry Groppe of Dec 16 for Global Public Media, and I'd be interested in the opinion of the TOD readership on his comments. He dropped a couple of whopper assertions, including:
And for our resident analysts of KSA/Ghawar who anticipate reduced production, he offers this criticism:
Much of what Groppe said is in stark contrast to what I see as the consensus opinion of the TOD analysts, and yet he's got street cred for days...so let's have it! Wot think?
--C
I think that PG, Heading Out, Gail, Euan and I all thought that Henry Groppe's presentation at ASPO-USA was a little odd. If memory serves, he thought that we were basically at peak crude oil production, with some potential for future NGL growth, but he did say that he thought that Saudi Arabia could produce at its current level for several years.
Following are some 2005 comments:
http://www.ecocitycleveland.org/transportation/pd_peak_oil.htm
Has oil production peaked?
This is part of a year-long special series in the Cleveland Plain Dealer on when the world's oil supply runs out. It appeared in the Sunday, June 19, 2005 edition and was reported by John C. Kuehner.
Groppe's only real difference of opinion is about KSA production. He's already on record saying we are on peak plateau right now and that he expects 2008 to be it then downhill. I also do not read him as indicating that KSA can grow production by any significant amount over the next few decades - just hold current levels.
So here we have Groppe saying 86 mbpd is roughly peak, that KSA is able to sustain 8.6 mbpd for the foreseeable future, and that after 2008 we're headed downhill.
TOD analysts are saying that 86 mbpd is close to peak (Stuart, Ace, and others say this is it while Robert, Euan and others argue for a slightly higher number by 2010). TOD analysts are saying they think KSA is facing terminal decline beginning anywhere from now to about 2012 down to roughly 5-6 mbpd. And TOD analysts are calling peak either now or by 2010-2012.
Now put those two sets of predictions side by side and remember that the oil era on planet earth is going to run from Drake's discovery of oil 150 years ago and out forward probably another 100-150 years in ever decreasing amounts of oil. The difference is a few years, a few mbpd of oil for a few years, and how the king of all oil fields might behave. In other words, there's not that much disagreement between them other than KSA's status and KSA's status, while very important, is still less than 10% of global production. In other words, the difference of opinion is not much more than statistical noise in the larger picture.
ChrisN,
I would not pretend to be in the same league as the TOD analysts, but I follow both TOD and Henry Groppe closely and the conclusions I come to from reading both are as follows:
1. In agreement with the expert comments on this so far, H.G.'s view on peak oil falls well within the range expressed by TOD analysts, even though on a matter of significant detail H.G.’s judgement on KSA is one of greater stability of gross output.
2. H. G. has a major additional perspective not often expressed on TOD, which is that prices at the levels already seen will likely depress demand over the next few years, to the point that very broadly speaking, supply and demand will be in balance, but that there will be a fair amount of noise in this balance, and therefore also a fair amount of noise in the oil price, in both directions.
Thus the real difference between TOD and H.G. is H.G.’s views on the (delayed) impact of prices demand, both over the last few years and then into the future.
There is not much discussion on TOD about demand, and I find H.G.'s views on this convincing. After all, is there anyone out there with a better track record of predicting future oil supply/demand balance than H.G.? H.G. seems to me to be as close to being the Warren Buffet of the oil market as one can find. Please someone correct me on this if I am wrong.!
Which is why I keep on boring TOD readers with a repetition of the point that what we have seen is a dramatic modification of demand since 2004/2005, producing a near plateau (of demand), and that it does not make any sense to me to ignore the questions this raises about future demand., or to ignore the problems this raises in trying to estimate changes in underlying production capacity.
And before my comment is misinterpreted, I will add that in my judgement, these problems of analysis, on balance of probability, are causing the rate of decline in underlying production to be underestimated.
We've entered a world where crude oil is flat-to-falling but "liquids" are flat-to-rising. Have we ever been here before?
Interesting times, indeed.
Fig 1 plus the input from IEA Outlook and World Petroleum? give us 4 values that average 85.8 for Sept for all liquids. It's still a new peak, but not by much. Memmel's argumants look good to me. I suspect we are seeing the real peak right now. Murray
Thanks !
One more factor that important. Is if we are so technically advanced at extraction why do level off at the top ? I mean if we can extract so fast why not keep growing production rate in a field. The reason is fairly simple all the other oil parts of the oil field outside of the wells are designed for a certain flow rate or capacity. Even though you could theoretically put in a lot of fancy MRC wells and get higher flow rates even as the field ages the cost of upgrading the above ground equipment is huge. So it makes sense that once you get a field at maximum production you keep it at this level. And of course as the field get older it makes even less sense to push production higher than the original design capacity.
So from a technical perspective the undulating plateau could be explained by the fact its easier to keep existing fields at the design capacity than to expand the facilities.
The fact that production is no longer strongly increasing indicates that new production is not keeping up with real declines and probably more important that infield work overs may no longer be possible in a lot of fields.
The shark fin curves result when one or more of the factors keeping the system stable changes dramatically. In my opinion the biggest change is probably that we have worked over most of our older fields and upgraded the extraction technology to close to the best possible. This means that these fields will all go into steep decline soon if that are in the 10-20% depletion rate level thats possible with current technology. New production is far less important in my opinion than the fact that modern extraction methods on old fields rapidly depletes them in exchange for maintaining production rate.
I happen to believe we are well past 80% URR thus we can expect the upgraded fields that make up the bulk of our current production to begin collapsing any day now.
In the report I noticed the sharp down turns in US production. If I'm right the North Sea and US since they represent the cutting edge of technical extraction will fall first followed by the rest of the world. I also found a cool link that the North Sea is now declining faster than most models predict.
http://peakoil.com/fortopic9390.html
Notice that WHT used a shock that went for 10%-20% depletion rate to fit the production.
http://peakoil.com/fortopic9390-0-asc-15.html
and here
http://mobjectivist.blogspot.com/2006/01/norway-offshore-depletion.html
It stands to reason that if we are running 10-20% depletion and rates and based on water cut the world is probably 80% depleted.
http://www.touchbriefings.com/pdf/2590/Ferro.pdf
We are going to see a steep drop in production rate effectively any day now and it will be fairly sudden i.e we will run close to where we are at now then potentially drop 5-10mbpd or more in a year or so.
It all depends on how fast we can replace rapidly depleting fields once we can't production will drop off quickly. The maximum replacement would be all the worlds oil production every five years. Obviously all fields are in different stages of depletion and all are not extracted at a 20% depletion rate but it gives you and idea of the type of wedge that building up as we continue to extract at high depletion rates. I estimate that we are probably going to have to replace close to 20mbd this year and next year 30mbpd. If we are at the end of in field workovers.
If we still have a lot of room to workover older fields then this wedge starts later. Given that I think its been a major factor in our ability to maintain current production rates and we have been doing it since about 2000 for sure. I think the party is close to over and we should start seeing steep drops by then end of 2008 at the latest. Obviously given my model technical attempts to surge production just make the matter worse pulling in and steeping the drop off date.
Trying to even guess at a date for this type of curve however is non-trivial but given that the North Sea and US seem to be following what I'm saying and that I consider them the leading indicators then a world wide drop can't be that far off.
Memmel,
I find your theory of fast decline due to high depletion interesting. now you are stating concrete predictions of very fast decline soon. In this business that leaves you pretty wide open to ridicule when it doesn't pan out. Best of luck on the predictions. I do not pretend to know or make predictions on the technical side. I just hope you aren't right. Fast Crash Doom is no pleasant prospect.
I hope I'm wrong. In fact to be honest I pray I'm wrong. I have three young children and its hard to consider their future under such conditions.
It boils down to if you believe the reserve addition data and further more believe that we will extract all this technical reserve growth at high production rates.
I was wondering if your projects database contains any hints about EROEI, to attempt some kind of gross vs net oil produced. This would also be useful on the ethanol contribution to total liquids.
Thanks for all the work.
SolarHouse
The EROEI for oil sands is terrible, using much natural gas that will be critical to the U.S. Canada, and Mexico soon, as imminent shortages loom.
http://64.233.169.104/search?q=cache:pp0Qc4xi6ecJ:en.wikipedia.org/wiki/...
http://www.fromthewilderness.com/free/ww3/062303_nat_gas_crisis.html
For most ethanol the EROEI is negative; Brazil's hand farmed sugar cane is an exception.
http://petroleum.berkeley.edu/papers/patzek/CRPS416-Patzek-Web.pdf
From your first link:
"According to the National Energy Board, it requires about 1200 cubic feet of natural gas to produce one barrel of bitumen from in situ projects and about 700 cubic feet for integrated projects.[12] Since a barrel of oil equivalent is about 6000 cubic feet of gas, this represents a large gain in energy."
On average, that's about 6:1. While not the best, I'm not sure that qualifies as "terrible".
When the power grid goes out due to shortages of natural gas, the 6:1 will look terrible, especially since they could use the bitumen from oil sands for heat/processing, but greed for quick profits wins out. Natural gas: heats 1/2 the homes in the U.S.; 1/5 the electric power; provides most fertilizer; and is vital for manufacturing.
The NEB only reports on the natural gas, there are other significant energy expenditures to get oil sands.
From Canada's point of view, this is a good idea. They can use the natural gas to produce oil to replace imported oil, or they can sell the natural gas to America for waste paper dollars. Don't assume that Canadians are stupid.
"To export more oil", you mean. Canada's one of the top 20 exporters.
Don't be absurd; the US$ is still the most widely-accepted currency on the planet, and has merely declined back to the relative value it had 10-15 years ago vis-a-vis its trading partners.
It'll only be in an unusual position if it keeps declining for a long period. For the moment, though, it's actually been rising (since late Nov), and it's not at all clear that another period of decline is about to start.
So you're saying tar sands are a problem because they use 4% of 25% of the local production of the resource used to create 1/5th of the US's electricity? Even though 4% of 25% of 1/5th is 0.20%?
Don't be absurd.
Or perhaps producing syncrude is a little more complex than you seem to believe. It's not as simple as waving your hand and saying "just use bitumen!"
Here we go again...
Pitt, have you ever offered what you think the outlook for tar sands really is? Or do you just endlessly harangue others who put their assessments out there for consideration? It's easy to nitpick at others' numbers, but it takes courage to state your own opinion.
I have no information about the industry that is not widely publicly available, I don't work in the industry, and you have no reason to believe I have any special insight into the situation, so why would you care what I think the outlook is?
If someone is making claims that the evidence says are nonsense, I'll point that out.
It should also take evidence.
'As Matt Simmons is fond of saying; "Data trumps all theories."' People asserting nonsensical things based on ill-considered beliefs that fly in the face of available evidence do no-one any favours. That's how false information gets said, repeated, and believed.
Hi Solarhouse,
I'm still working on the EROEI thing. I already promised to incorporate it two months ago but still didn't find the time. I hope to do some work on this in the christmas period.
Rembrandt
Rembrandt.
Thanks so much, but do take time to enjoy christmas.
SolarHouse
I am new here, but it seems to me that if production could be materially increased from these levels, the producers would do so to avert the demand-destruction that they fear as well as the development of competing resources (such as oil sands). The fact that prices have held fairly steady at these levels for several months now suggests to me that we are, at least for now, in a classic "that's all there is and there ain't no more" scenario. If "they" could take the price down a bit from here, it seems to me that they would. The charts are beginning to suggest that they, in fact, can't. A global recession would bring oil prices in, of course, but that is something else entirely...
Pilot,
As I understand it, the position is that the big threshold for oil producers, used to be to maintain the long-term expectation of oil prices below about $25/bl, as anything above that risked a long-term loss of market share. At anything above about $40 per barrel, long-term substitution investments are extremely likely. Over the last few years it has become likely that oil will stay above $40 for a long long time, so the first objective has been abandoned.
I suggest there are now three new objectives.
The first is, as you describe, to avoid demand destruction to the point of risking demand and price collapse as occurred after the Iranian revolution. The problem here is that human nature will likely cause this to be mismanaged, with the producers giving into the temptation of thinking that (seductively high) oil prices which have not immediately triggered a recession are ‘OK’. The problem with this is that most demand substitution, which is a significant element of demand destruction, impacts after a delay of a few years, and so eventual demand destruction will likely overshoot the producers hopes.
If I were an oil producer, my second new objective would be to convince the consumers (for as long as possible) that peak oil / oil crunch was never going to happen. As for all best ‘con tricks’ the best way to do this is first to convince oneself. I think that a lot of the peak oil/oil crunch denial/delay/fog is associated with this third objective.
The third new objective is in direct conflict with the first to objectives, but it is so effective in raising prices that it must be a significant temptation. This is the discovery/demonstration, for the first time in the oil era, that market perception/reality that there is little spare capacity is of itself able to significantly raise prices even if the market is adequately supplied with oil.
Whilst it may be a co-incidence, I think that the current mixed messages from the oil producers are consistent with the contradictions of theses last two objectives. So on the one hand, the producers are not doing much to allay fears of tight capacity (such as opening up their books, if indeed there is a lot of reserve capacity), and in practice this may well be coupled with deliberate actions (or lack of action) so as to maintain a real tightness in underlying production capacity. On the other hand the producers are also trying to maintain the idea that there will be no peak oil / oil crunch.
Having said all of this, I still agree with the view that the current high prices reflect the reality, that at the current time there is relatively little useable spare capacity.
George Bush 2001: "But what people need to hear, loud and clear, is that we're running out of energy in America. And it is so important for this nation to improve its infrastructure so we can not only deliver supplies, but we need to go find new supply."
http://www.whitehouse.gov/news/releases/2001/05/20010503-4.html
Yikes!
Closing irony to cap this eventful day:
Posted side-by-side at Energy Tribune:
$100 Oil: It's a New Beginning
A Hard Rain Is Gonna Fall On Oil Prices
Both named Michael, both downplaying peak oil.
Opposite conclusions.
One may come away feeling confused.
Re: the plateau of global liquids production that began in 2005 recently ended due to a large production increase of 1.4 million b/d in September/October. This production increase has been sustained during October/November
As Rembrandt notes, there is a lot of oil scheduled to come on-stream in 2008. Much of the 2007 oil was delayed until the 4th quarter and OPEC raised production. Some 2008 oil will spill over into 2009 due to the usual delays.
I expect 2008 all liquids will be sustained at a higher level than the 2005-2007/3rd quarter plateau level. I think the IEA will show 85.5-86.7 million b/d each month all next year, with the EIA a bit lower as usual.
The period 2008-2009/2nd Quarter is probably peak oil (liquids). Check back in 2010. There's not enough new production coming on-stream after 2008 to sustain any further increases.
Possible OPEC moves cloud future forecasts but do not affect the peak predicted here. Demand will continue to outstrip supply.
-- Dave
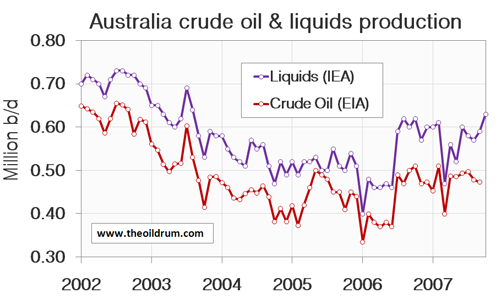
That graph of Australian production is funny. Given that the Aussie's will presumably give detailed breakdowns of their reserves and production why 2 different lines?
It's quite simply, one of the lines is all liquids the other is crude oil + condensates.
Maybe I don't know how to extract the data, but following just the EIA information shows total Oil supply which reads like all liquids from table t14.xls in May 2005 to be 85,379 and in September 2007 to be 84,929. No October data visible in "United States, Persian Gulf, Total OPEC, and World Total, Most Recent Months and Years" Total Oil Supply. So I don't know how the December Oilwatch comes up with the following:
"They (EIA) put August, September and October all liquids production at 83.93 million b/d, 85.58 million b/d and 85.96 million b/d respectively, while the IEA puts August, September and October all liquids production at 84.60 million b/d, 85.09 million b/d and 86.49 million b/d respectively."
August and September (EIA) all liquids read from t14.xls as 83,888 & 84,929
Maybe there is more updated data available than what I can find on EIA website?
So not only (according to my interpretation of EIA) has the total liquids peak of May 2005 not been breached, but the loss of crude including condensate from 74,298 may 2005 to 73,498 in September 2007 suggests a greater gross BTU loss than the data indicates.
Please show me the light gentlemen if I am wrong.