| Saudis officially happy with $100 oil | The Oil Drum: Europe | Can hybrids make a difference in the near future? |
Oilwatch Monthly - November 2007
Posted by Rembrandt on November 16, 2007 - 11:00am in The Oil Drum: Europe
The November edition of Oilwatch Monthly can be downloaded at this weblink (PDF, 1.5 MB, 21 pp). At the time of writing the latest IEA oil market report had not yet been published which has therefore not been incorporated in the PDF, but it is included in the figures and charts below.
Latest Developments (these include the IEA report which has not been published):
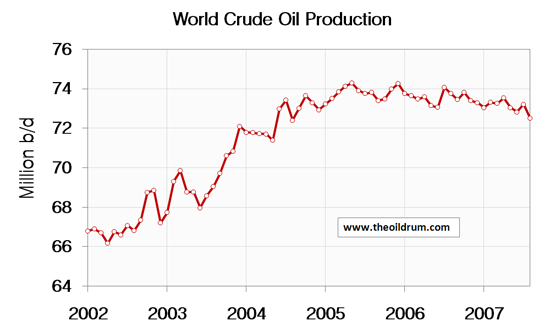
1) Crude Oil - Latest available figures from the Energy Information Administration (EIA) show that crude oil production including lease condensates decreased by 706,000 b/d from July to August. Total production in August was estimated at 72.51 million b/d, which is 1.79 million b/d lower than the all time high crude oil production of 74.30 million b/d reached in May 2005.
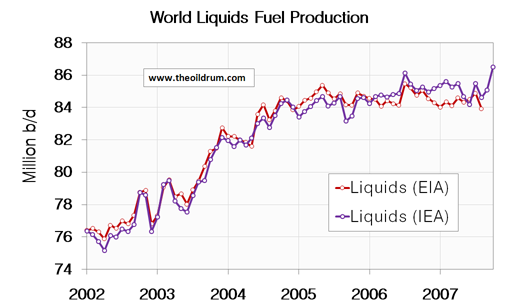
2) Total liquids - In October world production of total liquids increased by 1.4 million barrels per day from September according to the latest figures of the International Energy Agency (IEA). Resulting in total world liquids production of 86.5 million b/d, which is the all time high maximum liquids production.
A selection of charts from this edition:
Personnel
Editors
Contributors
Peak Oil Primers
Archives
- November 2010 (3)
- October 2010 (6)
- September 2010 (4)
- August 2010 (7)
- July 2010 (6)
- June 2010 (7)
- May 2010 (2)
- April 2010 (8)
- March 2010 (4)
- February 2010 (6)
- January 2010 (3)
- December 2009 (5)
- November 2009 (8)
- October 2009 (12)
- September 2009 (6)
- August 2009 (5)
- July 2009 (11)
- June 2009 (8)
- May 2009 (16)
- April 2009 (10)
- March 2009 (7)
- February 2009 (10)
- January 2009 (15)
- December 2008 (9)
- November 2008 (9)
- October 2008 (9)
- September 2008 (13)
- August 2008 (10)
- July 2008 (14)
- June 2008 (23)
- May 2008 (16)
- April 2008 (12)
- March 2008 (16)
- February 2008 (9)
- January 2008 (13)
- December 2007 (13)
- November 2007 (16)
- October 2007 (22)
- September 2007 (8)
- August 2007 (9)
- July 2007 (16)
- June 2007 (8)
- May 2007 (7)
- April 2007 (7)
- March 2007 (10)
- February 2007 (10)
- January 2007 (12)
- December 2006 (9)
- November 2006 (15)
- October 2006 (4)
- September 2006 (5)
- August 2006 (5)
- July 2006 (9)
- June 2006 (5)
- May 2006 (10)
- April 2006 (9)
- March 2006 (13)
Vital Trivia
License

This work is licensed under a Creative Commons Attribution-Share Alike 3.0 United States License.
So if Crude is going down and Liquids going up, what's making up the the increase? NGL? Or are agro-fuels starting to make a difference?
My assumption is that biofuels are making a difference but not in the way you might expect.
The production figures include crude oil, lease condensate, natural gas plant liquids, biofuels and refinery processing gains.
However at least in the USA, ethanol production is not counted until it is blended with finished gasoline. In my view, this means that during mid year driving months including October, the total liquids production (or "oil supply") includes stock drawdowns of ethanol instead of ethanol production. As ethanol production is becoming more significant in the world, the total liquids production figures will tend to be overstated during mid year.
For the USA, please see footnote 2 of
http://www.eia.doe.gov/emeu/ipsr/t14.xls
"Beginning in 1993, (total liquids - my words) includes fuel ethanol blended into finished motor gasoline and oxygenate production from merchant MTBE plants"
Further from the EIA glossary under Motor gasoline (finished)
http://www.eia.doe.gov/glossary/glossary_m.htm#motor_gas
"Volumetric data on blending components, such as oxygenates, are not counted in data on finished motor gasoline until the blending components are blended into the gasoline. Note: E85 is included only in volumetric data on finished motor gasoline production and other components of product supplied."
In other words, in the USA, according to the EIA, ethanol is only counted when it is blended not when it is produced. Hopefully, the ethanol that is imported from Brazil is not double counted.
For comparison, note that the OPEC Monthly Oil Market Report November 2007, page 31, stated that "for the month of OCtober ... world oil supply averaged 85.89 mb/d", over 0.5 mb/d lower than the IEA number of 86.5 mb/d.
http://www.opec.org/home/Monthly%20Oil%20Market%20Reports/2007/mr112007.htm
Also, if I recall correctly, the EIA also does not double count (a change made for 2007 if memory serves) in the production of biofuels. E.g., a barrel of oil used directly to produce 1.2 BOE of ethanol is no longer counted as 2.2 total BOE production. Rather, it is counted as 1.2 BOE.
I think they realized that as EtOH plants really took off and they were relying upon fossil fuels and especially liquid fuels, the numbers would be artificially inflated. Seems I recall reading that in either the notes to the IPM or the MER in late 2006.
I'm a bit dubious about the notion that it is double counting. If x barrels of biofuel use y barrels of oil, then that y barrels would show up on the demand side and x barrels on the supply side. If they're equal, there would be no overall change in supply/demand.
There is no real need to modify the figures when looking at the whole picture, otherwise you'd have to do the same for all oil resources.
In term of worldwide production you are not correct. For example, our 2nd largest supplier of oil is Mexico. Their total production is of course added to worldwide production figures and the oil is delivered here and elsewhere. It shows up as supply. The products of that oil may then be used to farm for ethanol production. The resulting ethanol then is also added in its entirety to the worldwide liquids figure. No where is it shown as a net production figure.
But the oil that went into production of the ethanol would then be extra consumption, thus cancelling out the ethanol production figure. So I still see no double counting. Am I missing something?
Consumption prior to 1 barrel of ethanol is X. Now that the ethanol is produced consumption is X+1. That's still the X that would have been consumed, plus the 1 that went into producing the ethanol. But we have 1 barrel of ethanol to add. So supply is now X+1, whilst consumption has leaped to X+1 also. No overall change from X consumption and X supply.
Net figures are not needed; it all works itself out in the supply and demand equation.
Look again. Figure 1 through October, figure 2 through August.
Yeah is it the wells blowing out their caps and the resulting NGLs in Saudi or just Canada, Angola or more biodiesel?
“Without a video the people perish”-Is. 13:24
Csn someone explain what these gas cap blow outs are?
TIA
Boris
London
Regarding Total Liquids
IMO, it's a combination of very preliminary data and a boost in NGL production because a number of gas caps in oil fields are being blown down (Matt Simmons' point).
There is a discrepancy between what the report says and what it says here above. The report on page 2 says that peak liquids was produced in July 2006. Whereas above the fold it implies that the recent month was the highest ever liquids production. Am I misunderstanding anything? Rembrandt? Westexas?
Do tell where all these NGL plants were constructed at and with such stealth as to surprise everyone in October, please.
NGLs are processed by regular refineries. Perhaps you are confused with LNG, which is liquified natural gas, a completely different topic. NGLs are a kind of very very light petroleum. I believe that Deffeyes noted that his father drove his pickup truck around on the stuff unrefined, it is that close to raw gasoline.
By the way, PartyGuy, did you note that exports are down even further, despite a new record total liquids production number?
"The greatest shortcoming of the human race is our inability to understand the exponential function." -- Dr. Albert Bartlett
Into the Grey Zone
greyzone,
there's a ;ot of NGL that are lighter than naptha, or gasoline as it is also known. It wasn't just Deffeyes father driving old fords on NGL. Inone field in Texas in the northern part of the Panhandle callled the Panhandle firld the lquids are called white gasoline and is produced on very small units with a vacuum pump because of the white gas, it gets a premium price to oil
Why do we have "stranded natural gas" if NGL is relatively easy to produce?
easy to produce (relatively) but at a cost (compression) and not necessarily easy to transport (facilities not in place to load or unload). natural gas is not easy to transport either. this is the reason for the price differential between the rockies (us) and gulf coast
If you check oil & gas company press releases you might find that some natural gas wells also produce a number of barrels of condensate per day, these natural gas wells were in gasfields (not oilfields). This natural gas was called non-associated gas. Associated gas was in solution with oil in oilfields and seperated out by GOSP's during the production process. Gas caps are the top portions of oil fields below the cap rock that contain natural gas. They also contained condensates (lighter petroleum molecules). Natural gas liquids or NGL's were stripped out of natural gas at surface facilities, these included butane and ethane. After the oil from an oilfield was pumped out, the gas caps were tapped for natural gas, condensates, and NGL's.
EIA definition of NGL's:
Natural gas liquids (NGL): Those hydrocarbons in natural gas that are separated from the gas as liquids through the process of absorption, condensation, adsorption, or other methods in gas processing or cycling plants. Generally such liquids consist of propane and heavier hydrocarbons and are commonly referred to as lease condensate, natural gasoline, and liquefied petroleum gases. Natural gas liquids include natural gas plant liquids (primarily ethane, propane, butane, and isobutane; see Natural Gas Plant Liquids) and lease condensate (primarily pentanes produced from natural gas at lease separators and field facilities; see Lease Condensate).
http://www.eia.doe.gov/glossary/glossary_n.htm
You appear to be making the same error that PartyGuy made - NGLs are not LNG. NGLs are liquid anyway. LNG is gas that has to be compressed, cooled, and liquified in order to be transported in special transports, the warmed, decompressed, and returned to naturally gaseous state in order to be used. We strand natural gas because it is costly to convert to LNG. We don't strand NGLs because they are already liquid and will come out of the well just like oil (and if you are not careful even more easily than the oil). As Bob Ebersole notes, these are very light hydrocarbons but in liquid form already. There is no work to do to capture them and transport them aside from what is already done to capture and transport the oil. Don't get confused thinking NGLs are LNG. They are not the same thing at all. What Simmons and others are saying is that as old wells go down, we are getting the benefit of the NGLs in place coming out. That has nothing to do with saving any natural gas (in gaseous form). Whether the natural gas itself gets saved is dependent on other factors. In many places in the world, even at today's prices, natural gas still gets flared off. Check Nigeria for some stunning and ugly examples.
"The greatest shortcoming of the human race is our inability to understand the exponential function." -- Dr. Albert Bartlett
Into the Grey Zone
NGLs are also produced at gas plants. x Natural Gas is basically Methane with a purity of 91% or greater. (hmm, might be 93%, been a while, a mind is a terrible thing to waste)
Propane, Butane, etc. are some of the 'impurities' separated out to get the NG clean enough to put in the system. Some decent volumes are generated.
Thank you all for your expert interpretation of the data and level headed responses to all questions posed.
Recipient of AA, Alberta Advantage
Chart 18 shows world liquids exports continue to decline, 45.8 Mb/d, from a peak of 48 Mb/d in 2006. Same trend as OPEC liquids exports from their late 2005 peak (chart 20).
Yes, charts 18 and 20 are the important ones ... Party Guy take note! You might also like to check out KSA, chart 32, and that's not their net exports ... they will be worse!
Good work as usual Rembrandt.
I have been thinking UAE wasn't at peak ... but now I'm not so sure.
A chart that interests me is #47, the UK. Here we have two peaks caused by primary and secondary production. I have a question ... does anybody know how far we can expect the production to drop before it is stopped for financial reasons (rather than geologic)... the North Sea is a very hostile place, the infrastructure won't last forever, so no chance of 'nodding donkeys' pulling out 'oily water'?
The reason I am interested in chart 47 is I think it may be an example of a 'shark fin' production profile caused by modern secondary production technology. I think 50% URR does not coincide with 1999 peak. If this is happening everywhere then this has implications post world peak.
Xeroid.
Let's keep our focus here, guys:
Too bad the last data is from July, 2007..
Cheers, Dom
If I may chime in: you got it, Dom.
"All liquids" is a scam. I hear continually, "the world consumes 85 million barrels of oil per day" and I silently scream.
X barrels of extracted oil is designated to the production of "biofuels," then the biofuels volume is counted on top of the oil volume that helped produce it.
Y barrels of oil designated to ethanol, ethanol counted on top of the oil that produced it.
Z barrels of "froth" counted along with oil: "refinery gains," orinoco sludge (WATER). "1 cup water added to 1 cup popcorn does not equal 2 cups soggy popcorn."
Countless other liquid energy costs: smile, ignore them.
You count up your pennies: $100 dollars' worth. Then you go to the bank and convert them to paper cash.
You now have $200, right?
B3: Also, the amount of oil consumed directly in the extraction of oil should be stripped out to get an actual "net" oil production figure. It appears that this oil production-consumption accounts for an increasing % of the decline in exports (guesstimate).
Amen both b3NDZ3La and Brian T. Plus the lower BTUs. It is a scam.
Could I get you to elaborate on a concept I have been thinking...
Essentially we could say that the energy content of 'a barrel of oil' is less then it was yesterday and it has been going down for decades now.
The reasons for this are many. As extraction gets more difficult, we use more oil to get less oil from the ground. The oil we get from the ground today is more energy intensive to process.
But is it really as mad as I fear - that 'barrels of oil' in crude oil production figures include volumes of other substances, sand, dirt, water etc. ?
Overall efficiency of crudeoil production should be measured by the "net energy" produced, not the volumes of 'liquids' coming up the well.
Has anyone attempted to make such an estimate?
crude oil at the point of sale is tested for bs&w, (basic sediment and water) and the volume is adjusted. oil that is guaged by hand is tested with a small centifuge which determines the bs&w (a grindout). i suppose modern lact (lease automatic custody transfer) units do this automatically.
if the bs&w is above specified limits(0.2 % imsc) the tank is rejected and has to be treated (with chemicals, heat and settlement) to lower the bs&w to pipeline limits.
and of course sometimes the guager might be too lazy to do an actual grindout in which case he or she may "boilerhouse" the numbers. actually there is a lot of boilerhousing in the oil and gas industry.
Try phrasing it as the energy "cost" of a barrel of oil. That gets understood by many people. When I tell people that 70 years ago we could get one barrel of oil for 1/100th of a barrel of oil's energy input, they understand me. And when I tell them that today we get one barrel for 1/8th of a barrel of energy input, they immediately see what is happening and ask why. Then I can explain that we have to drill deeper, and in more difficult places, like the sea floor, to get what oil we can. This leads inevitably to a discussion of why can't we just drill more wells on land, whereupon I can then discuss how extensively explored most land masses are with regards to oil.
"The greatest shortcoming of the human race is our inability to understand the exponential function." -- Dr. Albert Bartlett
Into the Grey Zone
It's not double counting; any liquids used in the production of the liquids will go on the demand side, thus increasing demand, as a result of producing the biofuels. It doesn't really matter if production rose by x, if demand also rose by x.
X is pretty small. Ethanol represents only 1% of world oil supply, and its energy efficiency ranges from ~1:1 (US) to 8:1 (Brazil). Each of those two represent 1/3 of world production, suggesting the average EROEI is about 4:1. However, much of that energy input is in the form of fertilizer - natural gas - meaning that the actual oil input is likely no more than 10% of the energy output.
So X is likely to be about 0.05Mb/d.
The same is done for the barrels of oil used to produce oil; why should other liquids be counted any differently?
Orimulsion is no longer being produced, so there's no point in complaining about it.
Refinery gains have always been counted; why stop now?
You didn't complain about by far the largest component of "other liquids", namely NGLs. That was probably wise, since NGLs compete directly with oil in markets such as ethylene feedstock (plastic manufacturing).
"All Liquids" - or "total oil supply" as the EIA calls it - is not such a bad metric. Indeed, it's the only sensible one - the substitutability between different liquids in the category means it would be folly to arbitrarily ignore some of them.
The top 16 net exporters have around 90% of 'net exports', this graph has more recent data points and a similar shape.
http://netoilexports.blogspot.com/
Xeroid.
Thanks, Dom
There are 2 reasons for the UK double peak:
(1) the smaller fields which were supposed to offset decline in the big fields were not developed early enough
(2) Alpha Piper accident required OH&S and other modifications to platforms
The decline under (1) came a little ahead of (2)
There seems to be some controversy over all-liquids vs. crude-and-condensate again here. Let me propose this. Stop looking at monthly numbers for individual reporting agencies. Average the two reporting agencies and then only look at a 12-month moving average (or some other smoothed scheme) of the resulting figure.
After that, stop debating the finer points. They are irrelevant. Think of how many hundreds of thousands of words will be rendered useless if production ever rises above 85-whatever, or 9.6, or whatever you focus on.
Forest through the trees, people.
Rembrandt does a fine job reporting what is going on. He does his job. Now pay him some respect and filter out the noise yourself.
Echelon, I have to echo you on this. There is too much noize around stray figures and minor happenings.
Rembrandt is doing A GREAT job on these monthly's.. thanks very much.
MSM is stupidly enough "every single day" trying to explain why crude is up OR down ....... when will we wake up from THAT NOIZE ??
"MSM is stupidly enough "every single day" trying to explain why crude is up OR down"
I recommend Nassim Taleb's "Fooled by Randomness" and "The Black Swan," to help one cope with this phenomenon.
Taleb specifically addresses the "Bloomberg" problem, a.k.a. the same reason is given for oil going up and going down ... in the same day.
Humans need a narrative.
"paal myrtvedt" ? What kind of name is that? Dutch? Belgian? I have no idea, none of my business. I was just wondering if Taleb's books have been published in other languages yet.
Re "paal myrtvedt" ? What kind of name is that?
It's a Norwegian name
Regards/
And1 from Denmark
Those IEA October numbers - total BS.
More confirmation today. China's own October figures out. They show production flat with September. Not the substantial gain apparently claimed. Incidentally, China has still not reached more than 30 tpd beyond the level of April 2006.
That's after the IEA invented 200 extra tbpd from China in September.
They pulled a similar stunt with Russia then. Still waiting for Russia's October figures. But you'd have to be brave to trust the IEA there too.
I agree. Remind me again where we can find the real figures. Clown. Stunts. Yeah. Stunts.
Oil CEO, keep to your medication schedule.
I found a value for october russian production (no idea of how official it is): http://www.upstreamonline.com/live/article143361.ece
Seems they are up 0.06 mbd, at 9.93 vs 9.87 in september.
Those figures are coherent with the quarterly figures of the november opec report (at the top of page 29) and are more reasonable that IEA numbers...Big IEA correction next month?
Rembrandt, is that IEA production figure of 86.5 taken from their latest OMR or just a calculation based on their summary? Last month's production figure was 85.1. If the 1.4 increase is added, one gets the 86.5 figure you quoted but that means there was no revision of last month's figure, which would be unusual (though not unprecedented). I've seen revisions up to nearly 0.3 mbpd sometimes, though I can't see revisions beyond the three months that any month stays in the tables on the OMR.
That's what the IEA
Highlights of the latest OMR
dated: 13 November 2007
says:
http://omrpublic.iea.org/
This above summary does not mention the total production as was the case in the October report.
So allow me to answer, Rembrandt calculated it by adding 1.4 mb/d to the September figure from the previous report.
Rembrandt, ahem...
Source - (actually I just tweaked their graph and stole bits of your labels etc)
Does anyone know a good clinic in London for treatment of chronic Small Country Syndrome?
:-)
--
Jaymax (cornucomer-doomopian)
ahhh. I have a $100 bet that full-year "total liquids" production will never again be higher than 2006... should have bet on crude... Looking at the IEA numbers, it looks like I've lost already... wait and see I suppose.
Consolation if I lose : $100 is not what it used to be... I get paid in euros.
Well, EIA numbers are likely to be lower - did you agree on data set before the bet? Also, we have to see the IEA revisions. You still have a chance.
Figures are revised for months or years. How are the figures confirmed for your bet? I seem to remember that December 2005 was considered the peak of crude production for a few months but May 2005 is currently the peak.
.
A quick question or two. Do all liquids include the actual energy value of the fuel? I don´t see how sweet light crude can be compared to ethanol or even Biodiesel. Biodiesel in general is about 4% less energy dense than petroleum diesel. (not a real big difference but still a difference) Ethanol is on a two carbon chain. How can it be compared to an eight carbon gasolene? Perhaps I missed the explaination somewhere. Sorry if this is redundant.
That's why my preferred definition of "oil" is crude + condensate, the stuff that oil companies buy to refine into petroleum products. However, when dealing with net exports, we are forced to use total liquids.
Why do you not include NGLs, which petrochemical companies buy instead of C+C as an ethylene feedstock?
By the way, complaining about ethanol is largely a red herring; it's about 1% of world liquids production, and 2/3 of it isn't the silly corn-based stuff the US produces. In terms of actual production of liquid, there's little indication that ethanol production and shipping takes substantially more oil as input than oil production and shipping.
Question to all: To what extent is the recent increase in biofuel production to account for the ever greater discrepancy between Total Liquids and Crude?
Notice in 2002 the difference between Total Liquids and Crude was approximately 10 Mb/d while in 2007 the Total Liquids has approximated 85 Mb/d and Crude has averaged around 73 Mb/d (12 Mb/d difference). If we are generally pumping out of the ground more less the same ratio of individual fuel components, why then the growing discrepancy. Has ethanol and biodiesel accounted for the growing gap? This brings into play a whole host of other issues if so.
"Deal with Reality, or Reality will Deal with You."