| Prepping for Peak: How Fast Can We Change? | The Oil Drum | You might have heard that CLX07 hit $86/bbl today. Oil--in the next month--will... |
Peak Minerals
Posted by Chris Vernon on October 15, 2007 - 1:00pm in The Oil Drum: Europe
-
Abstract: We examined the world production of 57 minerals reported in the database of the United States Geological Survey (USGS). Of these, we found 11 cases where production has clearly peaked and is now declining. Several more may be peaking or be close to peaking. Fitting the production curve with a logistic function we see that, in most cases, the ultimate amount extrapolated from the fitting corresponds well to the amount obtained summing the cumulative production so far and the reserves estimated by the USGS. These results are a clear indication that the Hubbert model is valid for the worldwide production of minerals and not just for regional cases. It strongly supports the concept that “Peak oil” is just one of several cases of worldwide peaking and decline of a depletable resource. Many more mineral resources may peak worldwide and start their decline in the near future.
However, there is a problem with the idea that we are close to a worldwide oil peaking: no major energy resource (oil, gas, and coal) has peaked globally so far. So, how can we know that the global case is comparable to the regional cases we know? One way to answer this question is to look at the economic and geologic mechanisms that produce peaking. The Hubbert model has been analyzed in several studies (Naill, 1972, Reynolds 1999, Bardi 2005, Holland 2007). In all these models, peaking and decline is the result of the gradual increase of the cost of production of the resource; in turn due to depletion. These costs can be seen in monetary terms, but can be measured in energy units as well. In the case of oil, this increasing cost is related to factors such as the lower success rate with oil prospecting, the necessity of exploiting smaller fields, and the higher costs of processing lower quality oil. These costs will gradually reduce profits and, therefore, reduce the willingness of operators to invest in further extraction. That will slow down the growth and, eventually, cause the peak and the successive decline. This analysis is independent on the kind of resource considered and on the global/regional conditions of extraction.
However, this interpretation is far from being accepted by everybody. Some say that many regional cases of peaking are not due to progressive depletion but to political or market factors or both (see, for instance, Engdhal, 2007 for a recent restatement of this idea). Hubbert’s model is also criticized because it doesn’t take into account prices. In the global case, it is said, increasing market prices will keep profits coming and, therefore, operators will continue investing on increasing the extraction rate; if not forever at least well beyond the midpoint. This interpretation goes back to the 1930s, (Zimmermann 1933) with the so called “functional model” of minerals extraction that had a considerable success in the later economic literature (e.g. Nordhaus 1992, Simon 1995, Adelman 2004). Recent model studies that take prices into account (Holland 2006) indicate that peaking should occur anyway, but the idea that increasing prices will invalidate the Hubbert model lingers around. Some studies, indeed, assume that oil production will never peak worldwide but, rather, reach a longlasting plateu (CERA 2006).
Theories come and go, but one thing is certain: even the most elegant theory needs to be supported by facts. If we can find historical examples of global resources that have peaked and declined following a bell shaped curve, that will strongly support the idea the Hubbert theory holds for global production. Up to last year, there was only one example of such a case reported in the literature: that of whaling in 19th century (Bardi 2006). Whales are not a mineral resource, but the whale stock behaved as a non renewable resource as whales were “extracted” (hunted) at a rate much faster than their reproductive rate. Recently, Dery and Anderson (2007) have shown that the global production of at least one mineral resource, phosphate rock, has peaked in the 1980s.
Just two cases may not be enough to prove the general validity of the Hubbert model but, here, we can report that there are many more cases of global peaking for minerals production. After an exhaustive examination of the USGS database of the world mineral production (Kelly 2006) we found at least 11 cases of minerals that show a global “bell shaped” curve with a clear peak. Peaking was evident by visual examination and it was confirmed by fitting the data using a bell shaped function. We used both gaussian and logistic derivative functions, finding very similar results. Both kinds of curves can be used to fit the Hubbert curve as shown by Bardi (2005) and by Staniford (2006). In addition, we found several more cases of minerals that may have recently peaked or be near peaking, although that is not completely certain yet.
The USGS data were not just examined for the presence of production peaks, but also analyzed in terms of the amount of mineral extracted so far and extrapolated into the future. In its basic form, the Hubbert model states that the production curve is symmetric, that is the production peak occurs when approximately half of the extractable resource has been extracted. The concept of “extractable resource” is ultimately defined by the area under the extraction curve at the end of the cycle; it is extractable what is actually extracted. However, in the initial phases of the extraction cycle, it is possible to estimate this quantity as the “ultimate recoverable resources” (URR). According to BP (2007) in the case of crude oil, the URR is defined as “an estimate of the total amount of oil that will ever be recovered and produced. It is a subjective estimate in the face of only partial information.” This estimate is even more subjective in the case of minerals other than oil for several reasons. One is that the knowledge of the world resources may be much more uncertain than in the case of oil. Another difficulty may be the lack of reliable historical data. Finally, minerals, unlike oil or gas, often appear as “graded” resources, that is as deposits of different concentration. So, it is difficult to determine a cutoff point of what exactly is extractable and what is not.
Nevertheless, the USGS database reports values for the “reserves” of each mineral considered. The concept of “reserves” is defined by the USGS (2007) as “That part of the reserve base which could be economically extracted or produced at the time of determination. The term reserves need not signify that extraction facilities are in place and operative.” Conversely, about the “reserve base” the USGS says that “The reserve base includes those resources that are currently economic (reserves), marginally economic (marginal reserves), and some of those that are currently subeconomic (subeconomic resources).” Obviously, the reserve base is much larger than the reserves in the USGS estimations. From these data, the URR for each mineral resource can be estimated as the cumulative production up to now plus the remaining extractable amount. The latter can be taken as equal to the reserves or to the reserve base. We tried both possibilities and we found that in all cases the area under the extrapolated bell shaped curve is in much closer to the amount obtained using the “reserves” rather than the reserve base, as we’ll show in the following. Note, anyway, that a discrepancy in this comparison does not, in itself, invalidate the Hubbert model: it may simply indicate that the estimations of reserves are approximate or wrong.
We examined 57 cases of mineral extraction from the USGS data. Of these, we found 11 cases where a clear production peak can be detected. These cases are listed in table 1. The table contains also the URR derived as the sum of the amount of the already extracted resource (up to 2006) and the amount of the reserves listed in the USGS tables. This value can be compared to the amount that the logistic or gaussian fitting of the curve provides.
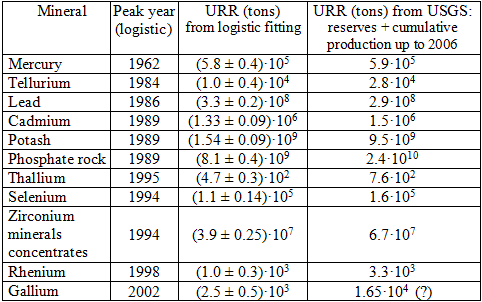
Table 1
For 4 minerals (Mercury, Lead, Cadmium and Selenium) we find a good agreement of the URR determined from the logistic fitting with the URR determined from the USGS data (cumulative production so far plus reserves). For 5 minerals (Tellurium, Phosphorus, Thallium, Zircon and Rhenium) the URR obtained from fitting is still acceptably close to the USGS data, although smaller. The URR derived from the USGS data are significantly higher only for Gallium and Potash. This discrepancy can be due to the high uncertainty of the data for gallium, and for potash because of market reasons described in the USGS data sheet (USGS 2006). If the “reserve base” is used for the estimation of the URR, for all these minerals the results are always much larger than those derived from the fitting of the experimental data.
We show now some examples of peaking. We start with the earliest global peak that can be found in the USGS tables, that of mercury (Fig. 1).
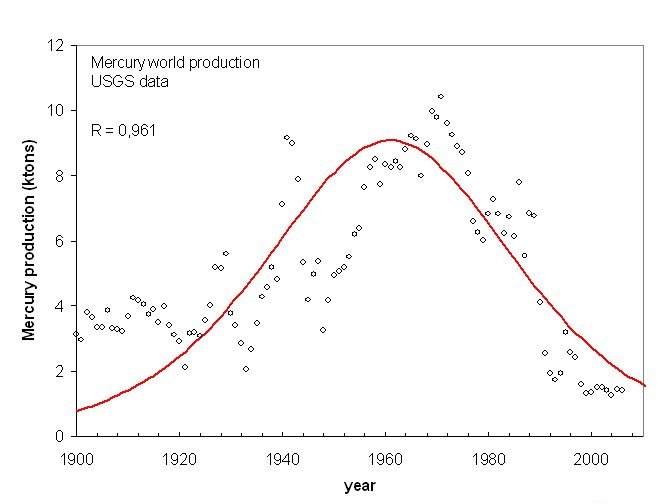
Figure 1, click to enlarge
Here, there is some dispersion in the data, but the fitting is reasonably good and there is no doubt that a global peaking has taken place in the mid 1960s. The total amount of mercury mined from 1900 to the present date is approximately 540,000 tons. According to the USGS data, the world reserves of mercury are reduced today to 46,000 tons which, added to the amount mined so far, provide a total amount of extractable mercury (URR) of approximately 590,000 tons. Considering that some mercury mining took place before 1900, this value is in very good agreement with the value obtained by the logistic fit (580,000 tons).
Another historical peaking is that of lead (fig 2), that peaked in 1986.

Figure 2, click to enlarge
The fitting is better than in the case of mercury and the data for the URR calculated from the fitting (330 million tons) is in good agreement with the amount calcolated from the USGS data (290 million tons).
A more recent example of peaking is that of zirconium mineral concentrates, (mainly zircon, ZrSiO4), which is the main source of zirconium and zirconium oxide, two important materials, often used as components of high temperature resistant materials (Fig. 3).
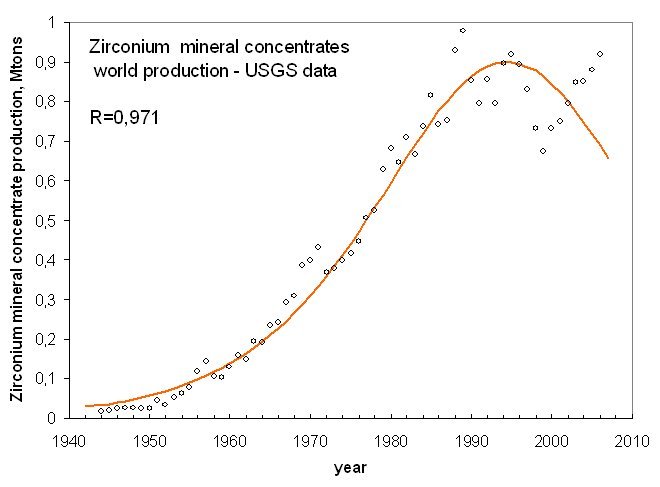
Figure 3, click to enlarge
There is no doubt that the initial nearly exponential growth of production started slowing down in the 1970s and that growth stopped in the 1990 to decline afterwards. The fit of the data gives the date of the peak as 1994. According to the USGS data, the URR for this mineral should be about 670 million tons. The fitting of the production curve produces a smaller value, around 390 million tons. Note that the USGS reserves are reported in terms of tons of ZrO2, whereas “zirconium mineral concentrates” are a mix of several minerals, mainly zircon (ZrSiO4) and baddeleyte (ZrO2). A further element of uncertainty, although only a minor one, is the lack of production data for the United States for some years in the USGS data. Taking into account these uncertainties, the agreement can be considered acceptable as an order of magnitude.
Selenium, a metal important for the semiconductor industry, also peaked in 1994 according to a logistic fitting (Fig. 4).
Figure 4, click to enlarge
The Selenium URR calculated from the value of the USGS reserves is in good agreement with the area of the fitting curve.
There is also the case of an even more recent peak; that of gallium. Gallium is another metal important for the semiconductor industry. According to a logistic fit of the data, it peaked in the year 2000 (Fig. 5).
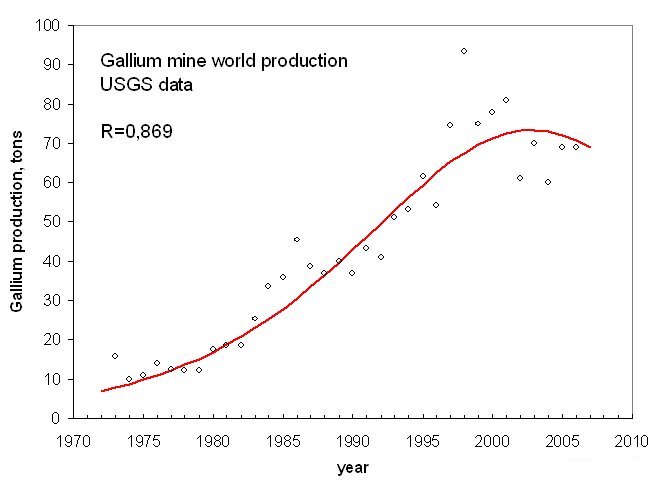
Figure 5, click to enlarge
In this case, the area under the fitting curve is much smaller than that calculated from the USGS reserves data. In this case, the uncertainty in the estimation of the reserves is very high, one reason being that Gallium is produced only as a byproduct of the extraction of other minerals.
In principle, the peaks that we have reported could be interpreted as due to factors other than depletion. Economists tend to distinguish between demand and supply and the decline of production of minerals might be seen as the result of cheaper or safer substitutes entering the market, that is to a reduction of the demand. It would be tempting to attribute the decline in production of mercury to this factor. Mercury is a toxic metal which has been substituted with various other materials and devices and it is now slowly disappearing from the market. But most of the legislation forbidding the use of mercury came much later than the mercury peak (1962) and, as we saw, mercury peaked almost exactly at the “midpoint” of the available reserves, as predicted by the standard Hubbert model. A similar case, reduction in the demand, can be made for the peaking of lead, another poisonous metal. But for many applications, for instance car batteries, no substitute has been found so far for lead. Moreover, also in this case peaking took place almost exactly at midpoint of the estimated resources.
Perhaps the only case were the a decline of production can be attributed to market factors is that of potash (K2O) that peaked at a value of cumulative production considerably lower than midpoint and where market factors were indeed reported as the cause of the decline (USGS 2006). In all the other cases shown in table 1, there is no evident cause that could lead us to think that the decline in production can be attributed to a reduction in demand. For instance, some of the materials listed are important for the semiconductor industry (gallium, tellurium, selenium), others for the metallurgic industry (zirconium, molybdenum), and others for agriculture (phospate rock). No obvious substitutes exist for these materials. Therefore, the peaking and decline of the minerals that we have examined must be interpreted as due, at least in part, to factors related to a reduced supply, in turn related to depletion.
Other minerals examined in the USGS database show a clear slowdown of the rate of increase of production, but it is difficult to prove that a peak has occurred. That depends strongly on the data for the last few years and the data reported by the USGS (Kelly 2006) under the label “Minerals yearbook” arrive only up to 2004. The USGS reports another set of data under the label “Mineral Commodities Summaries”, which are updates for the last two years; available at present up to 2006. Unfortunately, in some cases these sets of data are inconsistent with each other. For instance, Vanadium world production appears to be peaking around 2002 from the “minerals yearbook”, but the data in the “mineral commodities summary” show a sudden jump in production in 2005 and 2006 that brings it well above the earlier peak. The data for vanadium in the successive editions of the “summary” are not consistent with each other, for instance in 2007 the worldwide production for 2005 has been changed to 58,200 tons from the 40,200 tons listed in the tables of the year before. The reasons for this correction are not explained but seem to be related to uncertainties in reporting from countries such as China.
Several minerals in addition to vanadium show similar sudden jumps in production that lead the production curve to abandon the tendency to peaking of a few years before. One such case is that of iron ore (Fig. 6 ) which shows a true “hockey stick” in the production data.
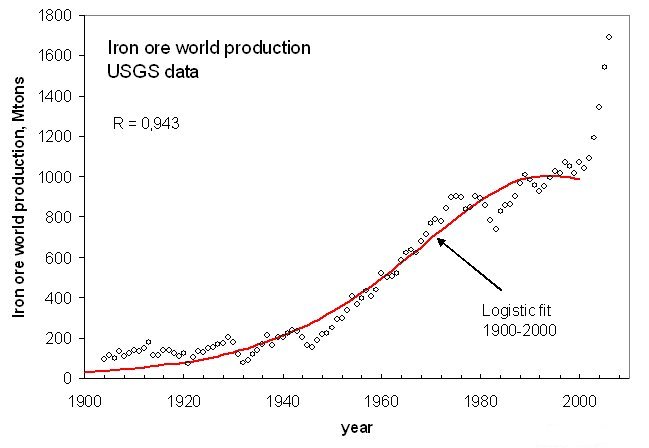
Figure 6, click to enlarge
Here, it is difficult to say whether the rapid rise in the past few years is due to inconsistencies in reporting or to an actual increase of production that may be related to the quickly growing Chinese economy (Pui Kwan Tse, 2005). Probably, both factors are playing a role and the sudden rise in production may be due to the fact that the Chinese economy is, at least in part, “out of sync” with the rest of the world. In any case, we will be able to assess the situation for vanadium, iron ore, and other similar cases only after more data will be available and when their consistency will be assessed by the USGS.
Some minerals in the USGS database show a continuous growth in production that, visually, appears to be nearly exponential. Gordon and coworkers (Gordon 2006) have recently examined five metals that show this behavior: copper, zinc, tin, nickel and platinum. They didn’t use the Hubbert model, but tried to extrapolate the demand for these metals in relation to the expected growth of the world’s population. They reported that “no immediate concern” exists for the availability of metal stocks, but that “the virgin stocks of several metals appear inadequate to sustain the modern ‘‘developed world’’ quality of life for all Earth’s peoples under contemporary technology.
Taking copper as an example, up to 2006 the experimental data can, indeed, be fitted using an exponential function, but a logistic function provides the same degree of fitting (fig. 7)
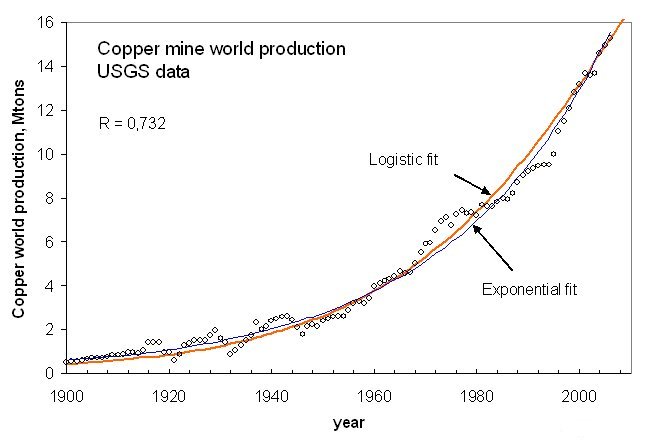
Figure 7, click to enlarge
If we extrapolate the two models a few decades in the future we see the scenarios of Fig. 8, with copper peaking around 2040 according to the logistic fitting.
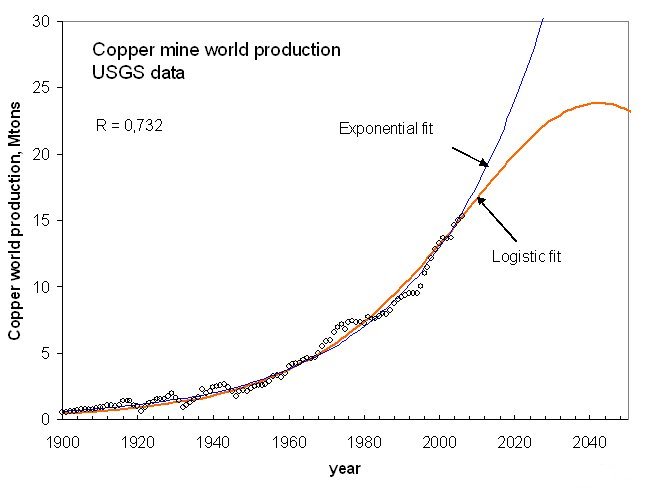
Figure 9, click to enlarge
The results of the fitting are in agreement with the USGS estimation of copper reserves. This amount is about 0,5 - 1 Gtons, even less than the value that can be estimated from the logistic model (2 Gtons). Our analysis is therefore in agreement with that of Gordon, but it provides a more detailed picture of what we may expect in the future. Other metals showing an apparent exponential production growth up to now can be examined in this way. The result is that most minerals should be peaking in the coming decades.
Obviously, all the considerations made so far depend on the assumption that the peaks shown in table 1 are ultimate global peaks. It is a reasonable assumption, but also debatable, especially for those minerals which have peaked most recently. Some minerals are highly sensitive to market cycles and show several peaks. Gold is a case in point: the historical data show a peak in 2001, but the peak may be just one of a series of peaks observed in the history of gold production. Although the minerals reported in table 1 appear to be scarcely sensitive to these cycles, we can be absolutely certain of the “ultimate” peak only after the extraction (or production) cycle has been completed. That, for the time being, is possible at the global level only in the case of whale oil (Bardi 2006) and perhaps of mercury (fig. 1). Nevertheless, the set of experimental data reported here and their analysis provide impressive evidence of the soundness of the Hubbert approach.
We see, therefore, that peaking and decline is a common feature of the worldwide production of most minerals, as the Hubbert model predicts. We cannot exclude that the recent generalized rise in prices of all minerals will start a new wave of investments, but, so far, the predictions of the “functional model” don’t seem to be fulfilled.
We need also to consider that the costs of extraction are not just monetary but involve energy costs as well. This fact introduces a further factor that may hasten peaking and decline. The energy involved in the extraction of a mineral commodity, say, copper, does not just depend on the energy needed to extract it from the ore and refine it. It depends also on the energy needed for extracting oil (or coal, or gas, or uranium) and turning it into power and machinery useful for extracting copper. Since fossil fuels are being depleted, more energy is needed for their production and the result is a further increase in the energy needed for the extraction of all minerals. The whole world extractive system is connected in this way. This connection may explain why the peaking of most mineral commodities appears to be clustered in a period that goes from the last decades of the 20th century to the first decades of the 21st century, the period when difficulties in the production of fossil fuels started to be felt worldwide. This connection may also explain why several minerals are peaking for values of the cumulative extraction that are lower than what would be derived from the USGS estimation of the available reserves. Unless new and inexpensive sources of energy become available, we may never able to exploit the abundant “reserve base” of most minerals, and not even the reserves as they are estimated today.
In the end, “Peak oil” seems to be just one of several cases of worldwide peaking and decline of a depletable resource. The bell shaped curve is valid globally and for most minerals, not just for oil and for regional cases. In a few years, it is likely that many more resources will be observed peaking and declining.
* * * * * * * * * * * * *
Acknowledgement: the authors would like to thank John Busby for his suggestions regarding metals production.
By Ugo Bardi* and Marco Pagani
Association for the Study of Peak Oil – Italian section (ASPO-Italy)
* and Dipartimento di Chimica dell’Università di Firenze (Italy)
Ugo.bardi@unifi.it
References
Adelman, M.A. “The Real Oil Problem”
web.mit.edu/ceepr/www/R2004-171.pdf
Bardi, U. 2005 Energy Policy, Volume 33, Issue 1, , Pages 53-61
Bardi U. 2006,
www.aspoitalia.net/aspoenglish/documents/bardi/whaleoil/whaling2005.pdf
see also Bardi U.2007, Energy Sources B, in press.
BP 2007 (accessed)
www.bp.com/sectiongenericarticle.do?
categoryId=9017934&contentId=7033489
Cambridge Energy Research Associates (CERA) 2006,
www.cera.com/aspx/cda/public1/news/pressReleases/pressReleaseDetails.aspx?CID=8444
Dery, P., Anderson, B.,
www.theoildrum.com/node/2882
Engdhal, W, 2007,
www.financialsense.com/editorials/engdahl/2007/0925.html
Gordon R. B., Bertram M., and Graedel T. E., 2006, “Metal stocks and sustainability”, Proceedings of the national academy of sciences, PNAS _ January 31, 2006 _ vol. 103 _ no. 5 _ 1209–1214
Laherrere, J. 2005,
www.oilcrisis.com/laherrere/CERN200510.pdf
Kelly, T., Buckingham, D., DiFrancesco, C., Porter, K., Goonan, T., Sznopek, J., Berry, C. & Crane, M. (2006, accessed) Historical Statistics for Mineral and Material
Commodities in the U.S., Open File Report 2001-006 (U.S. Geol. Survey, Washington, DC).
minerals.usgs.gov/ds/2005/140/#data
S. Holland, 2006, “Modelling peak oil”
www.be.wvu.edu/div/econ/Seminar%20Series%20Spring%202006/Holland%
20Peak%20Oil_1.pdf
Naill, Roger F. 1972. Managing the Discovery Life Cycle of a Finite Resource: A Case Study of U.S. Natural Gas. Master's Thesis Submitted to the Alfred P. Sloan School of Management. Massachusetts Institute of Technology. Cambridge, MA 02139.
Nordhaus W. D., 1992, “Lethal Models” Brookings Papers on Economic Activity 2, 1
Pui-Kwan Tse, 2005 THE MINERAL INDUSTRY OF CHINA
minerals.usgs.gov/minerals/pubs/country/2005/chmyb05.pdf
Reynolds, D.B., 1999. The mineral economy: how prices and costs can falsely signal decreasing scarcity. Ecological Economics 31, 155.
Simon, J. 1995, “Policy Report for the Cato Institute”
en.wikipedia.org/wiki/Julian_Lincoln_Simon (accessed in 2006)
Staniford, Stuart, The Oil Drum, 2006.
www.theoildrum.com/story/2006/1/11/6047/13568
USGS 2006, Mineral yearbook, Potash,
minerals.usgs.gov/minerals/pubs/commodity/potash/myb1-2006-potas.pdf
USGS (2007) appendix C.
minerals.usgs.gov/minerals/pubs/mcs/2007/mcsapp07.pdf
Zimmermann, Erich. 1933. World Resources and Industries. New York: Harper & Brothers. Also, 1951. World Resources and Industries, 2nd revised ed. New York: Harper & Brothers.
Personnel
Editors
Contributors
Peak Oil Primers
Archives
- November 2010 (3)
- October 2010 (6)
- September 2010 (4)
- August 2010 (7)
- July 2010 (6)
- June 2010 (7)
- May 2010 (2)
- April 2010 (8)
- March 2010 (4)
- February 2010 (6)
- January 2010 (3)
- December 2009 (5)
- November 2009 (8)
- October 2009 (12)
- September 2009 (6)
- August 2009 (5)
- July 2009 (11)
- June 2009 (8)
- May 2009 (16)
- April 2009 (10)
- March 2009 (7)
- February 2009 (10)
- January 2009 (15)
- December 2008 (9)
- November 2008 (9)
- October 2008 (9)
- September 2008 (13)
- August 2008 (10)
- July 2008 (14)
- June 2008 (23)
- May 2008 (16)
- April 2008 (12)
- March 2008 (16)
- February 2008 (9)
- January 2008 (13)
- December 2007 (13)
- November 2007 (16)
- October 2007 (22)
- September 2007 (8)
- August 2007 (9)
- July 2007 (16)
- June 2007 (8)
- May 2007 (7)
- April 2007 (7)
- March 2007 (10)
- February 2007 (10)
- January 2007 (12)
- December 2006 (9)
- November 2006 (15)
- October 2006 (4)
- September 2006 (5)
- August 2006 (5)
- July 2006 (9)
- June 2006 (5)
- May 2006 (10)
- April 2006 (9)
- March 2006 (13)
Vital Trivia
License

This work is licensed under a Creative Commons Attribution-Share Alike 3.0 United States License.
Excellent article with groundbreaking work on a subject about which too little is known.
"Unless new and inexpensive sources of energy become available, we may never able to exploit the abundant “reserve base” of most minerals, and not even the reserves as they are estimated today."
This conclusion is very important, of which the implications are difficult to assess without further research.
Rembrandt- this is an interesting point - the interdependency of resources in exploitation. In recent years, a shortage of tyres has actually impeded resource exploitation and added pressure to metal prices. When it comes to high oil prices you can see the airline and airliner industry collapsing - squashing demand for Zirconium (see below) just as the price of oil may make it too expensive to extract the Zirconium. I'd say that was a collapse in demand for jet engines leading the demand for Zr down. Energy (and in particular oil) is unique in that it is ubiquitous in the exploitation of other resources.
Another way of putting this:
If new and inexpensive sources of energy do not become available - then we won't need to exploit these mineral resources - will we?
My flights just been called - so gotta fly as they say.
The reverse dependency is also in place. If it gets very expensive to fly. Then the oil industry will also suffer higher expenses. And just about every single resource known is used in some way shape or form in the oil industry or supplying the oil industry. Overall high oil prices without the chances of cheap large fields to exploit leads to diminishing production because of price alone. And new discoveries are impacted the most.
Its a nasty feedback loop.
Is this really a problem for the oil industry?
If the market price for oil increases 30% the oil company’s revenue increases by 30%. Now, sure that price increase will feed into the products and services that the oil industry has to buy, but not the whole 30% as the industry doesn't only buy oil as an input.
For sake of argument, the market price increases by 30%, revenue increases 30%, costs increase 15%. Result, more profitable company.
The market bidding up the price is good news for the oil industry.
I think your treating increasing oil prices too simply. In my opinion its much closer to the way money injected in our fiat fractional reserve banking system works with one dollar of high power money resulting in a 9 dollar increase in the money supply.
So By increasing the price of oil by 30% you get say closer to a 60% hit on the price/economic side.
The problem is this revenue is declining in purchasing power because of higher prices since increasing oil prices have a inflationary effect. The direct dollar from higher prices buys less and it buys less for their supplier etc etc.
So assume in general in business supply chains are 3-5 companies deep. At each exchange you get a 30% increase.
So its 30%*30%*30% etc.
So
1 dollar -> 1.30 -> 1.68->2.17
And indeed we have seen the prices for a broad range of commodities come close to doubling over the last few years so this is probably not that far off. The reason I think it works this way is everyone is paying for the direct increase in oil prices and for the indirect increases passed on by their suppliers. So your paying for all the oil used through the whole production chain. In effect its a sort of double charge as cost are passed on. Sure profits are lowered but at the end of the day the final consumer has to pay for every drop of oil used in the manufacture of a product.
The numbers I'm using are high and it depends on the amount of oil input needed to create and move a product etc bu athe point is that higher prices for oil ripple through the whole economy causing direct and indirect price increases not just direct costs.
The oil industry is not immune and its costs increase in line with the increase in oil prices.
The problem that continues to plague many who attempt to create a model for demand destruction due to increased cost;
"These (increasing) costs will gradually reduce profits and, therefore, reduce the willingness of operators to invest in further extraction. That will slow down the growth and, eventually, cause the peak and the successive decline."
… is that there is economic incentive to invest while the prices continue to climb because there are not “reduce(d) profits, but rather there is an increase. Revenue continues to climb because customers at the pump are willing to purchase fuel (and food) on credit and will sacrifice other non-essentials (and in fact a few essentials) to maintain their privilege to drive inefficient vehicles, forgo the added cost of more efficient lighting, fail to turn down the thermostat and put on a sweater. When many begin to feel the squeeze, they do what has pushed part of the economic crisis in the middle and lower socioeconomic strata - they take a small loan against their homes, with a hopeful eye on future changes in employment or children moving out and on to their own independence. They gamble tomorrow with a pay day advance today and pray for overtime next week. Routine oil changes and regular maintenance of vehicles becomes part of discretionary spending and credit payments are kept low through consolidation and longer repayment schedules.
The result has grown behind the numbers from Wall Street for several years now - credit card debt and credit card delinquency is now the highest it has ever been ... catastrophic. What this means is that demand destruction will not happen until quite literally no one can afford to even live on paper money.
There is a difference between something like lead and oil. When oil is used it’s used for good. Lead however is relatively easy to reuse. Lead mined decades or even centuries ago could, if originally used for a bulk application like plumbing, roofing, car batteries etc, be reused. Lead used as a petrol additive or in paint won’t be so easily recovered though!
What it comes down to is that for oil, annual consumption must equal the annual production. For lead however, consumption could be higher than (primary) production due to recycling. How significant a factor is this?
The fact that those minerals haven't been consumed like hydrocarbons doesn't mean that we can get them back:
We've been using more silver than we're producing for years, but unfortunately much of it is widely dispersed in long-lived, low-cost appliances like light switches, from which it will never be economically recoverable. Sure, the silver atoms are all still here, but unless we're talking about concentrated sources like hybrid batteries, the material is so widely scattered that it might as well be on the Moon.
Which brings up the other point, about demand destruction: How do we know what the next hot technology will be? Maybe we'll need that zirconium for fuel cells, or maybe the bottom will fall out of the coltan market, when nobody's buying iPhones anymore. Peak anything depends on projected need, so polish up that crystal ball before placing your bets in the commodity markets.
But never 100% recoverable.
Some is always lost.
That is the price Entropy extracts.
Not true - entropy says disorder increases, but does not say that we cannot recycle 100% of the lead used with sufficient energy input. It's not like it gets destroyed.
At any rate, if mining and recycling will give us enough lead for centuries, it's a little silly to worry about it right now - there are plenty of more pressing problems that actually matter in the short term.
You are in error.
It is impossible to restore the total original content of any given thing once it has been manufactured and put to use.
Atoms fly off, friction, chemicals, the sun, time, what have you degrades every thing, ever made, constantly.
While it may not be destroyed it certainly is dispersed or transformed into forms that can longer be put to their original use.
Please explain how those change one element to another.
If the resource - e.g., lead - is not fundamentally changed - and in the case of lead, that requires changing it to a different element - then all that happens is the resource is dispersed. Re-collecting that resource requires energy - perhaps too much to make it economically viable - but that doesn't mean it can't be done.
Not to mention that you've missed the point, which was that complaining about future lead shortages is nowhere near the most pressing of our problems.
You are confusing loss of usable lead (or other mineral) with the concept of entropy. However, it is an important point you note that all recycling is not 100% efficient and eventually it will be uneconomic or otherwise not feasible to scrap off all the bits of lead that have been strewn about the globe in our growth.
The point I was getting at was that for oil the curve of production and the curve of consumption are the same. For lead the "consumption" curve is higher than the production curve because the lead can be consumed multiple times through recycling. By this mechanism it is theoretically possible to maintain or even increase consumption after production has peaked.
Two of the peaked minerals you mention, Potash and Phosphorus, are absolutely crucial to agriculture production. Not surprisingly, their commodity prices are rapidly climbing.
POTASH CORP of Saskatchewan

Overall commodity prices from the Reserve Bank of Australia;
http://www.rba.gov.au/Statistics/commodity_prices.html
In the US, production has been relatively flat as of late, which means it is not keeping up with population growth.
Phosphate rock production in the US;
2001 31,900
2002 36,100
2003 35,000
2004 35,800
2005 38,300
Potash production in the US;
2001 2,500
2002 2,300
2003 2,700
2004 2,500
2005 2,400
http://science.reddit.com/info/5yc6k/comments/
if you are so inclined...we thank you for your support.
The potash and phosphorus production charts end in 2005, while the commodity prices have continued to climb. I assume this is the extra fertilizer for biofuel production causing an increase in demand.
Both potash and phosphate are produced by strip mines. The potash is in New Mexico and on federal land, and the potash in Florida. How long does it take to permit new potash strip mines?
There are some lower grade but possibly profitable phosphate formations in Central Texas. Its a rock called green sand or glauconite, and there may be other resources available. The phosphate in Florida is about 50%, while the Texas stuff is about 25%. How much there is,I just don't know. Bob Ebersole
*clap* *clap*
Yet another way the present path is shown to be "in trouble".
Two points:
1) Similarly to my posting on previous work, I would like to see cross correlation analysis done to remove the effect of world economic event recession/growth. Instances where short term cyclic changes are see correlated across materials can be removed as instances of world economic performance, not resource availability.
Once that is done the underlying resource variation could be seen more accurately and the resulting curve fits would be more interesting.
2) In quite a few of those cases the curve fits, and the resulting explanations for resource shapes could be considered questionable. To be sure that we are meeting resource peaks, and that the future consisted of a downwards trend, we would need better data, and obvious correlation with resource prices.
Shock model like discovery curves would also help a lot to filter out the economic effects. Along with price vs production.
As I mentioned in my longer post the key is probably that we are long past the discovery phase globally for all resources of interest and its not surprising that the peaks are fairly close together. Since most of the resources can be used in more ways when the price is cheaper it sort of forces resource exploitation to become coupled with economic growth once discovery is in the past.
When copper was cheaper is was used in more ways for example say copper roofs. So economics generally means a resource is maximally exploited at a given price point. This causes a coupling effect leading to most resources peaking about the same time with a few such as iron ore which are in excess continuing to grow.
I have another set of concerns.
First, of all the graphs shown in this post, the only metal for which the data itself (rather than the fit) takes the form of an obviously peaked distribution is mercury. For all the others the peak of the fit falls too close to the end of the of the data to be sure that the fit has the correct number of degrees of freedom. Another way of putting that is: each fit may indeed have found a maximum, but how can one show that this is in fact a global maximum rather than a local one?
Secondly, for the case of mercury, it seems possible that demand destruction occurred due to some reason other than rising cost (e.g. environment regs or public pressure); as another poster put it, a substitution may have occurred.
Third, are the figures in the table from the USGS or are they derived from the fits to USGS data?
I'm not necessarily disputing that the minerals may be in decline, but I have a hard time believing that one can strongly conclude that from the data examined.
One thing to consider is that peak across a broad range of commodities and resources are probably not independent. Slowing economic growth from peak oil will reduce the demand of a broad range of commodities. To prove that these mineral peaks are not simply coupled with peak oil you also have to show that the price has been steadily increasing and supply falling. This is the key signature of a geologic resource peak.
The counter example is pretty obvious the price of iron ore has increased because of the expansion of the Asian economies and production has climbed to meet demand.
Another important factor is recycling we have to assume that copper production for example growing on top of more and more extensive recycling.
I Aluminum had been included since it has a pretty interesting set of production constraints.
Next its interesting that we are seeing a lot of peaks in resources and commodities at about the same time. The reason is probably pretty fundamental we have hit the limits of growth for our type of economy. This means we have basically searched every corner of the world and discovered most of the resources and exploited them.
Some of the peak are independent and some are coupled with other peaks via economic costs but its fairly clear we probably are maxed out and over the coming years growth will be increasingly limited by the cost of a resource vs its use.
Extensive recycling can buy time for some resources but others like oil are lost forever.
Very nice article. Thanks for posting it!
I think this is an important paragraph:
Uranium is one mineral that comes to mind with respect to this issue.
Some minerals we may be able to recyle, but we are still likely to have mineral supply problems if fossil fuels are significantly less available.
This has been beaten into the ground so many times its not funny. Uranium/Thorium supply is assured for millenia by any measure.
Beat it into the ground for us again, would you?
Really hoping you trot out the supply of uranium in seawater bit, I love that one.
Oh come on. The Uranium in sea water is in much too low concentration to be a consideration, although some scientist have apparently demonstrated the it can be extracted from it. Sea water has a Uranium concentration of .0002-.001 ppm (parts per million). Since there are about one trillion tons of Uranium in rock with concentration of 10-20 ppm or greater (thats 20,000 to 50,000 times as concentrated) and current world consumption is only about 65,000 tons/year, it will be a very long time before anyone looks seriously at recovering Uranium from sea water.
Uranium Concentrations
It depends on the economics of each extraction method. Seawater is trivial to obtain in massive quantities, so if the extraction method is sufficiently efficient (and IIRC the Japanese researcher was using passive sponges or the like) then extracting uranium from seawater may end up being cheaper and more efficient than processing low-grade mineral deposits.
So it's worth considering, although it - and the need for it - are both quite speculative as of yet.
Good point. I was just illustrating the embarrassment of riches.
710,
Its very easy to extract uranium from seawater. If you had attended the ASPO 6 conference you would know that we only need to process 5 times the flow rate of the Rhine river per 1GW reactor :)
But more seriously I have heard a rummer that within a few years Uranium production could increase dramaticly. Which of course it will have to with consumption at 67,000 tonnes per year and production falling to 39,000 tonnes from 42,000 tonnes in the previous year :(
Bob
Just keep in mind that the production fell because there was a fixed amount of demand and the weapons material from the FSU dumped in the power market beat out the minded Uranium on price. Not only was the mining cost already sunken for the weapons material and did not need to be recovered but also that material is highly enriched and can be blended down to produce a lot of the slightly enriched Uranium that power reactors need at very low enrichment cost. So the market would take all of the available weapons material before it would take the first mined and enriched product. It was not because the mining companies could not produce enough.
That story also gives a clue why the mining companies have done so little exploration and why the have felt little need to build more than a 50 year inventory of identified and proven reserves.
Deffeyes "Beyond Petroleum- The view from Hubert's peak" or whatever his book is called has a chapter concluding there is sufficient uranium. Unlike Deffeyes, I am not a geologist. If someone wants to dispute his conclusions, I would think they should explain where they differ from Deffeyes data or methodology.
RobertInTucson
I haven't escaped from reality. I have a daypass.
Excellent post, thanks for crunching the numbers here. This seems to be yet another example of entrained positive feedback loops--peaking oil production makes mineral extraction more expensive, and more expensive mineral extraction raises the cost of oil production. It suggests to me the same phenomena that I think we will see between oil & geopolitics: the right side of the curve will likely not look like the left because positive feedback loops that did not exist on the left side will speed decline on the right side.
Do you have data to examine molybdenum production for signs of peaking? I know that this is a critical component of much of the ultra-deep and offshore oil and gas drilling activity.
What are the longs poles in the tent, as far as minerals, for wind generation, photovoltaic production, metal additives used to make actic-tolerant structures, etc.?
Exactly !
I've been proposing that post peak feedback loops will hasten collapse at an accelerated rate. The fact that we are probably seeing tight coupling pre peak does not bode well for the post global peak economy. I'd suggest that or current economy is actually far from stable and is in reality a huge bubble that has grown over the last 100 years and has no basis in fundamentals. Just because the time scale for this mega-bubble to build is fairly long does not mean it does not have all the properties of economic bubble and collapse and generally bubbles collapse far faster than they grow.
The economic bubble we have created is so large and has been growing for so long its just now that we can stand back and understand the dire situation we have created.
The size of the monster we have created is almost beyond comprehension over shoot does not do it justice.
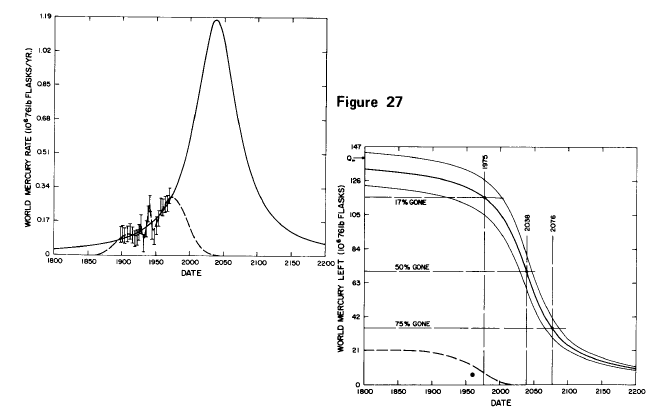
I'm surprised that the work of Prof. David Ropert was not mentioned:
Richard A. Arndt and L. David Roper, University Publications, Blacksburg VA, 1977.
Mercury (peak 2038):
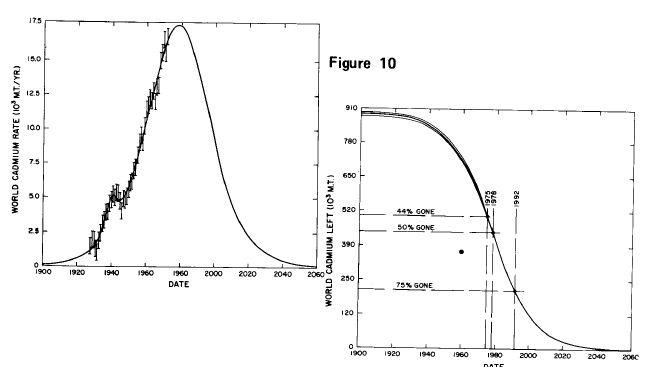
Cadnium (peak 1978):
Hugely interesting papers, Khebab, I am sorry to say that we had missed them completely. It seems that the scientific literature before the 1980s, the pre-internet era, is mostly destined to oblivion. We rediscovered Hubbert and it seems that we'll have to rediscover also Mr. Roper.
I went quickly through these papers, should be examined more in detail, but it seems to me that by all means, Roper got everything right, just as Hubbert did. He studied the same minerals that we examined, but he considered only (or mainly) the United States, whereas we examined the world production.
It seems that minerals production is going exactly in parallel to oil production. Initially, the US was a major producer, then it peaked and had to move the sources of supply to other countries. Now it is the world that is peaking, not just for oil but for most minerals. Interesting times, really, just like in the old Chinese malediction....
Ugo Bardi
www.aspoitalia.net
If you look at the first reference I gave, they estimated production curves for both the US and the World. I should have precised that the two curves I gave above are from this paper and are for the world production.
Yes, unfortunately the first file is almost unreadable, at least the version I could download and print. The second one is only about the US, I was referring to that one. Anyway, as I said, it is a hugely interisting work; thanks for telling us about that
Ugo Bardi
www.aspoitalia.net
Supply v Demand?
Ugo,
Interesting concepts - but are they right? Why did the world economy not go over the edge of a cliff with plumetting mercury (Hg) production in the 1970s?
Mercury of course was widley used in thermometers and in Hg diffusion pumps used to generate high vacuums in a range of scientific appartaus. Dolphins and Tuna also loved to eat this stuff (or at least fish that ate plankton that ate this stuff), along with a range of other toxic heavy metals - lead and cadmium spring to mind.
I believe the WHO (not Pete Townsend) took a lead in phasing out the use of these heavy metals and substitutes were found. Digital thermometers and turbo molecular pumps in the case of Hg. And adding tetra-ethyl lead to gasoline was phased out in the 1990s?
So the serious question is this. Are you looking at geologically / energentically constrained peak supply or are you looking at a manufactured peak in demand?
The same would apply to all the listed elements / minerals. Why were zircons "mined", for their zirconium? - or because zircon is one of the hardest minerals after diamond - and industrial diamonds can now be manufactured (I believe).
This is just the pollution effect from our crazy expanding economy. You can readily include sulfur dioxide and of course carbon dioxide pollution in this. A good example would be the production of various pesticides. And of course freon.
Only when the damage became so great it could not be ignored did we scale back production and use substitution. Real demand did not actually cease its just when forced we did do some substitution.
Now even with this demand did not drop world wide and in a lot of countries practices that are banned in the western nations are common in poorer world countries. A lot of dangerous pesticides are still in heavy use worldwide.
I'd suspect in a lot of cases esp say mercury whats really happened is the pollution has not actually declined but has been exported to countries which don't track the problem and have laxer rules.
The movement of the chemical industry in general to regions with less rigid environmental laws has probably resulted in higher global pollution and under reporting of the problem.
Its like showing lower crime statistics by changing the sampling method. The crime still exists just its not reported.
Consider how much mercury pollution is occurring in 3rd world gold mines.
http://www.american.edu/TED/bragold.htm
http://www.corrosion-doctors.org/Elements-Toxic/Mercury-amalgamation.htm
So overall I think its been a case of hiding your head in the sand vs real changes except for the one case of freons.
We have a tool for determining whether production declines are due to supply factor (depletion) or demand factors (pollution, substitution): the price history. The price of mercury has been falling since the mid-60s even as we pull less of it out of the ground.
http://minerals.usgs.gov/minerals/pubs/commodity/mercury/430798.pdf
That says falling demand, not constrained supply. I recall reading that the price of whale oil went astronomical near the end (kerosene arrived as a replacement fuel, but it was still used in fabric processing I think).
peace,
lilnev
You beat me into it. "Geological Peak" should be clearly made distinct from "Economical Peak" where the actual cause of lower production is reduced demand due to substitutes found better.
Peak Oil is so far unique in this respect, as the available alternatives are either limited or expensive (or both - in case we start relying on a limited alternative its price will shoot up; corn-based ethanol comes to mind).
The article author must clearly show how many of those peaks are true geological peaks. Have we really reached the limits of the supply of Hg into the Earth's crust? Hard for me to believe.
"Peak Oil is so far unique in this respect, as the available alternatives are either limited or expensive "
Not really. Renewable & nuclear electricity is a very good substitute.
WHy haven't we seen it used more? Because it's slightly more expensive than fossil fuels have been until recently, and there's a substantial lag in scaling it up.
Another type of peak, at least for a given area, tends to be more important in mining than it is even for petroleum (or tar sands or oil shale). That is the growing perception of environmental problems caused by mining itself (many related to smaller companies that didn't clean up because they abruptly went bankrupt owing to abrupt market changes). Such perceptions can and do make it nearly impossible to explore in many areas, to open new mines already discovered and drilled, and to reopen old mines even when prices have increased greatly. This might be called the NIMBY effect (a major political liability), and varies by state or country. So to geological peaks, and economical or demand peaks, you should probably add enviromental peaks in areas where such things are of growing concern. If such areas dominate production, you could get a premature peak. A fourth type of peak, already mentioned in an earlier post, relates to valuable minor elements (trace elements) recovered primarily as as a by-product of the mining of a major metal or metals (or other commodities). If such mines peak or are forced to close, for whatever reason (geological exhaustion, bad economics, or acute environmentalism), fewer or no by-products can be produced at nearly any price (because the by-product is totally enslaved to production of the major commodity). Many high-tech metals or metalloids probably fall into this category.
Mercury is exceedingly rare (a trace element), but also exceedingly easy to mine and produce (very low tech), and mostly was deposited in a single environment (former hot springs). It has always been valuable enough (even without by-product gold), and unique enough, to justify recovery from its own mines, which date back to antiquity. It took a long time for its toxicity to be recognized. It is therefore geologically reasonable that it be one of the first metals to peak. Banning it for most applications may greatly extend its decline.
Unlike oil or mercury, many metals, such as copper and uranium, are deposited in a huge variety of geological environments, with greatly varying grades and differing by-products and co-products. This makes exploration more challenging, but also gives more chances for success. It also makes production depend greatly on subtle details of metal economics.
Ugo Bardi
www.aspoitalia.net
For Euan: We had the same reaction as you did when we saw the data for mercury the first time. We thought it was an effect of the "reduction in demand", caused by regulation. But then we noticed two things: 1) laws forbidding or regulating the use of mercury came at least one decade after the peak and 2) the area under the extraction curve matches well the USGS estimate for reserves.
So, we can propose (no more than propose, of course) that mercury has been mined as intensively as possible, given the economic constraints. That is, production has not been strangled by regulation. Therefore, we propose that mercury has followed its "Hubbert" trajectory as the other metals in the set. Of course, as production declined, people managed to find substitutes; silicone oil for diffusion pumps (not "turbomolecular", those never used mercury), thermocouples for thermometers, etc.
The same is true for lead, it is true that people took out lead tetraethyl from gasoline, but this was much later than the peak. Moreover, we weren't able to find a substitute for lead in car batteries; we still use the same battery design as a hundred years ago. The new lithium batteries are just coming of age.
About zirconium/zircon. Zircon (and similar Zr containing minerals) are mined for two products: zirconia (ZrO2) and zirconium metal. Both are fundamental for metallurgy and high temperature materials; for the aerospace industry, for instance. I can tell you that, since I work in that field during daytime (only at night I can do models of extraction!). There is NO replacement for zirconia as a high temperature material in gas turbines and jet engines. And there is a tremendous need for it; so far.
If you allow me a different kind of comment, anyway, I believe that one of the greatest bane of economics is to consider demand and supply as two separate entities, in other words that you can change one while leaving the other unchanged. It is a good example of what people call "linear thinking" as opposed to "dynamic thinking". People who think linear will always be blind to the bell curve and the peak, a typical dynamic phenomenon.
Ugo - thanks for this reply which I will take some time to ponder.
Supply and demand are of course joined at the hip. The issue arises in looking at production - and working out if production changes are linked to changes in supply or demand. I, for example, have maintained that the fall in oil production this last year is due to a fall in demand (moderated by higher price). Its a complicated picture - and a dicussion to have another day.
The timing displacements you mention are interesting - and I have had much debate about much smaller timing displacements in the Saudi oil story this year. There is always the possibility that the market stopped using Hg prior to the regulations. The clinching argument of course is whether or not the world ran out of mercury mineral resources - and that I'm afraid I cannot comment upon. How reliable are the USGS numbers?
In the labs I worked in (and eventually owned) Hg and oil diff pumps ran along side each other - and both tended to be substituded by mag lev turbo pumps when that technology arrived.
Intersting points about Zr - I didn't know what the use was - I guess most zircon is mined from modern placer deposits (? I don't know) - but I'm left wondering to what extent recycling has played a role in softening demand - as Chris mentions up the thread? One thing for sure though - I'd imagine that demand for Zr will fall in the aeoro space industry - so how will you interpret that?
Finally - any views on Lithium distribution in the crust?
As Einstien noted in his theory of relativity - Depending upon your frame of reference, it is imposible to tell what is moving and what is stationary. So it is as prices rise or fall. As they rise, is demand going up or is supply falling? As markets change from contango to backwardation, is demand rising, or is supply falling or are investors projecting that future prices are going to be lower because of larger future supply or less future demand? Good thing that there is a question - it allows those who think they know to place their bets.
Because it has the wrong ionic charge for its size, lithium is what geochemists call an incompatible element (uranium is another). This means that lithium tends to be concentrated in residual liquids during fractional crystallization (removal) of minerals from that liquid. For lithium, that liquid can be either a brine from which salts are crystallizing, or a hydrous melt of a rock called granite from which silicates are crystallizing. Most lithium ore deposits are therefore either concentrated brines (in Nevada and especially in the giant salars of Argentina and Chile) or else giant-crystalled areas of extreme fractional crystallization of granitic melt called pegmatites. Although lithium pegmatites are relatively abundant, they are small and labor-intensive to mine, and so most lithium today is extracted from brines. That's probably more than you wanted to know.
Euan: Good point about lithium. It is the next thing I plan to analyze. About the USGS numbers, well, good point too. As you can read in the paper, we found that the data for vanadium and for iron are not consistent; they change for the same years with successive versions of the USGS reports. So, I am sure there are big uncertainties in the data, not just for these two. China is known for bad reporting in almost all productive sectors. I think the general picture is good, but sometimes you see abrupt changes in slope in the production data; I think it is bad reporting, not real production changes. The point, anyway, is to accumulate data, then the general picture becomes clear. That report that Khebhab cited, from 1976, is impressive in the fact that they found for the US at that time exactly the same behavior that we are seeing now worldwide. According to Roper, mercury peaked in the US in 19th century, well before regulations were enforced!
Finally, about zirconium; as far as I know, zirconium is occasionally recycled, but I have no data about what fraction. I think it is very small; nothing comparable to copper, zinc, lead and the like. About the aerospace industry; yes, zirconia use may fall with the disappearance of jet planes; grounded for lack of fuel. But, one caveat: zirconia coatings for jet engines are used mainly in military engines, rarely in civilian ones. The former kind may not decline so fast! Anyway, there are many uses of zirconium/zirconia outside the aerospace industry. It is a complicated world, out there....
Ugo Bardi
www.aspoitalia.net
I think the simplest and most effective thing we can do in these cases is look at the price series. If the price is going up and up as supply flattens and then falls, that's a strong case that the problem is on the supply side. OTOH, if the price is falling and the price fall leads the production fall, that's a strong argument that regulation or other forms of substitution is affecting demand. In oil, clearly we have the former at present (prices are going up and up, but supply is not responding). Do we have any data on mercury or lead prices?
Down and down.
The prices of each crashed within a few years of both peaks (mercury a little after, lead a little before). The constant-dollar price of lead is down 50% and of mercury is down 90%, strongly suggesting a demand-based drop in supply.
I agree - especially for mercury, it seems very hard to believe that there's a big problem with supply when it's so much cheaper than it used to be.
The prices are down from large (2-2.5 times) peaks that occurred when extraction stopped increasing. Mercury extraction doubled between 1950 and 1960 and then flattened off. The price promptly doubled. Lead extraction grew by 3.5 times between 1950 and 1970 and then flattened off. The price then also doubled. The prices later fall probably because of switching to alternatives where available. But this switching clearly comes after extraction flattens off and the prices rise. So I would interpret it as being forced on people by geology (and the resulting high prices) rather than being demand driven. Given how nasty mercury and lead are once the economics are pushing the substitution one can imagine that all the other reasons, that were being studiously ignored while they were cheap, gave a lot of extra momentum to find substitutes.
That's simply not true.
The price of mercury was sliding until 1964, which corresponds to the end of that production plateau you mention. The price then shot up, as did production. Production increased until 1972, by which time the price had crashed down below its 1963 level, and has been sliding ever since. The price link I gave attributes this crash to lower demand due to environmental concerns - mercury was declared hazardous in the US in 1971.
So for mercury, the production peak comes after the price crashed - that's pretty clearly demand-driven.
Lead is slightly different. Lead prices increased sharply in 1977-1979, leading to a slight production increase. The price crashed from 1980-1985, leading to a slight production decrease. Since then, price and production have both been largely stable.
The history for lead is less obviously demand-driven, but it's hard to see it as geologically-driven, either. If it was supply-driven, we'd expect to see falling production at the same time as sharply rising prices, but we don't see that at all. Moreover, the price link notes that lead was being increasingly restricted for environmental reasons - leaded gas was phased out in the US between 1976 and 1986 - so there was a large decline in demand at the same time the price crashed.
Again, evidence suggests this was a demand-driven peak, and not in any way a supply-driven one.
Evidence doesn't always support one's cherished beliefs - it's important to be able to recognize that.
As we can see from the present situation with oil prices the actual point of peak is largely irrelevant. What matters is when the extraction rate stops growing exponentially. At that point prices start rising. For both mercury and lead this point is followed by an anomalously large price spike. The low price now, is certainly due to substitution.
Since the substitution followed a sharp rise in the price it doesn't seem unreasonable to attribute it to the price rises (These metals were poisonous in the 50's as well as today after all). And attributing the prices rises to supply constraint also seems reasonable since they occur when a bumpy production plateau is reached.
Is it possible that the supply constraint would have been temporary and they switched too soon. Sure but this data is perfectly consistent with these resources having been exhausted. The present price is entirely irrelevant to this issue given the amount of substitution that has happened since the 60's.
Mercury production had stopped increasing exponentially long before the price spike, and in fact had been bouncing up and down for decades. Lead production plateaued in 1968, which was a decade before the price spike.
Neither lead nor mercury fit your theory, as much as you appear to dearly wish they did.
Post hoc ergo propter hoc fallacy.
The USGS disagrees with your assessment; moreover, given that they cite specific causes for reduction of demand (e.g., the 1971 mercury ruling and the phase-out of leaded gas), they're a little more credible.
But the laws regulating their use didn't exist. Big difference.
The production peak of mercury came after the price had crashed. How is that consistent with the resource having been exhausted?
You're trying desperately to shoehorn the data into your preconceived belief, and it's really not working. All you're accomplishing is making yourself - and, by extension, peakers in general - look like closed-minded zealots.
Some resources see their production decline because people don't want to use as much anymore, rather than because the supply is running out. Why is that such a difficult concept to accept, even for such relatively-unimportant materials as mercury?
One more try. This is what I see:
Ignoring the effects of WWII (1), the extraction rate plateaus (2), then the price spikes in about 1964 (3) and then substitution starts happening in the early 70's (4). And for lead:
where again the plateau (1) is followed by the price spike in about 1978 (2) and then substitution in the mid 80's (3).
What you need to be able to explain if you think the plateaus are caused by a drop in demand rather than supply constraint it why the prices increase after the plateaus start which seems to imply that demand is still strong at that point. It is the ordering of these events that matters.
http://en.wikipedia.org/wiki/Abundance_of_elements_in_Earth's_crust
Looking at the charts is like tea leaf reading without reference to what is happenning in the wider world. The price spike in 1978 is due to the removal of wage and price controls. The substitution in the early eighties is due to Removal of Hazardous Substances.
Today 90% of lead is used for lead acid batteries (the remainder is for children's toys :>) and the growth in demand is for more batteries. Demand and therefore supply will continue to grow as people want more batteries.
Lead is not scarce.
RobertInTucson
I haven't escaped from reality. I have a daypass.
Agreed - Lilnev posted a link to Hg prices.
And I also agree the price signal for oil has a clear message - but believe that at / post peak it will go much higher. And we are getting closer every day.
I noticed this note on Indium Corp's web site
http://www.indium.com/supply.php
I especially like the part about the "temporary imbalance between supply and demand".
Do these corporate execs all get the same talking points from the same source? The Iron-Triangle Telegrapher.
It is interesting to note that indium is important in forming glass to metal seals, and is also used as a "transparent" metal for routing power traces on glass LCD displays. Probably the biggest use is in the production of flat-screen TV's (source?). Maybe I shouldn't fight the urge any longer and just give in and join my fellow Americans...
Andy B
With the exception of rhodium for catalytic converters, I'm not buying this. I don't see evidence of geologically contrained metals with no substitution that is essential for something or other. Metal use goes up and down because of ROHS (reduction of hazardous substances) or the substitution of plastics and other cheaper materials. Gold use in electronics is down greatly from the 70's. We figured out how to make gold coated connectors using much less metal. Gold isn't essential but corrosionproof is a nice property to have. The main usages for gold is jewelry and coinage, neither of which is essential for civilization. Gallium is junk metal produced when mining something else. We have a lot of gallium but only the neutrino guys want it.
http://www.mii.org/Minerals/photocopper.html
Here's a link for copper. It is being replaced by plastic in plumbing and fiber optics (silica) in communications. It can be replaced by aluminum for wiring. The nickel contains over 5 cents in copper, the penny contains over a cent in zinc. There's no real need for metallic coins any more. The only areas where copper is essential is when both strength and heat conduction is needed. Pots and pans, and heat exchangers. In cookware, copper is mostly replaced by cheaper inferior alternatives like stainless steel or aluminum.
RobertInTucson
I haven't escaped from reality. I have a daypass.
Amen.
Someone needed to say this before we've all jumped onto this "peak everything" wagon.
Here's a link for copper. It is being replaced by plastic in plumbing
We have to consider where the feedstock from plumbing is coming from; petroleum and natural gas (the latter being in decline in North America).
http://www.eia.doe.gov/kids/energyfacts/saving/recycling/solidwaste/plas...
Plastic is recyclable. The raw resin is cheaper than the recycled material.
RobertInTucson
I haven't escaped from reality. I have a daypass.
And whats ironic about this statement is that significant (well over half of global demand) rhodium can be synthesized by fissioning uranium or plutonium. Indeed in a crunch it can be reclaimed from spent fuel today.
100,000 years of rhodium global demand can be gotten cheaper by lassoing one asteroid.
RobertInTucson
I haven't escaped from reality. I have a daypass.
Well it can be obtained, but the notion that its cheaper isn't immediately obvious when you consider that rhodium is a byproduct of nuclear power production anyways. I'm fairly confident you could amass the capital for reprocessing spent fuel quicker than you could for establishing an entire asteroid mining industry. I'm sure we'll get there someday.
http://www.platinummetalsreview.com/pdf/pmr-v35-i4-202-208.pdf
Rhodium is a byproduct of nuclear waste reprocessing should anyone tackle that can of worms. Ruthenium 106 decays into rhodium 106 with a half life of a year. Our choices become either let the material sit around for fifty years, make the rhodium completely free of ruthenium (difficult), or isotopically separate out the Rh-103.
Someone once posted a $50 billion dollar number for this process on TOD. We are a long way from a request for quote to really know.
RobertInTucson
I haven't escaped from reality. I have a daypass.
Waiting ten half-lives is more than sufficient for industrial catalysts, which is where this stuff would go.
It is going in automobile catalytic converters. Safe radiation levels is another can of worms but kids can reasonably be expected to sit in the back seat. And the cars have to be marketed to families even if they are absolutely safe. Ruthenium 106 is very hot, beta decays to rhodium 106 in about a year, and Rhodium 106 quickly gives off a gamma ray. I don't have the responsibility for setting safe radiation levels, but the link I posted a message ago thought fifty years would do it.
RobertInTucson
I haven't escaped from reality. I have a daypass.
Of course not. Theres more to rhodium demand than catalytic converters.
That's ridiculously paranoid. 1/2^50 is ridiculously tiny no matter how large the activity.
Yes, the world is not finite. The fractal distribution of materials couldn't possibly exceed our ability to extract them, nor our demand of them. I can see it now, we will never run short of anything, there is no technological hurdle that can't be overcome, no desire that can't be satiated.
You guys are hysterical, I love this stuff.
Nobody's saying it couldn't - they're just saying it hasn't, at least for the materials mentioned (mercury, copper, gold, gallium).
But if you have something to add other than sarcasm, please feel free to do so. A response to the fact that mercury prices have fallen sharply in the 45 years since the peak of mercury production would be a good start.
Yes, I have quite a bit to add other than sarcasm. Unfortunately, my missive was lost when my computer crashed. That'll teach me to not compose offline and not save my work.
I'll just work on it later, and post it to another thread when I see good ol' Dizzy Dezzy doing his dance of distraction.
What difference does it make if we find alternatives or ways to stretch a declining resource?
The point is they are declining in availability!
Just because we may no longer use a particular substance in a given fashion does not mean there will be steady availability for future generations.
7. Conclusion
Indium and gallium containing raw materials exist abundantly worldwide. The metals industry has been investing in process improvements and capacity over the last few years to bring more indium and gallium to the market. This industry can and will continue to do so if the demand is there. As described, price volatility and short-term availability will continue intermittently due to numerous factors including the time lag required to install additional capacity, government regulation, and the lack of information suppliers receive about future demand. Overall, we anticipate adequate indium and gallium supply and continued price affordability for current and new applications.
This is by the same Indium Corporation. You can always use the "that's what they want you to believe" line, but how about some evidence Indium and Gallium are really scarce.
The price of indium steadily declined until it reached a trough of $60/ton in 1997. Since then, the demand for indium has skyrocketted because of its use in FPD (flat panel displays). The cost is now $600/ton. The industry has to make investments to bring more indium on-line but there's no geological constraint to doing so. Supply bumps are not unexpected.
RobertInTucson
I haven't escaped from reality. I have a daypass.
I really can't prove that there will not be more indium available in the future as more supply comes online, but I can say that I bought ~9 grams last year for over $1,000. This was research grade, but the price has increased dramatically and I don't see it coming down again. At those prices I would have expected more supply to be forthcoming sooner - that's what makes their arguments about available supply hard to swallow - it's just too valuable right now.
From the USGS:
World Resources: Indium is a rare element and ranks 61st in abundance in the Earth’s crust at an estimated 240 parts per billion by weight. This makes it about three times more abundant than silver or mercury.
Indium occurs predominantly in the zinc-sulfide ore mineral, sphalerite. The average indium content of zinc deposits from which it is recovered ranges from less than 1 part per million to 100 parts per million. Although the geochemical properties of indium are such that it occurs with other base metals—copper, lead, and tin—and to a lesser extent with bismuth, cadmium, and silver, most deposits of these metals are subeconomic for indium.
Vein stockwork deposits of tin and tungsten host the highest known concentrations of indium. However, the indium from this type of deposit is usually difficult to process economically. Other major geologic hosts for indium mineralization include volcanic-hosted massive sulfide deposits, sediment-hosted exhalative massive sulfide deposits, polymetallic vein-type deposits, epithermal deposits, active magmatic systems, porphyry copper deposits, and skarn deposits.
Substitutes: Indium has substitutes in many, perhaps most, of its uses; however, the substitutes usually lead to losses in production efficiency or product characteristics. Silicon has largely replaced germanium and indium in transistors. Although more expensive, gallium can be used in some applications as a substitute for indium in several alloys. In glass-coating applications, silver-zinc oxides or tin oxides can be used. Although technically inferior, zinc-tin oxides can be used in LCDs. Another possible substitute for indium glass coating is transparent carbon nanotubes, which are untested in mass production of LCDs. Indium phosphide can be substituted by gallium arsenide in solar cells and in many semiconductor applications. Hafnium can replace indium alloys in nuclear reactor control rods.
me:
China just openned an Indium market and the prices are stablizing at $700-$800 a kg. Up by a factor of ten from a decade earlier. At $100,000 per kg, you are paying for the research grade label. Indium is a very thin market, co-mined with other metals and therefore hostage to them. A French zinc mine quit producing indium at the price nadir. The Bolivian tin mines have been shut down by social unrest following Evo Morales' nationalization policy. This is an above the ground factor. China is a major producer of indium, and unlike the metal they aren't transparent. Indium costs 50 cents per HDTV and therefore the electronics manufacturers are more interested in an assured supply than price.
RobertInTucson
I haven't escaped from reality. I have a daypass.
Thanks Robert - You've convinced me - that there should be ample supply in the future, assuming the entire mineral supply chain doesn't collapse under it's own weight and cost structure. I do appreciate your detailed response - and I do love this site - it has made me both a better engineer and a better human being.
Regards,
Andy B
Alright. I got my first minion. I'm going to be the next Harmony.
RobertInTucson
I haven't escaped from reality. I have a daypass.
I wonder if gold demand will decline if it is abandoned as a wealth medium, throwing thousands out of a job. You can't eat gold but then again a can of baked beans needs steel and coal to make the can, potash and phosphate to grow the beans, diesel for the farm machinery and natgas to cook the beans.
Energy quality must have an earlier cutoff point than ore quality. I visited a limonite mine used to make iron using local charcoal. The ore is still there but the trees are now gone. It's like the nitrogen fertiliser outlook, not so much lack of ingredients as of cheap energy. Some types of bulky crushed rock (eg glauconite) make reasonable fertiliser but the transport is too expensive.
Maybe Hotelling type theories need to be revised to take account of future needs, like how are we going to make wind turbine towers if windpower is our main energy source. There is a cost to using FFs too fast and not setting aside some for the technology to replace them.
The demand for gem quality diamonds haven't abated and they aren't useful for anything. The value of gold isn't due to the fact a central banker will give you a wheelbarrel full of paper currency for it. People will always want gold. Rich people with lots of bling.
RobertInTucson
I haven't escaped from reality. I have a daypass.
Funny considering that industrial grade diamonds (a higher purity grade, at least for synthetic ones) sell for less than mined ones, and that diamonds of any kind can be made synthetically for a fairly reasonable price.
The only reason low purity diamonds sell for what they do and that synthetic diamond is so hard to come by is because of the De Beers cartel and marketing.
PS: Diamond, if cheap enough, has plenty of uses. Ones I can think of offhand are scratch-resistant eyeglasses, window panes, low-deformation refractive telescope optics, laser weaponry, and other uses where extreme hardness, a clear material, and a high index of refraction are all very useful.
Even with a price of $100,000/tonne and high milling costs, it could sell very well for things such as ultra lightweight and ultra-resistant eyeglasses which only use a few grams of material. It could also be used in specialized construction tasks (airplanes and spacecraft come to mind).
Unfortunately, that is unlikely ever to happen because doing so would render diamonds to be little more then costume jewelry.
Synthetic diamond also is of great interest to future semiconductor technologies; Not only does it offer some interesting advantages over silicon but has a thermal conductivity nearly 6 times as great as copper.
Great article. Nevertheless, peak metals is hardly a new concept - I heard university lectures on this topic complete with Hubbert-type curves in the late 1960s. That fact doesn't detract from its probable validity. A possible objection, mentioned above and in Colin Campbell's 2005 book, is that many metals are in disseminated deposits of radially decreasing grades (e.g., so-called porphyry copper deposits) and that for each economic mine, there are possibly dozens of similar-sized deposits with lower grades, and that the quantities in sea water or in the Earth's crust dwarf those in metal deposits. This doesn't detract from the concept of economic or ultimately recoverable reserves, but you also have to consider possible changes in technology or relative demand. In this regard, demand for some commodities, such as mercury, lead, cadmium, and asbestos, has dropped greatly owing to government regulation, at least for many uses, as also discussed in some earlier posts.
Furthermore, some commodities, such as mercury, are geochemically extremely rare, but extremely cheap to produce (all you need is a simple still, called a retort). Therefore, mercury probably had already peaked before being declared illegal, as noted above. Lead, in contrast, is basically a "free" byproduct of silver and zinc mining - and therefore has tended to remain relatively cheap (in part owing to battery recycling), even while those metals increased in price. (A huge demand for new batteries could change this equation.)
Molybdenum is tricky. When demand was low, it was largely a "free" by-product of copper mining, but when prices were high, the extra demand justified a different, expensive type of molybdenum-only mine, such as that at Henderson, Colorado. A recent change in technology from expensive, energy-intensive, polluting copper milling and smelting ("pyrometallugy") to cheaper, less polluting heap leaching, solvent extraction, and electrowinning ("hydrometallurgy") recovered copper, but not molybdenum, so molybdenum supply was shrinking as demand (and therefore prices) suddenly shot skyward (for use in steelmaking). It may take years to open or reopen the molybdenum-only mines, or revise the copper recovery technology, and in the meantime molybdenum prices should remain high. This does not imply impending geological scarcity - only changes in technology and the huge lead time for mines to open or reopen.
These examples are not meant to detract from the validity of the overall concept of peak metals (especially in response to peak oil) - only that the supply of individual metals may be sensitive to many geological, geochemical, and technological factors. Strictly speaking, each metal or commodity should therefore be considered as a special case, especially in considering variations in production and price histories.
BTW, an attempt to substitute aluminum for copper in wiring led to many house fires in the 1960s, as I recall (i.e., it was largely unsuccessful). Aluminum is extremely common geochemically (bauxite ore is a special type of tripical "dirt"), and its cost basically reflects the cost of electricity at the time and place it is produced - another special case (at the opposite extreme from mercury, perhaps). Peak aluminum would therefore probably imply no longer affordable electricity.
It appears that not mentioned so far is that many of these rare elements are by-products of copper and zinc mining. This puts a limit on the supply as their demand increases, for copper and zinc production cannot be increased at will. Uranium from the Olympic Dam mine is also a by-product of copper mining. I have also glanced recently at the Minerals Handbook and saw that few of the rare elements have already seen quite large price increases.
http://www.inspect-ny.com/aluminum/alreduce.pdf
The executive summary is that aluminum connectors are trickier than copper connectors. It can be done right... or wrong.
RobertInTucson
I haven't escaped from reality. I have a daypass.
Thanks for the link.
I was under the impression that a sacrificial metal like zinc could be used at the juncture to inhibit oxidation of the aluminum surface. Have you heard of anything of this sort?
I'm the wrong kind of electrical engineer for this. I design sillycon cheeps. Sacrificial zinc can keep steel from rusting but I think aluminum is too reactive for this. What saves us is that aluminum oxide binds tightly to the metal preventing any additional oxidizing after an Al2O3 coating is formed.
When aluminum is connected wrongly, stresses from thermal cycling or whatever continuously exposes more metal by cracking, which oxidizes. The oxide is an insulator. Eventually the whole thing has too high a resistance for the current draw the circuit breaker allows and we have a fire.
It's possible sacrificial zinc will work. Check the electronegativity.
RobertInTucson
I haven't escaped from reality. I have a daypass.
http://en.wikipedia.org/wiki/Electronegativity
http://www.ocean.udel.edu/seagrant/publications/corrosion.html
No it won't work. Aluminum wants the oxygen more than the zinc does. Sacrificial magnesium might work but I still think the aluminum is going to grow an oxide layer.
When I was an airforce contractor, we put together aluminum racks with steel screws. The aluminum has a chromium anti-corrosion coating and the steel has a cadmium anti-corrosion coating but I still thought it was a dumb idea. The cabinets don't bear a load so it's a cosmetic issue only. I just don't like designing things like that.
RobertInTucson
I haven't escaped from reality. I have a daypass.
Robert,
Thanks for the additional links.
It motivated me to dig more.
Apparently zinc sacrificial anodes are used in boating. (I'm not a sailorman.)
One explanation of metal galvanic corrosion can be found here (search for "zinc"):
http://forums.firehouse.com/archive/index.php/t-58808.html
Interesting topic. I didn't know copper was a big no no on aluminum boats. Thanks.
Very interesting comments, Metalman, thanks! I didn't know that people had tried aluminum for wiring houses in the 1960s. I knew that it was tried in the 1930s in Italy, at the time of the sanctions (Italy was the Iran of the time). In both cases, it seems that it didn't work. Some people say that it will be easy to substitute copper with aluminum after that copper starts being too expensive. Maybe not.
Incidentally, I think in your last sentence you meant "peak copper" not "peak aluminum". Aluminum is so abundant in the crust that we'll be able to have soda cans forever, well... at least as long as we have copper wires to carry electricity to the smelter!
Ugo Bardi
www.aspoitalia.net
No, actually I did mean to say "peak aluminum". We'll never run short of the raw material, sure, but obtaining the metal requires a high level of technology (inaccessible during most of the 19th century, when silvery Al metal was considered the platinum of its day) and a huge amount of electricity (to break all of those very strong aluminum-oxygen bonds). When and if electricity becomes too expensive, or the level of technology falls sufficiently, abundant Al-metal will become a thing of the past. Copper metal, on the other hand, occurs in the native state in nature, or can be smelted from its sulfides in a campfire, or can be obtained for free simply by placing iron scrap in acid mine drainage (a formerly commercial technology called cementation), so we'll always have it in some quantity, even if we're then fighting over it with bronze (copper plus tin) swords.
Great article Ugo, thanks.
From the tone of some of the responses so far it seems that the notion of the declining availability of various materials is secondary to our ability to find alternatives, very often inferior ones at that.
I think the point you were making is lost on those.
I'd like to take this opportunity to thank you for another fine article you authored Gaia's Fever which gave me a deeper understanding of the relationship between Global Heating and the formation of oil deposits.
Thank you for that!
I've long been curious about peak metals -- so I found this article very interesting.
Random comments:
1. I think there is a tendency for various peakings to converge via a few different mechanisms. E.g. peak oil accelerates the peaking of gas and coal via substitution. But it also accelerates the peaking of some metals because of the greater efforts needed to access and refine oil. On the other hand, the rising cost of energy raises the bar on what's economically recoverable for metals, diminishing reserves.
2. One of the differences between energy and metals, certainly the two key ingredients of the modern era, is that energy is always convertible to some extent whereas metals often do not interchange. Therefore there is a greater vulnerability to the peaking of a few critical metals that don't interchange. There's no analogue to coal. I'm saying all this: but is it true?
3. I wonder if anyone has discussed resource depletion from a strictly mathematical point of view. E.g. if one throw pennies on the floor, how much effort does it take to collect 50%, 90%, 95%, 99%, etc. Or suppose one buries them in the back yard at various depths, etc. Fractional dimension distributions, etc. Is there any way to justify theoretically Hubbert's empirical observations?
4. Hydrocarbons and metals are in decline, i.e. underground, non-renewable resources. (Water too, partly.) What's left? What we can grow and harvest sustainably on the surface. Things will be different.
For 1, agree. In energy terms, many metals are expensive to recover, with the poster child being aluminum, perhaps. Lead, on the other hand, can be smelted from its sulfide ore (galena) in a candle flame - I tried that myself in high school. Pretty low tech and useful if you need bullets, perhaps. The sulfur dioxide sure stinks up the house though.
For 2, yes, in many cases. For example, there's no other metal but mercury that's liquid at room temperature. If you have a mechanical device that needs a liquid metal electrical conductor at room temperature, say to complete a circuit, there's no substitute (you might want to redesign your device, however). On the other hand, abundant substitutes are available for mercury's former uses in thermometers, batteries, pesticides, etc.
For 3, yes - basically the same treatment, I think (see discussion in the 2nd Hubbert's Peak book by Ken Deffeyes). Metal recovery from a mine and mill is hardly ever more than 80-90% of what ore assays yield (but that's way better than for oil). So, as for oil, only recoverable metal constitutes reserves. Heap leaching of extra metals from mine dumps with waste acid from smelters is then somewhat analogous to tertiary recovery in an oil field - it can't reverse the production decline, but can add slightly to the ultimate production total. The crustal abundance fallacy for metals is somewhat analogous to asking how many tons of dirt and gravel you would be willing to sift through to find a penny. It's always there, if you want it badly enough, but are you going to want to look for a second penny afterwards? Or want to produce a ton of pennies? (Panning for low grade gold in freezing cold streams is somewhat analogous.)
For 4, some metals, such as aluminum and iron, are extremely common geologically, so we can't "run out" of them in a geological sense (although both require considerable energy and non-trivial technology to recover). And, as for oil, the easiest, nearest-surface, most profitable metal reserves are ALWAYS mined first. So, as has long been recognized, after an energy crisis or technological collapse, we may well all be fighting over metal scrap - many of the metals left in the ground will, with certain minor exceptions (like old mine dumps or unflooded, uncollapsed old mine workings) be essentially unrecoverable, at least in bulk.
Most of the new solar thin-film technologies use metal combinations like cadmium telluride, gallium arsenide, or the triple play gallium indium phosphide which needs phosphate ore as well. If these are all past peak production then I would imagine these options could become uneconomic pretty quickly.
AFAIK, there are few or no separate cadmium, tellurium, gallium, arsenic, or indium mines as such. Without looking them up individually, they mostly sound like minor (trace) elements that are produced as by-products of mining and smelting of the major metals. Their production limit is therefore directly related to the mining of the major metals and to the marginal extra cost of their extraction from the ore, mill, smelter, refinery, or waste stream. This cost can be high for trace elements. Their price tends to reflect demand and their supply is pretty inflexible, with limits set by the production of the major metals. Individual details may differ (poisonous arsenic is relatively abundant, as is poisonous cadmium) - that's just the general principle.
Hi Udo, Marco,
Thanks for a great post! It is interesting how many of your fits are close to the reserves.
Dave
It occurs to me that nations could hold strategic reserves in commodities other than petroleum eg SLR strategic lithium reserve. The idea being that the probable cost of a supply disruption is greater than the cost of financing the storage sites and interest foregone on the alternative investment. Maybe this will happen within a decade.
Of course another strategy is to intimidate suppliers with a veiled threat of invasion. Or even 'loss of friendship', to wit GWB's bullying of Australia to supply uranium to India. That country has not signed the nuclear nonproliferation treaty unlike certain countries GWB doesn't like.
Out of fear of World War II style submarine warfare from the Soviets, the US government began establishing huge strategic reserves of many imported metals and other commodities during the Korean War in the 1950's - metals such as tungsten and tin. At the time the government was buying any ore concentrates presented at a guaranteed minimimum price (like it did with gold during the 1930's), which allowed essentially every marginal mine in the US to go full tilt (before and after that it was always the highest grade, lowest cost producer that ruled, because potential supply always exceeded demand). The program came to an abrupt end in 1957, and almost all the mines closed. After that the US had no idea what to do with these stockpiles, many of which became less strategic as technologies changed (e.g., tin is no longer used to coat steel in "tin cans"). So it started selling them off to raise revenue, disrupting world markets and economically destroying many of the same domestic mining operations that the stockpiling program had initially helped. Now almost all tungsten and tin must be imported from SE Asia, mainly China. Tungsten remains strategic, mainly as tungsten carbide for drill bits (its use in incandescent bulbs is being phased out).
Most countries use tungsten for armor-piercing shells, but the US didn't want to become wholly dependent on China for such ordinance, and so it started using uranium that had been depleted in fissionable U-235 (the leftovers from bomb making - still notably radioactive, although U-238 has a decay half life of 4.5 billion years). So the mideast is now littered with fragments of depleted uranium, in part owing to a tungsten stockpiling program that ended in 1957, and what happened to that stockpile.
For these historical reasons, I don't think the US government will start stockpiling strategic metals again, and the strategic petroleum reserve is probably too small have any lasting impact.
It should also be noted that uranium is simply superior to tungsten for armor piercing shells. Even if fuel enrichment hadn't been churning out DU and the strategic metals program hadn't disrupted production capacity of tungsten, there would be a strong push to use uranium shells.
Possibly it has superior properties, I don't know. It presumably is also much cheaper. Banned DDT and mercury may have been cheaper and superior pesticide ingredients too, or lead cheaper in white paint and advantageous in gasoline, and banned CFC's certainly were cheaper and superior for air conditioning, but that misses the point. Would I want my own country "liberated" via the use of enormous quantities of such shells, if there were a well-known, less toxic viable alternative? Or would the uranium be more analogous to the lead in a bullet with my name on it: would its chemical toxicity (or radioactivity in the case of uranium) be the least of my worries? A tough call for troubled times, I guess.
I do know that uranium ions, like lead ions, can substitute for calcium ions (they all are about the same ionic size), including in the mineral apatite, the main ingredient in your teeth and bones, and also the raw material (as phosphate rock) from which phosphate fertilizer is prepared (uranium and fluorine are generally removed in processing the fertilizer). Radioactive strontium substituting in teeth and bones was a main reason for the surface test ban treaty. You are what you eat, especially as a child.
BTW, in my original post I forgot to mention that a rather large tungsten mine in South Korea was one reason for the US stockpiling tungsten in particular during the Korean War, and for stopping when the war ended.
Unlike oil, metals really do have an abiotic origin. At what rate does a plume of metal bearing magma ooze out of the mantle and condense in the Earth's crust close enough to the surface? I'm not a geologist so I wonder if anyone has measured this?
Many of our richest metal mines are former asteroid strikes. For example the Sudbury nickel mine. In the long run, at random intervals, this is a replenishing resource if we survive the initial discomfort stage.
RobertInTucson
I haven't escaped from reality. I have a daypass.
"if we survive the initial discomfort stage"
Put this one down for droll understatement-of-the-week! LOL
I am a geologist, and the Sudbury nickel-palladium-platinum mine remains controversial. Most today accept it as the site of an impact, but far fewer accept that the extraterrestrial object was necessarily the source of the metals (ditto for Bushveld chromium-platinum mines in South Africa). There are many otherwise similar mines (e.g., Stillwater in Montana and Noril'sk in Russia) that show no indications of an impact. Your argument is more convincing for the Moon, and has been used to justify lunar prospecting and mining. It also probably applies to Mars.
In this regard, miners are a pretty conservative bunch - you could call mining the world's oldest TECHNICAL profession, with a direct line of descent going all the way back to the first flint-using cave man. Petroleum geology is an infant by comparison (and it looks like it may never get a chance to grow up much).
Most terrestrial ore deposits are deposited from aqueous fluids (water or supercritical steam), and this requires that they form at or fairly near (within a few kilometers of) the Earth's surface, where open cracks are possible. They may later be buried much deeper without harm - there is no critical "oil window" of depth as there is for petroleum. They are constantly being eroded at more or less the same rate that they are being created - but on time scales far too long to make any difference to human civilizations. That is, if we mine the rich ores on or close to the surface, some other species will have to mine the ores much later revealed by deep erosion, or that formed later. As for everything else in geology, there are of course minor exceptions (e.g., "black smoker" type metalliferous deposits actively forming on the sea floor; making your own sea salt by evaporation of sea water).