Saudi Arabia - production forecasts and reserves estimates
Posted by Euan Mearns on August 30, 2007 - 10:27am in The Oil Drum: Europe
In his recent post, Ace assumes ultimate recoverable reserves (URR) in Saudi Arabia to be 175 Gb (billion barrels). With 112 Gb already produced, that leaves only 63 Gb remaining. Colin Campbell (the founder of ASPO) has estimated total reserves for Saudi Arabia of 275 Gb (news letter 66), believed to be C+C+NGL (crude oil + condensate + natural gas liquids). There is an enormous discrepancy between this and Ace's analysis that ought to be explained.

This post is a brief summary of my views on Saudi reserves and production. My conclusion is that Saudi Arabia likely has at least 120 Gbs of remaining reserves (C+C+NGL) for a URR in excess of 240 Gbs (C+C+NGL). The remaining reserves according to this analysis are almost double those reported by Ace.
The importance of reserves and production forecasting
The point I have reached in my analysis of peak oil and energy decline is that reserves and production forecasting are of paramount importance. It seems increasingly likely to me that Planet Earth has ample supplies of alternative energy that may be gathered (nuclear and renewable solar sources) and which may replace declining fossil solar fuels when that happens. The major challenge that confronts us is not a lack of energy or engineering solutions but one of political, institutional, corporate and personal behaviour. The human race seems intent upon running for the edge of an energy cliff. Persuading politicians and OECD institutions now that energy decline is a very serious threat to the future of industrial civilisation is the single most important task that confronts us. Reliable and credible energy forecasts lie at the heart of that task.
Forecasting oil, gas, coal, uranium reserves and production is a highly complex process, not to be taken lightly. It is therefore with some reservations that I present this view on Saudi Arabian reserves and production as I simply do not have all the information required to do this job reliably. This seems an appropriate time to quote Colin Campbell's 10th commandment:
ALL NUMBERS ARE WRONG – THE QUESTION IS : BY HOW MUCH ?
I will follow a combined bottom up and top down approach, drawing on the work Stuart Staniford and I have done on Ghawar, Aramco reserves estimates (pre-nationalisation based on BP data), Aramco forecasts for new projects (pdf) and Hubbert linearisation.
Why C+C+NGL
All the figures presented here are for C+C+NGL making direct comparison with Ace who has used C+C only, problematic. My apologies for that, but I have good reasons for doing so.
The first is laziness. I find the BP statistical review of world energy to be a very readily accessible source of data which I use all the time - and BP quote C+C+NGL.
The second is the fact that NGL is a vital constituent of any petroleum system. In simple terms, the kerogen rich petroleum source rocks produce progressively lighter hydrocarbons with increasing pressure and temperature during burial. Starting with crude oil, the kerogen will then produce light oil, condensate, wet gas and once it is near completely cooked it will produce dry methane. So NGL, which condenses out of wet gas is a vital constituent of any petroleum system and should not be ignored in my opinion.
And third, gas production in the Middle East has been relatively low to date owing to remoteness from European and North American markets that historically have been served by local sources of gas. With increasing amounts of liquefied natural gas (LNG - not to be confused with NGL) now being produced, NGLs are tending to make up a significant amount of new production that is coming on stream. Ignoring NGLs at this stage, therefore, may present an unduly pessimistic picture.
However, it must also be pointed out that the energy content of Saudi NGL is about 70% of Saudi crude oil. So 1 barrel of NGL is not equivalent to 1 barrel of crude oil in energy terms. No adjustment has been made for the differing energy contents.
Saudi official reserves and their decline
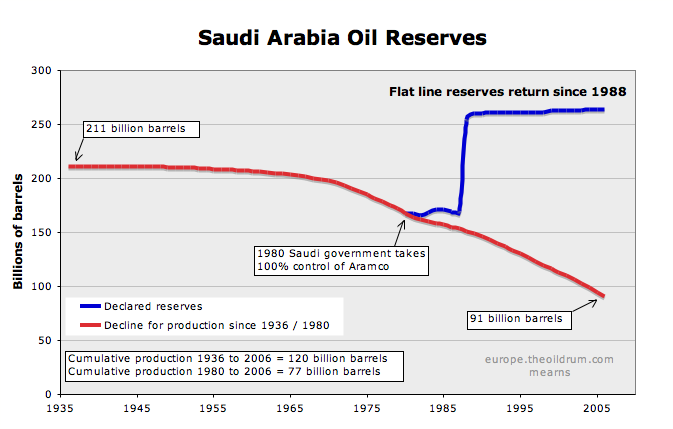
The starting point for this analysis is to look at the official Saudi reserves estimates for 1980 as stated in the BP Statistical Review. A figure of 168 Gbs is quoted. This is the figure carried by Aramco when it was run by American companies, pre-nationalisation. As far as we know, this was an objective assessment of recoverable reserves at that time. Since 1980, Saudi Arabia has produced 77 billion barrels and declining the 168 figure for this production leaves 91 billion still to be produced, an observation made by Robert Rapier in an earlier post.
However, since 1980 there have been significant improvements in production technology, in particular the advent and widespread use of horizontal wells and 3D and 4D seismic that enable more accurate targeting of by-passed oil. This has lead to an improvement in recovery factors since 1980, and the figure of 91 Gbs remaining may justifiably be adjusted upwards to account for this.
Using the API Facts and Figures Centennial edition (1959) production data from 1936 to 1966 and BP production data from 1966 to 2006 shows that Saudi Arabia has produced 120 Gbs to date. Anchoring the production decline profile (the red line) on 1980 points to initial recoverable reserves of 211 Gbs with 91 Gbs remaining. But as already stated, these numbers should perhaps be adjusted upwards to account for improved recovery factors.
Conceptual production forecast
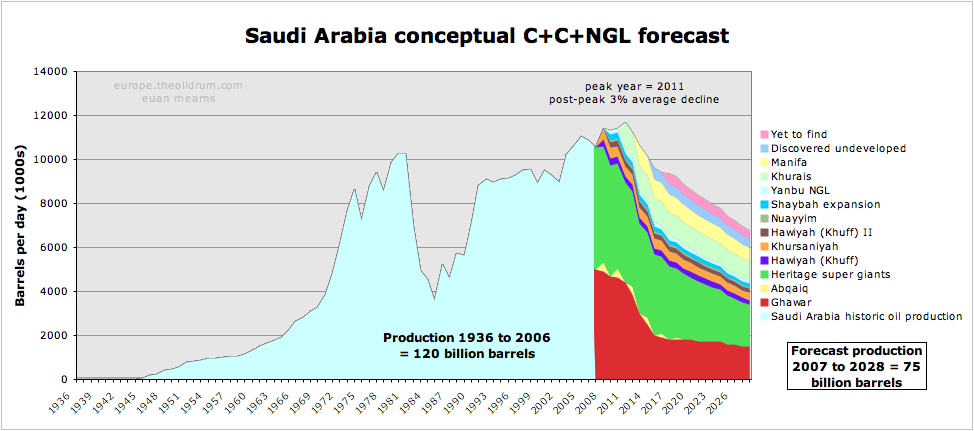
Forecast numbers are production capacity. Actual production may be lower depending upon demand. Click all charts to enlarge
The conceptual production forecast for Saudi Arabia has the following assumptions:
Ghawar
The Ghawar forecast is based on the base case revision 1 model I presented here. This is truly a bottom up analysis based on combining the reservoir volume determined from published maps and reservoir data combined with estimates made of the depletion state of the field estimated from published 3D models. The step down in production in the interval between now and 2017 represents the gradual death of northern Ghawar and transferral of production to the south which is much less depleted and may sustain a reduced plateau for many years.
Between now and 2028, 21 Gb of production is shown of an estimated 40 Gb remaining reserves. Some time beyond 2028, Ghawar production will go into rapid decline as the south end of the field becomes exhausted.
Abqaiq
Abqaiq is the most mature of the Saudi supergiants. The status of Abqaiq is rather obscure. The Linux map discussed here and subsequent posts shows oil remaining only in the crest and ridges of the structure. Jaffe and Elass (pdf) show zero production for 2004, although this may be clouded by periodic inclusion of Abqaiq production together with Ghawar. Multi-phase pumps (pdf) have been deployed to help produce the remaining oil.
Abqaiq is an ageing queen that no doubt would benefit from periodic rest and I have therefore conceptually shown sporadic annual production of up to 400,000 bpd that is turned on when needs require. A total of 657 million barrels of Abqaiq production is in the model.
Heritage super-giants
The heritage supergiants are those mature fields that together with Ghawar and Abqaiq have made up Saudi production for the last 50 years. These include Safaniyah, Berri, Shaybah, Qatif, Marjan, Zuluf, Abu Safah and the Hawtah trend fields. These fields are much less mature than Ghawar and it is difficult to estimate their future performance. The oil in Safaniyah, Zuluf and Marjan is very sour (contains high sulphur content) which creates refining and hence marketability problems. I consider it likely that these fields are not producing flat out but are production constrained owing to poor marketability of their oil. The Saudis are taking steps to increase their own refining capacity to deal with this problem.
It is difficult to know what decline rate to apply to this group of fields. Some, like Safaniyah and Shaybah may not decline at all in the foreseeable future. Whilst others like Berri and the smaller Hawtah trend fields may experience more rapid decline in the years ahead. Jaffe and Elass report natural decline rates of 7 to 8% that is stemmed to 2% by intervention. In the interest of being conservative, I have declined the heritage assets at a rate of 5% per annum. This may prove to be too high. They contribute 27.5 Gbs to 2028.
New Fields
New Fields are based on the Saudi Aramco projects time line, posted by Ace. Project delays have been a common feature of the recent commodities bull run and delays have therefore been built into the model.
Hawiyah (Khuff), Khursaniyah, Hawiyah (Khuff) II, Nuayyim, Shaybah expansion and Yanbu NGL have all been delayed by one year. Khurais and Manifa have been delayed by 2 years.
Two projects - 2007, Khursaniyah ethane+NGL, 290,000 bpd and 2008 Yanbu ethane + NGL, 195,000 bpd - are not included because it is not clear that these are genuine liquids projects. Ethane is a gas.
The new projects are all included at their nameplate capacity but are declined at a rate of 2% per annum thereafter.
Discovered undeveloped
A 500,000 bpd allowance is made for discovered undeveloped fields from 2015 that are declined at 2% per annum thereafter.
Yet to find
A further 500,000 bpd allowance is made for fields as yet undiscovered from 2017 (10 years from now) that too are declined at 2% per annum.
All this is speculative and conceptual. It seems unlikely in an oil rich country like Saudi Arabia that oil developments will grind to a halt after Manifa - thus it seems prudent to include some allowance for these future but as yet undetermined projects.
Putting all this together provides the conceptual production forecast model shown above. The peak in liquids production is 2011 and the average post-peak decline is 3%. The modelled decline and depletion rates are shown below. Depletion is based on a URR of 240 Gbs (see the following section). The reserves depletion rate cannot go on rising forever, and at some point in the future, the death of S Ghawar (and other supergiants) will lead to periods of accelerated decline that will lower the reserve depletion rate.
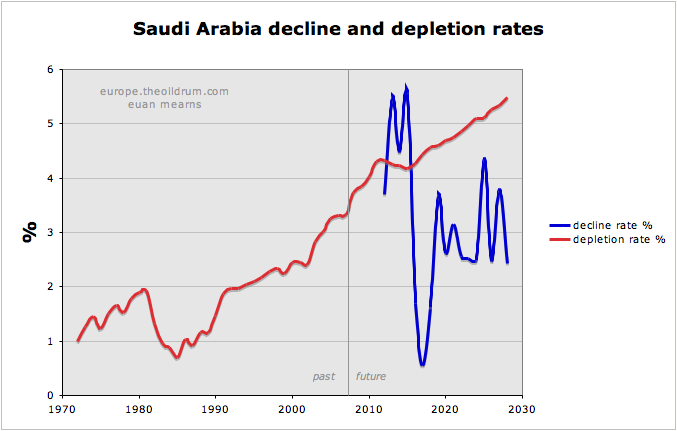
Decline rate = year on year change as % of production that year.
Depletion rate = annual production as % of remaining reserves based on an assumption of 240 Gbs URR (see following section)
| Asset | Production allocation 2007-2028 Gbs | Hydrocarbon |
|---|---|---|
| Ghawar | 20.9 | Arab light |
| Abqaiq | 0.66 | Arab light |
| Heritage assets | 27.5 | mixed, biased sour |
| Hawiyah (Khuff) | 2 | NGL |
| Khursaniyah | 3.2 | Arab light |
| Hawiyah (Khuff) II | 1.6 | NGL |
| Nuayyim | 0.61 | Super light |
| Shaybah expansion | 1.5 | Extra light |
| Yanbu NGL | 1.2 | NGL |
| Khurais | 6.7 | Arab light |
| Manifa | 4.5 | Arabian heavy |
| Discovered undeveloped | 2.2 | |
| Yet to find | 2.0 | |
| Total 2007 to 2028 | 75 |
Hubbert Linearisation
Regular readers of The Oil Drum will recognise this Hubbert Linearisation (HL) chart that I have posted many times on various threads. When it was first posted it received cries of derision from certain posters because my favoured trend is the "stretch HL" drawn between 1991 and 2005 (the red line). How could anyone have the audacity to draw a trend between two points pointing to 240 Gbs whilst there was a well-defined linear trend pointing to around 180 Gbs (the blue line)?
Saudi oil minister Ali I. Al-Naimi holds Saudi Oil production and the future of industrial civilisation in his hands
The logic is this:
We know for sure that in the period 1991 to 2002, Saudi Arabia was not pumping at capacity. The southern third of Ghawar (Haradh) was'nt even developed and numerous discoveries were standing idle, we saw $10 oil in 1998 and Saudi Arabia probably had over 2 million bpd spare capacity. The linear trend from 1991 to 2002 therefore does not see all the reserves and it seems highly likely that this will underestimate the Saudi resource.
1991 (GW I) and 2005 were two years that Saudi Arabia was likely pumping at or near capacity. It is hypothesised that had they pumped at capacity for the interim period then the HL would have declined along the red line and would be pointing towards 240 Gbs.
The red symbols represent the production forecast detailed above and needless to say I was fairly satisfied to see these lining up along my stretch HL trend. This doesn't make it right, but it certainly adds a degree of internal consistency. 2006 production is the last blue symbol.
There has been much debate about HL on TOD over the past year ranging from those such as Westexas who have blind faith in the method to Robert Rapier who has expressed doubts that HL has predictive qualities. I have always adopted a moderate view acknowledging usefulness so long as the limitations are recognised and understood. On this basis for the time being my view on Saudi reserves of C+C+NGL is that these will be at least 240 Gbs.
Downside risk
Staurt has recently circulated an internet chart of Ghawar production that shows 4 million barrels per day (mmbpd) for 2007. This is about 1 mmbpd lower than shown in my production model. The provenance of this data is unknown, as is its reliablity. 4 mmbpd, however, matches anecdotal evidence from other sources considered to be reliable.
The reduction in Ghawar of 1 mmbpd over 2 years as indicated on this chart matches the decline in Saudi production over the same period. This brings us back to the question of why Ghawar production may have fallen at a rate of 10% per annum for two years?
One possibility is that the depletion state of Ghawar is more advanced than was concluded in my analysis and that Ghawar is now on the slide indicated in my forecast to begin in 2011. It is therefore within the realms of possibility that the Saudis have been caught unprepared for a collapse in N Ghawar production, and the scramble for rigs and new projects that is now underway has come too late to forestall a drop in their productive capacity. The altenative explanation is that mature parts of N Ghawar are being rested to allow new wells to be drilled and reservoir pressure to rise etc.
Bringing N Ghawar decline forward by 4 years produces a modified forecast in the near term. Saudi watchers will note that 2005 becomes the peak year in a 30 year undulating plateau spanning 1990 to 2020. 5 billion barrels production are lost in the period to 2028 relative to the base case forecast presented above.
Summary
| URR Gb | Remaining Gb | Recovery % | Notes | |
|---|---|---|---|---|
| Ace | 175 | 63 | 25 | C+C only |
| Pre-nationalisation | 211 | 91 | 30 | minimum |
| Mearns | 240 | 120 | 34 | minimum |
| Campbell | 275 | 155 | 39 | |
| Saudi official | 384 | 264 | 55 | BP+produced |
The recovery factors are based on an ussumed 700 Gbs of original oil in place. This is the figure reported by Baqi and Saleri and by Colin Campbell.
The projected recovery factor for the official Saudi reserves is unrealistically high for the whole country. 55% may be achieved in the N Ghawar production sweet spots but most certainly not in poorer quality reservoirs that make up much of the countries resource base.
In his analysis, Ace concluded:
it is now almost a certainty that Saudi Arabia passed peak C&C production of 9.6 mmbd in 2005
In reaching this conclusion, Ace assumed that Saudi Arabia had no market for most of its sour crude oil and allocated only 20 billion barrels to sour crude reserves whilst acknowledging that the actual figure may be much higher. 85 Gbs recoverable reserves were booked for Ghawar, whilst Stuart's analysis suggested 96 Gbs and my base case analysis suggested 97 Gbs. Not all new projects were included at nameplate capacity and NGL is not included in this analysis of C+C only. It seems that worst possible case assumptions have been made at each stage which not surprisingly then leads to a low estimate of reserves and a picture of imminent production collapse. The indicated country-wide recovery factor of 25% is very low.
Campbell's analysis of Saudi reserves is rather superficial. He recognises official Saudi estimates of original oil in place to be 716 Gb but prefers a figure of 600 Gb based on anecdotal evidence from reliable sources. A generous 45% recovery factor is applied to the 600 Gbs to get a figure of around 270 Gbs. This figure matches Saudi official reserves estimates and it is suggested that the Saudis report URR and not remaining reserves. This certainly fits the practice of showing no decline in the annual reserves return.
Time to recall Colin Campbell's 10th commandment:
ALL NUMBERS ARE WRONG – THE QUESTION IS : BY HOW MUCH ?
It is up to individual readers to decide where the truth lies.
Acknowledgement
Professor Goose, Stuart Staniford, Khebab, Luis de Sousa and Ace reviewed the text and provided helpful comments. This does not mean they necessarily agree with the content.
Further articles on The Oil Drum about Saudi Arabia:
by Stuart Staniford
- Saudi Arabia and Gas Prices
- Depletion Levels in Ghawar
- The Status of North Ghawar
- Further Saudi Arabia Discussions
- Water in the Gas Tank
- A Nosedive Toward the Desert
- Saudi Arabian oil declines 8% in 2006
by Euan Mearns
- Ghawar reserves update and revisions (1)
- GHAWAR: an estimate of remaining oil reserves and production decline (Part 2 - results)
- GHAWAR: an estimate of remaining oil reserves and production decline (Part 1 - background and methodology)
- Saudi production laid bare
- Saudi Arabia and that $1000 bet
by Heading Out
- Simple mathematics - The Saudi reserves, GOSPs and water injection
- Of Oil Supply trains and a thought on Ain Dar
by Ace
Personnel
Editors
Contributors
Peak Oil Primers
Archives
- November 2010 (3)
- October 2010 (6)
- September 2010 (4)
- August 2010 (7)
- July 2010 (6)
- June 2010 (7)
- May 2010 (2)
- April 2010 (8)
- March 2010 (4)
- February 2010 (6)
- January 2010 (3)
- December 2009 (5)
- November 2009 (8)
- October 2009 (12)
- September 2009 (6)
- August 2009 (5)
- July 2009 (11)
- June 2009 (8)
- May 2009 (16)
- April 2009 (10)
- March 2009 (7)
- February 2009 (10)
- January 2009 (15)
- December 2008 (9)
- November 2008 (9)
- October 2008 (9)
- September 2008 (13)
- August 2008 (10)
- July 2008 (14)
- June 2008 (23)
- May 2008 (16)
- April 2008 (12)
- March 2008 (16)
- February 2008 (9)
- January 2008 (13)
- December 2007 (13)
- November 2007 (16)
- October 2007 (22)
- September 2007 (8)
- August 2007 (9)
- July 2007 (16)
- June 2007 (8)
- May 2007 (7)
- April 2007 (7)
- March 2007 (10)
- February 2007 (10)
- January 2007 (12)
- December 2006 (9)
- November 2006 (15)
- October 2006 (4)
- September 2006 (5)
- August 2006 (5)
- July 2006 (9)
- June 2006 (5)
- May 2006 (10)
- April 2006 (9)
- March 2006 (13)
Vital Trivia
License

This work is licensed under a Creative Commons Attribution-Share Alike 3.0 United States License.
http://science.reddit.com/info/2k75q/comments
theoildrum authors thank you for helping them get more readers... :)
One observation: If you plug in the 2006 and 2007 year to date production numbers, the HL plot is reverting back to the 1991 to 2001 P/Q intercept line. This is consistent with the Texas model, where a careful analysis of the pre-peak data show that the most accurate pre-peak estimate of URR came from discounting the "dogleg up."
It's nice to see TOD contributers using objective terms such as "blind faith" for yours truly, especially when the available 2006 and 2007 data show the HL plot reverting back to the 1991 to 2001 P/Q intercept, which you have somehow failed to show.
Of course, one would think that an objective writer would at least acknowledge that my HL based warnings of an imminent Saudi production decline have--based on the production data--been correct. Could I still be wrong? Sure, if and when Saudi production exceeds its 2005 average annual production in a given calendar year. But until then, the production data are supporting a 2005 final production peak for Saudi Arabia.
WT I think the problem people are having and why they are slamming HL is that KSA puts being a swing producer above production rate. So they may not be maximizing production but trying to maintain a capacity buffer for emergency use even as they decline. If you add this concept esp if they are trying to maintain a 1mbpd plus buffer it skews the data.
The people that claim that KSA can produce more are assuming that they have a large buffer and some day will pump at capacity. While I think they generally don't have a lot of spare capacity and will only use it for short periods of time during major emergencies. So I think your right for "day to day" production but I also think KSA is not producing at maximum. Next of course the amount of spare capacity they have is unknown. What will be interesting going forward is if the bring large fields online and we see no change in production rates then we know that are working like mad to rebuild spare capacity. Over time we will eventually ferret out how much spare capacity KSA has and its nature at the moment I don't think we have enough information. However because of political reasons I don't think its all that relevant to daily production and your estimate are probably closer to the truth.
Finally my opinion is if you assume they want to maintain a spare capacity buffer even as they decline all the data seems to fit so I think this paper is making in correct assumptions.
One more thing KSA has adopted and in fact been a leader in developing technology to enhance production rates this is not
included. The dogleg for the US occurred because of a massive drilling campaign. KSA has a different profile but newer technology probably has resulted in inflated reserve estimates. KSA itself uses enhanced extraction rates to justify their highly inflated reserve estimates so you have to assume that they have seen some significant improvements in extraction rates from technical advancements. We have reason however to doubt this translates into higher final recoveries at high production rates.
So KSA production is not a black and white issue and its sad that its treated as such.
Everything Saudi Arabia has done in developing their oil resources has been aimed at maximising recovery at the expense of high production in the short term.
Ghawar alone could have produced at over 15 million barrels per day but has never done much over 5. The Saudis have also left huge fields lying fallow. None of this would ever have happened within the OECD.
There principal use of horizontal wells has been to maximise recovery from poorer quality reservoirs and to control water cuts in the vicinity of mobile oil water contacts.
The advent of new technology - mainly horizontal drilling and 3D and 4D seismic has led to a justifiable expectation of higher recovery factors over the years. The one-off reserves inflation in the 1980s and in particular the fact that they have not been declined for production since remains a seroius problem.
Why Euan, you almost sound like...
nevermind :P
I'm curious as to why these technologies have not turned around the Texas and North Sea declines.
BTW, a question I have been meaning to ask you. Were there ever any material restrictions on drilling in the North Sea?
Because these fields have been grossly mismanaged in such a way that most of the OOIP is now locked in no matter what kind of technology you bring into it. KSA has done a great service by slowly producing their oil to maximize long term profit. We at the USofA are concerned with this quarters shareholder earnings...
I nominate this comment for the top 10 list of most nonsensical comments ever posted on The Oil Drum.
We're not talking about turning around decline here but estimating URR.
The biggest hydrocrabon resource as far as I'm aware in NW Europe is not Statfjord, Troll, Brent or Forties but the Claire field west of Shetland. A huge accumulation of relatively heavy oil (20 api) in poor quality Devonian sandstone reservoir. This field lay fallow for decades as the oil was not producible using vertical wells - but much diligant work by BP (which I was involved in in a small way) has led to development of the best reservoir segments using horizontal wells. This has added to the URR of the UK.
In Norway, the giant Troll west field is gas with a thin oil rim. Norsk Hydro spent many years modelling the producibility of this oil using horizontal wells (I was also involved in a small way in that modleling work) - as it turns out Troll W became Norway's largest oil producer, I believe, for a few years. Again, this oil was not recoverable using vertical wells and producing this oil using horizontals has added to the URR of Norway.
If I could second what I take to be the thrust of this post. What I think I can see SA doing is shutting in premium quality production capacity such that X Mbpd can be turned on quickly. This capacity is the last bits of production from key fields (such as Abqaiq) and could be used to increase SA production for short periods of time (lets say up to 100-200 days).
Now there is a world of difference between a short term peak rate and long term base capacity. Its the former that SA is talking to the world about - but the later that people are assuming.
In this way SA can offset limited duration issues (say someone attacking Iran), but it doesn't deal with the base load of world demand.
So, in short - close down the scraps of the high quality fields against short term needs. Drill new fields to make up for the loss of base production in mature fields and keep long term total capacity stable. No increases in capacity over the 9Mbpd we are seeing, except for short emergencies.
Seems very sensible to me.
Correct but this introduces errors in estimating their true reserves and you must include the technology effect which offsets to some extent this spare capacity. Considering that this capacity is anywhere from 500k to 1mbpd or more and its been a systematic part of KSA production ( swing producer ) we have a fairly large margin of error in reserve estimate. However since HL is based on real production data not the probably offsetting effects of advanced technology and shut in capacity its probably closer to the right answer. So in general KSA has been shutting in capacity and using advanced technology to deplete the fields they do produce at a higher rate. The net result is they probably end up close to HL but its not simple. HL in effect hides this complexity its "builtin" people who disprove HL pull out one of the variables of their choice but don't acknowledge at the variables. Its pretty clear that KSA has been fairly aggressive in producing fields when they do produce them for example and its rumored that they produce to the point of field damage during crisis conditions.
I guess I don't see the point in discrediting HL its a tool and it seems to provide valuable information along with all our other information sources. And as far as the way people discredit it they simply don't understand how it works. But claiming that you can fit a lot of curves to a data set and thus one fit is wrong is .... I won't even go there.
One problem I have with HL based on KSA production history is that it implies some sort of predestination with regards to how fast they can pump oil and what the eventual yield will be. In reality, decisions that they make can obviously affect the near-term rate and the URR. Develop Haradh using MRC wells? Develop Khurais? Squeeze more oil out of Abqaiq with new technology? Will they get what they expect? Who knows, but in any case, there is no information whatsoever on these prospects embedded in past KSA production rates.
While it is very possible that they will never match the 2005 peak again, it doesn't logically follow that the decline rate and the URR are magically determined by a line drawn through a set of data points.
Both the US Lower 48 and Russia have made more oil than Saudi Arabia. If we construct HL models based on production through 1970 and 1984 respectively for the Lower 48 and Russia, the post-1970 and post-1984 cumulative production for the Lower 48 and Russia have basically been what the HL models predicted it would be.
My confidence in the HL method is based on an evaluation of the method as applied to several large producing regions, not "blind faith." I think that the method works because we tend to find the big fields first, and "Peak Oil" is basically the story of the rise and fall of large oil fields.
In my opinion, the HL method is controversial because people don't like the answers it is providing.
I'm not going to question your eyesight, but I will question the ability of the HL method to "see" how much oil is in Haradh (or Khurais, etc.).
Similarly, most reservoirs in the lower 48 (the East Texas field being an exception) have rather low recovery rates, mostly because they were produced early. If you and oilmanbob and thousands of others decide to go after a lot of that oil using EOR wo whatnot, won't that give a different production decline profile and a higher URR than predicted by the current HL plot? Now, there's no way Texas or the lower 48 are going to come close to re-peaking, but that is not the only consideration.
I don't disagree with your message. I just question one of your sales pitches.
In defense of WT and Hubbert linearsation-King Hubbert made his prdictions on crude plus condensate produced with primary and secondary production. What I'm talking about, and other companies too is the 390 billion barrels left behind in the lower 48 states as a tertiary development target has a huge absolute volume. To get the oil to an average 60% recovery, we're talking another 156 million barrels to be produced.
But lets get realistic about the situation I have a hard time believing that most fields can be produced at even 1/2 of the original production rate, and probably more like a quarter of the original rate seems a likely scenario. The whole reason the pressures were wasted was because the operators pulled the wells too hard. The THAI method seems to be great for making bitumen produce at very high rates, yet these are virgin reservoirs and still have solution gas, and the process isn't going to be suitable for rocks with a high proportion of limestone, like the entire Permian Basin. Think about it-the 700 degree temperature is going to turn that limestone into cement, which doesnt produce very easily. And, the process may not work at all on medium to light oil in great sandstone reservoirs. The best, most productive reservoirs like the East Texas field have already had 50% of the original oil in place produced by primary and secondary methods. It had a natural water drive in that field
We currently produce about 3.8 mbopd, and at the highest the US produced around 10 mbopd. If the tertiary guys could get that up to 5 mbopd I'd consider it heroic work. But we are consuming 21 million barrels of oil per day. That leaves a gap of 15 or 16 mbopd. The Canadian Bitumen might provide as much as 5 million barrels, so we are still looking at a shortfall of perhaps 10 million barrels of oil to be produced. Alan Drake's Electrification of Rail will save us another 2 to 3 million barrels, so we are still looking at a shortfall of 7 or 8 million barrels of oil that has to come from somewhere- and its obviously hybrids and increased cafe standards,bicycles, electric vehicles, natural gas to diesel from stranded natural gas. I'm not a doomer, but I sure think its going to take everone in the country and the world working together to keep reasonable prosperity . Look at the tail end of King Hubbert'curve-it trails off a long ways. Bob Ebersole
I take it you meant another 156 billion barrels.
But that's my point. The lower 48 production data to date has no information about the heroic efforts which could be employed to get that extra oil, and so an HL analysis would not account for it. If a massive effort could even slow down the decline in production, that would also represent a deviation from the HL prediction. Certainly not "Happy Motoring", but it will be needed for any kind of transition.
As for the East Texas field, sometimes it's better to be lucky than good. The recovery after secondary production will be around 75%, which is amazing given the haphazard way it was produced (30,000 wells etc.).
This in my opinion is correct. But was you fall back to the case that the future is similar to the past you get back on HL. This means that you should be careful about the validity of data points shortly after peak production.
Next HL probably stays optimistic post peak. Its implicitly assuming that the amount of work put into production is basically a constant with production dropping only from depletion effects. For oil its implicitly assuming that the number of new wells drilled is a simple function of the size of the field probably effectively constant. Its measuring the life/death cycle of the wells and I've not set around and figured out the actual well drilling pattern that gives this sort of Gaussian production curve. I think the key feature is actually the rate that wells are closed in not the details of the drilling campaign. The fact that the "death" of wells is directly related to URR is what gives HL its utility the drilling campaign itself just determines the height and slope of the curve but the death rate is the critical factor. The sweet spot for the HL method is the data between when the rate or production growth start decreasing and the peak. This is the cleanest data given HL's assumptions. The drilling campaign is in a steady state for the most part and changes in production are pretty much only from the death of wells. WT has in my opinion correctly applied HL thus I believe his results.
I guess if people are willing to take the data range from the first inflection point to the beginning of the peak plateau's and argue about HL I'd be more willing to listen.
Trying to prove HL wrong outside of its "sweet" spot is not interesting. Notice that given this analysis its pretty obvious that massive drilling campaigns post peak are probably simply extracting the resources faster and not increasing URR. Since so much of oil is in the long tail it will be a long time if ever before we find out what the real URR is. In any case the constraints on a good HL analysis are pretty obvious its surprising that people seem hell bent to disprove it. HL is not rocket science its a good simple model.
75 % recovery after secondary for east texas? isn't current recovery in the 50% range with a 99% water cut ? i dont see how east texas is going to get to 75%.
Actually, 75% is on the low end. I have several sources for this. A report prepared by U. Texas in 2003 said that as of 2003 5.3 billion barrels had been produce out of 7 billion OOIP (76%). The book Nontechnical Guide to Petroleum Geology, Exploration, Drilling, and Production by Norman J. Hyne says 82% will be produced, and Jean Leherrere estimates 85%. All secondary production.
u of texas and jean leherrere notwithstanding, i doubt the figure. but i cant say that i have read either or your references. i have never, ever heard of a secondary recovery project with anywhere near that recovery. gravity drainage, maybe, but that is not a secondary recovery method. my guess is that the ooip is understated. and of course the water injection may be completely incidental to the recovery by gravity drainage.
but i am always open minded and willing to learn something new. i will take a look at the references you have cited. and fwiw, oilmanbob quotes 50% a few posts up.
The following is from this abstract of a SPE paper.
Well said. This is precisely my problem with HL--it doesn't take into account things that we know for a fact can influence production volumes.
As one more example, consider the talk recently about how there has been a paradigm shift in OPEC's view of the market, and how they are apparently much more willing to restrain production and drive up prices. Whether this was caused by their seeing proof that $70 oil would not instantly wreck the US economy or their desire to maximize revenues as they approach the peak is, in one sense, irrelevant. The point is there seems to be at least one major factor influencing their production volume aside from geology.
Note my question up the thread--Why hasn't better technology reversed the Texas and North Sea production declines?
IMO, regardless of whether we are Capitalists, Communists or Britney Spears Worshipers and regardless of whether it is Texas, the North Sea or Saudi Arabia, we generally find the biggest fields first. A production peak does not mean that we stop finding fields and it does not mean that we stop trying to extract the last barrel of recoverable oil out of the reservoir.
It does mean that we can't offset the declines from the old, larger oil fields.
That is my point about using the wildly different post-peak Lower 48 and Russian production profiles. The post-1970 and post-1984 cumulative production numbers were basically what the HL models predicted they would be.
The thing about HL is it tends to give you a URR not surprisingly based on how the fields are developed. Its insensitive to the exact nature of the development except that the growth should reasonably follow the assumed population like pattern. It need not be maximum growth etc etc. It also probably underestimates the amount of oil extracted in the tail end of a fields life when more aggressive methods are used. But since its primary utility is near peak and post peak its faults probably don't effect its "predictive" power.
Its very much a sledgehammer and a simple tool but considering the uncertainties involved its seems to be a pretty good tool. If HL is pointing to peak you need in my opinion some strong evidence that the region is not close to peaking. Its simplicity is both its strength and in a sense its weakness. In general people that object seem to not understand it. Its a simple model of the exploitation of a resource that makes the assumption that future exploitation of the resource will follow previous methodology. I.e the future is like the past and any slowing in the growth rate of production is caused by depletion of the underlying resource.
Thus its a fairly sensible simple model and useful in the case of incomplete data. So far none of the arguments against HL are that strong in general its the bias of the people that dislike the model that reject it.
And finally the URR calculated but HL and by other measures is probably not the same number. This is easy to see for example since people that dismiss HL are assuming a massive investment will be made as a field declines to increase URR and also enhance production rates while HL does not make this assumption. This is why it does not capture the flat peak we find in practice or the so called dogleg. The assumption that the future is the same as the past fail at peak but it becomes strong afterwards.
Anyway I'm not going to debate HL the facts will become clear soon enough and with issues such as Export Land and the potential for the oil industry itself to crumble etc etc
I don't see the projected production rates as relevant now.
So I think HL's and all the other depletion based models are either irrelevant are close to irrelevant now. Politics, war, weather and economics will determine how much oil is produced from now on out and I expect the real amounts will be far less than predicted by depletion modeling. We are going to kill the golden goose.
I don't think there has been much investigation of this and I believe it may have significant explanatory power.
OPEC went through an early post-nationalization phase which was the equivalent of the kids finally getting the keys to the bank vault. There was little or no market discipline and the attempt was made to maximize immediate returns.
OPEC now appears to have significant market discipline and I suspect this is due to increasing financial sophistication and their own recognition that they have a finite resource and need to manage that finite resource to maximize value extraction. They see themselves as pumping dollars, not oil, and will act as necessary to maintain the value of the income stream.
I suspect that within 6 months we will see OPEC taking more oil off the market in anticipation of a US/UK recession.
"I suspect that within 6 months we will see OPEC taking more oil off the market in anticipation of a US/UK recession."
Interesting.
Finance markets seem to say (futures market) there'll be no recession.
Also, IEA seems to say that sub-prime (et-al) fiasco will not make a dent into oil demand.
But still OPEC will cut?
It'll be an interesting coming 6 months, whatever happens, that's for sure.
A year or two ago the Wall Street Journal looked at the predictive power of oil futures and concluded that they were utterly worthless more than about 6 months out. This differs from certain other commodities so they sought to explain this and their best guess was that the market lacked complete information (or transparency) thus making futures "bets" problematic.
"The greatest shortcoming of the human race is our inability to understand the exponential function." -- Dr. Albert Bartlett
Into the Grey Zone
Yes, but that was only for Oil futures market.
And I am now talking about the whole economy AND the next 6 months.
Apples and oranges?
Could the "dog leg up" in '03 not be a case of mild overproduction by KSA in their role as swing producer in response to the Gulf War? I'm not sure picking just two data points,'91 and '03, and assuming a steady state, sustainable rate happening at just those two points is good HL. But because they seemed to always be under or over producing, it makes their true producible reserves a mystery. Their reponse to any kind of supply problem in the past has typically been overproduction. The point that newer recovery methods should rightly add a lot of the bypassed oil from past bouts of overproduction to the older reserve numbers seems valid. But is this going to change the KSA peak time much?
The assumption that production needs to be maximized to do a valid HL prediction is just that and assumption with no supporting evidence. In fact the concept of maximizing production makes little sense. The modern practice seems to be to drill all the wells in the beginning. Thus production is 100% controlled by the depletion rate and their are a number of approaches in between. I think HL requires a number of years of a steady development program but I see no reason for this concept that the field development has to be maximized and its not clear what this even means. Better for HL is that the number of wells drilled each year is relatively constant.
But considering HL seems to work under a number of different types of drilling programs the exact nature of the program does not seem to be that important as long as its consistent.
Please explain how HL - or any method - is supposed to correctly divine the amount of oil in the ground if the rate of production - the only data it's given - is determined by economics rather than geology.
HL isn't magic; it follows the same "garbage in/garbage out" rule that every other algorithm does, and production data that is determined by fiat rather than geology is - when looking for geological limits - garbage.
Moreover, RR's theoretical examination of HL pointed out quite clearly that intentionally-constrained production will cause HL to give too-low results. It's pretty easy to see for yourself, though. Suppose a field comes online producing 1 unit of oil per day, and is developed in one of two ways:
If you graph that, the first approach will show a nice peak shape, and using data from years 6 through 16 gives a nicely-fitting HL that predicts an URR of 32 (vs. a true URR for that series of 36; not too bad when predicted from a currently-produced value of 24).
By contrast, using data from years 6 through 16 of the intentionally-constrained production gives a nicely-fitting HL (R^2 of 0.95) that predicts an URR of 22...which the other well management scheme has already exceeded.
And it's not like this second well development approach is somehow unreasonably unrealistic - the first approach is producing in excess of 1.5 units/day for the entire data period, so there's no difficulty in achieving 1.0 units/day with the constrained well. Moreover, the unconstrained well has a production shape (rise-peak-fall) that looks very similar to the "theoretical ideal" from Hubbert's 1956 paper, so this seems like input data that HL should be able to handle.
But constrained production makes it fail utterly.
The Saudis have tended to always under-produce their fields. Ramping to capacity does not necessarily represent over-production.
For several months I have been mulling how to interpret the dog leg up in the HL trend and settled on the "stretch HL" pointing towards 240Gbs some months ago as one likely scenario. You are right to say that using only 2 points is not good practice, but this was presented as a possible outcome / interpretation.
What I have done now is to look at the various components of Saudi production completely indpendently of HL. The Ghawar model is based on the work done and reported on earlier this year. The new projects are based on the Saudi projects timeline. Both these components can be viewed as "bottom up" analyses. The third element is the heritage super giants which I have simply declined at 5% per annum from past production levels - this is a top down approach.
These components are then summed and fed into the HL model to see how they fit. I was naturally pleasantly surprised to see them lining up along my stretch HL trend. The data match the model and are not used to constrain it.
Those who want to refute this model need to provide arguments for how each of the input components should be modelled differently. GaryP has said he thinks I'm over-optimistic on Ghawar. I simply disagree with that and the only way to resolve such differences is to wait and see what happens.
First how HL works has been a bit of a mystery. Or better why it would work. WebHubbleTelescope (WHT) has made some great comments on it. Its a birth death models what the heck does it have to do with oil ?
So I've proposed this is how it works.
Its measuring the life/death cycle of wells. They are born when they are drilled and die when they water out. So this pins the logistic equation to something that follows a life death cycle. Production rates are a good proxy for the life and death of the average well.
Next how the heck does this relate to reservoir size or URR.
The key insight here is that the changes in production become dominated by the rate of death of wells in a mature field and if the rate new wells are created is consistent then you have a heuristic to guess the point at which all well would be dead. The critical factor is that the change in production is now primarily because of the death of wells and new wells are being consistently added even though the rate production is increasing is beginning the slow. This means the field is well developed. You don't have to maximize production just be consistent.
The critical factor is that changes in production from births is now linear and non-linear effects are caused by the death of wells. This is related directly to the size of the reservoir. And easy way to think about it is drilling holes in a damn dead holes occur when the water level drops below the hole. Once you drill enough holes and watch the flow rates its fairly obvious that you can estimate how much water is in the reservoir. Or you could consider drilling holes in a bucket. This is actually close to classic calculus problems. And you can see that the critical factor is that the rate of change is governed by "dry" holes and I need to be consistent with how fast I drill new holes. So I can discount the effect of new drilling.
Now when do these conditions hold ?
1.) Once the rate of increase in production begins to slow.
2.) As long as the drilling campaign is consistent.
3.) When well deaths contribute a significant amount to the change in production.
And when does it not hold ?
1.) Early in the life of the field before its fully developed and well deaths are not important since this is what we are really measuring.
2.) During periods with the drilling campaign changes drastically. This is common near the peak in production and leads to changes in the field development in attempts to maintain and increase production.
3.) Slightly post peak you probably still have a extensive campaign going.
So this means you have two places to apply HL. On the upslope before the peak and on the down slope after the peak. The caveat is the downslope URR may be overstated if advanced technology has increased extraction rates but eventually it will snap back to the original HL plot as wells die faster.
And finally what is this URR ?
Its the reasonably recoverable URR it does not include the long tail 2bpd type production. Since well life/death is under economic control. This is a lot of oil thats not in the HL URR estimate and I'm sure its the cause of a lot of trouble. The HL URR should be considered the URR of semi-easy oil not total URR. The total is at least 10-30% higher but the last 10-30% will be recovered at low production rates with minimal economic gain. The reason its not in HL is that the rate of well death and the nature of the wells changes dramatically when you go to stripper wells. HL is measuring effectively low water cut production during primary/secondary production. Consider how much of the US production came from stripper wells and you will see why you have a disconnect between HL URR and other ways to measure URR. They are not the same variable !!!!
Now the key point is West Texas correctly did the HL analysis. From reading his posts I think he basically followed the same line of reasoning. He knew to correctly reject the dogleg and did the right thing and focused on steady production. Kudos.
If you don't believe in HL then use the following guidelines for your HL plots and lets look at where it fails and why.
I think we have enough data to prove/disprove this physical explanation for HL.
I think it's a most salient point made by memmel about the URR predicted by HL being more a real world than theoretically producible thing (at least out to a production peak). Hubbert's model is at it's best when projecting peaks for something with stable, slowly changing inputs as, for example, in conventional crude in big bodies of land with fairly constant well operation strategies. The model is at it's worst when dealing with sudden new modes of extraction as, for example, in the recent rapid addition of deep water oil. For the case of KSA, the well operation strategy at first may seem controlled totally by chaotic geopolitics, the price of oil, etc. But, according to Simmons anyway in his book Twilight, KSA's well management was all along controlled more by geophysical (and thus HL friendly) factors than we may think. Off and on bouts of overproduction followed by long periods of resting the reservoirs was pretty much the well operation strategy for decades! First, there was a lot of overproduction. To quote Simmons:
And in discussing the production cutbacks of the '80s and '90s, Simmons had this to say:
Simmons based his conclusions not on public perceptions or speculation, but on the mountain of little studied technical papers filed by KSA's technicians. The public perception is, of course, that they cut back to manipulate the price of oil.
As for the '90s period, where a lot of underproduction is assumed in the higher HL fit through the "dog leg" away from the more normal straightline data points, you had yet another production ramp-up from the first Gulf War followed supposedly by more cuts to prop up the price of oil. But Simmons had this to say on that:
Could it be that the straight line HL fit through the "underproduction" '90s is actually a fit through the decades long well strategy of KSA in dealing with bouts of overproduction and is based mostly on geophysical, not economic or other factors and, amazingly enough, winds up going straight through the data points for '06 and '07 where we know for a fact there is no underproduction? I'm sure there was some excess capacity in the '90s, but the HL fit suggests that then as now, there may not have been much in terms of light sweet crude. The spare capacity now is mostly heavy sour with limited marketability. I don't think picking two Gulf War years, '91 and '03, and drawing a straight line between them detouring decades of data points that paint a very different picture is trustworthy HL.
What's the closing hymn?
C'mon. Twilight in the Desert not a sacred text that you can quote as gospel truth. The "little studied technical papers" are not hidden in Dick Cheney's closet--you can read them online (OK, for the price of a movie). I've read (and re-read) the book, the rebuttal from "the Dark Side", and many of the papers involved, and came to the conclusion that the truth is somewhere in between. Simmons has some hits, some near misses, and some wild pitches. All in all, he makes a good story that will keep you up at night. He's more connected to reality than the "KSA can keep it up for 70 years at current rates" crowd, but don't get too enamored with the details.
This is a little late to be replying to this thread but I must.
Your "Dog Leg Up" is all out of whack. Look at the data. Saudi C+C in 2006 was about 400 kb/d below 2005. Assuming no dramatic increase in the remainder of 2007, then production in 2007 will be 550 kb/d below 2006. I don't think you are showing that kind of a decline in your chart. But in 2008 you are really optimistic. In orcer for your chart to be correct, Saudi production in 2008 would have to be back up around 9.5 mb/d, and continue at close to that level for several years. Perhaps that is your opinion but it is not mine.
At any rate it is just an opinion. If production in 2008 is around 8.5 mb/d then the dog leg will turn down and remain on the trajectory it has been on since the early 90s. The data from 2008, I believe, will cause the HL to predict Saudi has between 60 and 80 billion barrels of reserves.
But if we are just guessing at 2008 production, as you clearly are, then we can make them anything we wish.
Ron Patterson
"Blind faith" is pretty accurate because you avoid at all costs any serious consideration of the possibility that KSA reduced production (at least in part) to support the market. In hind sight, of course, those Arabs made a pretty good call! The market got soft even with Saudi reductions. I don't recall you making any prediction that oil would get soft last fall.
The problem WT has is they are discounting his analysis.
Also I might add KSA makes claims that prices are inflated because of speculation yet they have not done the obvious and up production to kill the speculation. The one thing they have not done is increase production. Finally attempts by KSA to maintain a capacity buffer certainly muddy the analysis but we can be sure that they will use it sparingly so WT's HL is probably a better prediction of daily future production.
In any case this is yet another attack on HL and a fairly poor post since it does not even consider how KSA will manage declining production increased internal consumption and their desire to maintain swing producer status. I'm amazed that people use the swing producer or spare capacity argument to discount HL yet somehow assume that KSA is going to open the taps and produce flat out ANY DAY NOW.
Yeah right.
He is showing a forecast for the Saudi HL plot that is directly contradicted by the 2006 and 2007 year to date data.
WT its a absolute myth that HL only works when you maximize production. I have no idea how that got started it has no basis. I outlined why I believe your numbers you did it right.
I suspect you may have not understood why your right it took me a while to figure out what HL is measuring. But I'll repeat HL gives URR under the following conditions.
1.) Production has begun to slow because individual wells have reached the end of their productive life.
2.) The drilling campaign is effectively in a steady state i.e well are "born" under a set of constant conditions. This need not be to obtain the maximum production rate. The critical factor is production is dominated by the rate wells are closed in.
HL is a life death model of the drilling campaign and gives URR if the campaign is fairly steady and changes in production are from closing in wells and thus pretty much directly caused buy the underlying URR. If you break production into four periods initial, mature, post peak, and mature decline. HL should be used in the mature phase or mature decline ( new steady drilling state). It is not a good estimator of URR during the initial phase and peak periods. So I think Euans basic assumptions of maximum production as a prerequisite for HL are false and unsubstantiated.
You did it right and correctly discounted the dogleg up phenomena. The dogleg is probably better termed the Ohh S&*t period.
Finally the URR from HL is probably best described is the amount of oil that can be reasonably extracted most advanced extraction method will work to move this forward in time but the total URR is probably correct for commercial extraction.
The bottom up methods tend to give the utopian extraction rates and thus are in my opinion less useful than HL. But the point is the URR from HL is not quite the same as URR from bottom up approaches its a slightly different and my opinion far more realistic URR. A lot of the excess oil that is part of the URR from other methods would be produced in a long tail at low production rates so it distorts the issues surrounding peak and the near term post peak world. We could care less how much oil is being produced 30 or 60 years from now since it will be a very different society at that point.
Let's see.
I warned of an imminent decline in Saudi production. Check.
I warned of a decline world oil exports. Check.
I warned anyone who would listen to implement ELP and "Cut thy spending and get thee to the non-discretionary side of the economy." Check.
I warned of an imminent decline in Russian production. Based on EIA data, production has basically been flat since October, 2006, and flat production = declining oil exports.
Did I warn of a short term decline in crude oil prices (down to about 400% above the 1999 low) in the fourth quarter of 2006? You've got me there.
You warned about a forced decline in Saudi production. There's decent evidence you were wrong.
Regarding ELP, I'm not sure all those folks who moved to the country and are now farming turnips on your advice will thank you. Just bought one for the same price as they were sold last year. They didn't go up.
Good call on net exports, though. ;-)
Not to get too far off tangent - but I grew turnips this year- they grew ok but they tasted lousy. I left them for the deer and even they didnt eat them. However, my 37 tomato plants have produced a cornucopia. And i mean it. And I am SO glad I grew them, not because the sky is falling, but because a)I enjoyed it b)I gave several hundred away to new neighbors, and c) they taste fantastic!
Congrats on the tomats. There are few things as nice as a fresh garden grown tomato. Similarly with sauces made from the freshly picked. Grow oregano and basil and heaven is at hand. RE turnips, I've occasionally bought one that looked perfectly decent but turned out to have a horrible taste and horrible texture. When they go wrong, they go very wrong.
Hello Lehmanite Nate,
My ADD kicked in with your comment. We grew everything imaginable on our farm this year... and it was a hoot. Quite a difference from working at Bear Stearns and living in NYC. We have chronicaled some of it at:
almostselfsufficient.blogspot.com
Still, not willing (yet) to give up trading for living and give farming a go.
You have to look at it as 'trading' but a different vehicle. In any case, the first step is trying to balance thew two. A foot in both worlds so to speak. At least thats what im telling myself.
Exactly! I keep telling people: you don't know happiness untill your first potato harvest. What great tasting abundance!
I must say I enjoy the time I spend in my garden much more than the time I spend in the office also. Of course, my children are often at my side in the garden which is very gratifying to me.
It is not productive to argue with those who worship at the altar of the Dollar. The US$ is simply a tool I use to increase the comfort and security of those I love. It is not an end unto itself.
...and you don't know misery until your first failed potato harvest.
(mine did OK).
I know :-\ I lost one third to the blight. Still, enough remained to get me through next month. Then it's back to buying.
There are three parts to ELP.
Economize, Try to live on half of less of your income.
Localize, Reduce the distance between home (preferably small energy efficient housing) and work to as close to zero as possible.
Produce, Try to work for, become (or invest in) a provider of essential goods and service.
The "P" part does not necessarily mean growing your own food. It does mean that huge numbers of people who survive in the discretionary side of the economy because of the efforts of the food and energy producers are in deep trouble.
As I said up the thread, I could be wrong about Saudi Arabia, but let me know when their average annual crude + condensate production exceeds 9.6 mbpd.
Texas and the Lower 48 as a Model for Saudi Arabia and the World (May, 2006)
http://www.energybulletin.net/16459.html
Get back to me when KSA returns to 9.6 mbpd, ok? What's amusing here is that WT and Ace have been consistently closer to the reality of the situation than any other forecasts yet people argue that the more optimistic forecasts must be true because... because... because... why? Because you say so? Like I said, get back to me when the data demonstrates your position but not before.
Decent evidence he is wrong? What evidence? There is none, as Euan himself has admitted in the past. There is simply a decline that people have tried to force fit to OPEC cuts totally ignoring that KSA was falling for months before any OPEC cuts were even announced!!! Ah, but we can ignore that inconvenient fact, can't we? We can ignore that KSA production began falling before prices fell, can't we? Because we want to, because it supports our theological position, because the alternative is unthinkable. Well think again, Asebius.
"The greatest shortcoming of the human race is our inability to understand the exponential function." -- Dr. Albert Bartlett
Into the Grey Zone
On the nose GZ,
There is NO Evidence that WT and Ace are wrong...and also no evidence that the higher URRs for KSA are correct.
So...we wait.
My money is on Ace being closest at this point...not due to KSA but Net exports and world peak in general. KSA rolling over is just another painful aggravating factor.
Prepare for the worst (ie. ELP and imminent oil shock) still seems to be a good idea and shouldn't really hurt you...but not preparing (*subject to interpretation) will most likely result in PAIN.
But hey, to each their own.
BTW, we shouldn't have to wait too long to see if KSA will ramp up...but will that prove anything if they don't...doh.
And no evidence that they are right...
Go back to when Ace began posting his charts and then look at other forecasts for 2006 and 2007 production. Then compare those forecasts to Ace's forecasts and tell me who was closer to the reality so far. No evidence? That IS evidence. That is how science is done - a falsifiable theory is given and then tested with real world data, not religious faith. Ace has been wrong so far too - by being too optimistic consistently - but his numbers have been closer to the reality than anyone else I've seen from Skrebowski to Campbell, except perhaps for Bakhtiari.
Stick that in your bong and smoke it, PartyGuy.
"The greatest shortcoming of the human race is our inability to understand the exponential function." -- Dr. Albert Bartlett
Into the Grey Zone
Of course the realism in the forecasts is improved by bringing in the world data. Perhaps we see too much of an emphasis as SA being portrayed as any kind of savior.
I think the key with KSA is internal consumption and politics.
Both point to them becoming increasingly conservative with oil production as the world peaks. Put it this way even if they could increase production by say 4mbd its only going to have and effect for a few years at most before the world is again low on global supplies. Its getting to the point that even a rosy view from a single producer is not sufficient to really change the overall state of affairs. At best and aggressive production campaign by KSA might offset the declines in Mexico and Iran for a few years at the expense of lower production later. So considering geopolitical issues large increases in production from KSA will not be forthcoming regardless of how much oil they have. If this is not obvious by now then ...
I think the models are still useful as a upper bound to world production but real production is going to be controlled increasingly by above ground factors and in general this means it will be lower then predicted and probably a lot lower, especially crude exports and finished product exports. These two are at least on the same level as depletion if not dominate. And next of course how the world economy changes as it can no longer expand via using more oil.
The world has already changed and not for the better.
Ohh and WHT I tried to put my physical interpretation of HL together on this thread in various posts if you feel like demolishing it feel free I'd love to hear your opinion.
I read it and I can't help but want to see some math behind the argument. As it stands, these rationalizations of HL seem to fall in the same category of endless rhetorical arguments. Rhetorical arguments, by definition, are described by the spoken word, so that the only way to keep this up is by producing more rhetoric. So I for one suggest that we play on a field governed by math. Let me give you an example;; elsewhere you said
This is not right, because intrinsic to the birth-death model is proportionality to the amount of material that is there; the oil molecules must pair up and reproduce to "give birth". Just by saying that it looks like wells die does not make it equivalent to a birth-death model.
This is where I let out a sigh, because I can't deal with sloppy language that stands completely separate from the math that lies behind the correspondence.
Thats the problem with HL we don't exactly know what the math is. What is it measuring and why does a logistic equation fit ?
Left as and empirical formula you need not consider what the underlying process is. But its fascinating that it does fit.
And as far as math goes I'd need a complete set of well logs to do this. Given that information you could show that the logistic is coming from the way the well log data works out.
Hubbert actually had this data. He proposed the logistic fit using this data. Finally the death of a well is related directly to the amount of oil it is producing. So although I'm talking about wells since its the drilling campaign and the reservoir size that gives the total production. We are interested in the total reservoir size.
Given I don't have well log data to figure this out from first principles the next step is to consider a simple model. The issue here is to agree that the simple model is accurate.
One example would be to take a cylinder of water and drill a line of holes down the side. Stand it on end and let the water drain out. These holes represent wells. Now this model is trivial since the moment one hole is exposed to air you know the total amount of water since you know the spacing. So at least with this sample problem the solution is trivial. But this simple problem highlights that its when in the case that a hole no longer produces water that you can estimate the total volume. So one of the key assertions stand. Next of course the flow itself is proportional to the pressure which depends on the height of the cylinder but I don't think the dynamics are the same so this is not a good model for the actual flow.
As far as what is constant for creating wells. For me that would be the surface area of the reservoir. So from the perspective of wells the finite quantity is the area that can be drilled. Back to my water example. Once you drill holes at a certain level drilling more holes once the water has passed that level does no good. If you drill multiple lines of holes i.e change your drilling campaign you see that this just changes the rates.
But correlating the finite area required for a well with the
"material" that a well is created from seems to make sense.
Anyway the math at least in this example trivial. You would need a more complex example to create a better model that requires something besides grade school geometry to solve.
But forget HL if you know the extent of your reservoir and you know how fast your wells are watering out as with this example you have a good idea how long the reservoir will last.
And why are you being so hostile ? How can I do math when I don't have constraints or the problem specified ?
And this is not about oil its about wells the oil is secondary it seems and actually not important the actual model would be that a person could say be born live and die over x square meters and once they die no one can be born.
Another way to look at it is its a checkerboard and you can put checkers on each square and each checker has a life time but the square is dead from that point on. I guess the addition is the more squares die the faster the remaining die ?
So does this look like a valid simple model ?
The point is given the assertion that HL is tied to the life cycle of wells and that I don't have well log data required to prove this for oil like Hubbert who suggested the equation in the first place. Notice the fact I need the exact data used to propose the equation to prove its true.
So we would need to come up with a simple model thats still valid. The checkerboard/go board concept looks interesting.
I'd be happy to do math if I knew what I was doing math on. And I see no sense is doing math on a simple model if the model is not acceptable as a model at least for some aspects of oil production. This does highlight that we don't seem to have any simple "virtual" reservoir models which is interesting. If we did then I could say that given the standard reservoir model its obvious that when you assume a steady rate for drilling new wells the URR is proportional to the rate at which wells water out governed by a overall logistic equation. But the first order of business is to agree what the heck this simple standard model is.
And this is getting long but the checkerboard looks interesting to me the water in cylinder is introducing to much complexity. But note that the checkerboard with interaction is simply a version of the game of life.
I.e its cellular automata. If you even find this barely credible its obvious that its related to cellular automata and its not surprising that logistic behavior arises.
http://www.gis.usu.edu/~sanduku/misc/interests.html
But you have to agree on a model to do math. If you don't agree on the model who cares about math ?
Memmel:
I think we just need to correct some of your language to arrive at a better conceptual model.
1) Discovery is a directed process based on a random result. [This may be less true today as we have much better geophysical tools but the early phases of discovery were largely random.]
2) The largest fields will be found first. Throw darts at a random array of targets and the probability of a larger target collecting more darts is higher than for a smaller target.
3) Once having made a strike then we will drill more in the same area and will experience a better discovery rate.
4) For any province the discovery rate will decline over time. We have found all that we are able to find.
5) Production profiles build to a near term peak and then are subject to a long term decline.
So you locate an oil province, you quickly locate all the fields in that province, and you bring them online. The result is an "eruption" of production which is heavily front loaded over the time domain.
The long tail of this production will eventually smooth out and display the characteristics we see in HL plots. It smoothes out as any subsequent finds are of much less significant size and display like noise around the primary signal.
Someone once presented a HL for "Peak Whale" and it showed many of the same characteristics as an oil province HL chart. I suspect you would find a similar profile for commercial airline accidents (a big bulge at the front end when commercial aviation begins, a reduction in accidents as better regulations and engineering practices are implemented and a very long tail in which individual airline accidents show up as noise in a long tail of improved performance.)
Sorry let me explain a bit more thats fine at a larger level and the explanation makes sense. The question thats asked is is their any physical basis for the logistic equation. At the moment its a empirical observation but the problem is its a bit arbitrary on how you perform the observation. A lot of HL curves can reasonable fit the data. For example some people claim HL only works if production is maximized. First this does not mean anything in and of itself second even if it was true why would it be true.
All I'm proposing is HL is probably related to well lifetimes.
It makes sense to me ( maybe only me ). I'm not sure if you can create some sort of simple equation that shows the relationship. My example of automata is not the sort of simple
model one would want but I suspect its the real model. I've got no idea how one develops some sort of simple equation to describe the behavior of automata.
Anyway back on track if you do come up with a plausible set of rules for performing HL thats all you need. The problem is how do you judge the validity of a given HL fit.
My "rule" is you should fit during a period after the rate of increase in production has begun to decline and when the drilling campaign is reasonably stable. Maximum production whatever that means is not required. Another period when you can again get a good fit is towards the tail of production.
The two periods which give invalid data with this criteria is early in production while production is steadily increasing and right around the peak where you probably have a accelerated drilling campaign as production flattens and falls.
Considering no one else has a reasonable set of criteria I don't see why we can't at least use these. They seem sensible.
A lot of HL plots actually use this criteria without exactly defining it. WT HL plots for example fit. The HL plots in this post don't. I'd like to see HL plots with this criteria that are obviously wrong. I'm not aware of one that fails under these restrictions and they seem sensible. I think its better than other proposals for how to pick points for HL.
Notice that this means your only using the first linear segment which most people claim underestimates URR. So it will be very interesting as the world passes peak if we can see if this is correct. The answers are a bit disturbing but I suspect outside of a short term boost we get from advanced methods correct. It implies that production today may be in a sense artificially higher because of advanced technologies and that decline rates will be worse later on if you believe HL plots using the conditions I've outlined the Yibal effect if you will. In short our current slow decline rate is unstable and probably won't last much longer.
And with all of this the data keeps coming in so time will tell and of course we have other factors export land/economy etc that are probably more important. So its a bit of a counting angels on the head of a pin problem. By the end of next summer at the latest our situation should be clear with regards to KSA and Russia. I'm of course of the opinion we are living on borrowed time for the most part now.
Another way to look at it is its a checkerboard and you can put checkers on each square and each checker has a life time but the square is dead from that point on. I guess the addition is the more squares die the faster the remaining die ?
So does this look like a valid simple model ?
No. Its not valid because it doesn't make any sense.
I'd be happy to do math if I knew what I was doing math on.
So how can you make assertions of why HL works? HL is a purely mathematical statement. It either stands alone as a cheap heuristic, which means it is immune to any kind of derivation. Or it actually follows from some actual physical and statistical mechanism, which means you should be able to mathematically derive it.
The actuality is the former, and you can't derive it even though it is tempting to do so, only because it happens to look similar to the actual statistical profiles that describe oil depletion.
But you have to agree on a model to do math. If you don't agree on the model who cares about math ?
You have the model in your head. Because that is all you have been talking about, namely how to justify what is happening in HL. I don't mean to be hostile in casting this in terms of rhetoric. Rhetorical arguments (or a rhetorical model) are a specific category of arguments. Once you put it down in terms of math, it ceases to be rhetorical. We can then look at it and follow the dynamics precisely. And the assumptions and results survive based on careful analysis, and not on more-or-less subjective opinions.
I'd say I have speculation about possible models or musings.
Although I get lambasted constantly its intriguing that a logistic heuristic fits. I've got pretty think skin so don't worry. At best I have a reasonable set of guidelines for using HL.
Now back to the checkerboard why do you say it makes no sense.
Once you drill a well in part of the reservoir and it waters out that part of the field is removed from the reservoir. You asserted that nothing was consumed in creating a well I suggest its the physical area for the well itself thats consumed. The actual amount of oil is simply a scale factor.
The actual relationships between the wells is complex since they are connected via the pressure in the field so valid or not its not a simple model.
As far as I know no reasonable simple model for a oil field exists. Without one its hard to work through how the ensemble exhibits or does not exhibit logistic behavior. To my knowledge the only basic math is that your going to average to a Gaussian like distribution given known well production profiles. And of course we have the concept of discovery shifted for production. Its one thing to blast HL but considering the paucity of basic concepts I think proving HL wrong is premature. We can't even prove simple concepts about a field like say average well production rates. As far as I know production rates per well vary a lot and the fields are effectively unique. So we don't even have a "standard well" concept related to the size of the reservoir. In all the theory of oil reservoirs is effectively does not exist. HL and discovery shifting are the only simple concepts we have. I like your shock model but it suffers from the to many knobs syndrome. Finally considering we have successfully developed simple models for many complex processes I believe one exists.
You can't prove a heuristic such as HL wrong; all you can do is show that another model fits it better. You can however prove any kind of physical or statistical model that deems to support HL wrong as the differential equations that it derives from do not match any realistic situation.
Overturning HL as a formal model is child's play really. Proving bad models invalid is of course much easier than getting a correct one.
In a sense its childs play I agree but your just disproving curve fitting. All the attacks on HL to date have just been attacks on the process of fitting a curve to data. Without a set of at least guidelines for choosing a particular fit vs another you have no basis. Disproving curve fitting makes no sense. The argument itself is flawed I can fit any number of curves to any data set. The basic argument is I can perform a linear regression on any data set therefore linear regression is wrong ? And all this is done without presenting the error terms ? And finally these people reject filter criteria which are intrinsic in curve fitting.
And last but not least HL is a simple way to do a fit and its actually useful to pick initial conditions for a iterative procedure with filters at least say a non-linear least squares fit. We have a large body of knowledge and programs at our disposal to do more robust fitting but none of this is even mentioned on this board. The whole field of curve fitting is simply ignored.
At least start with the basics.
http://en.wikipedia.org/wiki/Curve_fitting
As far as HL being wrong dunno. The last addition of the shock model presented contained a logistic component. My proposal is just that logistic behavior is probably only present during parts of the field development process. If you split the curve into four parts based on the zero's of the second derivative.
You can map to a logistic after the rate of increase begins to decrease and before the peak. Then on the mirror image side.
The final tail dunno and its not all that interesting.
Now given that HL can be done with a blind choice of points I'm simply urging that you at least present one HL curve that fits these criteria. We will see over time if they actually are correct. Right now we have no accepted filter criteria for HL. Before this we had some vague notion of maximum production which in my opinion can't even be defined much less used as a filter criteria.
I of course disagree that HL is the wrong differential equation however I think your shock model is on track and I think we will find that the behavior is logistic over the ranges mentioned and that field development is a piecewise set of differential equations not a single governing equation. In fact that exactly what your doing with the shock model. Thus given a better shock model or the next addition when it comes out we can look. Also I might add over the regions of interest in the curve its not clear that another differential equation with a better physical basis might fit the data also. I would not be surprised to find that the logistic and this real curve happened to be similar over the range of interest. The number of curves that have regions that are "close" is infinite.
For now HL applied using the criteria outlined is in my opinion good enough barring a better physical model. Even if you don't agree with the reasoning the increase in drilling around the peak as production begins to decline distorts the data and is the source of the infamous dogleg. So using this criteria you would select the same regions of the curve for HL.
I'm crap at math so won't join in your game. But I have just about completed a new post on HL - so hope you math guys turn up to comment.
The starting point for me in uderstanding HL is annual production / cumulative production = 0. What does that mean - in the real world?
Also, can the HL for Kuwait be used to forecast Saudi reserves?
Yes, Yes...too much emphasis on KSA.
They are demonstrating right now, that they are NO LONGER big players or swing producers. And, the rest of the world data isn't pretty.
KSA is no longer KING.
So your telling me that interpreting an organizations data that has deliberately constrained production is 'evidence' of your opinion? Get out of here!
You are making a deliberate assumption that they have constrained production and then assuming your conclusion. Asinine. No, you get out of here. Right now all we have is a decline. We have no clear evidence of KSA voluntarily reducing production or of falling production. Cases have been made for both points but neither is conclusive. For your to assume that YOUR assumption must be the correct one places you right beside Galileo's bashers as a man of non-science.
What we have are two hypotheses which must be subsequently proven or falsified by data. My point, in case you missed it, is that the data thus far has trended towards Ace's forecasts for the entire world and for KSA. That gives him a bit more credibility in my book than you.
The least you could do is present a coherent argument for the other side like Dave Cohen does. I can respect Dave's position even if I don't currently agree with it. And the data WILL validate either Ace or Dave. But you? Get the hell out of here. You wouldn't know science if it bit you in the ass. Ace is trying to do science here. Euan is trying too. So is Dave Cohen. They are trying to work out their discrepancies by presenting their assumptions and passing them back and forth for review. But you? Just what the **** are you doing here besides trolling?
Also see Darwinian's reply to Euan about his 2005 and 2006 numbers and the trend in 2007 as well as Euan's expectation that 2008 must be up near 9.5 mbpd for his linearization to hold true. Do you really expect that 9.5 mbpd to materialize? If so at what price? Let's do some science here, PartyGuy. Give me a hypothesis that we can test - if you dare. Name a production rate and price point. Or make a flat out production prediction regardless of price. Or you could just sit there and do nothing, like you currently do, just sniping at anyone with whom you disagree.
"The greatest shortcoming of the human race is our inability to understand the exponential function." -- Dr. Albert Bartlett
Into the Grey Zone
"Regarding ELP, I'm not sure all those folks who moved to the country and are now farming turnips on your advice will thank you. Just bought one for the same price as they were sold last year. They didn't go up."
Hmmm...wheat peaked at $7.50 a bushel..up from $3-4...what a couple of years ago...???
Hay is up too...almost double...
(edit) The latest edition of Capital Press(an Ag weekly)- front page- blue berries up to $1.90 a lb. That is up from $.83 a lb 5 years ago. Retail is $3.00 a PINT!!
I never liked turnips anyway and I do like fresh bread and a nice juicy steak with sea salt on the BBQ...
Get ready to bend over as biofuels sucks money out of your wallet...(oops no oil production problems... .-)
DelusionaL - happily sitting drinking wild turkey and looking to add...oh my god!...vegetable/berry production as a way to stradle the transition between the life as we know it (optional purchases of pretty yard plants) and what must come next. Best of luck to you and remember I think it takes 3 years to learn how to grow a consistently predictable crop year in and year out...and as my competitor found out maybe longer...;)(hehe)
But how can we ever realize the waste that we have engineered into the auto-life-style? Based on a finite resource. We "cannot" be that stupid...(?)
That math applies to oil production/human behavior isn't a stretch. It applies to the world around you, planets, plants(my field), etc. etc. So why are we so convinced that we are above being a part of the equation? arrogance?
Oops... the weenies need turning on the propane fire...and when it runs out I will cook with wood...weenies because the deer was full of tape worm cysts, 1-3 per back strap steak...yup just that gross.
http://www.iht.com/articles/2007/08/31/business/wbmilk.php
In a growing world, milk is the new oil
By Wayne Arnold
Published: August 31, 2007
I don't think WT is in the short term oil price business. In my opinion for example I expected gasoline to be pushing 5 dollars a gallon in the US right now. Considering the current stock levels a obviously active hurricane season and tight supplies you would have expected the market to respond. Next of course the hallmark of peak oil is instability in prices not a certain and steady increase but wild price swings. This is caused by many market players that are ignorant of the true situation. A steady and robust increase in price based on market fundamentals assumes that the people in the market are working on the same facts. This is astoundingly not the case for the oil market. The same could be said for the stock market in both cases they markets are not just irrational but practically psychotic. This psychosis is probably the underlying reason you see price swings at market peaks before fundamentals finally take hold. I'm surprised your using price in a market that is now based on a twisted faith in the market gods as some sort of argument against WT.
And of course the housing bubble has hit bottom and prices will start rising soon so its a great time to buy.
I for one appreciate everything you have done Westexas on TOD. I have been reading this site daily almost from day one and I see your point about using Texas as a case study for the rest of the world. Right now it's the best example we have of a large producing region going into terminal decline. While SA may not follow an exact path it would surprise me if they follow a similar decline curve.
I think too many well intentioned folks put too heavy a discount on Texas and lover 48 production and decline curves. I do want to stress "well intentioned" as RR, Euan, Stuart and the rest are doing a great service to us all by contributing to TOD.
Saudi production of C+C has been stable for 8 months now (the July chart shows same as for June). In other words it has stopped falling.
True, there is a blip down on the HL for production so far in 2007. Personally I'd be reluctant to view this as evidence for a reversion to the 1991 - 2001 trend line. What if production increases for the remainder of the year and is boosted from this new baseline by new projects in the years ahead?
If Saudi C+C production exceeds 9.6 mbpd in a calendar year, I would have been wrong about a near term final peak, but the available data are supporting the Texas model, i.e., the most accurate pre-peak estimate of Texas URR came from discounting the "dogleg up." IMO, It's basically a result of the swing producer going to "100% allowable" because of market demand.
However, it's interesting to compare Saudi and Texas production, C+C, rounded off to the nearest 0.1 mbpd:
Texas:
1972: 3.5 mbpd
1973: 3.4
1974: 3.4
Saudi Arabia:
2005: 9.6 mbpd
2006: 9.2
2007: 8.6 (year to date, on EIA data set)
Besides the field size distribution, another key difference between the two regions is the size of their biggest fields, relative to total production. The East Texas Field only accounted for about 7% of Texas production at peak. The North Ghawar decline may have accounted for the sharper initial decline in Saudi production.
Texas showed a long term decline rate of about 4% per year, versus 5.5% per year for Saudi Arabia so far (assuming 8.6 for Saudi Arabia for 2007).
In any case, flat current production means lower exports--based on their recent 5% per year plus increases in consumption.
News Bulletin:
I just got off the phone with an acquaintance of mine, in a diplomatic service, who has considerable knowledge of Saudi Arabia. He actually leans toward the mostly voluntary decline scenario, but in any case, he said that because of severe shortfalls in natural gas production, about 500,000 bpd of liquids production over the next two years will be diverted to power plants and desalination plants. This is why the Saudis are talking about importing coal.
I'm pretty convinced its also a mix. Using the Texas data of 4% and a KSA decline rate of 5.5% implies that 1.5% of the decline may be part of a plan to keep a cushion. When in doubt simply split it 50/50 and assume its about 2.5% depletion and 2.5% voluntary. I really believe that maintaining swing production capability is very important to KSA for internal political reasons if nothing else.
But even using Texas as a guide points to a high probability of some reductions beyond simple depletion. I think this puts them at 500k-1mbpd of sustained spare capacity right now. Not the 2mbp or more they claim. However maybe the other heavy fields they are not producing right now is enough to get them to 2mbd. And they probably have 500kbd at least of short term surge capacity. I think real usable 2mbpd+ of spare capacity is doubtful. But 1.5mbpd of short term with 500kbpd of sustained seems very probable so a short term boost to 2mbpd is still probable. But my best guess is 1.5 is probably max.
We can be pretty certain that they will be forced to surge production at some point. Iran war hurricane etc so we will just have to watch with interest how much they bring online and for how long. Not this does not change the fact that they are probably now in decline or very very close at best.
And export land does not stop so its a safe bet that we probably have past maximum KSA exports.
Sorry, Euan, how does your Saudi Arabia supply graph show that their output has been stable for 8 months? It appears to show a decline curve, with the occasional upticks, as we've seen in other regions that have peaked.
There are several organizations that try to track global oil production from many countries. The data people are referring to is the rough average between the IEA, EIA, ASPO, etc..
I don't think it was appropriate to attach this term to a particular person in the main body of an article; it's far too easy to interpret as a personal attack.
Comments can and do get more personal, but I would urge all authors to strive for the highest standards in writing articles.
Unfortunately, it appears that a Hubbert Linearization on world production data is extremely sensitive to which years are chosen as data points.
Using the most recent 20 years of annual production (from EIA), HL gives an URR of 2100GB, and a peak date in 2007.
Using the most recent 10 years of annual production, HL gives an URR of 2600GB, and a peak date in 2014.
Using HL with a fixed number of data points (I used 10) seems to result in ever-increasing URRs; from 1992 (using 1983-1992 data) to 2006 (using 1997-2006 data):
From this, I conclude:
Using HL on the most recent EIA data, it's possible for me to predict a peak in global oil production in just about any year between 2000 and 2016, simply by changing which is the first year of data I use. Accordingly, little weight can be given to post-hoc claims that HL "predicts" a certain peak - there's too much scope for even a well-meaning person to unconsciously tweak the method until it's "right", perhaps rationalizing the starting year for data that's used as "the first reliable data".
HL applied with a fixed number of data points - fixed before looking at the target data - may still be a valuable tool, though.
Upon what statistical basis are you limiting the number of data points to some arbitrary choice? That looks suspiciously like bad math, deliberately political math.
"The greatest shortcoming of the human race is our inability to understand the exponential function." -- Dr. Albert Bartlett
Into the Grey Zone
That's the point of his post. He is showing how you can arrive at any answer you wish by a fortuitous choice (or number) of points. He is not defending that practice--the HL groupies are (even to the point of ignoring recent data because it doesn't fit in). A judicious choice of points is technically termed "good HL".
Hmm curve fitting is all about a choosing point to fit.
HL is a simple method more rigorous ones exist. But curve fitting is still more art than science. If your serious about finding a better method then HL its fairly easy to do non-linear least square/filtering approaches. I looked at them and the fit provided by HL and felt that they did not provide and advantage considering the quality of the data.
One of my biggest problems with this post is it did not show the actual curves given the various HL fits. We are pretty good at doing visual fitness tests with the mark one eyeball.
I dislike posts that don't show the curve and data together. The HL plots are not that useful. Also their is no reason you can generate a non-linear least squares fit number given the HL to get a error term. The lack of mathematical rigor when people question HL drives me nuts.
I'll just shut up on this subject if the objections to HL had more merit and where better formed we might have a worthwhile discussion instead of dealing with people who don't even understand the fundamentals of curve fitting.
Show me one non-linear least squares fit and then I'll change my tune lets at least start with the basics.
No, curve fitting involves applying a model which reflects reality. The assumptions you make regarding when your chosen model reflects reality (i.e. which data points you choose) are very subjective and have in no way been justified for this particular case. Mathematical rigor in such a situation might make you feel good, but it means little.
Actually, it's precisely the opposite.
HL can be made to "predict" a peak at any time between 2000 and 2016 by changing nothing more than the number of data points selected. This leads us to one of two conclusions:
The simplest objective criterion is the null criterion; i.e., the number of data points is fixed regardless of the dataset being used. The precise number of data points to use is open to argument, but it's crucial that that number is chosen before looking at the data in order to avoid injecting bias into the result.
(For the record, that's what I did; I used 10 simply because it's the base of our number system, and hence is a common unit for this kind of thing. Think how many times you've heard "in the last decade", or the like.)
Other objective criteria might also work, such as once P/Q drops below a certain value; that I don't know. What I do know, however, is that any HL done where the number of data points is chosen based on subjective or unknown criteria is unreliable, regardless of who did the HL (and which "side" they're on, if one insists on viewing everything that way).
There is certainly some truth in the notion that one could choose their date in an arbitrary fashion and "create" a line pointing to where they would like. Many of the HL analyses of KSA start with 1991 and use all the data to the present. Whether we use C+C or C+C+NGL will shift the line leftward and change the slope somewhat. I have done a number of these plots with C+C data from the EIA and in my opinion a more reliable estimate of URR is found by using the monthly data from 1973, rather than just the annual data. We have the data for C+C, but only annual data for NGL so I created a dataset using the monthly data for C+C and adding the average NGL output (in thousands of barrels per day) for each year to the monthly data for C+C to see what the HL would look like for C+C+NGL. Why would I bother?
The benefit of adding the monthly data is a much narrower 95% confidence interval and a better estimate of URR.
SD=standard deviation
Data from EIA "All Months and Years January 1973-Present
OPEC Countries and Total OPEC" (C+C) on the following page http://www.eia.doe.gov/emeu/international/oilproduction.html and "Selected Countries, Persian Gulf, Total OPEC, and World Total, Years 1970-2006" for NGL (same page as above).
The upper line (yellow) is pretty close to the HL that Euan uses with a URR of 241 GB, this corresponds to the Upper 95% line of the regression. My central estimate gives a URR of 217 GB and the lower line (lower 95%) gives a URR of 196 GB. The data from January 1991 to May 2007 was used for the regression, but all data from Jan 1973 to May 2007 is shown on the graph. R squared was 0.79.
Note that a similar analysis on the annual data from the EIA was performed (data from 1991 to 2006 was used for the regression) and the central estimate for URR was 236 GB. The lower esimate in this case was 160 GB and the upper estimate was 383 GB. R squared was 0.76. This analysis was performed using 16 data points (vs. 195 data points for the monthly plot), typically fewer data points will result in a poorer estimate.
One further comment on Euan's suggestion that KSA was producing below capacity from 1992 to 2002. Although KSA may not have been producing flat out, I do not think they were holding back a lot of capacity since 1991 (altough in the eighties clearly this was the case.) The two points that Euan chooses (1991 and 2005) may have been years that KSA was producing above their sustainable capacity. Gulf War I was the reason in 1991 (loss of Kuwait's and Iraq's output) and the attempt in 2004-5 to bring oil prices back under control by ramping up output to maximum. They gave up on this in the fall of 2006, probably because this level of output was not sustainable. Just my 2 cents.
What do you show for cumulative Saudi production at the end of 2005?
BTW, the "conventional wisdom" worldwide is best expressed by the Economist Magazine, as expressed in their August, 2006 issue:
Hi WT,
For C+C+NGL end of year:
Year Cumulative Production(GB)
1972 17.2
2004 112
2005 116
2006 119.8
2007(May)121.4
When I did the Analysis for C+C, URR was 191 GB with a range of 172 to 212 GB for the 95% confidence interval. I again used the monthly EIA data from 1973 to the present and ran the regression on Jan 1991 to May 2007.
Dennis
So, using your central estimate of 217 Gb suggests that Saudi Arabia was about 54% depleted in 2005.
Dcoyne - welcome to TOD - I trust you have enjoyed your first 6 hours.
Thanks very much for this thoughtful and well argued post. I think the main point is that the range of options being discussed are captured by the variance in your regression - well almost. I just eyeball lines because I am a geologist.
This is a fair and persuasive argument. The main point I'd argue is that they reached the limit of their built capacity and were only too glad to allow production to fall back to a more sustainable level during 2006. The qualification is important because they had extensive unbuilt capacity at that time - Haradh and Khurais being examples. By the same token I'm reluctant to give equall weight to the data points between 1991 and 2003 because I feel they are "depressed" - hence one can easily be criticised for excluding data believed to be false.
Your regression IMO gives an unbiased statistical veiw and is most welcome for that reason. I hope you stick around so we can discuss this further as the story unfolds.
PS - you say monthly data from 1973? Do you not mean 1993?
Euan,
Thanks for welcoming me to the Oil Drum, I have been lurking and learning for a few months and only joined when I felt I could contribute somewhat. Although I don't agree with you completely, I appreciate your well reasoned presentations. It does not seem to me that HL is predictive of the URR by itself, but I do agree that when it is used judiciously it is a useful tool.
The data is in fact monthly from January 1973 to May 2007, however the HL Plot only settled down in 1991 so the regression was based on the data from January 1991 to May 2007.
I've written elsewhere that I suspect that too many people are expecting too much from Hubbert Linearization (particularly with regard to predicting URR) but your assessment of the matter is not, in fact, the only way to choose data points. Another methodology has been recommended in the past and it does not involve a fixed number of data points but rather in taking all those data points from the time that the HL plot stabilizes and going forward. Yes, this gives you a range of URRs but so what? Ask 10 geologists to give you their URR of a field and you will get 11 different answers, though they are all likely to be similar. Likewise with HL, you get a range of values that gives a strong indication of the possible URR.
Now, as I have said, I have strong doubts about HL because that is not the method that Hubbert himself employed. HL is a simplification of Hubbert's equations developed by Professor Deffeyes. If you actually bother to read Hubbert's 1956 paper, you discover that he was working from prior URR estimates, not developing the estimates himself. Thus I personally think that using HL to predict URR goes beyond what was intended with Hubbert's original work. However, even though I disagree with HL as a URR predictor, the fact remains that others have proposed other objective criteria that do not presuppose fixed numbers of data points, such as taking all data points once the linearization stabilizes.
"The greatest shortcoming of the human race is our inability to understand the exponential function." -- Dr. Albert Bartlett
Into the Grey Zone
I agree, which is part of the reason I pointed out how poorly it does so.
I agree, which is why I said, "[o]ther objective criteria might also work" in the post you're responding to.
The problem there is in defining "stabilizes". If it's done reasonably - and independently of a the data - then that approach might be appropriate.
In general, though, it seems like this sensitivity to choice of input data - which SS has examined in more detail for the well-behaved case of US production - should be explicitly taken into account with HL. If there is no sizeable "zone of stable prediction" (to use SS's term) for a given dataset - i.e., if the predictions of HL do not settle down to a narrow band for a broad range of starting and ending years - then it seems unlikely that we can use HL with any substantial reliability on that dataset.
Unfortunately, it may well be that the only datasets for which HL is well-behaved are those of countries that are well past peak, which would rather undermine the effectiveness of HL as a predictive tool. It would be interesting to see SS's stability analysis re-run on more contentious datasets, such as KSA and world production. Based on what I've seen (one slice through the 2D prediction plot), world production will have a very small or possibly non-existent zone of stable prediction, which would mean HL will not be a reliable predictor for world peaking.
http://www.theoildrum.com/node/2689
In Defense of the Hubbert Linearization Method
June 24, 2007
http://www.themoscowtimes.com/stories/2007/07/10/042.html
Tuesday, July 10, 2007. Issue 3695. Page 5.
The Moscow Times: Alfa Report Sees Trouble Looming in Russian Oil Sector
By Anatoly Medetsky
Staff Writer
Pitt - I am somewhat surprised at the attention and upset that my rather careless use of the term "blind faith" has invoked. An entirely innocent error on my behalf and absolutely no offense was intended.
With respect to the tenor of the overall debate here, I am somewhat surprised by the lack of specific probing / criticism of the individual elements of my model which includes:
element 1 - Ghawar ± Abqaiq
element 2 - Heritage assets
element 3 - New fields
element 4 - Discovered undeveloped + yet to find
I'm really surprised that folks are not laying into the latter and claiming that no more oil wil ever be found and developed in Saudi Arabia. I may have been interested in arguments about my project delays being over-optimistic - which they may well be. And so on. The red symbols on my stretch HL model are the sum of these parts, they just happen to fit the model and do neither constrain it nor prove it to be true. But to refute this my feeling is that any errors or bias in each of these elements need to be discussed specifically.
Of course what we need is a fifth element - I'd looked out a real nice picture of Milla for you - but given the fragility of sentiment in the air will wait to post it another day.
How many times have I stated that Peak OIl does not mean that we stop finding oil fields? I'm developing several new commercial oil and gas fields (one with permeabilities measured in Darcies) in Texas, 35 years after we peaked. While we can find new fields and do a better job of extracting oil from existing fields, the problem is that we can't offset the declines from the old larger fields.
Assuming that the Ghawar complex is in decline, insofar as I know every oil field in the world that has ever produced one mbpd or more of crude oil is now in decline.
BTW, note that Saudi Arabia, like Texas in the Seventies, has responded to higher oil prices with a dramatic increase in drilling--and lower crude oil production.
Excerpt of a post over on the EROEI thread:
I asked the following question a few months ago:
I used this analogy in regard to the Texas oil production peak and decline. From 1972 to 1981, nominal oil prices went up by about 1,000% and the industry responded with the biggest drilling boom in history, which resulted in a decline in production from 3.5 mbpd in 1972 to 2.5 mbpd in 1982.
In other words, how fast did Texas have to drill in order to keep oil production rising? The answer is that it appears to be physically impossible.
We have seen a similar situation in the North Sea, where we have seen a crude oil production decline rate of about 5% per year since 1999 while oil prices have increased at about 18% per year.
IMO, Saudi Arabia--which is currently showing lower crude oil production in response to higher oil prices and increased drilling activity--is at about the same stage of depletion as Texas in the Seventies.
While we can make money finding smaller oil fields, the case histories and mathematical models suggest that we will not be able to increase our aggregate conventional oil production, i.e., the function of oil companies post-peak regions is to slow the rate of decline.
Jeffrey and Ron, in the model I have presented there is 2 Gbs production from yet to find fields produced between 2017 and 2028. And there is 2.2 Gbs production from discovered undeveloped fields from 2015 to 2028. Do you think these are reasonable guestimates?
And would you care to comment on the other elements - Ghawar and Heritage assets - and say where you think I am overestimating.
And whilst as you say, all 1 mmbpd fields in the world are in decline, in Saudi Arabia, Khurais has lain fallow for decades and is forecast to produce at over 1 mmbpd - so there you have a 1 mmbpd field that is not yet started to produce (ignoring half hearted efforts uisng vertical wells in the past).
From "yet to find fields" that's about half a million barrels per day for 11 years. Yet despite extensive exploration, they have found little pipsqueak field since 1968, and that was 20 years ago. No, I don't think that is a resonable guestimate at all.
And you have another half million barrels per day from discovered but undeveloped fields, for 13 years.
Khurais is an example of Saudi wild optimism, like their estimated 260 gb of reserves with another 200 gb yet to be found. In 1981 Khurais produced 144,000 barrels per day, its all time peak. In 1982 production from Khurais fell off dramatically. In 1983 Saudi inituated an agressive gas injection program in an effort to increase production from Khurais. The program did increase production in a few wells but as little as 1% in many others. Overall the program was a failure. Khurais was eventually mothballed because of low production.
Yet they now predict Khurais will produce between 800,000 to 1,200,000 barrels per day, depending on which report you read or when it was written. And yet you say "so there you have a 1 mmbpd field that is not yet started to produce! Amazing! It has started to produce but was shut down. Now an agressive water injection program is planned to raise production to 1 million barrels per day. And you take it all at face value. As I said, amazing!
If they pump in enough water they can get out over 1 million barrels per day of something. But if that much oil was there, it would have been produced in the 1980s. The fact that it was not, despite agressive efforts, means that there is not much oil there. Water forced increased production is likely to water out very soon.
Ron Patterson
Ron, 2 Gbs is very roughly 1% of the URR. I'm inclined to think this is very reasonable for yet to find and you are perfectly entitled to diasagree - so I suggest we agree to disagree here.
As for Khurais - i 'm perfectly aware of the chequered back ground here. The real issue here is whether or not 3D seismic, horizontal drilling and experience are sufficient drivers to make this work.
The main pointer I have is all the money they are spending on the development. Do you think they would spend all this money if the Saudis thought it wouldn't deliver?
Euan, do you know what the Saudi's are spending on Khurais? I have no idea but if they only get a hundred thousand barrels per day for four years, that would be over 7 billion dollars at $50 oil.
Saudi will likely get their investment back even if Khurais comes nowhere near 1 million barrels per day. They are taking no great gamble here Euan.
Ron Patterson
Euan, some new oil will no doubt be found in Saudi Arabia. But all the low hanging fruit has already been picked. What I find really astonishing is that some people believe there are still billions of barrels yet to be discovered in Saudi Arabia. Saudi, in the last forty years, has searched far and wide for new fields. All they found was a small patch of fields, called the Hawtha Trend Fields, south of Riyadh, which they found in 1989. The last field of any size, Shabah, was discovered in 1968.
Again, it is absolutely astonishing that some people still believe that what Saudi could not do in forty years of exploration, they will be able to do in the next few years, that is find any new fields of significance.
Ron Patterson
The opposite argument is usually employed to defend claims that Saudi can keep producing at high levels for years. I've been reading "The Age of Oil" by Leo Maugeri (VP at ENI) and he trots out comparisons such as "a million wells have been drilled in the US vs. X thousand in Saudi Arabia" to show how unexplored KSA is, neglecting to mention the more rational reasons for this difference.
I don't think anyone is expecting them to find another Ghawar or even an Abqaiq, but then the lower 48 has produced (and still produces) a lot of oil without one of those either. An interesting questions is: can a big behemoth like Saudi Aramco manage the development of a lot of small fields as opposed to a few supergiants?
To me, it seems reasonable that there is a lot of oil in small(ish) reservoirs in KSA amongst the giants, but it would take something like the US Independent producers to exploit it. But even if they had the access, the infrastructure isn't there (roads, power, water). Contrast this with East Texas, where the oil was in everybody's backyard.
Saudi Aramco chose to develop Haradh III which required using the most advanced technology (Smart Completion MRC wells, I-Field, blah blah), another GOSP, etc.--a huge capital risk for 300kB/day (maybe) in comparatively lousy rock--instead of pouring that effort into other projects. This either means that there aren't much better prospects out there, or at least, none that a big bureaucracy has the mindset for. Similar arguments can be made regarding their need to rent expensive offshore drilling rigs.
As far as squeezing the known fields, there isn't much mystery (at least to Saudi Aramco) about how much oil is there (OOIP). The amount they can get out is the open question, and between advances in technology and unexpected challenges from the geology, the range of possible answers is large--which translates into a large delta in the amount of oil given the size of the fields involved.
has anyone ever looked at what would happen if the rate of extraction for each year was randomly between 85 and 95% of what the optimal extraction rate would be, up until time X, when it shifted to 100%
I think that the lesser effort in extraction would resiult in a noisy line pointing to the intercept, then as you went to 100% you would get a few years of increased extraction, which would be followed by a new line, intercepting the same x-axis point.
This is one model of how a swing producer would behave, which would explain the king @ around peak for the 2 noted swing producers thus far.
Euan,
Nice to see some resource analysis postings here again!
Just to point up, as I'm sure you realise, your calculations are heavily dependent on that assumption of 5% decline rate for "Heritage Super-Giants", together with the assumptions for the future of Ghawar. A change or two in these and the URR, together with the decline rate and peak year, change significantly.
For a start you have suggested that the natural decline rate of 7-8% can be stemmed over significant periods of time to lower figures. However there is a limit to the rabbits that can be pulled out of hats, and therefore decline rates over time will tend to long term natural rates. You also assume that North Ghawar maintains its production for another ~5 years, and that South Ghawar can sustain 2Mbpd into the future. Personally I'd only count on 1Mbpd from South Ghawar as a given - too little action for anything else.
On top of this, there is the question of long term policy. We have to expect that in a world where post peak has been recognised, production will be scaled back somewhat to extend production capacity (eg a kink in the line caused by peak oil itself). Call these above ground factors if you will, but there is no reason to expect SA to continue to produce flat out.
If I had to guess (and let's be honest, anything in this regime is 90% guess) I suggest that the new capacity being bought onstream is specifically designed to keep production capacity flat; making up for known declines in Ghawar and elsewhere. That assumption shifts the Ghawar decline earlier and to me sounds very like the decisions that would have been made in 2001 to manage the transition of SA from world swing producer to post peak supplier.
just to second garyp's sentiment, more resource analysis is always good to see.
Also happy that others assumptions are being questioned/challenged within a spirit of seeking clarity whilst largely avoiding (most)personal comments. Could have phrased the 'blind faith' comment better methinks ('high confidence'?).
Re memmel's comments upthread on Saudi as a swing producer, surely once we're firmly established on the downslope of world production there's little benefit to holding spare capacity? Either way isn't EM's methodology in using the '91 & '05 points sound in determining a realistic URR? If so is this not the best starting point for Saudi's production post (world) peak?
I also want to 2nd (or 3rd now?) the return to fact for basis of discussion. Thanks EM for the data set to puzzle on.
I also think it was a poor choice of words to state "belief" which is often seen as derogatory in science discussions. People risk their reputations by staking out positions on this site, often supported by data they bring to bear, and one should be careful about how one seeks to over turn those positions.
A last comment on extraction rate vs recoverable reserves. We have discussed this concept more than once on TOD. The SA dogleg up certainly showed they were able to increase/maintain production in the short term. This in no way proves they can maintain this rate.
The debate has always been thus, with a fixed amount of oil in the ground producing more today will mean faster decline in the future. Bringing to bear modern extraction techniques may indeed be more efficient at removing oil per day than 30+ years ago. That does not automatically mean more oil can be extracted over the life of the field. It is too soon to tell if SA is voluntarily reducing production or after doing everything they could decline rate will increase.
My feeling is this could be over conservative. It seems the Saudi's have much reserve capacity in the giant sour oil fields of Safaniyah and Zuluf. Will the reserves here ever be produced? My feeling that post peak oil the world is going to find it has surplus refining capacity and that some of that capacity will be converted to refine sour Saudi crude. If its going to be produced it has to be included in estimates of URR. The whole concept of decline rate in fields that are only producing at a fraction of capacity is somewhat arbitrary.
This could turn out to be unduly perceptive. The adapted forecast below simply brings the Ghawar data 4 years forward - and then we do indeed see new capacity compensating for declines in Ghawar and elsewhere.
IS there any basis for bring Ghawar production 4 years forward other than just to show graphically a plateau would result?
I suppose in other words could you put estimated value +/- a range on production for Ghawar and the heritage supergiants?
I'd suggest, given that its been producing for 5 decades, that a few years either way is well within the error bars. Even with the detectoring that has been undertaken we really don't know for certain when it has to take a downturn.
Personally I think they are shutting in production from parts of Ain Dar, Uthmaniyah, etc. to provide a surge capability. A few years of production now is less useful than those years when it really needed.
Yes I agree and have read as much in statements from current and retired Saudi officials.
But then one has the reports this year by the GAO (Peak is now to never; likely within 30 years)and the NPC (IMO giving lip service to PO and GW) regarding future global (not just SA) oil production. A sense of urgency, or clear indication of the consequences of PO, seems lacking in both.
So what's a policymaker to do? The more evidence they have in hand the more likely they can get past partisan politics. At least in theory.
John, this modified forecast and the one in the main post are built upon a catastrophic collapse of production in N Ghawar. Trying to get a detailed handle on the timing of that collapse is difficult with the data we have. I'd certainly say its within the error envelope. The conceptual forecast in the main post is my best guess - being optimistic on some points and pessimistic on others - hopefully in this attempt at a balanced analysis these + and - cancle out.
Thanks, Euan, for providing an honest answer. I appreciate that multiple assumptions are required to get at this result. I guess the key thing to remember is it's a forecast. I'm sure the balance of 2007 will provide further illumination.
"It is up to individual readers to decide what the truth is."
Reality exists and is independent of what anybody or even what everybody believes. Our suppositions about how much oil is under the sands of Arabia has absolutely no effect on how much is still there or anywhere else. Muslims believe they have no obligation to be honest with infidels. Therefore until an independent survey of OPEC geology is done all official statements are suspect.
True enough, but we don't act in response to reality, we act in response to our perception of reality.
That's why so many thousands of people in the US buy unnecessarily large and inefficient vehicles every month. They perceive that if they can afford the vehicle, insurance, and fuel that they won't be burned by that buying decision. I try my best in my presentations and over on my site to hammer home the point that people buying a shiny new full-size SUV or pickup truck in the US today could be in a world of hurt in five years when no now wants to buy it and they can't afford to pay $5 or $6 a gallon to fuel it.
Not nearly as many heed my advice as I would prefer; they perceive me to be a loon.
Nice work as usual. It seems now clear that no significant supply growth will come from Saudi Arabia as it was the case in 2002-2004. At best they will be able to maintain production around 10 mbpd for a while.
Your forecast seems to be situated between the EIA (2006) and Bakhtiari (2003):
Zut alors you're good!
Khebab -nice graphical summary. Very handy. Two points.
1) Could you highlight the maximum value v. time that Euan is forecasting here, and at the risk of TMI, label it as C+C+NGLs. The color-coded field-by-field mbpd is really confusing on your graph, and would take away from the bottom line of his forecast. Also, clarify that 'Euan 2007 Ghawar...' refers to C+C or CO?
2) You have a number of CO forecasts, but not Ace's. Since Euan brought this up, how about plotting ACE's forecast.
The old EIA and IEA data (prior to 2006) while informative, could be dropped for clarity.
Thanks again for all the graphical work you do here.
The image above is a quick and lazy overlay using PaintShopPro. I will update it (and clean it) probably this evening.
Thanks - no rush (well, on the other hand, things are starting to cook up in the tropics and north.) http://www.wunderground.com/tropical/
Below is a lighter version using data provided by Euan and Ace's forecast retrieve from this chart.
Click to Enlarge
Khebab - looks like I could get a job with the IEA:-))
The differences here are really quite large. By 2025 my model looks like it has double that of ACE's model - really quite significant for the post peak era.
Longer term - from 2015 to 2025 it looks like I'm pretty much aligned with Bakhtiari (C+C only).
I need to rethink the inclusion of NGL - no way will I accept C2 to C5 as liquid.
I think you may have my Ghawar high and base cases labelled back to front. In which case most of the differnce between that labelled "high case" and what I presented here is new projects.
Euan,
Including NGL in the production total only makes sense to the extent that the NGL amount actually contributes to (or perhaps influences) the availability of transportation fuel. How fungible are NGL? Somewhat intermediate between methane and crude, I suppose. NGL consists of ethane, propane, and higher hydrocarbons which can be termed natural gasoline. The first two are more important as feedstock for chemical production and for heating purposes, and the latter can be blended into finished gasoline. In any case, I would suggest that even accounting for the 30% lower energy content per barrel overstates the impact increasing NGL production will have on oil supplies.
I'd like to add another question to the above:
Could NGL be used as a substitute for the natural gas currently being used to produce tar sands?
Alan,
If you'll go back and reread 1observers post on the new thai method, it might become mote clear. So far there are three methods to produce the bitumen, the strip mining and washin the sands with hot water and the answer there is yes, but since natural gas is about 1/2 the price of crude on a BTU basis, why would you want to take an expensive liquid to produce low gravity bitumen that sells for a lot less, the answer is why? The strip mining costs about $90K per barrel per day of level production, its already marginal or a money looser at todays's prices.
The second method targets the tar sands below the reach of strip mining-its steam assisted gravity drainage, which is drilling a horizontal well, pumping in steam and pumping out oil. It targets the 15/16ths of the oil that strip mining can't work with because of depth. The answer once again is yes, but why? The liquid hydrocarbons is what the operators are after. This is also costing about $30K per level barrel per day of production. The last is the THAI method that Petrobank is using. It costs $15K per level barrel per day of production, and uses minimal gas and water in production. It looks economic to me. As I said, go reread that keypost Bob Ebersole
One other thing is that they can dilute the raw bitumen (OK,tar) with various liquids (such as NGLs) and get something that they can transport down a pipeline to Edmonton and beyond for upgrading.
Joules - I need to do a bit more work on finding out about NGLs. In the North Sea, my understanding is that NGLs condense out of wet gas during pipeline transport along the sea bed at temperatures of around 5 to 10 C. I think these arrive at pipeline terminals as liquids - and they are highly valuable light liquids.
It seems the broader definition includes everything from ethane (C2) upwards. Personally I would not want to count anything below C6 as a liquid - cos pentane, butane, propane and ethane are all gasses at STP. Perhaps these are frozen out in gas processing plants - but in my mind these are gases and not liquids.
I have covered ths issue in part by not including all the "NGL projects".
It seems like this is a belief that is increasingly posted here but I really don't see it. It seems more a case of calculating the amount of energy in renewable (and, for some period of time, nuclear) source and assuming that the requisite amount of such energy can be harnessed (even though the resources needed to harness the energy may be non-renewable) in sufficient quantities and at whatever rate may be demanded, and increased constantly to keep economies growing. I don't recall seeing a detailed analysis that shows this to be likely or possible. Nor do I read of possible side-effects (Albert Bartlett's lecture includes the quote that the major cause of problems is solutions). Nor is there any consideration of other problems of a constantly growing economy.
As this belief keeps growing, the chances of making a smooth transition to sustainabilty decrease. It's a sad situation.
I think we need to separate the "do we have the resources?" from the "what is the best course for the future of the world?" discussions. I think Euan is right that it is likely Earth has ample supplies of nuclear and renewable energy, which has been debated on this site many times. Many people who are anti growth seem to have been hoping that resource constraints would determine the answer to the "best course" discussions but a lot us just are not buying that.
I do not think anyone is in favor of unending exponential growth with the attending crowding and environmental devastation. But the anti growth people have not been willing to recognize that a rapid power down would also cause a catastrophe because the rapidly declining resources would not be shared to minimize the damage. The rich would be relatively unaffected and the poor would go to hell.
I think we need to transition to a new energy base in a way that preserves civilization and avoids the big die-off at the same time that we figure out how to maintain the long term viability of the planet and our species. But I do not think we could be in a position to say that energy usage must be capped for all times. If the population stabilizes and declines from were it is today and we preserve and re-establish as much as we can on the natural environment, who’s to say that that is unacceptable for the world if it also means continued growth in energy usage? Perhaps it has to stop somewhere but I do not think we are now at the point where we can know that the problems cannot be better addressed in some other way down the road. I think it would just be too arrogant of us to think we now have that level of knowledge and wisdom.
That anyone would even consider that continued growth is an option on a finite planet boggles the imagination. I am truly amazed that anyone would bag on anti-growth people, as if one who was anti-growth was somehow the bad guy. It is growth that is killing the planet, killing us. Every corporation that espouses growth, every oil man who believes that their oil will not cause global warming or more unneeded and unwanted growth, or more pollution, every right wingnut who equates our shoddy, faked up, plastic lifestyle with freedom, every one of those people are the bad guys. They are killing you and me as surely as they would be putting a gun to our heads and pulling the trigger.
Yet, I read this thread where people parse and haggle over the flow of poison as if more poison would be a good thing, as if a steadier supply of poison will make everything just peachy keen. The question seems to be, if we can only "preserve civilization" when in fact you are asking for the preservation of the planet-killing machine. Yes, people are going to die as a direct result of powerdown, a powerdown that will come no matter what. People are currently dying in Iraq as part of our energy policy, and I suspect that many more will die in the last great grab for the last of the poison. And, then, the poison will dwindle and run out and the dieoff will continue apace except that the number of people available for the killing machine will be much greater because we continued the idiotic, completely flawed paradigm for as long as possible.
Could people be any more stupid? I could only think that hitting oneself in the head with a rock hammer twenty-four hours a day could be anymore stupid.
Physics is unrelenting. That is the part that most of the people on this site fail to see. The poison does not just go "away." It stays in the system causing knock-on effects for hundreds if not thousands of years.
The first and second laws of thermodynamics do not care about your hair-splitting.
If you are truly serious about "saving the planet," then you must recognize that the paradigm is insupportable. We will not be living with nukes and super-efficient cars and special parks where we allow some species to survive. That masturbatory sci-fi fantasy is just that -- a fantasy. We must put this death machine in reverse and use the remaining fossil sunlight to get away from the paradigm. Restore the complexity we have trampled and rendered idiotically simple. Civilization is not complex. It is a bad copy of beautiful system. Civilization is not even as complex as that steaming dung plopping out of a horse's ass.
We will not know what happens exactly tomorrow. No one can. But I will venture this. If we continue along the techno-fetishist route, the earth may never recover. We may see Lovelock's vision come to, well not fruition, perhaps some other term like dissipation makes more sense. We may get to travel to Mars after all. Perhaps we are on that trajectory right now. Woohoo, sci-fi people rejoice!!! Why go to the red planet when you can bring the red planet here.
And Jesus wept.
Right on (except for the Jesus part). Is our way of life really a form of prosperity? If it is, then why are the putatively most prosperous seemingly the most bored? It seems more like a form of mania. I would argue that we found prosperity and then went right out the other side!
Matt
Well I guess it would not make sense to try to have a rational conversation about this with you.
Why not?
The tone and accusations in his post are not conducive to rational discussion.
Well, maybe those jousting over the latest graphs and tables, would like to return to earth and see what drives some one like Cherenkov to such articulate expression of passion and outrage, e. g. this link to the World Watch Disaster site:
http://home.att.net/~thehessians/disasterwatch.html
It is particularly fulsome today, Friday, Aug 31
Enjoy.
Well, I guess one could try a rational explanation of how economic growth can possibly continue indefinitely on a finite planet. I'd certainly like to read such an explanation, since such opinions appear to require a big dose of belief. One can understand cherenkov's frustration with the constantly aired view (or at least apparent view) that all we have to do is figure out how to keep oil production going long enough to switch to alternatives, and all will be well.
Perhaps you'd like to try a rational explanation?
What I am saying is that the energy resources exist for indefinite economic growth, especially in any timeframe in which we could make any meaningful predictions. Economic growth cannot go on forever but neither will the world last forever. I lay out some numbers in a post down thread.
I do not think there is much we can do beyond what is in train to prolong oil production and I do not want to massively build up coal either. What I think we need to do is begin a massive worldwide World War II level mitigation effort for a generation or two to build a new energy base. That would mean spending 25-50% of national income for quite a few years. That might seem incredible now be do not forget that we are still in the era of cheap oil.
I think that in a year or two peak oil will become widely recognized and within five years it will be intensely felt. When that happens, people could rally around a big project of the type just described. We would still have a big downturn and a lot of people will die but I think we can come through it in a generation or two.
I would engage Cherenkov if he could stop spouting invective and acting like he is the only one who understands anything. But throwing temper tantrums does not solve anything. We need to figure out what we really need to do to save the world. I am not ready to give up and let the world descend into hell without putting up a fight. A rapid power down would wreck the world and is not to be wished for.
Oh please, like anything we discuss on this board is going to make any meaningful impact on the world.
Per my other favorite, highly technical site:
http://realclimate.org
CO2 has moved between 180ppm and 280ppm in stately, 100k year sweeps for at least four continuous cycles based on the Vostok ice core records. These results are echoed clearly in the Concordia ice core which pushes the record back to 650k years.
Humans have pushed CO2 to 383ppm in the last two hundred years. We did a thousand centuries of movement in two centuries. And we moved the CO2 number outside the known range. And we're going to move it another 100ppm by the time I'm an old man which is another 100k year movement in terms of the earth's normal CO2 uptake/release rate.
Even if 98% of all humans drop dead of H5N1 over the next season it will be at least 100,000 years before CO2 returns to historic ranges assuming it instantly and magically begins dropping. Except that its gone nonlinear - we've set the balancing rock moving and its going to keep on going, headed straight for parts the earth hasn't seen since the Paleocene-Eocene Thermal Maximum about 55M years ago.
Look at those arctic sea ice numbers. First it set a record at 4Mkm^2, then it fell another 25% in 19 days to 3Mkm^2. And we've got several more weeks of melting based on traditional boundaries for freeze/thaw, which may no longer apply given the massive amount of heat absorbing open ocean now in the arctic. Who coined the phrase "a sledge hammer from the shadows" ?
So there is lots of fresh, cold, dense water about to pulse out of the arctic basin. This will stop the Atlantic circulation, stomping agriculture and raising heating costs in Europe, while the wind driven Gulf Stream will keep piling hot water up in the Caribbean, leading to hundred year storms back to back every year.
It got the polar bears. Its coming for us next.
Have you seen any papers about what the Arctic melt is doing to Greenland?
With some exception: There are a few looking forward to the catastrophe in some sense. That is because it is the only natural language that HWT (humans with technology) listen to.
The rich will be severely affected, since most of their status depends upon the poor allowing it, nay, WANTING it. Without the rich, what would the poor have to complain about?
Here's one pragmatic view of the effects of Descent:
http://www.oilcrisis.com/whatToDo/DeindustrialAge.htm
The problem with the cornucopians is that they go way beyond what anyone really needs. They like to promise that everything will be 'maintainable' with alternatives or some new magic solution, but they really are just schmoozing for votes like politicians. The reality is that we live wasteful lives in most of the world, and we think of ourselves as somehow able to ascend above the natural order. It has brought us to a point where we know enough to do better, but the resistance to change outweighs the value of the Commons.
Our DNA knows more than we do about whether we can live on an artificial planet with artificial foods and artificial environments.
I will add this caveat to the debate between cornucopia and doom and gloom: The total consumption doesn't really determine our future by itself. The determination of our sustainability is our Net Creativity. If we can somehow use our massive energy consumption to create more available natural world, then we have a chance to continue the growth. If we continue to consume the symbiotic world without replacing it or improving it, then we will find ourselves on a much less friendly planet than the one we evolved with.
It's a necessary evil. I have come to the conclusion that humanity needs to start over without FF's. Without them, it is unlikely that we will ever achieve the level of activity we have today regardless of how much knowledge is still laying around. Our modernity is inherently alienating and it's layer upon layer of stimuli has made people (who basically are concerned w/ generating more activity for activity's sake) impossibly distracted and shallow (it's really that simple, the mind just can't handle it all...). In this sense the potential tragedy of PO eventuates an opportunity.
Matt
Great, some common ground.
I am not a cornucopian. Cornucopians think that there are plenty of the resources we currently use and therefore no significant change is required. I think a massive catastrophe can be avoided by totally switching our energy base. This would require a World War II level of commitment by the world for a generation.
I think if you look at the facts it is inescapable that the world has adequate energy resource to grow its energy usage indefinitely after a wrenching downturn to switch to an infrastructure based on fission and renewable sources. You might disagree with that but that's not the question I am trying to raise. My question is: if that is possible, what is our best course of action?
I think we could agree that it would be a good goal to stop and reverse the growth of the world's human population. So what is the best way to do that? Is it to create an avoidable crisis to starve the world to bring about a rapid die-off? I do not think so. I think the problem with that is to come up with a plausible scenario that gets us from here to there without wrecking the world.
However, one approach that we do know has helped in stopping population growth is development. There is practically no population growth in the developed world except for through immigration and births to immigrants. So maybe raising the standard of living of people is the best way to convince them that they do not need six children. There is a way that increasing energy usage might help the goal of achieving a more sustainable world.
What is it about energy consumption that is inherently evil? If we had non polluting electric cars, a much lower human population, a stable climate and a protected and repairing natural environment, would it matter if we traveled more than we do now? Is space travel inherently evil? Would living in the world of 25 years from now with one billion times the computer power we have now, where we spent most of our time in virtual worlds, be inherently evil?
How do we best minimize the destructive effect we have on the world but still live good lives? I do not think the only answer is that we all need to die or live in poverty.
I think you emphasize population as the issue too much. Resource use is the problem that makes population growth seem to be a problem. Development has slowed population growth in the richer countries, but we are the ones consuming the planet's resources and contaminating what's left. A human is only as valuable as its products. If we insist on "always low prices" for products, then we are insisting that the value of the humans who produce them are also "always low". Thus, development and machinery and money become the guiding principles of the planet. When added to the disconnect between humans and nature provided by religion, we look at each other as disposable filler for the houses we are building in order to be "profitable".
Before looking for solutions to the population problem, we first must engage ourselves in finding out what people are FOR.
I don't know where I found this quote:
"The problem with the road to hell being paved with good intentions is that it is PAVED."
but it is applicable. Once again, an idea is simplified when it should be more complicated. The problem is not the paving of the road, but the "fit" of the road with natural systems (which includes human beings). A road built with stones taken from a field improves both the field, and the life of the humans. A road paved with toxic glass and petroleum degrades the local fields, the humans who touch it, and encourages even more paving than is necessary.
We SHOULD be looking for alternative energy sources. We should not concern ourselves with using those sources to maintain the status quo of comfort. We SHOULD be concerned with population growth, but more concerned with the resources that those populations are consuming, and the usefulness of the population distributions. Decreasing consumption overall would be grand, but we don't have time to educate everyone, and they won't listen anyway. I'll leave that up to Nature right now.
The most misunderstood term at the patent office is "useful".
The Standard of Living should be measured by needs, not money. Unfortunately, we think that people who are overstressed, undernourished, underexercised, overweight, and generally ill have a 'high' standard of living because they have a lot of money and live in expensive houses or apartments, breathing dirty air.
If we want to improve people's lives, the best way to do it is to get rid of most of the stuff they own so they can stop worrying about how to keep it, and stop breathing the toxic fumes that are outgassing from all of the paint and plastics.
I think you have it backwards. It is population growth that is driving destruction of the environment, which appears to be much worse in the developing world. We do consume a lot more resources in the developed world but our environments are a lot healthier than in the developing world. That's my point. That it is not the absolute quantity of consumption that should concern us but depends on the details.
Of course, global warming is now more caused by the developed world although China may soon become the leading source. In the future, as we run out of fossil fuels, the developed world can also be expected to lead in low polluting sources such as nuclear and renewables.
I don't think there is any debate that there is enough energy in and coming in to the earth to meet projected demand. What has not been adequately addressed is whether that energy can be harnessed for our use at the rates required (for society to continue as now) and without any side-effects. Harnessing energy takes resources and diverts that energy from the uses that is has in the current balance of nature. There is also no debate that energy growth has to stop, so the use of the word "perhaps" is misleading. It is impossible to keep growing resource usage (and harnessing energy takes finite resources) on a finite planet. So the "problem" of not being able to continue growing economies and populations is a known problem that cannot be addressed in any way (because we live in a finite world). Even if we could somehow grow our energy use far into the future, there would be other needed resources that become scarce.
Unfortunately, the vast majority of people can't see the finite nature of the planet and I think that may even be a majority opinion of posters at this site. Consequently, the chances of attaining a sustainable society and of smoothly transitioning to that society are virtually nil. If the people here can't see that an unsustainable society can't be sustained then we have no chance at all.
Wrong. That is debatable. It is possible that human civilization could continue to increase its energy use, on average, until the earth is consumed by the sun. But I am not advocating that.
The issue is energy use that is destructive to the planet, not just any use. Of course, all uses have some impact but it is not clear that all uses have net negative impacts. For example, I illustrated up thread how increasing energy use could lead to a stable and eventually, I believe, declining human population. That would have a positive net impact.
I am afraid that it is not in the cards that there is no way that mankind can use increasing amounts of energy. There is just too much fission fuel out there and too much solar energy coming to the earth. I think the question needs to be how can we best secure objectives that will improve the sustainability of our planet? You cannot just rule out options that require increasing energy use. And you certainly cannot just rule out discussion of such options because you think they are impossible.
Please explain how it is possible for humans to grow their energy use until the earth is consumed. You missed the point that although there is enough energy for humans to do that, there are not enough resources to harness that energy, nor is it clear that doing so would not have consequences that would stop such growth anyway. So please explain such an extraordinary claim.
That is the most absurd thing I have ever read. Humans have the ability to consume extrasomatic energy, that is energy outside the body. We can consume fossil energy until it is all gone, then we can consume energy from our environment, like wood or cow dung. But that would be a dramatic decrease in energy consumption, not an increase. We cannot increase our energy use when there is an ever decreasing availability of energy to consume.
We have discussed fission and solar energy on this list, and other lists such as Energyresources, for years. Only dreamers truly believe that solar or fission energy can ever replace fossil fuel. We have beat that horse to death. But you can try to revive him if you wish. Lotsa luck.
Ron Patterson
That hasn't been discussed so much as claimed.
In what manner do non-fossil energy sources not have any hope of replacing fossil fuels? Size of the resource is an obvious red herring; the amount of solar energy available is about 8,000 times larger than current world energy consumption.
Perhaps the uses of fossil fuels are non-replaceable? As I understand things, the primary uses of fossil fuels are:
#1 is obviously replaceable, at least in theory - electricity can be produced from solar, which (as above) has a huge total resource base, and which can be designed to provide base load as well as adjustable load via thermal storage and/or pumped storage.
#2 appears to be replaceable for personal transportation (e.g., Tesla Roadster), local commercial transportation (e.g., Modec van), and long-distance ground transportation (e.g., electrified rail). Unaccounted for are air travel and long-distance water transportation (although see below).
#3 is replaceable, via resistive heating if nothing else.
#4 is different, since it uses the chemistry of the fossil fuels, rather than their energy content. Some uses can be directly replaced (e.g., haber-bosch for fertilizer can use hydrogen from electrolysis rather than from natural gas), but others require hydrocarbons. Also included in this general category are lubricants, asphalt, and the like - some of these may be more directly replaceable, but for the moment let's assume these niche products are not.
However, note that the Fischer-Tropsch process can synthesize hydrocarbons from the products of biomass gasification. Accordingly, some level of hydrocarbon usage can still be supported in the absence of fossil fuels.
Hence, asserting that it is impossible for fossil fuels to be replaced in theory requires one of several strong assumptions:
#3 seems highly unlikely, and I certainly haven't seen anyone claiming it.
#2 also seems unlikely - electricity generation, transportation, heating (incl. industrial), and replaceable reactions (e.g., fertilizer) represent the vast majority of fossil fuel uses (over 95%, based on what I've been able to find) - although perhaps an argument could be made.
#1 is the only one I have seen claimed, but I've never seen it supported with evidence. Solar thermal does not appear to require rare components, or tremendously vast quantities of more common ones like steel. Lithium for batteries is present in seawater at high enough concentrations to last for millions of years. Accordingly, it seems like #1 is a possible reason why fossil fuels could never be replaced, but is a strong claim that requires strong evidence to back it up.
There may be other assumptions that are sufficient to render fossil fuels irreplaceable, but I haven't seen any others claimed.
(Note, of course, that I'm only talking about whether it would be possible for fossil fuels to be replaced, not about whether we have enough time to do so, will do so, should do so, can do so economically, or anything else; those are separate issues to the question of overall possibility.)
Is that calculated to get me to take you seriously?
I am not surprised that you are not up on the nuclear discussions that we have had on this site because I never see comments from you in them. I can report that the proponents are doing quite nicely, thank you, and are steadily gaining support. I usually do not talk numbers much with the opponents because we live on different planets as far as what the facts are and the laws of physic are different on my planets than on theirs.
Briefly, we know that there is about one trillion tons of Uranium in the shallow crust that is recoverable at EROEIs of 20 or more. It takes about 200 tons per year per 1,000 MW reactor for a once through cycle (there are about 440 in the world now). But that only uses about 1-2% of the energy and no doubt in the next 100 years or so we will be able to recover most of it. Then there is also Thorium, which is three times as plentiful and contains about the same amount of energy. You can see these are huge numbers.
You might have been misled by the low reserves numbers that are out there. You should know that the mining companies only looked for it for a short period in the 1980s, found about a 100 years supply and have not looked since. Demand is not very elastic so new discoveries would only collapse the price. No reason to do that.
I think there is a quite widely shared view here that we could build a transportation system based on electricity (there was a great article on the site a week or so about very promising developments in battery technology). There are a lot of low grade hydrocarbons left on earth that could be transformed to plastics and fertilizer with adequate energy inputs.
The US would need to build about 1,000 reactors to replace most of today’s energy. That would cost about $3 trillion at today’s prices. That’s about 25% of national income for just one year. We spent 38% of national income in 1944 on the war effort. As you know, the oil industry is planning to spend a lot more than that to manage the tail.
I am not saying it would be easy and it might not be possible. But it is an option we should continue to debate.
To me, there seems to be several parts here that require belief.
Yes, I've seen the figures on uranium but I've also read posts that don't paint quite such a rosy picture. As always, cherry picking is done with resource production, so whilst there may technically be recoverable uranium resources for millions of years, it's not clear that those resources could be produced in increasing quantities (or even stable quantities) for much longer. Should we start building more nuclear capacity on that belief and ignore the other downsides of nuclear? How long can nuclear capacity be ramped up?
New reserves doesn't depress the price of uranium, only new production, so your belief that there is no incentive to find new reserves doesn't seem right. A uranium mining company with only 2 decades of reserves might not be as secure as one with 2 centuries of reserves. They don't have to produce those reserves.
Yes, there is a widely held view that we could replace personal transportation with electric vehicles, but this is also a belief. What would personal tranport look like with only electrical power? Would we be able to produce enough storage capacity for 700 million vehicles now, and 1.5 billion vehicles in a few decades?
Are there enough resources to harness solar, wind and nuclear energy to replace fossil fuel energy and continue to increase that available energy? That's the sort of calculation I haven't seen, when the claims are made that we can continue to increase energy usage for ever. Others have also pointed out that there is a limit long before the actual energy source runs out, because of residual heat, in using the energy.
I have also not seen good figures on how we continue air and sea travel (including freight), as fossil fuels decline.
Limits to Growth pointed out problems with all kinds of resources, not just energy resources, that will likely hit us in the not too distant future. And, of course, climate change is a problem.
Are you saying that you believe that economic growth can continue, globally, far into the future, and that all it will take is some concerted effort to move to different energy sources? If you are then I've yet to see a good solid rationale for that belief. If you aren't then why are we arguing, since an unsustainable society must come to an end and we really need to figure out how to make that end as palatable as possible.
Excellent post.
"I've also read posts that don't paint quite such a rosy picture"
You know as well as I do that many opponents of nuclear repeat claims over an over that have only flimsy foundation and will not listen to evidence to the contrary. I am totally convince that we could ramp up from today’s 65k tons annual rate indefinitely, considering that we have a resource base of 400 trillion tons equivalent (Uranium + Thorium high EROI, using 100% of contained energy).
But would it make any sense for us to commit the world because we thought we knew what technology would be capable of more than 1000 years or even 100 from now? Like we know that man will never be able to use that 400T tons equivalent?
"so your belief that there is no incentive to find new reserves doesn't seem right"
OK, so maybe I have not nailed the reason but the fact is that there has been no concerted exploration since the 1980s. You are not going to find much if you do not look for it. The mining companies know the crust concentration numbers we have been discussing.
"there is a widely held view that we could replace personal transportation with electric vehicles, but this is also a belief"
That's what this phase of a transition life cycle looks like. I think it is remarkable that the needed technologies are all almost cost competitive with cheap oil today.
"What would personal tranport look like with only electrical power?"
We could make vehicles very much like today's cars but I would prefer building them from ultra light materials so they were a lot more energy efficient. Charge them at night or at a charging station (5-10 minutes with the new technologies). No storage needed. Just a lot of spinning capacity.
"Would we be able to produce enough storage capacity for 700 million vehicles now, and 1.5 billion vehicles in a few decades?"
I think we get to the current number 50 years from now. There is going to be a big down turn. But I think we bottom out in about 30 years, maybe sooner.
"Others have also pointed out that there is a limit long before the actual energy source runs out, because of residual heat, in using the energy."
TOD poster Dezakin has estimate the number of reactors that would equal the solar flux [your point]. I think it is about 16 million. I am talking about around 10,000 for the world in 50 years.
"I have also not seen good figures on how we continue air and sea travel (including freight), as fossil fuels decline."
We have nuclear ships now. Air travel is another issue. But we do have a great deal of low grade bitumen and shale which could be synthesized into aviation fuel as long as you do not care if you have to put more energy into it then you get out of it.
"And, of course, climate change is a problem."
Nuclear, wind and solar have very low carbon footprints. The faster we build nuclear and renewables, the faster we can get away from coal.
"Are you saying that you believe that economic growth can continue, globally, far into the future...?"
Far enough into the future to take issue with the claim the growth in energy use has to stop now. I hope that I have at least convinced you that the subject is debatable.
"If you are then I've yet to see a good solid rationale for that belief."
I will keep trying to convince you that I have a solid rationale. I am not yet going to try to get you to adopt my belief.
OK, but I still see lots of beliefs here. It seems to me that basing a future on beliefs is a bad way to go. This is why I don't understand the apparently increasing number of posters who seem to believe that there is no real energy problem, even if it will take a lot of effort for the world to change. Not only is it a belief but it also ignores the other problems of growth in a finite world.
You're right that the subject of growth is debateable but only in terms of how long it can continue. Since no-one knows what that period is (from 0 years to thousands of years), but we know that it cannot continue, it would seem much more sensible to look at ways our societies can become truly sustainable, without us living dreary, uncomfortable, lives, in constant struggle. That would be a more rationale approach. Since we don't know the timescales, let's not wait to find out who's right, rather let's impose our own timescales and work to build a long term future for ourselves and our decendents that we know can work.
There's a lot of useful work here in trying to determine when peak (oil, gas, coal) will occur, but I'd hope that we could get away from the constant hope that somehow the world can go on, more or less, the way it is today, even if a temporary downturn is inevitable. If we're not proactive in transitioning to another way of living, it could hit us like a sledgehammer.
Economic grow can clearly go on forever because it is not necessarily based on physical things. It is based on what people value. Intellectual content can expand indefinitely without having much effect on the physical world. I am a software guy and I see unlimited horizons in my field.
Growth, per se, is not bad. There is good growth and there is bad growth. I think we could agree that growth that consumes land (transforms it from its natural state or from a healthy environmental state) at this point is bad. I think that kind of growth is mainly related to human population grow. I think we could also agree that not only do we need to stop human population growth soon but we also would be better off if we reversed it and brought it down to a fraction on where it is now. I think that the only way that that is going to happen is if the entire world reaches a certain level of education and prosperity where people do not have incentives to have too many children.
It is pointless to talk about this in terms of more than the next few hundred years because we simply cannot imagine what the world will be like beyond that. Do you think anyone could have accurately imagined the last few hundred years?
I think growth in use of materials in the earth's crust that are plentiful can go on effectively indefinitely. We do not ever really consume metals. We just transform them. I think we can continue to rearrange our world indefinitely as long as we preserve or recreate a good portion of the natural world and have healthy environments in the human transformed parts of the world.
I think we can develop clean energy source that let us manage this world and live well. I am not aiming for us to live "dreary, uncomfortable, lives". We just differ on how to get to a sustainable world.
I'm not familiar with such growth. I can't see how such growth improve lives or standards of living if there is nothing physical about it. Of course, knowledge is nice but if it doesn't achieve anything physical, then what is its intrinsic value? If all the economic growth is on paper then it certainly won't affect resources in any way. But it also won't have any effect on people's wealth or percieved living standards. Do you think our societies will be happy with that sort of growth? Does it create more jobs, more profits, more possessions? Will it satisfy people's aspirations.
I'm a software guy also and certainly don't see unlimited horizons in my field, or any other field. In many cases software is only necessary to deal with the quantity of transactions "necessary" in growing economies.
I disagree. It's important to distinguish between growth and increasing quality of life. Of course, one could accommodate short bursts of growth but even that cannot continue indefinitely. If we don't set limits, natural limits will be hit anyway. But we don't have short bursts of growth; most governments strive for continuous growth and see no natural limits.
Absolutely right. However, as I've said, growth beyond the next few years is a matter of belief. If we knew for certain that modern societies could go on much as they are today, for the next century, then there may be a selfish (a perfectly normal human trait) case for saying let's not worry about it now. However we don't know that and maybe it's about time we started to look forward further than a couple of decades and try to figure out a way of running societies that are sustainable so that future generations won't possibly face even harder decisions and adjustments than we face today.
That's one way of looking at it except that to reuse the metals that we've already produced, we'd have to demolish what those produced metals are already being used for. The latest edition of the book "Limits to Growth", includes some charts about metal and we can see the huge decrease in the quality of copper ore that is now being mined, compared with a century ago. If we are still mining it, anyhow, then it is not simply being tranformed; it is actually being used and so is not available again (apart from relatively minor recycling schemes, minor relative to the amount already in use). Rearranging the world is OK but is not growth. So I'd be happy to just rearrange constantly, providing we don't need increasing amounts of energy to do it.
Neither am I aiming for us to live dreary uncomfortable lives, which is why I suggested that we figure out how to avoid that, in a sustainable way. The principles of sustainability are easy. We must not use any resource more quickly than its renewal rate. If we go beyond that then we are living unsustainably. Of course, there will be some resources that are so vast that such a constraint has little meaning but I doubt our societies are structured to use only those resources. Richard Heinberg distilled some rules of sustainability from various sources. They can be read here.
My point in this thread has been to challenge anti growth orthodoxies so that when I try to talk about solutions with people in that camp they do not try to shout me down like Cherenkov. I think their rhetoric can be very counter productive although I applaud their motives. I will have to get around to reading Richard Heinberg. I am just going to summarize my case, as this thread is getting old.
It is not the case that the growth in energy use must stop for any obvious reason. That might be a good idea, but that is another whole argument. There is enough fission fuel to grow for what, for all practical matters, is indefinitely. Solar and wind might also eventually be able to scale to be major sources of energy for the world. It is also possible to imaging using this energy base to provide a complete transportation system that is eventually comparable to what we have today. With this energy base, it would also be possible to do without the high grade hydrocarbons that we rely on today for chemical feed stocks and fertilizer for a long time.
It is also not the case that economic growth must stop. Some economic growth is natural resource constrained but some is not. It is possible to imagine a world where population is stable, the environment is healthy and protected and the world economy continually grows. The growth might only come from music, TV, books, movies, video games, virtual worlds, software, communications, travel and their 23rd century equivalents (maybe even space travel). But this is still economic growth as we define it today.
It is not helpful to cut off debate on potentially viable options because one’s political orthodoxies say they cannot work. My favorite illustration of this is the population problem. Rapid consumption of cheap fossil fuels has caused population overshoot on earth, primarily in the third world, because their cultures were not able to respond adequately to the sudden plenty and they kept have far too many children. This is now a serious threat to the world especially as the cheap fuels run out. What are we going to do about this? A sudden power down would be an enormous disaster, especially to the third world. The only good solution might be that we need to improve the standard of living in these areas because we know that that has dramatically slowed population growth in the developed world. That will require energy and economic growth in these areas. We should be able to debate such approaches.
Some growth is bad. Some is not. Some energy sources are damaging. Some are manageable. If we are going to carry on productive discussions on this we have to be more sophisticated about what the real issues are.
Sofistek, thanks for a very interesting debate. I have greatly appreciated your reasonableness and the fact that you have listened to my arguments. You have made a lot of great points. You can have the last word.
I don't think it will be the last word, sterling, though it might be in this thread. I too appreciate your reasonableness, so let me summarize my position, also.
You haven't demonstrated any growth that doesn't use more resources. Growth in any of the fields you mention requires more resources. Real economic growth requires more resources. We live on a finite planet, so there is an obvious reason why energy growth cannot continue indefinitely. It is not only energy resources that are finite but also the resources needed to harness that energy and the resources needed to make use of that energy. So energy growth and economic growth must require more resource use (apart from occasional improvements in efficiency).
So energy growth is not the only problem but even energy growth relies on belief that alternative sources to the energy dense sources of fossil fuels can be harnessed in sufficient quantities, at sufficient EROEI, at sufficient rates for long enough to appear infinite on human timescales.
There is no particular reason that every person in the world should not aspire to the same average prosperity of those in the developed nations though doing so would undoubtedly put an unreasonable strain on the world's resources and, in my opinion, would be impossible. Powerdown is inevitable, so we should aim to do it in a controlled way. Unfortunately, so many people, even many on TOD, appear to want to bypass that hard decision or at least delay it indefinitely. I think there is enough energy now to move to sustainable societies but only if everyone in developed nations accepts the need for a huge powerdown. There may be no need to do that in a precipitous fashion but I think the need is urgent. The longer we ignore it, the less likely it is that a smooth transition will be possible.
Relying on faith for energy growth is the wrong way to go. We know we live on a finite planet and we know what the conditions are for sustainability. And yet, very few people want to contemplate these facts. If someone could give a rational explanation of why "life as we know it" can continue for many generations more, I could well alter my view, and, to be honest, I'd love to alter my view - we have a hard road ahead. But basing a future on wishes doesn't seem sensible to me and shows that, so far, we've learned nothing from the past couple of hundred years.
So it seems the argument comes back to the same old thing....is the reason Saudi Arabia has not increased production measurably, and in fact been flat to down, because they can or because they will not? No one knows.
I have long argued that even if they could, they wouldn't, not until they flush out every bit of the competition and all the possible alternatives. The Americans I think underestimate the magnitude of the effect of the 1980's period on Saudi thinking. What if there is another "North Sea" off the coast of China or South America? What if the advances in technology in the Tar Sands of Alberta actually work, and North America's massive demand can be satisfied by oil close to home? They can't KNOW that it won't happen, and niether can we. We should NOT count on it happening, but we can't know it won't.
IF the tar sands production really starts to climb, or IF large new fields are found, then we will see if the Saudi's want to and are able to boost production to hold onto cash income and customers. If these do not come to light soon, the Saudi's will sit on a "production maintainance" regime into the indefinite future. Wouldn't we do the same?
At street level, in the West it simply doesn't matter really. We need to take the position that KSA either cannot, or if they can, will not, increase production for our benefit. Those days are gone. American demand side reduction and development of alternatives MUST happen on a big scale either way.
We are wasting time arguing about "why" we should be doing something, when no matter the why, the path is still the same! REDUCE DEMAND. DEVELOP ALTERNATIVES. The path forward is the same no matter what the URR of Saudi Arabia is.
RC
I think that we are arguing about how fast the Titanic is sinking (and about who has the best estimate of when the ship actually sinks) as the water is lapping around our ankles.
Timing is everything, WT. Remember, we need two decades of lead time in order to make an orderly transition away from FFs. Every year gained is one year of less pain and hardship. Being the efficiency expert you are, I would have expected you to appreciate that...
If we had another decade people would just keep on having babies, clearing land and building houses in the suburbs, i.e. doing what comes naturally. Delaying the collapse wouldn't be good news for the planet, or for humans.
I like analogies. It allows those of us with less oil production technical knowledge to enter the discussion:
I think we are arguing, whether we are on Titanic, if it is going to sink or be only slightly damaged by an iceberg.
But most of all, we are debating very tight timing margins as to WHEN this event (sinking, iceberg, close-call) is going to happen.
As for the water coming in... opinions are divided. Some think it is just rain, some think it is a fixable temporary hole in the hull and others think we have already started to go down.
But can anybody really tell for sure? Or to convince others?
No.
So we wait, discuss, look for more data to emerge, try to interpret it and draw interim conclusions.
And time passes...
Hello Euan,
Thxs for the hardwork on the keypost as usual. As mentioned by you: you see NGLs as crucial to a correct assessment. Just to make an already difficult KSA analysis even more so:
1. From the Linux Ghawar Oil-Sat Graphic [or other sources]--Is it possible to determine the relative extractive percentages of crude, condensate, and NGLs? Would detailed analysis of infrastructure capabilities reveal these individual percentages?
2. Are there any geologic formulas that could reveal the expected rate of decline of each of these components [C + C + NGLs]? Example: are carbonate oilfields generally NGL-rich compared to sandstone oilfields due to greater porespace?
3. Is the underlying Khuff carbonate gas mostly dry gas or does it have a significant wetgas NGL percentage? My ignorant assumption is that NGLs will peter out much faster than C+C for Arab Zone D, maybe slower for the lower Khuff carbonate [but much less NGLs in the Khuff to begin with]? This is based on assuming that water-drive extraction drives the associated gas out more easily than the crude.
4. Or can setting the Christmas Tree valving atop the oilwells be the crucial factor in the extracted component percentages? Is controlling for watercut inextricably linked to produced percentages of NGLs, or independently variable?
Thxs for any reply, and please try not to laugh too hard for any ignorance on my part.
Bob Shaw in Phx,Az Are Humans Smarter than Yeast?
Bob,
NGLs do not come from the oil-bearing reservoirs, but rather from the non-associated gas wells (usually accessing much deeper formations). NGL composition will vary between gas fields, but it is not connected to oil production.
JB
A correction. NGL's come from gas reservoirs, from casinghead gas (associated gas) and from gas caps in oil fields.
Matt Simmons is thinks that a lot of the current increase in NGL production is coming from operators blowing down gas caps to oil fields (that are in terminal decline).
Given that I've never drilled an oil well, I'll yield to your correction. But then, for oil wells, what is the difference between NGL and Condensate?
With regards to Matt's suggestion, I would say that, at least in Saudi Arabia. the vast majority of the added NGL is coming from the newer Khuff gas wells operating in Haradh and fields such as Tinat and Waqr, all feeding into the Haradh gas plant brought online in 2004. There are also a lot of new gas wells going in in Uthmaniyah and Hawiyah, far from where a gas cap would be.
Condensate is natural gasoline.
NGL's are most commonly considered to be C2 (Ethane); C3 (Propane) and C4 (Butane).
As noted up the thread, I have a report that Saudi Arabia will be shifting 500,000 bpd of liquids production to domestic consumption in power plants and desalination plants over the next two years, because of a shortfall in natural gas production.
Interesting, Euan. You criticize Ace for taking "worst case" numbers (which have been close to correct thus far, by the way) and then give yourself a pat on the back for taking all the "best case" numbers and getting a higher prediction.
You do, at the end, try to moderate your own blind faith in KSA just a wee bit but it doesn't really help your case. Let's note that Ace predicts 8.2-8.3 mbpd from KSA next summer. If KSA produces that in that time period will you change your position? If KSA production in July 2010 is 7.9 mbpd will you change your position? What falsifiable hypothesis are we discussing here, Euan? What alternative hypothesis would you consider credible if your own fails? In other words, are we doing science here or theology? What is important is not defending your personal position but for the community as a whole to try to synthesize the best hypothesis from the continuing data stream that we can create. And then to test that hypothesis and further modify it (or discard it and replace it with another) as data warrants.
So give me a falsifiable hypothesis, Euan. Ace has done so with his forecasts which can be shown to be right or wrong and if wrong, by specific values as to how wrong. What are you giving me here besides opinion?
"The greatest shortcoming of the human race is our inability to understand the exponential function." -- Dr. Albert Bartlett
Into the Grey Zone
My back is aching and my wife is screaching so I will be brief.
The model I present includes a pretty catastrophic collapse of N Ghawar.
It includes 5% decline of heritage assets which I think is likely too aggresive.
It includes 1 and 2 year delays for new projects coming on stream.
It includes 2% decline of these projects - even though they are brand new.
And yet you say I am taking best case numbers. So would you care to suggest how this should be done differently.
My understanding of Ace's analysis is that it relies entirely upon the 1991 to 2001 HL decline that points at 175 Gbs (please correct me if I'm wrong here Ace). He cites Westexas and Hans Judd as the research papers and both use this decline trend.
My opinion on this is that it has little chance of being correct. In that time period Saudi Arabia was not pumping at capacity, Haradh and a bunch of other fields were not producing and on top of that Saudi had withheld capacity from their developed assets. How on Earth can production from part of the resource base predict the size of the whole?
You are asking for a falsifiable hypothesis and you have it in this post. The only way of testing this which you know full well is to wait and see. But we may have to wait a number years to ensure that demand side data are not impacting the outcome.
In fact, it is worse for the "doomers" than you say, Euan.
Saudi Arabia production is perfectly flat from February on at 8.6 million b/d (EIA data). This does not accord with declining production at Ghawar as described in the Gospel According to Stuart. This does not even accord with such presumed (on The Oil Drum) declines taken together with compensating production from new projects like Haradh.
What it really points to is a high degree of discipline from the 2nd largest producer in the world. But, I could go on and on.
This whole discussion reminds me of a —
A monotreme (early mammal) but with characteristics
of a reptile (it lays eggs) — what is it?
If we round off slightly to the nearest 0.1 mbpd, Texas production was flat for two years, at 3.4 mbpd, following its peak in 1972 at 3.5 mbpd. I suppose that it is possible that Texas has shown a high degree of discipline by "increasing its reserve productive capacity" for 35 years.
As noted up the thread, I find it interesting that Saudi Arabia, like Texas in the Seventies, has responded to higher crude oil prices with a significant increase in drilling activity--and lower crude oil production.
If you go to the OPEC web site:
http://www.opec.org/home/Monthly%20Oil%20Market%20Reports/2007/mr072007....
Then click on the month you wish to download, you will find that Saudi production has been bouncing around. In June Saudi produced 8.54 mb/d. In July it was 8.53 mb/d. Down only slightly but well below what the EIA has.
Ron Patterson
If by well below you mean 60-70k bpd, then yes, I suppose that could be 'well below'. However, when talking about production in many millions of barrels, its just data noise. The IEA shows data at or above 8.6 million bpd. If its 10k above, can we use 'well above' our range? The point is that the data from various organizations point to a stabilization of around 8.6 million bpd for the better part of a year now. If they were in permanent decline, this would not be the case.
Euan,
I think you have done an incredible job of sorting out the differences on TOD. Particularly, the chart showing Stuart, Ace, Campbell, et al.
Care to take a wack at Russia and/or Mexico? Perhaps you have already done it.
There was a time when a well in Saudia Arabia produced 20,000 barrels a day and they only a had a few hundred wells and a few dozen drilling rigs. Currently there is a drilling rig shortage and the production per well has dropped to about 5,000 barrels, a sign of depletion and decreasing reservoir pressures that must be maintained by water flood and top skimming waterlogged areas with horizontal fishbone wells. As they have been drilling Ghawar to try to slow field production loss they imported and diverted rigs to new field developments. They have not been able to explore as much. There will likely be numerous smaller satellite fields. They have found some new fields around the south end of Ghawar in recent years. They have dozens of untapped fields in inventory. I do not believe we will see 12,000 barrels a day from them anytime soon and probably not later either. They had to finance part of the government's budget with petrodollars and internal oil consumption was growing. This summer I read that the Saudis consume about 2,000,000 barrels a day. Rapid population growth has lowered the per capita income potential there.
Sorry for the inaccurate estimate. I think the Saudi rig count about 1980 was close to 15 working rigs. If you drill 100 wells @ 20,000 barrels a well you get 2 million barrels of production. That capacity is history. There was one well in the Kurdish area of Iraq that produced 20,000 barrels at drill stem test recently, but it is a rare well.
I have absolutely no qualifications to opine on the technical issues here. But I do know, and everyone here knows, that there are enormous incentives, for anyone who can get away with it, to keep oil in the ground as long as possible. So part of the question is: do they Saudis think they can get away with it? And if so, have they done so, and with or without a nod and wink from their friends in Washington?
If one has oil, and one CAN get away with it, oil in the ground, just sitting there, is the very best investment in the world. The worst is probably US (southern/western in particular, but all) suburban real estate. And they are of course not unrelated.
P.S. And this is why Matt Simmons call for transparency in reserve data will never be met. We're in the end game now, and power comes from possessing undisclosed reserves. Of course danger also comes. Either way, this is a significant difference from the US peak. Geopolitical factors now greatly complicate gaining knowledge of the true state of affairs in regard to peak.
Dave, Great investment until someone realizes what's down the hole and on the ground. Perhaps that's why the kingdom is investing $5 billion to create a 35,000-member security force to guard its oil infrastructure from terrorists (and anyone else, one would guess).
Brought to you by the folks at Lockheed Martin.
New production likely to come onstream in Georgia FSU. Manavi M12 due for an acid frac in Oct by SLM - could hold several billion bbls, Kumisi a gas / condensate well expected to contain >> than 1TCF. Canargo ( Amex CNR )
For DD go to www.investorvillage.com
If we are now in the zone of global peak, it no longers matters that much what KSA can do, or can't do. KSA can hold back production and allow others like Angola to produce. Or, it can increase production. But it really doesn't matter if we are peaking globally. In saying this, I am taking a mildly solpsistic approach, to be sure. But I come at this whole problem more through through price, than geology. Through my lense of price, if KSA has lots of extra capacity, and we are not quite at peak, then price may wind up not accellerating as quickly, which simply allows demand to run more freely.
As I no longer find KSA story as compelling as I used to, what I do find notable are the several and notable ways that KSA is now indicating they want to concentrate more on adding value to their product, than production per se. Their infrastructure plan that will give them the ability to swing flows from their East Coast (security), to their West Coast, strikes me as huge. And the new round of large petrochemical plants (diversification) they have planned also fits in to this. You know, having a new awareness of the finite nature of your resource, deciding to upgrade the value-add of that resource, and holding back production of that resource--these things strike me as peak behavior.
Gregor
A discussion of the reliability of HL to predict URR... and, then, using URR to try the predict the important variable, future production.
Forgetting the various things SA has said, what are they doing?
SA production is down, along with their quota. Nothing here; SA, indeed all OPEC members, sets their own quota, meaning their meetings are much ado about nothing.
Rig count is up 4x in three years (I think.)
Vast new water handling equipment is on order, presumably to process higher injection/water cuts.
New pipelines are on order.
New refineries are on order, apparently to handle heavy/sour/vanadium oil.
Shippers are suffering from reduced rates. New ships are not on order. (This makes sense - if production is flat, and exporters are exporting less, there is less oil to be shipped. Maybe we will never need another ship even as we are increasingly short in every other bit of energy infrastructure.)
So, cost to produce a barrel in SA, still lowest anywhere, is rising rapidly. It mght be instructive to compare what they were spending/year before the increase in rigs began, and what they are spending now. IMO the difference will not imply that they have a couple of million b/d light sweet available at a moment's notice.
Would SA have done more than they did do if they went into a blind panic two years ago because Ghawar was crashing? you are, I think, looking for four more years of good production in N. Ghawar. Would they have expanded efforts as they did if, in 2005, they saw at least six more years of full production at Ghawar? Would they have continued their multi B crash program a few months later (in early 2006) if they saw a need to voluntarily cut production because OECD stocks were too high?
Can they produce more than 9.6/d?
And, if so, do they want to?
Saudi domestic oil consumption up 6.2pc in ’06
http://www.khaleejtimes.com/DisplayArticleNew.asp?xfile=data/business/20...
JK - a pretty good over view of the state of play.
Just to re-emphasise a point I make further up the thread. My favoured URR of 240Gbs is made up of three components. 1) produced to date = 120 Gbs, 2) the production model to 2028 = 75 Gbs and 3) HL is used to project then from 195 Gbs to the forecast URR of 240 Gbs.
If the production model is wrong - and all numbers are wrong - then the projected URR will need to be adjusted accordingly.
To sum up what you say - Saudi capacity to produce dry, light sweet crude is falling and this caught them unawares. I imagine that ramping to capacity left them producing more water than they could handle.
So they are now in a race to mitigate rising water cuts (new fields that will produce dry oil and expanding water handling facilities) and to expand their capacity to process sour crude. The future production profile will be determined by the balance between these mitigating actions and the decline in dry sweet crude production.
Forecasting exactly where we are in the time line of decline in N Ghawar is difficult. JoulesBurn has circulated via email excellent work he is doing on charting drilling actvity in N Ghawar based on Google images which shows an extensive infill drilling program of the dry areas in central Uthmaniyah (correct me if I'm wrong JB) which I imagine may be the final role of the dyce. I present an alternative scenario up the thread that brings Ghawar forward by 4 years. Its impossible to say with certainty - but if N Ghawar is on the slope now then they really have been caught with their pants down.
Do they want to - my feeling is that we will see one final show of strength as the global oil market slides and prices escalate. $100+ / bbl will provide some incentive. And do they not run the risk of being invaded if they do not?
Euan,
You have suggested what you call a "catastrophic collapse" of North Ghawar might be occuring. What specifically do you mean by that? If that part of Ghawar were depleting normally (even waterflood, vertical equilibrium, etc.), what would be taking SA by surprise? Or, if something is amiss, what do you think that is?
There has been considerable infield drilling in all of North Ghawar, with strategically placed MRC wells. SA's stated goals are to add dry production to feed into GOSPs and to leave no oil behind. The drilling seems consistent with that.
JB
I am once again reminded of Shell's actions regarding the Yibal Field, which they redeveloped with MRC wells, boosting the production. Shell was expanding their surface facilities to handle increased oil production--when they were hit with a flood of new water production, and rapidly declining oil production.
Once the water hits horizontal wells, even the most high tech horizontal wells, it's largely over in that region of a field.
These giant water drive reservoir fields are all on their way to where the East Texas Field is now--a skim of oil with a 99% water cut.
Resistance is futile, eh?
If the perforated segment of the horizontal well is truly horizontal, and the water level is horizontal, then yeah--if the water goes above the pipe, then that's it. But if an individual MRC arm is drilled so that is cuts across the formation over a km or so, it doesn't get flooded all at once but is rather more like multiple vertical wells drilled across the same formation. There are lots of variable which will determine success, such as avoiding fractures and water injection performance. A comparison with Yibal might mean something--or it might not.
I'm sure SA would be happy to get Ghawar where East Texas is now, because at that kind of recovery %, there is a lot of oil left. Not likely, though.
It's called depletion. Some Woodbine wells that I am aware of (same pay zone as East Texas) have gone from 100% oil on January 1st to virtually 100% water on December 31st of the same year, as the oil/water contact advanced across the lease.
Production can't happen without depletion. But a more thorough depletion means more production (at a decreasing rate, of course).
Those Woodbine fields had a much thinner producing zone. Here's an interesting comparison:
The point is that different fields have different challenges. The Yibal Shuaiba formation has limited lateral permeability which resulted in the need to employ a pattern water flood. It's probably more akin to Shaybah.
JB - in the production model I present for Ghawar, I decline each segment to zero reserves over a five year period based on the amount of dry oil remaining in each segement as computed in the field wide analysis performed earlier this year. Declining to zero over 5 years may be over aggresive - but it plays to the notion of a vanishing spot in the crest of a structure being produced via horizontal wells.
In the model, N Ain Dar is viewed as in the most advanced state of decline and goes firts. But then, based on historic production data, S Ain Dar, Shedgum and Uthmaniyah all decline together leading to field-wide decline rates in excess of 10% and the slide in production as shown in the production models above. Using the term "catastrophic collapse" is perhaps a bit strong - but the loss of all dry oil production from N Ghawar is a pretty major event. Slowing the production rates would prolong the process - and that I believe might be what we are seing now.
Have they been caught by surprise? I don't know. I imagine the call made on their capacity 2004 / 5 may have caught them by surprise and also brought home some hard truths about their limits. I also imagine some lenghthy internal debates about funding priorities - oil infrastructure versus F16s or hospitals.
There is no doubt that after claiming vast reserves they will piss off consumers if/when they fail to produce more as crude hits new highs.
But, invaded by who?
The US had a case post 9/11 - this was planned, financed, and executed virtually entirely by saudi citizens. Further, post 9/11 the saudis did nothing to stop the virulent anti western preaching by their mullahs, taking action only when the terrorism came home. But, post iraq the us is both over committed and, further, realizes that an invasion would shut off the oil flow. (Not to mention the cozy hand in hand relationship between their rulers and ours.)
An invasion by IRan? Iran would like to, but this would bring in the western powers in a flash. Iran will just do its best to bully the saudis.
An invasion by al queda? They are doing their best, so far without success.
Saudis are pissed with the US because of the rise of shias in south iraq. Meanwhile, they are pissed over the fall of the dollar. Saudi princes are slowly shifting their favor to China.
Saudi princes are a conservative lot, and anyway they prefer consensus and therefore a new direction takes time, but exporters everywhere are noting what happens to the financial health of former exporters. The declining number of exporters are finally beginning to reflect on the virtues of not exporting the lot quite so quickly. PO is not openly acknowledged by all, least of all saudi, but no doubt is on their mind. I see a growing list of reasons why they will never get to 9Mb/d again.
IMO the real question is no longer saudi but russia. WT may be too conservative in estimating their future production, but exports are in fact falling...
Wild speculation. The way I see things, KSAs best middle term interests are served by lowering production, raising prices and the longevity of their reserve base. But as the global oil supply begins to unravel - which I think we are seeing - if KSA has capacity to produce at 12 but is only doing 8 mmbpd a fair amount of ill feeling may build. I'd imagine KSA will be persuaded to pump at higher levels without the resort to invasion and I'd also hope that the USA has now learned that partial warfare is a futile exercise - especially where a resource grab is concerned.