Weather update
Posted by Euan Mearns on January 21, 2007 - 12:56pm in The Oil Drum: Europe
With oil approaching $50 / bbl and natural gas prices languishing in the doldrums I thought it was appropriate to look at one reason for supressed demand and prices. North America, Europe and Russia are all experiencing uncommonly mild winter weather.
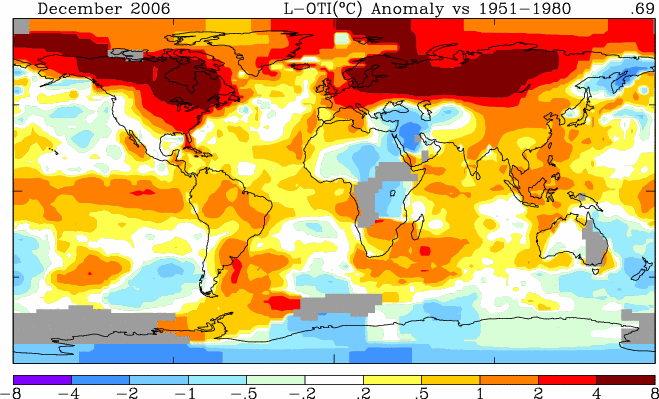
Figure 1. Surface temperature analysis map for December 2006 from the Goddard Institute for Space Studies. The datum period for comparison is 1951 to 1980. Note the large positive temperature anomalies over large tracts of North America, Europe and Russia which were 4 to 8 degrees C warmer this December compared with the datum period .
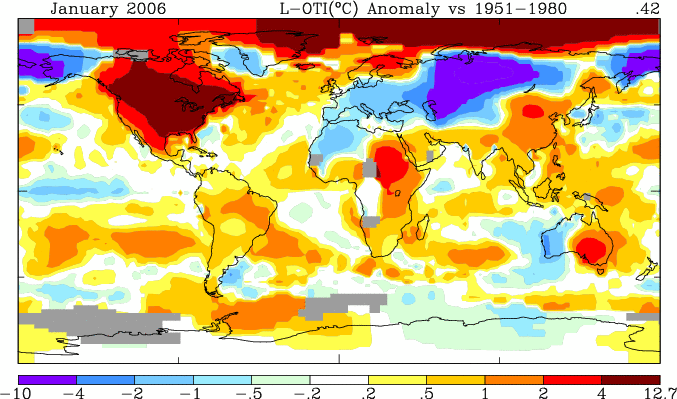
Figure 2. Surface temperature analysis map for January 2006 from the Goddard Institute for Space Studies.
Figure 2 shows the situation in January 2006, where, after the potent 2005 hurricane season, the whole of North America experienced uncommonly mild weather during the 2005 / 06 winter. This essentialy rescued the situation with gas supplies depeleted / disrupted following all those hurricanes. In January 2006, the situation in Europe was very different, with extreme cold weather in Russia and Eastern Europe leading to heavy demand for gas and disruption to gas supplies.
The situation now is one where North America, Europe and Russia are all experiencing milder winter conditions that will soften demand for natural gas and for heating oil. It looks like the self-regulating Earth is rescuing the energy crisis for the time being with the prospect that warmer temperatures are compensating for depleting fuel supplies.
From Figure 1, it is also interesting to note the anomalous cold weather over the Middle East and Turkey during December. This led Iran to suspend gas exports to Turkey as the cold weather boosted Iran's domestic demand. Turkey's main source of gas is Russia supplimented by LNG imports from Algeria.
The other feature to note in Figure 1 is the El Nino event building in the East Pacific Ocean off the west coast of Peru represented by the elongate tongue of dark orange colours. As a general rule, El Nino events correlate with reduced hurricane activity in the N Atlantic but increased storm activity in the eastern Pacific.
Personnel
Editors
Contributors
Peak Oil Primers
Archives
- November 2010 (3)
- October 2010 (6)
- September 2010 (4)
- August 2010 (7)
- July 2010 (6)
- June 2010 (7)
- May 2010 (2)
- April 2010 (8)
- March 2010 (4)
- February 2010 (6)
- January 2010 (3)
- December 2009 (5)
- November 2009 (8)
- October 2009 (12)
- September 2009 (6)
- August 2009 (5)
- July 2009 (11)
- June 2009 (8)
- May 2009 (16)
- April 2009 (10)
- March 2009 (7)
- February 2009 (10)
- January 2009 (15)
- December 2008 (9)
- November 2008 (9)
- October 2008 (9)
- September 2008 (13)
- August 2008 (10)
- July 2008 (14)
- June 2008 (23)
- May 2008 (16)
- April 2008 (12)
- March 2008 (16)
- February 2008 (9)
- January 2008 (13)
- December 2007 (13)
- November 2007 (16)
- October 2007 (22)
- September 2007 (8)
- August 2007 (9)
- July 2007 (16)
- June 2007 (8)
- May 2007 (7)
- April 2007 (7)
- March 2007 (10)
- February 2007 (10)
- January 2007 (12)
- December 2006 (9)
- November 2006 (15)
- October 2006 (4)
- September 2006 (5)
- August 2006 (5)
- July 2006 (9)
- June 2006 (5)
- May 2006 (10)
- April 2006 (9)
- March 2006 (13)
Vital Trivia
License

This work is licensed under a Creative Commons Attribution-Share Alike 3.0 United States License.
According to the forecasts available here: http://expert.weatheronline.co.uk/
...it would appear that from Monday next week (22nd Jan) winter will finally arrive in the UK at least. Nationally temperatures will struggle to rise above freezing. Very little wind or precipitation though. Seeing as Europe is now "awash with gas" I can’t see there being any real difficulties but we'll have to keep an eye on the daily flow rates. It’ll be nice to walk to work through frost rather than the rain for a change!
I wonder how the flora and fauna will take it, having been lulled into a false scene of security by the unseasonably warm weather.
I live in Edinbrugh and was given a weather station for my Christmas. Since then the lowest recorded temperature on my unit from Dec 25th to date is 0.6C - this includes night,day etc.
And the unit is well away from the house (in the open) or any concrete that could artificially raise the temperature
Usually there would been frosts 2/3 nights by now - say 15-18 frost. We have had none so far.
About to change today I think!
Marco.
Also interesting to note is the high negative anomaly in Antarctica. Although with a positive anomaly, the Artic isn’t as hot as last, which might indicate a turbulent winter end. Looking at it globally, it looks like the Northern Hemisphere is hotter and the Southern cooler.
I’d also like to emphasize that plotting global data on a cylindrical projection (giving a rectangle world) is a real bad option, Greenland has the size of South America and Antarctica is the larger continent. It’s about time for the Climatologists to start using other cartographic projections.
That is a very good point and not one I'd thought about before. On a map like that where we naturally draw conclusions from area it would be nice if the areas were correct - the absolute shapes aren't so important. Is there a Photoshop transform or similar that would let of adjust these maps?
I doubt there is one in Photoshop, but anyway I don’t use it that much. The better thing to do is to re-project the data using some GIS software.
But the worst of all is if this kind of charts is produced with interpolations already in the Cartographic plane. If so, one should expect important distortions on the frigid zones.
Orthographic Projections
Western Hemisphere
Eastern Hemisphere
It is clearly visible, the highest temperature increase is again around the arctic regions. In winter, temperatures in this region are anyway below the freezing point, so there is no expected ice melt.
However this temperature pattern - as far as I can tell - is the same in summer time. And this is really important for the climate change dynamic, which is going on there.
Two days agao, there was a comment about the cubic mile oil. Putting this picture into perspective, Greenland obviuosly looses 52 cbm of ice each year. Which is quite a lot....
.
Thanks Alan. Where did you got those? Do you know if the interpolations made to obtain these charts where originally made on an equal-area cartographic plane?
I used Titan24 to generate the orthographic projections from the images you posted after cropping the labels. If you are interested in creating other views Titan24 is available here:
http://www.giss.nasa.gov/tools/titan24/
To use it to view something other than Titan you only need to add a cylindrical projection to the sourcemaps folder.
Hello Luis de Sousa,
Good point on the hemispheric temp disparity. Makes one wonder how that will affect weather, climate, and ocean currents going forward as physical law will try to equalize this differential over time. I sure hope the climate scientists can develop equations for this to include in their computer models.
The South Atlantic normally has no hurricanes, but if memory serves, I recall one forming off Brazil two years ago. Perhaps, South Atlantic hurricanes will become a normal event to extract excess heat from the north hemisphere and send it south. Possibly, more hurricanes or typhoons for the South Pacific and Southern Indian Oceans too--watch out Africa and Australia! Time will tell.
Bob Shaw in Phx,Az Are Humans Smarter than Yeast?
Higher latitudes tend to warm more than lower latitudes in comparisons like these because of a positive feedback called the albedo effect. Albedo is a measure of a surface's reflective ability. Snow has a very high ability to reflect sunlight. If areas marginally covered with snow melt, or have no snow, the reflectivity of the ground decreases. The decrease is accompanied by (more) warming as the ground absorbs more solar radiation, and we have a positive feedback.
There is far more land in the northern hemisphere than the southern hemisphere and land warms more rapidly than the ocean. This does, as you point out, have implications for winds and atmospheric circulation. Although parts of the Antarctic ice sheet’s margins have been melting, the interior of the Antarctic ice sheet, like Greenland, is at high elevation and the air is really cold. Observations suggest that the air temperature over much of Antarctica has been getting colder in recent decades.
Nice posts :-)
Can anybody make an estimate of "Heating Demand Destruction" caused by the mild winter? It would be interesting to see, how much of the presently discussed "Demand destruction" that is caused by the mild weather. After record high winter temperatures, we will get the first real frost this week in Denmark.
Now how much energy is saved by 1 degree C hotter climate?
At Scandinavian climate a 1 oC( 1.8 oF) higher or lower indoor temperature correspond to some 6-7% extra/less heating energy use. So 1 oC higher outdoor temperature should result in 6-7% savings in heating energy use. In Denmark heating energy use is approx 30% of total energy use (all sources)so one degree hotter all winter should result in 2% lower total energy use.
Later in 2007 it should be possible to estimate the actual savings, nation for nation from the recorded heating degree days during the 2006/7 winter, and the savings could be (roughly) distributed into gas, oil, coal, nuclear etc. I am sure that TODDERS in the power sector have actual estimates of this.
Kind regards/And1
But in the northern hemisphere, the arctic ice melts.
Ocean, not covered in ice has a lower albedo.
As ice melts, the low albedo ocean absorbs more energy warming the ocean up, melting more ice, creating a lessening of albedo, absorbing more energy, melting more ice
etc.
Well really. The Northern Hemisphere is warmer because the sun is up in the sky, not down by your feet! The top of the world warms faster than the bottom of the world.
Aha! That would explain why I get cold feet.
For those who wonder how to reconcile this with a round earth, it is the tilt in the earth's axis that does the trick.
New Zealand had the coldest December in 60 years. Miserable start for a supposed summer.
Last winter in the Southern Hemisphere also set records. People dying frozen in South Africa, unseen snowfall in South America. It seems that the cooling trend in Antarctica is spreading north.
It's interesting that the region of greatest cooling seems to be the Sahara desert region of Africa. Of course, that area was not always a desert, it used to be an inland sea followed by a fertile area until the climate shift now in place caused desertification. It looks like this area is going to go back to being arable. That would be a great boon to Africa and possible help political stability as well.
Becoming cool & getting more rainafall is only the first step in creating arability. Biological succession, necessary to develop soil, over many cycles will take centuries. The Sahara is only going to be cooler, wetter sand with a few more scrub plants as the die-off commences I'm afraid.
Wishful thinking. The Sahara is expanding, and even crossing the mediterranean. In Spain, there has been talk of desertification way before I was aware of global warming: droughts are becoming harder and longer, the Environment minister has said that we are in a deep one right now. The southeastern of Spain is basically a desert: Lawrence of Arabia and many Clint Eastwood spaghetti westerns were filmed there.
I have seen more documentaries on the dunes attacking the border cities of the Sahara that I can shake a water stick at. Check any maps of global warming effects.
For anyone interested in sea level change and sea water temperatures in the South Pacific check out the 2 websites. Also El-Nino status. The first site gives data reports for each month of 05 and 06, Dec 06 data is PDF 2.3 megs. IMO very interesting.
http://www.bom.gov.au/oceanography/projects/spslcmp/reports.shtml
http://www.sopac.org/tiki/tiki-index.php?page=Pacific+Country+Reports
I'm not sure one month, in and of itself, means anything. Please be sure to post a map for January 2007 when it is available.
We may reach a point where oil producers can produce more than we consume in the winter, but are unable to keep up in the summer. This leads me to suspect that in the future we will have wild seasonal fluctuations in oil prices.
We already do. Mixed with holiday travel & election cycles as well.
No swing producer = price volatility
The temperatures may be below freezing, but the growth of ice really requires temperatures far below freezing. Without knowing actual temperatures and not the devation from the norm, it is hard to tell how significant this actually is.
i would be interested in knowing what colour that area of grey over at Australia would be - we actually had a white Christmas (yes, snow in the middle of summer) and the week before that that area was having problems with a heatwave and brushfires.
I had to laugh at Australia getting snow for Christmas when England didn't.
edit: don't read anything into me linking that particular site, it was just the first good report that showed up on google.