IHS Data Suggest Kuwaiti and Global Proved Oil Reserves Significantly Lower Than BP Estimates
Posted by Euan Mearns on November 17, 2006 - 10:59am in The Oil Drum: Europe
At the Oil Depletion conference (hosted by the Energy Institute) held in London on 7th November, Dr Kenneth Chew, a Vice President of IHS Energy reported proved and probable reserves (2P) for Kuwait of around 52 billion barrels (read from chart). This is approximately 51% of the proved reserves reported in the BP statistical review that stand at 101.5 billion barrels. This tends to support recent reports of Kuwaiti reserves being substantially overstated.
Ken Chew also presented data indicating global remaining discovered proved plus probable (2P) liquid resources of some 1,250 billion barrels. This implies global proved liquid reserves (1P) of around 950 billion barrels (based on an assumption that 1P is approximately 75% of 2P). This is substantially lower than estimates provided by BP, Oil & Gas Journal and World Oil.
This report is built around a presentation (link live until 28th Nov. 2006) made by Ken Chew, at the Oil Depletion conference held in London on 7th November and subsequent correspondence I have had with him. I would like to acknowledge that Ken has been very helpful in clarifying background information to his talk. IHS Energy own Cambridge Energy Research Associates (CERA) who are also leading commentators on global energy issues.
Why are Kuwaiti and Middle East (ME) oil reserve estimates important? The simple answer is that one point of view is that all ME OPEC reserves are incorrectly booked and are in fact grossly "inflated". The IHS energy data presented by Ken Chew suggests Kuwaiti and world oil reserves are significantly lower than otherwise reported in the public domain. The IHS database is one of the more widely used sources of world oil information therefore the whole world should take note. Let's start with a look at how reserves are booked and evidence for anomalous reserves booking by ME OPEC countries.
Reserves - definitions and determination
Oil reserves (pdf) are booked according to the confidence level in their existence. In very general terms:
Proved / proven (1P) need to be proven by drilling wells, with a limited amount of extrapolation allowed away from the well bore.
Probable reserves (2P) include 1P plus additional reserves that can be estimated on the basis of reasonable extrapolation further away from the well bore based on, for example, seismic, well test, pressure and a range of geological and engineering inputs.
Possible reserves (3P) include 1P plus 2P but may also include speculative additions that may be added by future drilling.
In order to prove oil reserves it is necessary to drill wells. Finding oil is not enough to prove reserves and a wide variety of geological and engineering data is normally collected before, during and after a well is drilled in order to estimate the amount of oil that may eventually be produced. This data may include:
Seismic - used to determine the oil trap / structure volume
Wire line well logs - used to determine the proportion of reservoir to non-reservoir in the trap, the porosity of the rocks, water/oil/gas saturation levels etc.
Core analysis - used to further assess the porosity and permeability of the reservoir
Special core analysis - used to determine the wetability of the reservoir and further evaluate the water/oil/gas saturation levels.
PVT data - (pressure-volume-temperature). This is vital to determine phase relationships of the hydrocarbons in relation to depressurisation during production.
Geochemistry and physical properties of oil gas and water - gravity, viscosity, composition. Required for designing production facilities and refining.
Well test data - further test of porosity, permeability, connectivity and volume of the reservoir.
This list is not exhaustive, but serves to illustrate the type of reservoir engineering, petrophysical and geological input that is required to prove oil reserves. Proved oil reserves may be used to present an investment case to a bank, may greatly add to the market capitalisation of any company and they may underpin national economies.
A general feature of reserves estimates is that they are revised as more information about individual fields or a country's resources become available. Furthermore, once production begins, produced oil has to be deducted from reserves and any new discoveries may be added. So on a corporate or national level reserves should be adjusted annually as follows:
Proved reserves at start of year
- Less annual production
- Plus or minus revisions
- Plus new discoveries
Gives proved reserves at end of year
Finally oil price may impact reserves estimates as this may affect whether or not discovered oil and gas resources may be commercially exploited.
The ebb and flow of how all these factors have influenced the booked 1P reserves for the UK are illustrated below.
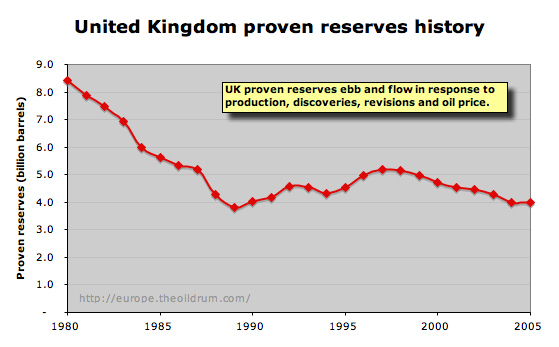
Figure 1. The history of UK proven reserves 1980 to 2005. Source BP statistical review.
The ME OPEC Reserves Anomalies
Based on published data, the ME OPEC countries contain more than 50% of the World's remaining producible oil reserves. Understanding the reliability of these reserves estimates is therefore vital to the future of the oil driven growth in the World Economy.
It is then amazing to consider that the reliability of estimates for the size of this vital resource is the subject of considerable controversy and debate covered by amongst others Stuart Staniford in earlier TOD articles.
The anomalous nature of ME OPEC reserves, illustrated below for Kuwait (Figure 2), can be summarised as follows:
1. Reserves were uplifted by 38% in 1984. This does not relate to any verifiable new field discoveries. If Kuwait was the only country to have done this it might be excused as rectifying a past mistake. But in the period 1984 to 1987 all of the ME OPEC countries uplifted reserves by large amounts in this period (Figure 3). For example, the UAE increased their oil reserves by 295% in 1986. One view of these anomalous revisions is that they are related to OPEC quota negotiations and are not founded on geological or engineering data.
2. Following this arbitrary uplift, reserves have more or less remained unchanged. Most significantly, no deductions have been made for production for around 20 years.
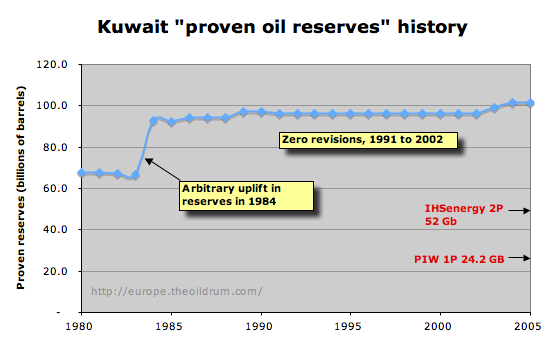
Figure 2 "Proven reserves" history for Kuwait. Source BP statistical review. The Petroleum Intelligence Weekly (PIW) estimate is reported here and the IHS Energy data are discussed below.
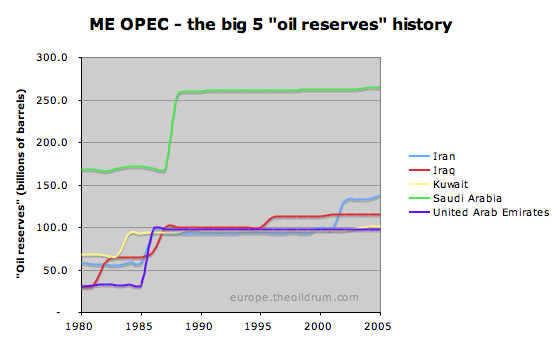
Figure 3. The Big 5 ME OPEC producers all show a similar history to Kuwait, with large arbitrary uplift in reserves during the 1980s, followed by "flat line" reserves histories lacking evidence for depletion, though additions are evident in Iran and Iraq.
It is my opinion that these two anomalous features wholly invalidate the reserves booking process. That is not to say the booked reserves are wrong - there is always the remote possibility that they are correct by chance. But this is not science and does not comply with any notion of reliable accounting that would normally be accepted within the OECD.
The fact that reputable organisations like BP report these spurious reserves figures as "Proved Reserves" in their annual statistical review has tended to lend respectability to the data that are accepted as fact by many observers. In particular, national governments that may want to deny that world oil reserves are depleting can point at BP as a reputable source. The reliability of ME OPEC reserves, however, is now in the public eye, and national governments are at least pressing for more transparency in resource reporting.
A View of Kuwait and ME OPEC reserves based on the IHS data
Ken Chew's presntation at the Oil Depletion conference had 37 slides crammed full of data in 30 minutes, making it difficult to absorb all that was said although all the slides were made available in a handout and a few examples are reproduced below, and these are now available on line for a limited period (link live until 28th Nov. 2006).
Ken Chew, email correspondence 10 Nov. 2006:
The whole point of my talk is that we (IHS) report 2P versus 1P (and also liquids versus oil). I don't need to mention 2P on every slide.
At the outset it is important to make clear that IHS data provide for a Low-end Estimate and a High-end estimate for global reserves as detailed below:
World liquids resources - the low-end estimate (2P)
Worldwide liquids discovered 2,328 billion barrels
Worldwide cumulative production 1,077 billion barrels
Worldwide remaining liquids 1,251 billion barrels
Worldwide liquids depletion 46.3%
World liquids resources - the high-end estimate (excluding tar sands and extra heavy oil)
Worldwide liquids discovered 3,390 billion barrels
Worldwide cumulative production 1,077 billion barrels
Worldwide remaining liquids 2,315 billion barrels
Worldwide liquids depletion 31.8%
My own opinion on the high-end estimates is that it is a gross exaggeration of what is likely to ever be recovered. One reason for stating this view is that to reach such high volumes would require development of a myriad of small accumulations in hostile environments (unless some major oil provinces have been overlooked thus far) and net energy arguments combined with lower cost alternatives that will likely become available in the medium term will mean that such a huge resource will never be extracted.
Email correspondence (dated 10 November 2006) asked specifically that the following data be posted on The Oil Drum (the data refer to ME reserves):
Here are the numbers used in the graph that compares BP Stats Review and others with IHS (billions of barrels).
IHS Energy Proved plus Probable All Liquids 678.5
BP Statistical Review Proved Oil 742.7
Oil and Gas Journal Proved Oil 743.7
World Oil Proved Oil 711.9The IHS proved plus probable all liquids number, which includes things like the condensate reserves of the North Field and South Pars, is 64 billion barrels less than the BP Stats Review proved oil-only number. For companies that report both 1P and 2P we find that 2P is generally one-third more again than 1P. Applied to the ME that would bring the IHS all liquids number down to about 510 billion barrels proved.
The following slide for Kuwaiti oil reserves was presented:

Figure 4. IHS Energy estmate for 2P Kuwaiti reserves.
And speaking to this slide, Ken Chew said:
So this is one of the reasons why it is important to do a field-by-field analysis because it does highlight the politicisation if you like of resource or reserve reporting. A second example shows to me the benefit of back dating in fact because this is what we have for Kuwait. This is the OPEC Kuwait crude reserve estimate, this is the IHS energy remaining resource estimate based on the fields with all the resource back dated to fields date of discovery and then the cumulative production subtracted and you'll see actually that there are periods where the ?? are almost parallel and if we separate the divided zone from Kuwait it would just push to about here. There would be a complete coincidence between what we think is the situation in Kuwait and what Kuwait would support up until this point in time, from which point onwards we have a huge divergence and this again follows the point at which more or less all of the major OPEC producers suddenly boosted their alleged reserves. So that's the second benefit of using backdating.
The official Kuwaiti data are only proven reserves (1P) and Ken Chew made clear that his estimate was for 2P reserves. The rule of thumb for converting 1P = 2P*0.75, however, this was added in a later email (10 November 2006):
That one-third on top for "probable" is a ball park figure that I find to be a useful rule of thumb for western companies in their reserves reporting. I have no idea if it will apply in the specific case of Kuwait or Saudi Arabia but I believe that it could be a useful guide for the Middle East as a whole.
On this basis, Ken Chew was reluctant to concede that Kuwaiti 1P reserves would be around 75% of the 2P reserves indicated on the chart.
Looking at the chart for Kuwaiti reserves and considering what was said, one might expect to see a dramatic difference between the IHS data ME OPEC / global reserves figures, and the likes of the bp statistical review, who still accept "inflated' ME OPEC reserves figures without question.
In fact, Ken Chew went to some length to illustrate the weaknesses of The Oil and Gas Journal data. It was alleged this data was not up-dated every year. For example, he claimed that 39 estimates (40%) in the Oil and Gas Journal had not changed for the last five years.
And so given the fact that inflation of Kuwaiti reserves ("political") has been recognised and weaknesses in the Oil and Gas Journal data have been highlighted you might expect to see a dramatic difference between the IHS data estimates and the rest of the pack. Unfortunately the picture is not that simple. The comparison between IHS data, BP, O&G Journal and World Oil is shown below.
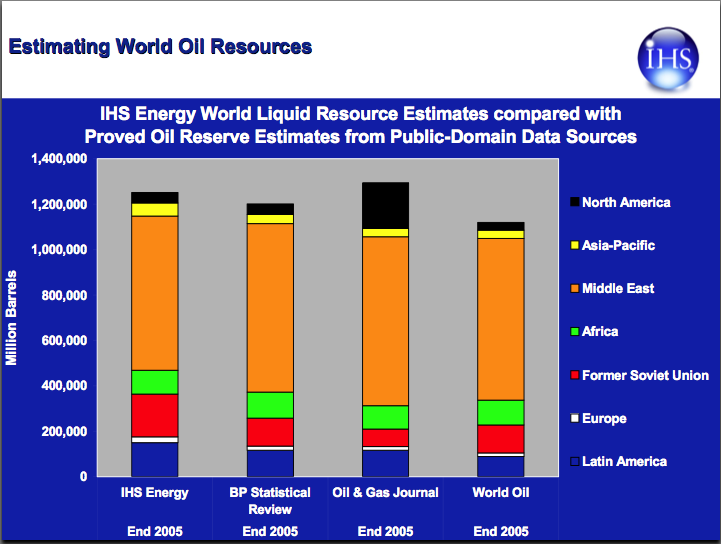
Figure 5. Comparison of IHS Energy data with other sources, and this is where care is required. The BP, Oil and Gas Journal and World OIL estimates are all proved reserves (1P). IHS Energy data is proved + probable (2P) except for North America which is 1P
At first glance it seems that nothing much has changed. But then you have to realise that IHS are quoting proved and probable (2P), except for N America where they show 1P, whilst the other sources are proved only (1P). Personally I find this presentation a bit confusing and I have therefore reproduced the gross figures shown in Figure 5, rebased as 1P in Figure 6.
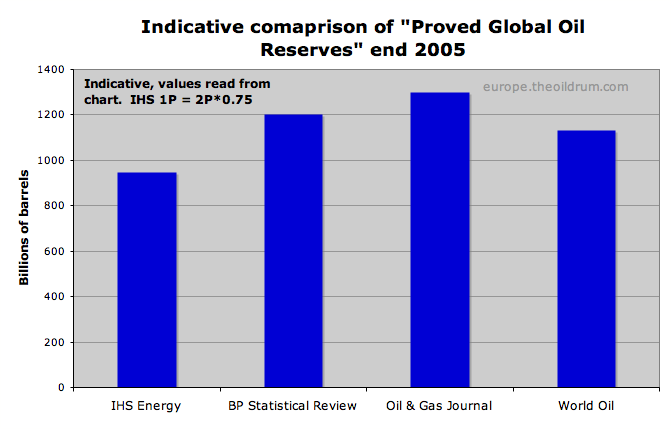
Figure 6. The data shown in Figure 5 rebased as proved reserves using 1P = 2P *0.75
Clarification of IHS 1P and 2P
ME OPEC countries are reported to view their oil and gas reserves figures as State secrets and so I was wondering how IHS Energy manage to acquire the geological and engineering data to distinguish between 1P from 2P and this was Ken Chew's response (dated 10 th November 2006):
I indicated in the presentation, we construct our estimates by summing individual fields. So our Middle East number is the composite of 1,156 different fields that contain a liquids estimate of some sort and for each of which we report the best available information. Sometimes that means reporting Ministry or NOC data if nothing more authoritative is available.
In subsequent correspondence it was also indicated that the IHS data base is used widely on a commercial basis by companies, who in the absence of any other data, appreciate getting ball park numbers that are fit for purpose in their decision making process. It is therefore important to recognise that the exercise of using this data to construct a view of Global oil resources is somewhat an academic exercise. Data that is fit for one purpose may not necessarily be fit for another - but it is an interesting academic exercise none the less.
The 1P versus 2P definition applied to IHS data in the case of ME OPEC reserves is not comparable to the 1P versus 2P definitions as it may be applied or understood in the OECD.
A cautionary note comparing 1P reserves with URR
Many readers of The Oil Drum are familiar with the Hubbert Linearisation (HL) technique which, based on historic production figures, provides a "top down" estimate of ultimate recoverable reserves (URR). Proven oil reserves (1P) are a much more conservative estimate and should be significantly lower than URR.
This recent HL for World all liquids from Jean Laherrere shows that recent production increases have led to a possible extension of URR. My own view here, this in part reflects un-used capacity in the ME getting switched on in 2002. These were existing reserves "not seen" by production to that date. My guess is reality will likely lie somewhere between the 2250 and 3000 billion barrel intercepts.
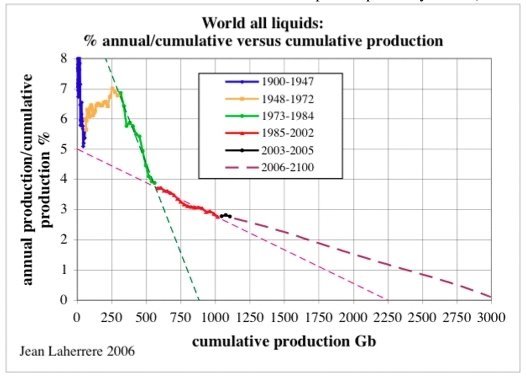
Figure 7. A recent Hubbert Linearisation for World all Liquids from John Laherrere.
The IHS data 1P + production to date gives 2062 billion barrels
The IHS data 2P + production to date gives 2328 billion barrels
The IHS data high end is 3,390 billion barrels
I find it interesting to note that Ken Chew's estimates of 1P and 2P made from the IHS data fall right in the range of the HL - accepting that 1P is over conservative.
Summary
IHS Energy data indicate proved plus probable Kuwaiti reserves to be around 52 billion barrels (read from chart). The proved only reserves figure will be significantly lower.
IHS Energy data suggest proved global oil reserves of the order 950 billion barrels and this is significantly lower than estimates quoted by BP, The Oil & Gas Journal and World Oil.
Euan Mearns BSc PhD
TOD Contributor
fka Cry Wolf
Contributors note: Ken Chew has gone out of his way to be helpful in the compilation of this report. He has also indicated that he finds some comments published on the Internet to be somewhat defamatory. So I would respectfully ask all posters to try and stick to objective facts, observations and argument and to refrain altogether from expressing personalised points of view.
One final comment, Ken Chew has asked me to point out that the opinions presented in his talk and in email correspondence are his own interpretations of IHS Energy data and do not necesarrily reflect the views of IHS Energy.
IHS Data Suggest Kuwaiti and Global Proved Oil Reserves Significantly Lower Than BP Estimates
PDF version
92 comments
IHS Data Suggest Kuwaiti and Global Proved Oil Reserves Significantly Lower Than BP Estimates
PDF version
92 comments
Personnel
Editors
Contributors
Peak Oil Primers
Archives
- November 2010 (3)
- October 2010 (6)
- September 2010 (4)
- August 2010 (7)
- July 2010 (6)
- June 2010 (7)
- May 2010 (2)
- April 2010 (8)
- March 2010 (4)
- February 2010 (6)
- January 2010 (3)
- December 2009 (5)
- November 2009 (8)
- October 2009 (12)
- September 2009 (6)
- August 2009 (5)
- July 2009 (11)
- June 2009 (8)
- May 2009 (16)
- April 2009 (10)
- March 2009 (7)
- February 2009 (10)
- January 2009 (15)
- December 2008 (9)
- November 2008 (9)
- October 2008 (9)
- September 2008 (13)
- August 2008 (10)
- July 2008 (14)
- June 2008 (23)
- May 2008 (16)
- April 2008 (12)
- March 2008 (16)
- February 2008 (9)
- January 2008 (13)
- December 2007 (13)
- November 2007 (16)
- October 2007 (22)
- September 2007 (8)
- August 2007 (9)
- July 2007 (16)
- June 2007 (8)
- May 2007 (7)
- April 2007 (7)
- March 2007 (10)
- February 2007 (10)
- January 2007 (12)
- December 2006 (9)
- November 2006 (15)
- October 2006 (4)
- September 2006 (5)
- August 2006 (5)
- July 2006 (9)
- June 2006 (5)
- May 2006 (10)
- April 2006 (9)
- March 2006 (13)
Vital Trivia
License

This work is licensed under a Creative Commons Attribution-Share Alike 3.0 United States License.
Also thank you to Euan Mearns in trying to give an unbiased report as much as possible.
Intellectual honesty is the most important quality to bring to the Peak Oil debate. Too many people have their own rice bowl to defend and ignore any facts that challenge their livelihood.
I appreciate that the size of the Bergan field relative to Kuwaiti total reserves makes the job easier as regards Kuwait, but can a similar downsizing of P2 reserves be assumed for other ME OPEC members?
Perhaps IHS intends us to extrapolate such a deduction, but would not feel comfortable making such an outright asssertion? Needless to say I would not expect Mr Chew to answer this question, but second ELRM's thanks to him and Euan Mearns for access to a very enlightening presentation.
They have to push Kuwaiti reserves back because it already hit the media that proved reserves are below 30 Gb. The government is aware and taking measures to restrain production - Kuwait can be one of the first countries to "sign" the Oil Depletion Protocol.
Total phantom 2P reserves in the ME stand at 300Gb. Take that from the 2P reserves given by IHS and you get Laherrère's 800 Gb plus Tar Sands.
Euan, is there any possibility that IHS would make available Remaining Liquid Resource Estimate charts for the other ME countries as they have done for Kuwait?
They are (rightfully) proud that their plotted reserves tallied pretty well with Kuwait until 1984 when Kuwait arbitrarily increased reserves for OPEC quota purposes, and that subsequent announcements have proved them right.
They are also very scathing about the Oil & Gas Journal's estimates remianing largely unchanged for many years in certain cases, which criticism also seems justified
Do their curves look similar for other ME OPEC producers as they do for Kuwait? If not, would that not show some inconsistency in their methodology? How do they rationalise such inconsistency (it is exists) in the light of their criticism of O&GJ?
I'm a great fan of history matching forecasts - see how forecasts match reality after a couple of years.
I could ask Ken Chew if he could make these available.
Thank you for posting. I'm a bit confused with IHS owning CERA and CERA having there latest report that seems to have reserves 'inflated'.
The picture I'm starting to get is that there are a few people such as Mr Chew that are in the know and are getting worried. Worried to the point that they are starting to break from the pack and try to get the word out.
Honestly, your post is less than comforting. I feel I must have that 'Bambi in the headlights' look on my face while I read this stuff.
I'm convinved that people at least in America will not "power down" of thier own free will. "crywolf"- the humor is obvious. :( OMG what a mess.
So am I.
CERA are bearers of good news, and they get paid handsomly by those who wish to buy good news.
Objectivity and credibility are TOD objectives - objectivity is of course in the eye of the beholder. One thing I learned is that IHS maintain a huge data base about which they are very proud.
To understand how that data base can be used to estimate global "reserves" and future production is another matter - open to debate.
First of all I must note that this information points towards the same conclusions taken by Laherrère (who uses HIS as one of his data sources). If take out all the political additions to ME reserves you get the same technical numbers.
Some comments:
Are we talking of Resources or of Reserves? Because resources are the fraction of reserves than can be ultimately recovered (me thinks).
I always have a hard time with this kind of stuff. How can the price determine if a resource is recoverable or not? It is the net energy of the yielded oil that determines that, not the price; the price just gives you an idea of the balance between supply and demand.
Take the good old US data set. Production started to align with the logistic curve in 1958 pointing towards an URR 200 Gb (Lower-48). Now in 1979 with WTI at 80$/b the data still pointed towards 200 Gb. Today with oil at 60$/b it still points towards 200 Gb. To me it makes no sense to say that prices grow or shrink reserves. What do you make of it Euan?
As a side note, looking at this data from IHS it really makes CERA's report look silly.
In the real world price is everything, if a company can earn money for doing something the EROI is irrelevant, to that company. What's the EROI of manufacturing Duracell batteries, or even corn ethanol? Whilst we can say extracting oil from the ground when the EROI is below 1 with the express intent of burning it in the pursuit of energy is a futile exercise from a global net energy supply point of view, it doesn't necessarily prevent it being done.Oil could be extracted with EROI < 1 if it's application will be as a chemical feedstock rather than energy source or if the input energy isn't in as usable form as the resultant oil. For example if it takes 1.5 units of nuclear fission generated heat energy to extract 1 unit of liquid hydrocarbon energy it still might be worth doing if your objective is to fly a 747 from London to New York. And if the 1.5 units of nuclear energy only cost $10 and the 1 unit of liquid hydrogen energy cost $20 you're making a profit!
Currently, quality is usually measured by market forces. But liquid fuels IN REALITY are much higher quality than the market realizes, implying that the EROI that society collectively chooses to pursue does matter.
Re Resources versus Reserves I'm using the IHS terminology. I said this:
Money and energy have not yet become equivalents. High oil price in the North Sea has meant a larger number of field decomissionings being postponed, old fields geting refurbished (Forties), and keeping the infrastructure out there means satelite fields can get developed. All that means more oil produced owing to higher price. The higher the price goes, more and more marginal projects will get developed world wide - until that is as you correctly point out that you use more energy to develop than you recover. I think there's a ways to go yet before we reach that point - but that will be the ultimate ceiling.
My feeling is that we go over peak in 2012±3 before net energy constraints kick in. I think eventually electric cars will be cheaper to run than ICE cars with gasoline at $200.
I don't think the equation is quite that simple. The problem is that costs also rise with rising oil price, and perhaps surprisingly, oil companies don't factor that in. I'm not even sure how you could predict how much costs would rise, it depends so much on external economic factors.
So when they say "economic recovery at $60/bbl", they mean if underlying costs don't change. As Luis points out, poor EROEI tends to mean poor $ROI, but the link is not 1:1 for the reasons Chris outlines. Marginal projects will stay marginal, and if the price of oil has been undervalued, in fact become more marginal. It's a classic case of diminishing returns, which IMO is the underlying reason for the shape of the Hubbert curve.
While projects with paid infrastructure can be squeezed to produce more, new projects are facing escalating costs and I have read several reports saying certain planned projects are "under review" due to costs.
Incidentally this appears to be a major Achilles heel in CERA's assumptions, which I haven't seen mentioned much. They don't seem to take account that the rate of exploitation of marginal sources will be much lower than conventional sources, which is why they can't make up for decline, and why their predicted plateau is highly unlikely.
However, with respect to my comments in post above, we are probably talking detail here. Prolonged life of off shore platforms must lead to higher recovery - but late on in field life we are talking about extending dribbles of oil. The bulk of field production is already in the bag - we are just talking about a few more percent - but it all counts.
You have two distinct discovery cycles. If you model production with two logistic curves you get the double peak perfectly.
On the €: no matter what the price is, a resource recoverable with positive energy yield will eventually be extracted, if not sooner, later. That's why the Hubbert curve is successful.
I would argue the twin UK peaks are a function of oil price - impacting both new field development and exploration in the mid 1980s. Resulting in production falling and a bi-modal discovery pattern.
I think a second cycle of discovery was already clear in 1986.
IMO, the key problem with the UK data set is the earlier data were just too immature. As I have pointed out many times, the overall North Sea crude + condensate production peaked right in the 50% of Qt range (EIA data).
BTW, note that Stuart's HL estimate is quite close to lower Kuwait estimates that are being used.
Luis,
You did very good work on the oil export article.
Note that Texas, the Lower 48 and Saudi Arabia showed the same type of inflection right before they started showing lower production.
The production didn't follow a Hubbert curve because the field was immature.
We judge the field to be immature because it failed to follow the Hubbert curve.
In June 1989 1t looked like UK Qt would be 12.5Gb and cumulative production was 8.7Gb, 70% of Qt as judged then. If Qt and hence maturity can only be judged in retrospect the Hubbert technique loses all its predictive power.
If there is clear prior reason to fit a double Hubbert curve from examination of existing discovery data then this is possibly very valid and useful, but there is a great danger of just trying to fit the historical data with multiple curves. With sufficient free parameters it is possible to get a magnificent fit to any data but as Stuart Staniford pointed out historical fit does not prove predictive ability. He described over fitting as 'pure epicycles' in reference to medieval attempts to force apparent planetary movements to fit a geocentric cosmos.
IMO, extrapolating from a P/Q intercept of 30%, is, in a word, ridiculous. Again, we have people obsessing over a small sub-basin,the UK, with a complex producing history becauase of the Piper Alpha accident, when the overall basin, the North Sea is showing a perfectly predictable linear HL pattern.
I personally see no reason to use the UK as a model for anything.
" Again, we have people obsessing over a small sub-basin,the UK, with a complex producing history becauase of the Piper Alpha accident, when the overall basin, the North Sea is showing a perfectly predictable linear HL pattern."
I have often wondered if a similiar argument should not be made about Saudi Arabia, the "Neutral Zone", Qatar, U.A.E., Kuwait and Iraq. It can be argued that there are at least. All the above are political partitions placed over a much more interconnected geological area. The reports (repeated even by Simmons) that when the Kuwait oil fires were ignited there were pressure drops in fields in Saudi Arabia indicated that the Western Persian Gulf area may be much more interconnected that once believed.
Is it possible that we are letting the Persian Gulf countries get by with a "shell game" (whose country has the oil under it, watch 'um close and step right there and put your money down....") when what we are talking about is a small number of big pools with a lot of extensions....any geologists want to take a shot at it...., remember, the oil and gas don't care whose country it is under, it still does what it does....
Roger Conner known to you as ThatsItImout
It really is not as simple as you make out. For example, you need to consider upfront capital costs. There are projects that have positive EROEI, but because the payback time is too long, no investor will consider them worthwhile.
The Hubbert curve says that the low hanging fruit are picked first, but it does not guarantee all the fruit will be picked.
http://www.ogj.com/articles/article_display.cfm?Section=ARCHI&C=Gener&ARTICLE_ID=215336& KEYWORDS=%7Bmike%7D%26%7Brodgers%7D
http://www.ogj.com/articles/article_display.cfm?Section=ARCHI&C=Gener&ARTICLE_ID=221673& KEYWORDS=%7Bpeter%7D%26%7Br%2Ea%2E%7D%26%7Bwells%7D
IHS is suggesting between 39 Gb (1P) and 52 Gb (2P).
Be careful, the "All Liquids" is containing a bunch of different liquids that may biased your URR estimate for Crude Oil + NGL.
If you look at Stuart estimate based on the HL for Crude Oil + NGL:
- URR is 2250 ± 260gb
- K is 4.93 ± 0.32%
- the logistic peak is May 2007 ± 4.5 years
The IHS range is within Stuart's range!So waht about HLs for UAE, KSA, Iraq and Iran?
I believe that Iran is at about 50%. KSA is at about 58%--about the same point at which Texas started declining, and like Texas, KSA is showing lower production.
Check out the following EB headline. Mexico just crossed the 50% of Qt mark (Khebab's work):
Mexico's energy crisis has arrived
Annette Hester, Macleans Magazine (Canada)
I used 1998-2005 for both countries.
I used 1991-2005 for the fit.
So the score card reads:
Kuwait HL 40 billion left
Iran HL 62.2 billion left
KSA HL 98.5 billion left
UAE HL 16.5 bilion left
Total 217 billion barrels
The HL gives a number that is ceratinly closer to 2P than 1P so the comparable IHS figure, that includes Iraq and Syria etc, is 679 billion.
So there is still quite a gap to be closed. I find it very curious that the IHS figures for Kuwait are comparable with the HL result, whilst there are still huge discrepencies else where.
Iraq is a big unknown, the HL is completely unreliable on this country profile.
Ths ASPO is giving the following estimates for conv. Crude Oil reserves:
Total WorldOil O&GJ ASPO
SA 100.0 259.7 259.4 174.5
Iran 57.0 130.8 125.8 82.8
Kuwait 32.0 97.3 99.0 57.7
Iraq 29.0 115.0 115.0 71.4
UAE 23.5 69.9 97.7 47.9
OK - its Friday night, I'll buy everyone a drink if there are no new giant fields found in the ME by 2050 (OK so I'll be 93 by then) - better than offerning to drink all the oil as someone once did!
720 Gb * 0.3 = 216 Gb (Secondary Recovery for the hole SA)
720 Gb * 0.37 = 266 Gb (Terciary Recovery for the hole SA)
Don't you love HL? You have to.
Second month contracts (which will be front-month next week) are already about $2/bbl higher than the current front-month contract and are climbing as I write this.
As the past several years have demonstrated, this decrease is not unexpected. The timing is a little different than 2004 and 2005, but not the relative magnitude of change.
You can hypothesize that there is a limit to the oil cost increase that has a negative feedback effect on the consumption and eventually on the price, but the decrease in price will only encourage a resumption of consumption unless and until there is an economic collapse issue that overwhelms oil demand in the short-term.
Since mid-2004, gasoline has been devalued compared to the oil price. Maybe there is a price decoupling that occurs at around $40/bbl that also has to do with the relative value of US currency. I don't know, other than it sure is "there" when I look at the normalized graphs of price data for gasoline and oil in the US.
In the US, the non-SPR stocks of oil are much higher than the lows of early 2001 and the period between 2002-2004 and other historical, same-week tendencies. However, they are also lower (by over 11 million barrels) than the 2006 high week of June 16th. Also compared to those historical lows, the current non-SPR stocks are only about two "extra-days" of supply at current usage rates.
It's not surprising that prices become sensitive to stock volumes when things start getting cloe to razor thin margins for error. Look at the market reaction to changes in stocks that could be measured in minutes to a couple of hours of consumption. It's entertaining, in a sense (or maybe as a recovering ChE, I'm just easily entertained). But it is also illustrative of what happens as the dampening action of the supply chain is slowly removed.
http://www.energyinst.org.uk/index.cfm?PageID=1106
Mike Smith gave a great talk in London last week and showed this chart that illsutrates possible surplus supply over demand for the next 2 to 3 years, so we will once again be dependent upon OPEC to withold supply. That is unless there's a war in the ME - or some other major supply disruption - the surplus capacity is waffer thin.
This presentation from Mike Smith is absolutely amazing! I will try to include his forecast in my next PO update.
http://www.theoildrum.com/story/2006/10/5/215316/408
The subtle difference between this and Mike Smith is that net oil available for export has already started to decline.
Noting Khebab's comment somewhere up the thread, NGL's are plugging the gap right now, we also need to heed Ken Chew's comments about condensate in North Field / South Pars - but the production capacity there is evetually going to be constrained by the number of LNG ships and trains for gas export - unless they reflux produced gas into the reservoir - which they can do.
Its not that subtle! Luis' article states his model includes NGL. If liquids exports are declining now importers will have to reduce demand now. This is a supply deficit now, not 2012-2015. Maybe the discrepancy disappears if Iraq, Angola, and Nigeria are added in. Anyway, I guess we'll know sooner than later...
Its always a gamble unless you're the house.
Abqaiq's message to Washington
It gives new details about how close al Qaeda came to blowing up the largest oil terminal in the world, and links it to the stationing of US Navy vessels at the port, two years after the last of our forces left the KSA.
In particular there are some questions which pop up.
- The SA production figures point to production of ~11.3Mbpd currently, whereas I keep seeing reference to current production being ~9.5Mbpd. I know there are many ways to play with statistics, but which is more correct for this calculations?
- The rise to ~14.3Mbpd by 2011 throws another 3Mbpd into the mix, mostly due to the field highlighted green (Munifa?) and the new one in bright yellow (Khoreis?) Yet SA themselves suggest a rise of only 2.2Mbpd at best. with 11.3 capacity now, 12.5 by 2009 and 13.5 by 2011/12. That's a good 0.8Mbpd difference - even without assuming that Murphy's law will ensure something goes wrong with one or more developments.
- The numbers for Latin America, given the issues with Cantarell look a bit too flat.
- Canadian Tar sands seem to scale to 2.5-6Mbp very quickly, particular given issues with gas/water supply. Numbers I saw suggested a good 5 years later.
- When looking at graph 49 the difference between the supply and demand curves is ~5Mbpd in 2011 - yet the types of differences above could easily bring the two curves much closer. This only shifts the cross over point 3-4 years, but its gives much less room for supply/demand variances than the data here.
- As others have said, the issue is more one of available exports than pure supply - putting the gap between supply and demand much earlier for net importers.
- On the plus side, the wins due to increased efficiencies need not be so insignificant. Numbers equivalent to 5 Mbpd are achievable by 2010-12; dependent on both social and political will. 2008 in the US may introduce such a step change.
Whatever questions may occur with regard to precise numbers, the presentation does show that the decade from 2010 onwards will be testing for all. If the 2000s were the 'naughties' decade - will the 2010s be the 'empties'?So, without opec cuts it looks as if 06 total liquids would probably be higher than 05, maybe 05 is higher if they really did cut nov. 1.
At the moment the peak is hiding in the mists.
Peak of what? Euan is talking about Crude Oil + NGL and you are giving numbers on "All liquids" production that is including refinery gains (i.e. 1 barrel will produce 1.05 barrel after refining), oxygenates (ex: ethanol), etc.. If you look at production numbers for CO+NGL, production for 2006 (8 months) is down by 50 kbpd compare to the same period in 2005 and C+C is also down by 80 kpbd.
I would quote JKIssing's "mists" comment, but you already did. It will bear repeating. It will bear repeating. It's F'ing brilliant.
The whole point.
Exactly the point, I think. The peak is hiding in the mists. It's not today or in the past but sometime in the future. Finding just when that might be is an important part of TOD's collective mission, but the actual date depends on peak what, how much non-conventional oil is included and from what sources, and the methodology used to estimate remaining reserves. I'm sure I've missed other factors, but we have estimates here ranging from 2009-2015 to some time in the 2030s.
I and my kids can expect to be here throughout that time. If Euan is right, we don't have 10 years to plan. If CERA is right we do. But regardless, we and (especially) our political leaders have to get on it.
First, all liquids agree with crude + NGL... so far, first 8 months is 130k/d behind 05. BUt, jul/aug surged above the first six months avg by 1Mb/d. If all liquids continues at this rate, 06 will be higher than 05, there will be no indication there is a problem. The world will relax, suv's will remain the weapon of choice.
Second, the 3q surge in all liquids production fully explains the huge increase in storage and the crude price decline. No doubt the saudis look at ethanol/tar sands as exactly the kind of substitues they've been worrying about - now they have to cut production to accommodate not just traditional hydrocarbons but the production growth in ethanol, too.
Third, while many at tod are focused on crude + NGL (how to put ethanol in the curves?), the world is focused on what they can put in their tank, and don't much care whether it is, or is not, essentially a conversion of ng to liquid fuels such as ethanol and tar sands. The world will not be listening to tod if crude drops to 40Mb/d and all liquids increases to 100Mb/d, and will not be listening to naysayers that maybe in 20 years there is a ng problem. So, in both a real and political sense, all liquids is where the action is and always will be.
I don't disagree with you, any fuel that keeps my car running is a good fuel even if it is cooking oil. However, I believe that analysis dealing with fuel depletion should not be mixed with fuel substitution arguments (i.e. biofuels, etc.). They are two entirely different problems. I'm concerned about that kind of logic: "we have some corn ethanol here so we can just assume that there is 800 more Gb in SA!".
And, I recognize that it is hard to include either of the ng products ethanol or tar sands in your analysis. What to do? Higher all liquids will push any concern regarding PO into the background, especially with prices down, until production does hit some limit, hopefully before the world runs out of ng. It would be great to see a credible calculation showing how production of these liquids will vary with time, but there are a lot of variables.
Lemme ask you this? What do you feel about the very near future. Like say. 2 months. 3 months. Six months out. Price? Production? This is unfair. You know I hang on your every word. Whether I agree or not. Pretty soon I'm gonna start tracking you. I'm serious. I shit you not. I will make a chart outta you. You mean that much to me.
Now stop pussyfootin' around and give us some predictions.
You ever read SAT? I'm not sure he even likes tuna. I'm just envisioning my post-peak world. It's crazy. You, me, SAT, and Freddy Hutter. Drinking beers and talking about web-site design. Is that crazy? Fishing on some un-named Canadian river, with locals who have never even heard of oil. Or at least not tyhe "peak" stuff.
I think Freddy thinks about this stuff a lot. Simmons not as much.
I never tire of making a fool of myself. What about you? Do you have an opinion of what is going to happen over the next few months? And, if so, what do you think? You can't win if you don't play. Aren't you envious of SAT's current pile of TOD chips? I am.
I think that OPEC cuts are real and will bite, but maybe only to the extent that they take off the table about the 1M/d that has recently been added to all liquids. If the latter, and stocks remain high, then I think prices will remain under or around 60. However, (still waffling), I also think that opec will continue cutting until they get the desired result, which imo is mid 60's NYMEX. So, my guess is another cut by year end (already threatened) and that this will ultimately do the trick, meaning 65 by Feb. I also think, as I posted before, that we might see russia quietly reduce output, maybe about the same as SA, which would jolt the market if it came about. And, while I do think SA output is falling in spite of a major effort, and that opec cuts might be masking additional unintentional declines, the cuts will clearly take them below their current capacity.
I do not put money on commodity futures, so my opinions of crude future prices have no risk. Since I bought into PO in dec 04 I have been long US E&P's, never short, exclusively ard/gpor/gmxr since mar 05*. My attempts to time these stocks (eg move from ng stocks to oil ones when I think oil will outperfrom ng, my strategy since mar 06) have been iffy at best. 05 was my banner year, on account of ard/gmxr warrants. I am up modestly in 06, but it is worth noting that right now, exclusively in oil stocks and with oil at 55, I am just below peak. I remain modestly bullish through mid-jan, when reserve reports come out, but will prabably halve my oil exposure at that point because my wife is set to retire mid-year.
No matter what, OPEC is back to life, helping save a bit for somebody's future suv and delaying global warming. Many here, including me, had written their obit.
GOod luck with your fishing trip, sorry I can't join, don't like to fish. And, I'll be learning hula dances in Hawaii for the next two weeks. However, I recommend staying away from Alberta...
* As an aside, I originally thought that my formula would stop selecting these stocks as share price, and the number of shares, went higher. However, for ard/gpor, earnings and reserves have increased fast enough that these two are still ranked far and away at the top of US e&p's, and even as their EV has gone up around 5x.
Good luck to all investors...
PS the CEO doesn't like fishing either - or maybe he's been taking lessons. Freddy, on the other hand, looks like he would enjoy salmon fishing in Alaska.
This is not to say that fishing isn't good. And I've never experienced it with you, Wolfie, so who knows.
Did you know that if you take the 48 UK oil fields that have come on since 2000 - that they peaked in 2003?
I'm completely baffled by the narrow range oil has been trading in. Eveb more baffled by the record-breaking one-day price swings that have been happening within that range.
I can't but feel God is messing with us.
SAT is good. I gave him his due some time ago. He's friggin crazy, though. Stockpiling tuna. I feel sorry for the honeybunny he just shacked-up with.
Will I put my money on him? Will he put his money on me? He actually didn't bet last time around and was quite vocal about this. I was and I did. I came close. But it doesn't count. I don't use hand grenades.
My only hope is that this doesn't go to SAT's head. Where are you, buddy? Goose should be resetting the 2-month clock anytime now. I'll play if you will.
I think I can handle this one. Thanks again.
Gone fishing,
The OC
I do think a lot of people here miss just how involved Simmons really is in these debates. This is not casting aspersions in any sense, it is just that Simmons is not exactly an uninterested observer, he is instead one of the players.
And he seems to be quite, quite concerned. Again, that may have something to with his personal portfolio, and how to best handle it.
It's an extremely tough question(or questions). As you know I have serious problems with Simmons. His book and his analysis are one thing. But his ultimate position is another.
He has actually been seriously debunked in other forums before and recently. He is viewed primarily as a god here.
Part of the negative feedback on my recent Russian exports post centered around how it only contained a small part of the picture. That I wasn't looking at the full picture.
No, I was looking at the full picture. I always do. I was only presenting a small part of it. Or at least the Russian part. Which are no small potatoes.
I got a significant amount of responces, but I am more interested in those who didn't respond. Why?
Where are Westexas and Simmons and Kunstler?
Simmons can make speeches all he wants. But then we are only hearing his side of the story. I doubt if he could last 10 minutes in a debate with me. He just doesn't have any numbers. His book makes this clear. For a guy that flogs "data transparency" - he's pretty secretive.
However, I do think that LevinK's point about massive 'misallocation' should not be ignored - the former Soviet economies were a gigantic morass, and quite honestly, it is very difficult for an American, and somewhat difficult for a Western European to grasp - since West Europe too tends to have a heavier government presence, they are more accustomed to working around such limitations.
I know an individual who used to 'steal' trains to deliver bulk goods to a Russian port. We can all imagine misusing trucks or airplanes, but a train? Nonetheless, he did it on a fairly regular basis - though sometimes, someone then misdirected what he was already misdirecting - it seems like it was a win some, lose some sort of system - and that included the cargo being shipped. Stacks of $100 bills and vodka only go so far in shipping bulk freight, it seems. Don't even ask about the cargo ships, the loading facility, etc.
You may ask yourself, how can such an economy function, which is sure proof that it is a puzzle wrapped in an enigma, etc. Or simply accept the fact that it doesn't work very well in terms we are accustomed to.
This is in no way is meant to disparage the work, merely to suggest that Russian numbers just operate on another plane, the same way that Newtonian and Einsteinian physics part company when explored deeply enough. Then add in a Chinese perspective, and it is quite likely a major part of the world's production and consumption of oil is not easily analyzed in the customary Western framework. Of course, the oil is a physical quantity in the end, so it is not an insurmountable challenge.
It might not make the choices we face any easier. However, if we come away very well informed with a minimum of hyperbole, those of us in leadership roles can make the best decisions and choices we can.
It doesn't help when we call each other names or impughn each others honesty. I hope Ken will be invited for a guest post and that he and his coworkers become regular posters on TOD!
As an example why would the Mid East countries overstate their reserves? If one did it thinking to get a larger pumping quota from OPEC, it is obviously that all the others followed suit. The more rational move would be to drastically understate OPEC's reserves thereby driving prices up. In actual fact there may have been a new methodology of interperting reserve data that legitmately raised the reserves and it was applied throughout the Mid East.
I do agree that there is sometime a reason to put more energy into a system than you get out. This typically happens in a subset of a greater process. My favorite example from mining is the use of grinding to liberate minerals for recovery. Aproximately 98 percent of the energy input to a grinding mill is lost as heat while 2 percent is used in size reduction. It is a good deal because further down the line in the process it allows the recovery of the desired mineral. The same applies to energy input to an oil reservoir, whereby you might use solar collectors to heat water for injection to increase reservoir pressure, lower viscosity of the oil, and increase the vapor pressure of light fractions to be recovered as wet gas.
I look forward to reading more about peak oil and other peoples idea as to what it really is.
This was almost all you read about in 2000-2001, and it's a major statement about the recent changes that you hardly hear anything about this anymore. Clearly SA is much less afraid of high prices and seem more confident that they can't be threatened by the rest of the world, but this is a recent development - probably just this year.
And that is, to me, a sign that the peak is nigh. At least peak-lite, defined as when supply cannot meet "demand", the latter defined as the amount that would be bought at the old fashioned prices.
Thus there must have been "demand destruction" in some places already (in poorer countries, as has been discusson on TOD), and OPEC could not prevent that.
Meanwhile demand in China and India is far from being destroyed, because those countries are using a small amount of oil relative to their population and economic "growth". In other words, they are nominally poorer than the OECD, but they can easily (in congregate) afford more oil than they currently use, even at prices higher than we've seen yet. As their demand grows further, we'll be further past "peak lite".
Throw in some declining EROI, and increasing domestic oil demand in Russia and the ME (thanks to their oil revenue), and we're likely to see major effects on the world economy within this decade. When economic decline in the OECD is severe enough to depress China (when they cannot export as much industrial output), then we may see a "plateau" - but not a happy one.
We have seen inklings of this already and more is sure to come. There's those pesky "above ground" issues that cloud everything up.
vtpeaknik
"Clearly SA is much less afraid of high prices and seem more confident that they can't be threatened by the rest of the world",
to which you replied,
"And that is, to me, a sign that the peak is nigh"...
There is logic in your argument. I think though that as was said earlier, the implication that Saudi Arabia feels confident they "can't be threatened" by the rest of the world, this refers to a flood of cheap oil from the other nations of the world capable of producing oil. I agree that the Saudi's do not seem to fear this as greatly as before.
What they do still fear is technology and fossil fuel alternatives. I think there is a point (exactly what price number? Who knows, but my guesstimate is around $120 per barrel on crude) that all the "old fashioned liquid crude oil" producers would have to open the taps and see to it that the price comes down, not because of competition from other oil producers, but out of fear of being displaced by technical breakthroughs.
That is why I chose the $120 (todays dollars) price point. At that number, advanced lithium ion batteries and plug hybrid drive becomes very competitive. At that point, thin film solar and windmills are able to compete, through the plug hybrid and electric rail, for sales now going to crude oil suppliers. Likewise, LNG, CNG, LPG, GTL and NGL (the whole natural gas derived family) comes directly into the fray, based on all the gas we can pull from the arctic and Canada, Trinidad and Tobago, Algeria and Africa, and Qatar. It would be the one last "dash for gas" long predicted by the likes of T. Boone Pickens and others.
So how would Saudi Arabia play the game? All this is looking 5 to 10 years up the road: Saudi Arabia still has a lot of heavier sour crude, which the refineries will have to adapt to. Add to this a hard push on the "empty quarter" of Saudi Arabia (Khurais and Shaybah come to mind) combined with major efforts offshore Persian Gulf, and the Saudi's may still have one "flood of oil" left in them. They would have these ready for the full last push by about 2010 to 2012, just when the developers of alternatives were beginning to gain traction, and when the oil would bring the most in the marketplace. Then, up comes production, at least for a while, down comes price and the alternatives get knocked on their azz, repeat of 1982. What the Saudi's need is for Ghawar to hold at least reasonably steady, so that the new oil could give them leverage, rather than just leave them hanging on by the fingernails.
This seems to be the scenario that Yergin and CERA are betting on, and Simmons, Campbell, Bhaktiari, Pickens, and of course, Westexes and other TOD peak statisticians are betting against.
The horrible news is that the "good news" in most peoples eyes could be the most horrific news in long term outcome. If the Saudi's pulled it off, we would get one last "wooosh" of carbon based luxury living, and then a fall off the cliff. The alternative "mitigation" industries would be wiped out, and the major consumption binge would have all but bankrupted the petroleum consuming nations, just as the developed nations populations entered the highest average age per person in history. Then the doomsayers would be much more certain of winning (?) their bet against the sustainability of a modern technical society. In one way, we are better off to hope that the Saudi's fail in their attempt and we get the emergency now. The cruel truth is that it will take $120 per barrel of oil or more to have any real effect, and that will have to happen soon, as inflationary pressures mean that if it takes 10 years to get to $120, it will have no more effect than $75 dollar a barrel oil had a year ago, in other words, not nearly enough effect.
We are starting to be put in the position of wishing against our own comfort and prosperity, at least for a while, in the hopes that the hard cure will help us live longer. Either way, it shows signs of being a wild ride. One more point: It will be a ride we will take, as always, blindfolded, since the lack of usable data makes betting on which way it will break a complete crapshoot. The current idiotically low oil prices will serve as no indicator. There will be no warning.
Roger Conner known to you as ThatsItImout.
Any minor gains in KSA / Gulf / infill drilling/ puddle sucking/technical improvements etc, are all going to be offset by depletion elsewhere.
To keep on going the way we are, another HYPERGIANT (or two or three), each capable of delivering flows of 1 million bpd would need to be found and the flow easily delivered to markets and with no 'above ground' constraints.
Where are they? KSA? Russia? Caspian? Iraq?
Inside Yergins Head?
No, cumulative depletion of Ghawar, Cantarell, Burgan, Daqhing and others will only be offset by as yet unknown supergiants. Where are they? what are their names? When does development drilling commence? Where are the PR announcements heralding a golden , secure future of abundant and modestly priced oil to a worried world?
Cantarell should be the first real wake up call, but this may be masked by a US /global 2007-2008 recession and demand destruction.
In fact, a well timed recession is maybe what is about to be served up. It pushes the problem a little further into the future, cools China's aspirations to be a super power, so too Russia and stops dollars flowing into the Umma.
So, a few million lose jobs and houses? So what? cheaper than a new global struggle. And cuts GHG emissions!
A bargain!
Someone , somewhere will have gamed it...
Look at the Asian Meltdown. It busted Asia's growth
Oil consumption fell, the oil price fell.
It is a race:
Ramping growth leads to more oil consumption: - We (the world) make more things with plastic, 'Wealth'is created in Asia, more wealthy Asians buy cars, internal oil consumption goes up in the newly industrialising nations, they industrialise = less organically based peasant farming, they import food stuffs, export more goods that take more energy to manufacture and transport etc etc.
An economist would call this a virtuous circle.
An earth scientist or biologist or physicist living on a finite planet would call this the road to hell.
Infinite growth on fossil fuels is not possible and bound to fail.
Tragically.
Disasterously.
The readership of TOD know this.
The top 10000 hyper-rich families on the planet know this also.
Every one else in the west would like to 'believe' that all the tomorrows will be the same as yesterday. Or better.
So, How do you keep the game running?
CERA and other bromides help.
MSM can help too
Religion does its bit
And if all else fails, ID cards and detention centres and dispensing with Habeas Corpus and Posse Commitatus and the Patriot act and the Mil Com act are all handy tools of control.
Meanwhile , back at the ranch, the middle classes (first in the US, then later in the UK and elsewhere) are fleeced, denuded of wealth, indebted, dumbed down, moronicised and disempowered.
A nice little depression will help to do this.
Wealth Extraction continues unabated.
The Elite are almost there.
What they won't need in the future is a bolshy, argumentative, educated, middle class.
A small elite, paid thugs and a docile peasantry is quite nice (if you are in the elite)
The rise of a carbon economy (1750- 2050) was shadowed by a rise of the western middle class. Industry, manufacture, clerks, managers, lawyers,engineers, scientists.
All educated, all thinkers, all wanting a share of the pie.
Do you think the top brass would pay extra money to keep us if they did not need us? (would you keep a cow as a household pet?)
And what do you think they will do when they dont need us?
Keep us as pets?
No, they have modelled examples to draw on:
Asian meltdown = low growth = less oil consumed.
9/11 = no flights = clear skies = a very good understanding of Diurnal temp deltas and global dimming.
Terror threats = less flights = less GHG's.
No, we are the problem, the middle class: with our aspirational lifestyles, cars, holidays abroad, excessive consumption. (and our education, argumentative bent and access to things like TOD and alternatives to MSM).
PO and GW demand that the patient is put in an induced coma.( At least if the elite wish to continue to be an elite).
Watch this space.
And BTW:
Dont invest in any company that is heavily involved in the UK Olympics of 2012
Master statistitian Khebab ascribes an uncertainty of +/- 5 years for predicting the date of PO from a Hubbert Linearization analysis, and I believe it's probably higher.
In mining, the energy costs of extraction are (hopefully) offset by the value of the recovered mineral. With electricity production, a net energy loss (from burning fossil fuel, for example) is accepted because the product has higher value (is more useful). But at some point, the primary energy harvesting process, be it getting oil from deep water or oil sands, gas from the frigid Artic, or biofuel from crops, had better be net energy positive or it is a waste of effort.
Following Peak Oil can mean predicting a particular date, but it is also becoming more aware of the astounding dependence of the world on fossil fuels and the challenge of moving beyond that and preparing for the future (good or bad).
If I recollect right Kuwait got itself a new energy minister back in July who said (paraphrasing) that he would knock heads together and report to their parliament on the real status of kuwaiti reserves within a few weeks. I keep scanning the usual media, including kuwaiti and mid east local ones, yet have failed, so far, to see even the faintest whisper of new kuwaiti reserve data. Am I incompetent or blind or has there been a total absence of news?