| A Primer on Reserve Growth - part 2 of 3 | The Oil Drum: Europe | How to Get a Pipeline Built - Revisited |
A Primer on Reserve Growth - part 3 of 3 - Revisited
Posted by Rembrandt on November 2, 2010 - 10:20am in The Oil Drum: Europe
This post was originally written by Rembrandt in 2006.
Will 730 billion barrels be added to the reserve pool from reserve growth between 1996 and 2025 as estimated by the United States Geological Survey?
This post is the third part in a three piece series about the phenomenon of reserve growth in found oil fields. Insight in future reserve growth, often attributed to technological advancement, is crucial in determining the peak of conventional oil production. Parts 1 and 2 can be found here and here.
What we learned in part 2 of this series is that the data with respect to reserve growth is utterly confusing. Nonetheless, we need an answer to the question what the future perspectives are for reserve growth in order to; 1) improve forecasting the peak in conventional oil production; 2) Increase the understanding of the future role of technology in the oil industry.
The United States Geological Survey has so far been the only institute which has published an estimate for future reserve growth. In their World Petroleum Assessment from the year 2000 they estimated that reserves would grow with 730 billion barrels between 1996 and 2025.(612 billion barrels for conventional oil, 118 billion barrels for Natural Gas Liquids). By estimating past reserve growth in the US lower 48 a reserve growth algorithm was established. This algorithm of which the curve is shown below was then applied to the entire world. Delivering an estimate of 730 billion barrels.
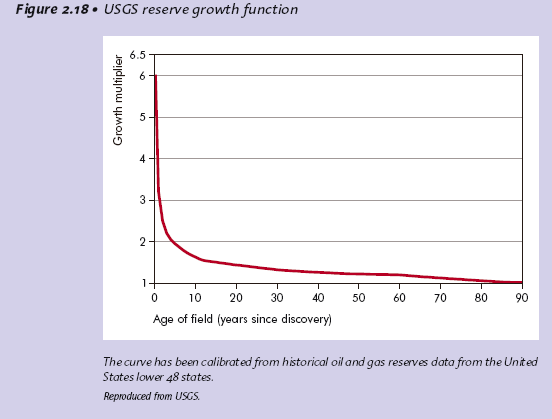
Chart 1 - Source: USGS, Verma
The problem with this method is the way how crude oil reserves are reported in the US which has been described in detail in part 2. Because of the practice of reporting only proven reserves, the amount of reserve growth is very high in the US when compared to other regions. In addition several heavy/extra heavy oil fields such as the kern river oil field are included in the assessment, which showed huge reserve growth due to the advancement in steam technology necessary to dilute the oil to produce it in the middle of the 20th century. It is erroneous to apply reserve growth in such heavy/extra heavy oil fields with medium and light crude oil fields. Thirdly applying onshore reserve growth to offshore and deepsea fields is certainly not an approach that gives a correct estimate. Based on these three issues, the figures presented by the USGS do not seem to have much value. The method used likely provides figures too inacurrate to be relied upon.
However, the USGS authors (Albrandt et al) have acknowledge a part of the problems outlined:
"There are several reasons why a reserve-growth function that is based on historical trends for oil and gas fields in the Lower 48 states could Overestimate world potential reserve growth:
Engineering criteria for reporting reserves of world oil and gas fields might, in general, be less restrictive than those for the United States, tending to increase known reserves and decrease the potential for reserve growth.
Reported reserves might be deliberatly overstated in some countries, reducing the potential for future reserve growth.
Large world oil and gas fields might tend to have more substantial development than U.S. fields prior to release of initial field-size estimates, leading to more accurate initial reserves estimates and reducing the potential for future reserve growth.(USGS WPA 2000, chapter AR)"
To see if these critical remarks on their study held any value the authors of the USGS study attempted to apply their function for reserve growth, as shown in graph 1, to other oil producing regions in the world. Several latter publications were published with respect to reserve growth in Volga-Ural (Verma et al., 2000), West Siberian Basin (Verma and Ulmishek 2003), the North Sea (Klett and Guatier 2003, 2005), the Middle East (Verma et al., 2004) and Canada (Beliveau, 2003; Verma and Henry, 2004). Their conclusion was that the reserve growth curve is indeed applicable to the entire world, given reserve growth patterns observed in these other regions. The one about Russia has been described in detail in part 2. These publications do not shed much light on the issue however as shown in part 2. Reserve growth varies in every region in the world. Applying a strict curve from one region towards others does not make much sense to me in the light of the highly chaotic variance in data. I therefore disagree that such a conclusion can be made, the USGS authors could be right, but they could also very well be wrong.
The International Energy Agency seems to disagree with this cautious vision on estimating reserve growth. In their recent resources to reserves report they noted the following about the USGS method and the criticism it received from ASPO:
"It should be noted that some authors (ASPO) argue that the "reserve growth" phenomenon is an artefact of very conservative United States reporting on proven reserves, which should not be applied worldwide, particularly in OPEC countries where some observers claim that published proven reserves numbers are suspicious (Simmons 2005). However, further studies by USGS geologists have pointed to reserve growth observed also in large fields outside the United States, at a rate consistent with the assumption of the 2000 Assessment (Klett 2003)." (IEA Resources to Reserves, 2006)
There is only one way to give a reasonable answer to what future path there is for reserve growth. The USGS takes the estimates from the IHS energy database (formerly petroconsultants) as a starting point. The updates in the IHS energy database therefore give excellent means for reviewing the forecast from the USGS. By looking at every change in the past decades in the IHS Energy database (formerly Petroconsultants) in meticulous detail an accurate answer can be found. Only then we will know what exactly bas happened in the past decades with oil reserves (proven and probable). There is only one problem, access to the database costs approximately 1 million dollars a year, a bit too expensive for a voluntary weblog. So the best we can do at the moment is by looking at the bigger trends that are available in public domain data.
In a publication from August 2005 in AAPG Bulletin (An evaluation of the USGS WPA 2000) the authors (Albrandt et al) conclude that approximately 28% percent or 171 billion barrels of the forecasted 612 billion barrels for conventional oil had been added to the reserve pool between 1996 and 2003.
In a presentation from 2004 one of the UGSS study authors (Klett) showed a graph depicting reserve growth in giant oil fields between 1981 and 1996 and 1996 and 2003:
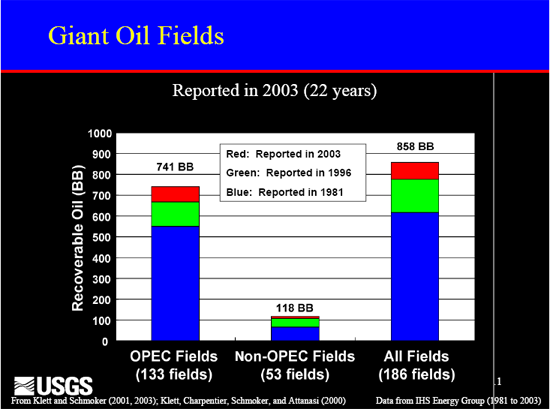
Chart 2 - Source: USGS, Klett
It is important to note that the largest part of the change occured in giant oil fields operated by the OPEC cartel. The USGS notes that 73 of the 171 billion barrels of reserve growth came from giant fields in OPEC countries. From a chart in a paper by Ahlbrandt (USGS WPA 2000 main author) in the "book Oil in the 21st century" the division between the 171 billion barrels figure for reserve growth between 1996 and 2003 can be estimated (approximates):
83 billion barrels (Middle East and North Africa)
36 billion barrels (Central and South America)
18 billion barrels (Former Soviet Union)
13 billion barrels (Sub Saharan Africa)
12 billion barrels (North America)
5 billion barrels (Europe)
3 billion barrels (Asia Pacific)
1 billion barrels (South Asia)
The reserve growth phenomenon is also tracked by IHS Energy, whom present a much larger number than the USGS with respect to reserve growth in the period between 1995 and 2003 (457 billion barrels). The large variance in figures presented is to say the least, puzzling. The most likely explanation is a difference in definitions. The USGS could for instance only have include additional proven reserves while IHS Energy included proven + probable reserves. Nonetheless they both agree that the largest part of reserve growth between 1995 and 2003 was observed in the Middle East:
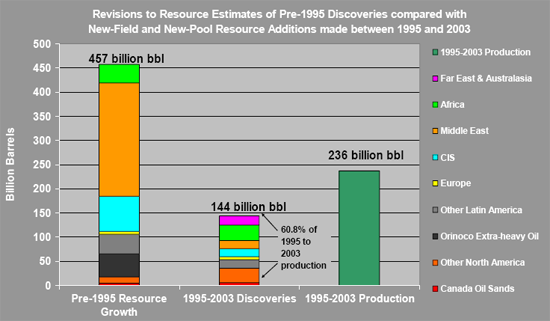
Chart 3 - Source: IHS Energy
In the period between 1995 and 2003 nearly 250 billion barrels were added to fields in the Middle East in the IHS Energy database. In this period almost no conventional oil was discovered in the same region. Given the secrecy of Middle East reserve forecasts, it is questionable that these reserve additions are real. In addition Jean Laherrère notes that in 2004 another large reserve increase occured in the Middle East in the IHS Energy database. (Laherrère, 2006, pag. 19).
The effect of reserve growth on reserve estimates over time is shown very clearly in a graph from Francis Harper from BP:
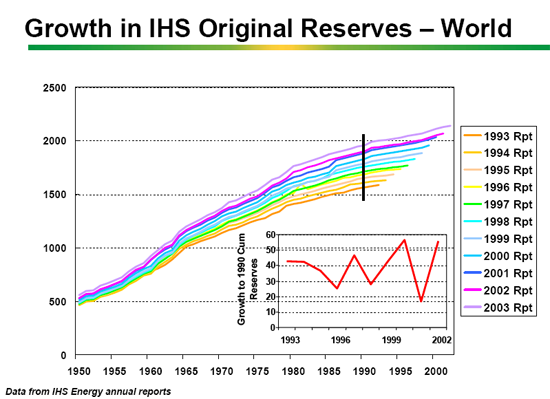
Chart 4 - Source: Francis Harper, BP, reserve growth in this chart is not backdated to original discovery as is common practice in reserve estimates made by ASPO.
Since I have no additional information with respect to the value noted by the USGS on reserve growth (171 billion barrels), we take a further look at the changes stated by IHS Energy (457 billion barrels)The difference between the USGS figure from the IHS database and the figure from IHS Energy is explained in a presentation by Peter Stark (Vice President IHS Energy):
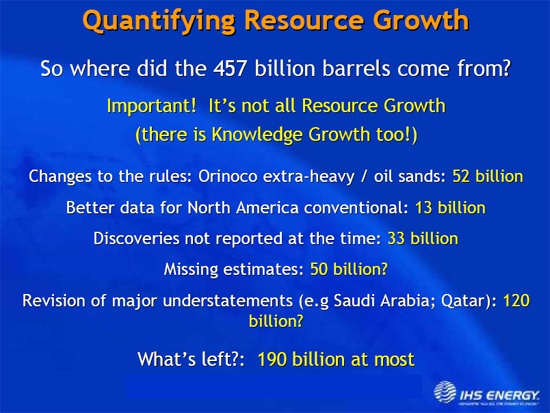
Chart 5 - Source: IHS Energy
The revisions that IHS made shown in the chart above explain the largest part of the reserve growth phenomenon. 96 billion barrels can be discounted because of missing data. An additional 52 billion barrels can be discounted because of changes in the rules. That leaves 309 billion barrels of reserve growth in the period between 1995 and 2003. Of these possibly 120 billion barrels according to IHS are due to underestimates in the Middle East. The question that remains is where the remaining 190 billion barrels of reserve growth as noted by IHS energy comes from. The largest part of this increase comes from the Middle East, given the increase in reserves from pre-1995 discoveries of approximately 250 billion barrels between 1995 and 2030.
So basically we are left with two choices:
1)If we think that the 190 billion barrels can be attributed to genuine reserve growth, the USGS estimate of an addition of 730 billion barrels from reserve growth between 1995 and 2025 is on track so far. This does not necessarily mean that reserve growth will continue or discontinue to happen in the future as it did in the past.
2)If we think that the 190 billion barrels are not caused by reserve growth but mainly by political overstated reserves in the Middle East, then we can throw the USGS estimate in the garbage can. Reserve growth will be far lower then now accounted for and forecasting publications that rely on the USGS estimate are too optimistic (IEA and EIA forecasts).
As to the lastest figures from IHS, 2005 was a very bad year for reserve growth. Only 8 billion barrels were added from pre-2005 discoveries in the IHS Energy database in 2005. Production in 2005 was larger then reserve growth and discoveries combined in the IHS Energy database, leading to a net decline in reserves:
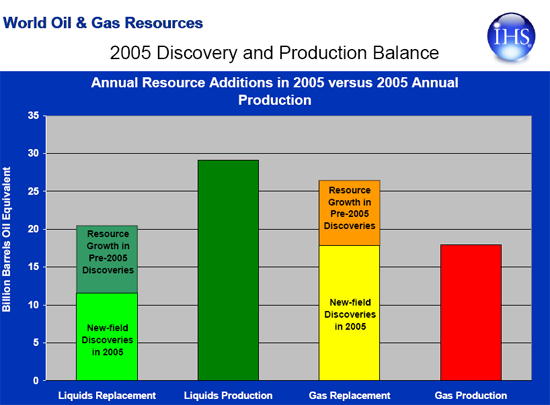
Chart 6 - Source: IHS Energy
Personnel
Editors
Contributors
Peak Oil Primers
Archives
- November 2010 (3)
- October 2010 (6)
- September 2010 (4)
- August 2010 (7)
- July 2010 (6)
- June 2010 (7)
- May 2010 (2)
- April 2010 (8)
- March 2010 (4)
- February 2010 (6)
- January 2010 (3)
- December 2009 (5)
- November 2009 (8)
- October 2009 (12)
- September 2009 (6)
- August 2009 (5)
- July 2009 (11)
- June 2009 (8)
- May 2009 (16)
- April 2009 (10)
- March 2009 (7)
- February 2009 (10)
- January 2009 (15)
- December 2008 (9)
- November 2008 (9)
- October 2008 (9)
- September 2008 (13)
- August 2008 (10)
- July 2008 (14)
- June 2008 (23)
- May 2008 (16)
- April 2008 (12)
- March 2008 (16)
- February 2008 (9)
- January 2008 (13)
- December 2007 (13)
- November 2007 (16)
- October 2007 (22)
- September 2007 (8)
- August 2007 (9)
- July 2007 (16)
- June 2007 (8)
- May 2007 (7)
- April 2007 (7)
- March 2007 (10)
- February 2007 (10)
- January 2007 (12)
- December 2006 (9)
- November 2006 (15)
- October 2006 (4)
- September 2006 (5)
- August 2006 (5)
- July 2006 (9)
- June 2006 (5)
- May 2006 (10)
- April 2006 (9)
- March 2006 (13)
Vital Trivia
License

This work is licensed under a Creative Commons Attribution-Share Alike 3.0 United States License.
This is all very nice, except that it's conjectural. The one and only thing that matters is production. While our experience may be limited in scope and anecdotal, we routinely bust blue sky reserves frauds and the majors are no better than minnows in booking nonexistent "fill to spill" assets.
The other problem is cost of E&P, notably megaprojects like Kashagan and Tupi. I don't see the sense in pencilling reserves that no one can afford to produce and transport to market. That's why the SEC formerly required "proved" assets to be commercially producible.
Initial discoveries like Kashagan and Tupi are not considered reserve growth but new discoveries. And there is two kinds of reserve growth, the kind that you get with a pencil and the kind you get by discovering there is more oil in the reservoir than originally estimated. The latter kind is the only kind of legitimate reserve growth. So:
If you are going to count OPEC magic reserve growth. That is for every barrel pumped out of the ground another barrel takes it place, plus a few more every few years then there is no limit to the amount of reserve growth that we can have. But if you are counting only legitimate reserve growth, that is the difference between the estimated reserves of existing fields in 1996 and the final total of those fields... 730 billion by 2025... not even close.
Ron P.
From today
and darwinian alone knows what is legitimate.
Elwood this was an intelligent conversation before you came alone. All you were able to add to the dialogue was a snarling insult. That says something very profound about you Elwood.
Ron P.
and darwinian alone is capable of determining what is an intelligent conversation and what is an ad hominem. thank you for the insult, that says something very profound about you, ron.
it must be wonderful to be you, a legend in your own mind.
i am puzzled though, how could a legend like you think that burgan could have reserves in only one producing horizon ?
We were having a serious discussion about reserves. But you had, and still have, nothing but mean spirited insults to add to the conversation.
Sorry for your misfortune Elwood. You were not banned from Drumbeats, just chastised slightly. Don't take it so hard. Things will get better.
Wishing you a better life so you will not feel it necessary to try to insult everyone that disagreed with you in the past.
But NO, Saudi Arabia does not have 260 billion barrels of condensate reserves. Just thought I would throw that in. ;-)
Ron P.
you need to get your facts straight.
when did i say that ksa had 260 gb of condensate reserves ? i did not.
what i have said is that ghawar permian khuff and older paleozoic reservoirs could easily contain 260 gb of condensate in place and i outlined how that could be the case. that was in response to your often repeated claim that aramco does not have 260 gb of oil reserves. all you had to offer was some gibberish to in effect that that much condensate could not come from ghawar arab d associated gas.
do you still not understand the difference between condensate that could be in place and condensate reserves ?
your post started with reserve growth and decayed into your often repeated claim that the a-rabs are lying. at least condensate potentially in place in a deeper horizon has some relationship to reserve growth.
thank you for the kind wishes, my life is fine. i am happy, i am optimistic, i dont buy-in to doomish fantacies, i see solutions and none of my plans involve hiding under the bed.
I would not hide under the bed either, but reality is hard to check at the door. It has been a flat production curve for a long while now. Why not convert those OPEC reserves into producing fields since the infrastructure is in place as far as i can tell. i would bet that it is not easy oil or it requires special processes and equipment or it is heavy muddy oil or it is a lie. in any case the oPEC reserves are not making up for the declines, hence the flat production curve.
your belief system is your own.
i would hedge my bets and maybe buy a smaller car if i was you.
Ron - You bring up a good point I haven't noticed mentioned. What does the word "reserve" imply? We don't typically use the word reserve when discussing specifics. When evaluating the value of a field the reserves are broken down into PDP, PUD, PBP and PNP as general categories: Proved Producing, Proved Undeveloped (not yet drilled), Proved Behind Pipe (drilled but waiting for a recompletion to that reservoir) and Proved Non-producing (maybe waiting for a pipeline to be built). And this obviously just covers the proved categories. Possible and probable are the other two big categories. To fall into any proved category a well has to be drilled and logged thru the reservoir. And then, according to SEC regs, the proved category only extends one offset location in four directions from the well. One well might indicate a 2,000 acre productive field but the regs might only allow four 40 acre units classified as proved (PUD) around the discovery well.
Obviously "reserve" numbers tossed out by NOC's don't come close to fitting this protocol. And as someone pointed out, the number that counts most is proved producing. And the category Proved Undeveloped is very dependant on devolpment cost/oil prices. A field might have 500 million bbls of PUD reserves at $80/bbl but only 100 million bbls of PUD at $40/bbl.
Which means that proven reserves logged with the SEC means something very important but proven reserves reported to the EIA by NOCs are virtually meaningless.
And reserves listed here are a joke. OPEC Share of World Crude Oil Reserves 2009 And the joke gets even bigger in 2010.
Ron P.
Great! Perfect wedding dresses Are Introduced Last Week!The New wedding dresses for Fall
Isn't the USGS due to come out with a new ROW assessment this year? If there are massive reductions then their model was wrong and things are much tighter. If not, then their model is likely working.
Regardless, I trust their estimates more than the HL mathematicians at TOD.
Just enjoying reading a few old posts on the oil drum:
http://www.theoildrum.com/node/5177
Seems that we already have a new peak for World Liquids Production with 2010 well exceeding 2008. We are also close for World Oil production. (Click on the links and you'll get the updated numbers).
Still its fun to look at the figures which now look hilarious. According to the prediction oil production should be in free fall by now. And what? It's rising faster than it has been for a long time. With the enormous reserves currently being found around the world, particularly in Brazil, it now seems clear that world oil production will continue to rise for at least the next couple of years. Perhaps much longer.
Funniest of all is reading the comments to the original posts. Particularly the agressive attacks on the only voice of sanity (Euan Mearns) who points out that perhaps peak oil hasn't been reached yet. All the other posters are just fighting about whether the real peak is in 2005 or 2008.... Well hey guys... you're all wrong... The real peak will be in 2011 - 2012 - 2013 - 2014.. Heck.. I don't know how long oil production will keep rising for... but there is no end in sight at the moment...
Also: Once again. We we will now have to shoot all the wolves again and it will make life harder for those of us arguing for a sensible transition to renewables and nuclear and not basing our arguments on a complete collapse of oil production and going back to live in caves with shotguns. :-)
Note that the Peak for World Liquids Production in the original post is labelled at 85.47 million bbls/day whereas the current average for 2010 is 86.1 million bbls/day. According to the prediction it should have fallen to 82.5 million bbls/day. (Reading off the graph).
For oil there is still a little way to go until a new peak is reached - but oil production is rising fast and it is only a question of time... Russia (who so many were saying had peaked) just hit a new record.... Brazil is ramping up... the list is long....
Ps. for the funniest comments read ccpo's crazy rabbid rantings... which are now all proved wrong... Also look at all the graphs..... also in the comments... they are all marked with a big WE ARE HERE ARROW... followed by a more or less sharp decline... Not a SINGLE one allows for the possiblity of increasing production. (The reality)....
Common guys!!! Please stop screaming wolf. And please stop posting "silly" graphics that show world oil production collapsing from tomorrow based on your gut feeling..
Typical "fact" on old post:
"Russia has already stated officially that its oil production is in decline. Even the optimistic EIA is forecasting declining Russian liquids production from 9.79 mbd in 2008 to 9.43 mbd in 2010".
Reality today on the Oil Drum:
(Reuters) - Oil output in Russia, the world's top crude producer, rose 4 percent to a new post-Soviet record of 10.26 million barrels per day in October as new fields went on stream on the island of Sakhalin.
Agreed the screaming doomers need to get back on their meds. I'm as supportive as anyone for our transition onto renewables as soon as rationally feasible, but these doomers just kill everyone's credibility in discussions. Cute is the ignoring of Cdn. Oil Sands. Perhaps theyre depending on Avatar?
How much money does it take to produce Oil sand in capital costs, water, and heat? Cause decreasing energy return on energy spent per barrel is evidence of resource depletion reaching the tipping point.
Are you going to give me extra money to pay for the oil sand oil, since it costs more? I can give you my paypal account.
Good point Oct. One might say that $20 peaked about ten years ago. Cheap oil is now well past peak. But there seems to be a good bit of very expensive oil coming on line. Pre-salt oil, when it eventually comes on line, will be extremely expensive oil. But very high oil prices have kept the expensive stuff coming, keeping us on the plateau.
I don't know when we will be coming off but I have been saying for about two years that it will be late 2012. But that is just a guess of course. Could be a little sooner or a little later.
Ron P.
Pre-salt oil is already online. Production will be ramped up over the coming years.
One well with spotty sour flow. Three dry holes. Pre-salt production plan depends on gas reinjection, corrosion proof manifolds and risers, and floating liquefaction, none of which is built, installed or tested.
http://www.automatedtrader.net/real-time-dow-jones/25111/-9th-well-drill...
...and while the reserve estimates grow as they flesh out the field, they are projecting $224 billion in initial development costs?!? That's got to hurt...
Can you post the actual production data that shows a net increase in conventional crude over the year 2005? thanks
He can't because it does not exist. Crude + Condensate barrels per day.
EIA International Petroleum Monthly
But if you count bottled gas then 2010 sets a new record but well within the margin of error. It does not change the fact that we have been at the peak for six years.
Ron P.
I thought he couldn't post a response ;-)
facts are facts -- perhaps we can get him to talk about butane as the new gasoline substitute.
I love to hear about russia and brazil.
I also like to hear people talk about a few cooler than average cities when they deny Climate Change.
My mom calls it "cherry picking" -- not referring to the kind that makes anything you'd like to eat either.
Ron,
Just for my notes. How high does production have to go before you accept that we are nowhere near a Peak yet? 75? 78? 82? Please let me know. I'm always reading "X is higher than Y so that is the peak" from the dooomers. Whereas I'm sure that when we get a new peak either this year or not you will all be arguing that "this isn't really statistically relevant because new oil isn't the same as old oil" or something like that.
On behalf of the optimists,
Nordic.
No. I can't. Because it hasn't :-) If you had read my post you would have noted that I wrote: "For oil there is still a little way to go until a new peak is reached - but oil production is rising fast and it is only a question of time..."
For sure: You can trust me to add a post when it does reach a new peak! :-)
2005 Average: 73.7 million bbls/day
2005 Peak: 73.8 million bbls/day
2010 Average (so far): 73.4 million bbls/day
2010 Peak (So far): 73.7 million bbls/day
2010: Monthly from January to July:
Jan - 73,123
Feb - 73,537
Mar - 73,518
Apr - 73,438
May - 73,389
Jun - 73,291
Jul - 73,691
You will note that the July production is equal to the 2005 average... and the trend is rising.
Anyway. My main point was that all the predictions in the old post were confidently predicting MASSIVE drops in oil production. That is certainly not the case! :-)
ps. All data from the EIA.
?
Ok. Supply is either flat or beginning to fall, while demand goes up and up and up.
either way seems very bad to me, but I am generally a half-empty person.
Cheers to your positivity, although I fear it is the same type of thing where they hoped the housing market could increase perpetually.
Supply will rise quite quickly when there is demand. Demand is coming - just watch the supply over the next 6-12 months.
In other words, it appears that annual crude oil production, inclusive of a slow increase unconventional production, will have been at or below the 2005 annual rate for five straight years, while it appears that average annual oil prices will exceed the 2005 annual rate for five straight years, all of which is in marked contrast to the rapid increase in crude oil production, in response to rising oil prices, that we saw from 2002 to 2005. Is this the point that you were trying to make?
In any case, from the post that you linked to, my comment about net oil exports:
Here is what the EIA now shows for annual net oil exports from the (2005) top five, versus average annual US crude oil prices:
2005: 23.8 mbpd & $57
2006: 23.0 & $66
2007: 22.1 & $72
2008: 22.4 & $100
2009: 21.4 & $62
And here is a quick summary of Peak Oil Vs. Peak Exports, with a couple of scenarios for global net exports:
http://www.energybulletin.net/stories/2010-10-18/peak-oil-versus-peak-ex...
And finally, here is a copy of my post on the Drumbeat thread today (emphasis added):
Back in the days of Hubbert there was oil and there was gas. Some of the gas, like propane and butane you could put in pressurized bottles or tanks. Someone had a great idea and decided to call this oil. But bottled gas is not oil. Neither is ethanol.
So peak oil is about oil, not peak bottled gas or peak ethanol. Oil is oil and gas is gas. Calling everything "liquids" is really moving the goal posts. Average oil production for 2010 is still about 300 thousand barrels per day below the average for 2005.
But this simply does not matter! Everything in the last six years is within the margin of error. The EIA as well as the IEA just guesses. Many nations do not report their production and the EIA simply must guess at how much they produce.
But even if their guesses are relatively accurate it still does not matter. We are at peak oil right now! And we have been at peak oil for about six years now. A few thousand barrels per day one way or the other is just noise inside the error band. We are at peak and even if we were to go above the 2005 level for oil production it would not matter one whit. We would still be at peak oil.
So you can cheer all you like because counting bottled gas put the level of production slightly above 2008 we are still AT peak oil.
Ron P.
Haven't capital expenditures built out only so much capacity in non-conventional liquids?
Thus they will also reach supply limits in the near future and cannot possibly be built up fast enough to make up for conventional crude declines.
They are desperate to get that pipeline for the Canadian tar sands -- but that will take time to clear regulatory and environmental reviews. Lawsuits might block sections of that pipeline.
medium term there may be some slack in total liquids but no way it can hold steady for much longer and certainly liquids cannot grow significantly.
Meanwhile OPEC consumes more. Chindia consumes more.
I concur. The megaprojects databases show it, the bottom up country analyses show it, the HL analyses show it, the creaming curves show it, the giant oil field analyses show it and the production data show it. It's not just one thing any more. All these conspire to show that oil production will not increase appreciably despite high prices.
As Roger Bently points out:
At the ASPO conference this year, the consensus seemed to be what Hirsch was presenting:
Hirsch's best case for mitigation to arrest the contraction was ten years, but that was the absolute best case and he didn't sound confident that it would come to pass:
Assuming a one to one contraction between oil decline and GDP, this would result in:
However, in none of his projections does he include the problem of debt, so none of his rosy scenarios will come to pass, unfortunately.
As I was pointing out in the DB from two days ago, even just a 2% production decline combined with 2% from ELM gives 1 - (0.96 ^ 5) = 18.5% decline to an oil importing country in just five years.
My dear Wolf or Ron as you sometimes call yourself,
I love reading "We are at Peak right now!!". I have bookmarked this post so that I can keep rubbing it in when you are proved to be talking rubbish. :-)
It's also funny how when the IEA or EIA data shows a decline it is 100% reliable. The moment it doesn't it is just a case of: "The EIA as well as the IEA just guesses"
You are absolutely bonkers.
Conventional crude oil peaked in 2005.
State a year that produced more conventional crude than 2005.
With all due respect, aren't you kind of dead wrong here. LOL
Did you read my earlier post with the numbers?
ps. Will remember your comment about me being bonkers when we hit a new peak in the near future. :-)
Sorry I just read it. I understand your position but noisy flat data is not looking good for much future oil growth.
I'd like to see enough growth in oil supply to meet the demand growth from the exporting nations.
You can poke my nose in it later. I am a better-safe-than-sorry kind of personality.
True. But I believe that pre-salt may be a game changer.
I've seen so many "game-changers" in the five years I've been following energy — none of which have changed anything.
I'll believe it when I see it. In the meantime, I'm planning for decline.
Down goes another one.
The "game-changing" Iraqi oil won't come online in time anymore:
http://www.ameinfo.com/247888.html
Original:
http://www.ft.com/cms/s/0/def69f28-e76c-11df-b5b4-00144feab49a.html
Oct 22 (Reuters) - U.S. oil major ExxonMobil (XOM.N) said on Friday it was on track to reach its initial production target in Iraq's West Qurna Phase One oilfield next year.
http://www.reuters.com/article/idUSLDE69L1SQ20101022
To play fair, in my view it is the production average for the entire year that is the least noisy stat to consider.
I am not into the monthly production figures cause those reflect subtle variations with a lot of stochastic noise.
Lets see if 2010 can produce more oil than 2005.
Agree with you entirely. The real evidence will be 2011.
I think the problem with Nordic_Mist and his buddies is that they have no good oil depletion model of their own and they will never have one. They don't teach it in their schools and never will.
Yet, we on TOD have huge amounts of intellectual capital invested in our depletion models that have both great predictive power and will eventually explain everything.
So we have the rhetorical arguments versus the dialectic. It is definitely turning into a greek tragedy.
You have MASSES of intellectual capital invested in the models. And the models are great - based on the input data that you put into them. But you all assume that there will be no more oil found in new places (such as below the salt) that could change the game. Look at the link I posted higher up here again back to the old post. Look at the curves based on the huge amounts of intectual capital and brilliant depletion models. They are just wrong. Won't you even consider the possibility that they may be wrong for the future as well?
Read the great posts by Euan Mearns one of the editors of the site with a far, far greater knowledge of the area than me. My understanding is that he consitently states that based on the megaprojects ++ there is lots of spare capacity in the system at the moment and oil production can easily be increased.
Anyway. I agree to a temporary truce until the production figures are clear.
But again: Depletion models are great for predicting the performance of existing oil-fields and known reserves. They are USELESS for predicting the future of world oil production.
ps. The problem is you have way too much intellectual capital invested in your models. And that makes it impossible for you to accept that you could be wrong.
You can get schooled on this topic if you choose to hang around here. You just have to show the intellectual curiosity and keep an open mind. Darwin paved the way in demonstrating how science advances:
Read this too:
http://www.michaelshermer.com/pseudoscience-encyclopedia/excerpt/
Nordic Mist:
Yes
The rational things to do with the time and primary resource remaining:
Slow down on consumption by allowing the development of efficiency. Efficiency is fought by the present takers of profit.
Slow down on the emission of greenhouse gasses. At least try. At least give it a nod. Fought by the present takers of profit.
Build solar, wind, and tidal power. These are presently understood. Sets a lower bound to any possible decline.
Build nuclear. Presently understood. A messy stop-gap V.S. the wolves at the door. Sets a limit to decline.
Develop the new things seen on the horizon: Artificial photosynthesis, Algae, The promises from nanotechnology.
Develop hopes implied in research: From a deeper understanding of matter, From novel means of fabrication, From pushing transmission techniques.
Yes
There seems to be time. The plateau oscillates. The final gurgling of the straw moves further into the future in seeming asymptote.
People do need to see that there is still time and resource enough remaining to act and correct our path. Otherwise, fight or flight takes over.
People need to understand that any natural energy flows developed as energy for humans to use sets limits to possible decline: insurance.
People need to step off the treadmill of exponential growth.
Yes
Reasoned compassion... Rational planning... Altruism and the end of the concentration of wealth...
Yes
Doom is a resonance with cynicism: A cynical view of the human condition.
You can see it in my writing.
Humanity is a myth.
Agree with you 95%. Just not as sure as you that we are as in such a critical position with regard to reserves. Apart from that we agree on everything.
Stanford Professor Steven Gorelick quote from here
Sweet.
I wonder if that patch of oil in my driveway is a seep? Should I shoot it like Jed did in the Beverly Hillbillies? Would that make me rich beyond my wildest dreams?
Our best hope is condensed matter nuclear. Most say it is pathological science. Others retort Pathological skepticism.
Talk about clutching at straws.
From the Professor Gorelick book ad site listed by Robey above:
And those global reserve numbers are not skewed information? That is the skewed information to top all skewed information.
Ron P.
thank you for expressing your opinion.
I understand Elwood. You really believe those fantastic OPEC numbers and take it as a personal insult whenever anyone expresses doubt about them.
Middle East OPEC fields contain magic oil. For every barrel that is pumped out another magically appears to take its place. Many have commented on this "Magic Oil". Even the IEA is aware of it. Only Elwood still seems to be in the dark.
Monbiot on Oil
But the IEA is in no position to call Saudi Arabia a liar. They simply must report the numbers that Saudi, and other OPEC members, report to them.
Yes it is my opinion that the OPEC reserve numbers are skewed. It is also the opinion of a few million other people including the IEA. But nevertheless some still believe those magic numbers. There is just no accounting for the lack of knowledge of some people.
Ron P.
i have never stated that i 'believe' the numbers, what i have said is that you dont know if aramco is overstating or understating their reserves. please refrain from making false claims about what i have said.
that is simply not true. try this experiment: calculate reserves added on an annual basis and you will see that reserves added (or subtracted) do not equal annual production.
here is an example for saudi arabia(eia's figures):
reserves are calculated as follows: re = rb -p +ra
rearranging, reserves added are: ra = re + p - rb
where:
ra = reserves added
rb = reserves stated at beginning of year
re = reserves stated at end of year
p = production
and according to the eia saudi arabia doesnt report to the eia, the numbers are from the oil and gas journal, which according to campbell is 'obtained' from government organizations around the world.
could you cut the insults ?
If you are implying that the numbers come from some place other than OPEC or the member countries then you are dead wrong. The numbers are directly from OPEC and the OPEC nations that inform the OPEC organization as to what their reserves are. This link proves that beyond any shadow of a doubt:
OPEC Share of World Crude Oil Reserves 2009
Do you really believe that the upgrades added almost annually to each OPEC countries reserves come from somewhere other than the OPEC reporting nations themselves? Give me a break!
Well hell, who was it that wrote:
Now that is an insult if there ever was an insult. And when I expressed my opinion that Middle East reserves were skewed, you replied with:
Implying of course that this was just my opinion and had no basis in fact. It was an insult pure and simple. So pot don't call the kettle black.
I happen to firmly believe, along with about 99 percent of the people who post on TOD, including the editors who have dared to express an opinion on the subject, that OPEC reserves are vastly overstated. Countless oil analysist and oil field geologists have expressed the opinion that OPEC reserves are vastly overestimated.
My opinion is by far the majority opinion of those who have examined the subject. But of those who have examined nothing and just take OPEC's word, my opinion is in the minority. In other words, it is not just my opinion but the opinion of virtually everyone who has taken time to study the subject in depth.
So Elwood, stop with the insults!
Ron P.
no, i am not implying anything, i am stating unequivocally that your claim is just your opinion.
now, how is that an insult ?
if differences of opinion amount to insults in your mind, you probably should seek professional help.
now, on the subject of my post,
here is the example for saudi arabia(eia's figures):
year end reserves are calculated as follows: re = rb -p +ra
rearranging, reserves added are: ra = re + p - rb
where:
ra = reserves added
rb = reserves stated at beginning of year
re = reserves stated at end of year
p = production
reserves additions do not magically appear to precisely replace production as you claim.
God, are you hard to get to. No one used the word "precisely" Elwood. You added that to make the argument seem absurd. So they added even more reserves in most years than they produced. That makes their reserves figures even more ridiculous.
All the other Middle East OPEC nations do the same. Their reserves just keep growing and growing and growing. Every barrel they produce is replaced with another barrel... then usually another barrel or two.
Elwood, the point is that those vast Middle East Reserves are a myth. At least that is the opinion of everyone who has studied the situation. There are an awful lot of really uninformed people who actually believe those absurd reserve figures however. You appear to be one of them.
Ron P.
7.841 gb reserves added in '08 and 3.390 gb produced. is that too precise for you ?
why is that so hard to believe ? it is the goal of every company who expects to stay in business to add more reserves each year than they produce. what do you suppose saudi aramco is up to with all the drilling rigs they employ ?
you seem to be having difficulty reading.
again, thank you for expressing your opinion.
and thank you to everyone who has studied the situation for expressing their opinion.
So leaves to choose: an opinion based on a study or not based on a study.
i've done my own study. everyone doesn't include everyone.
the "study" seems to boil down to an observation that opec raised reserves in the '80's or thereabouts. the popular conclusion is that the reserve restatement is based on quota. that may provide a 'motive', but does not address the question - were reserves understated before, or were reserves overstated after.
there are other factors to consider, and as soon as we can establish that reserves are not magically added each year to account for production, further discussion would be appropriate. heretofor, obfuscation abounds.
Ok, but there are also articles about depletion percentages of the supergiants in f.i. KSA. So their reserve growth could well be located in a lot of small oilfields without infrastructure in the desert and they will not be developed anytime soon.
ghawar is ca 54% depleted based on my analysis, 42% as stated by saudi aramco. my recovery factor for ghawar is easily substantiated based on abqaiq and upper zakum(uae).
'small oilfield' in context(ksa) can probably deliver for a few decades yet. and contrary to what some on here have claimed, i doubt saudi aramco recognizes as proven any deposits not yet deemed 'commercial'.
54% of URR, so more or less at peak production which would explain the increased drilling activity as shown with satellite pictures.
Yes, for their own use. Announced several times in the recent past: "we want to leave some oil in the ground for future generations".
Means that their reserves stay the same after 20 years of production is only because of reserves in producing (super)giants are growing because understated before. Could be so, but I wouldn't bet on it. Then you can or cannot believe in Simmons work in "twilight in the desert".
i dont dispute that, applied to ghawar arab d.
details ? i am going by rig count alone and assuming that ksa can hit a bull in the a$$ with a bowl of rice.
i dont know that i can agree with that altogether. aramco's 2009 ng reserve additions amounted to about 9 tcf gas, some of the 3gb(oil) additions included condensate and probably applies as well to the 20 years of production you cite. i don't know if saudi aramco's reserves are under or over-stated.
much of the exploration in saudi arabia has focused on paleozoics with both oil and gas discoveries.
http://eurekamag.com/keyword/q/019/qusaiba.php
i am believing 'twilight in the desert' less and less as i research the topic more and more. i don't see saudi arabia's capacity declining substantially for at least a decade.
i dont buy simmons recovery factor for ghawar arab d at all, for that would put ghawar at greater than 90% depleted.
i have already been branded a subversive, ces't la vie
I wrote it wrong, it is increased number of rigs indeed.