| A Primer on Reserve Growth - part 1 of 3 (Revisited) | The Oil Drum: Europe | A Primer on Reserve Growth - part 3 of 3 - Revisited |
A Primer on Reserve Growth - part 2 of 3
Posted by Rembrandt on October 24, 2010 - 10:48am in The Oil Drum: Europe
This post was originally written by Rembrandt in 2006.
This post is the second part in a three piece series about the phenomenon of reserve growth in already found oil fields. Insight in future reserve growth, which is often attributed to advancement in technology, is crucial in determining the peak of conventional oil production. For those not familiar with reserve growth it would be best to read part 1 first:
In this second part various scientific studies about reserve growth in the United States, the North Sea and Russia are analysed. The third part will look at the reliability of the estimate from the United States Geological Survey in their World Petroleum Assessment 2000 with respect to future reserve growth.
What can we tell from reserve growth in the United States?
The situation in the United States is quite unique in the world. The country shows the largest amount of reserve growth over time in the entire world. Soveral fields have grown ten to twenty times their original size. The cause of this huge resreve growth is the reporting practice of operators, which report proven reserves only:
"In principle, US companies are expected to follow industry guidelines that define Proved (described as having "reasonable certainty" in the SEC rules) as having a 90% probability of occurrence, but in practice it appears that their estimates come closer to the Mode value. For the last 20 years, the amount of positive revisions reported by the US Department of Energy were double the negative values, meaning that the original estimates had a probability of around 66%. That is close to the Mode value, which in fact represents what the engineers consider the most likely.
The huge "field growth" of the United States is clearly a reporting phenomenon, as only 6% of the additions over the past twenty years have come from new discoveries. The rest-of-the-world reports Proved & Probable estimates, because the industry has a greater need to know what the fields will actually deliver when they plan costly offshore facilities or pipelines to remote areas.
It is worth discussing this critical issue in greater detail. The SEC rules were formulated long ago when most US production was onshore, and required that reserves for financial purposes were restricted to those being drained by a producing well.. Such onshore fields could be placed on production as soon as the first well was drilled, meaning that the reserves grew as the field was drilled up over time, in some cases tapping subsidiary reservoirs or new pools at greater or lesser depth or in the immediate vicinity. In some cases, infill drilling was also undertaken changing the reserve estimates.
In the rest of the world, the reserves of a field are normally reported when production starts, the earlier estimates being held confidential by the company. Host governments take an interest to ensure that good oilfield practices are used to maximize recovery, and in some cases revenue. The companies accordingly have to compromise in their reporting between their general desire to under-report and the demands of the host government. For these reasons, more valid estimates are reported, although still often as much as half what the field is eventually found to deliver."(J. Laherrère, 2000)
Because US operators are obliged to report very conservative proven reserves, a huge amount of reserve growth occurs. This makes it very difficult to estimate whether reserve growth is due to technological advancement or not. It is important to know that the Energy Information Administration makes an excellent division between added contributions from new discoveries, field extensions, new reservoirs discovered in old fields and changes in the reserve estimates of a given oil field. This makes it possible to exclude the contribution from added Oil Initially in Place in estimating Reserve Growth of the United States.
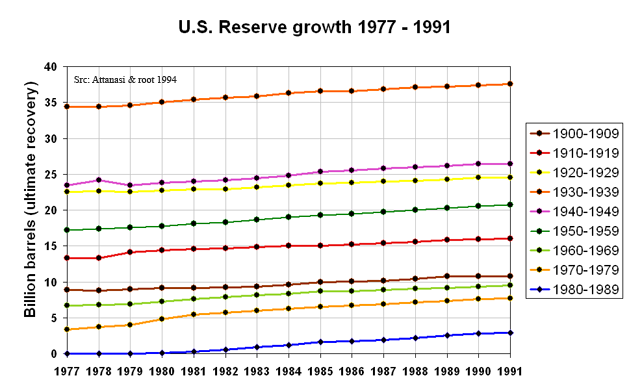
One of the main studies on reserve growth in the U.S. has been done by Attanasi and Root (The enigma of oil and gas field growth, AAPG Bulletin, 1994). The authors show that in the United States reserve growth keeps occuring, even in very old basins, based on proven reserves data from the Energy Information administration. The chart below shows the data from the article divided between oil discoveries per decade. It is clearly visible that most oil in the U.S. has been discovered in the '30s. The data from Attanasi and Root shows that reserves grew with 26 billion barrels between 1977 and 1991. More recent data from the Energy Information Administration shows reserve growth of 22 billion barrels between 1977 and 1991 and 10 billion barrels between 1991 and 2005.
Thanks to the excellent division from the EIA between reserve growth caused by growth in the Oil Initially In Place (OIIP) and growth in estimates for recoverable reserves, growth in OIIP can be canceled out from estimated reserve growth increases. However, it is impossible to tell based on the data to what extent reserve growth is caused by operator underestimates of recoverable reserves due to the practice of proven reserves reporting or due to technological advancement caused the growth in reserves. Nonetheless, the USGS concludes that technological advancement is the main driver in case of the U.S.:
"After 90 years of production, reserves continue to grow for both oil and gas. As part of their study, attanasi and Root (1994)... Although the reserve growth in common fields, as shown above, is attributed primarily to water flood as well as to other EOR techniques [enhanced oil recovery techniques], it is not large enough to offset the decline in the remaining proved oil resreves caused by the ongoing production from the existing fields....The application of EOR techniques has occured in only a limied numbers of fields to date. Therefore, there is potential for additional resreves if EOR techniques are extended to other fields. " (USGS, 2000)
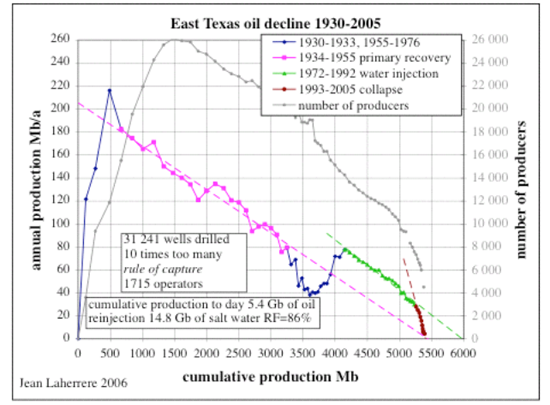
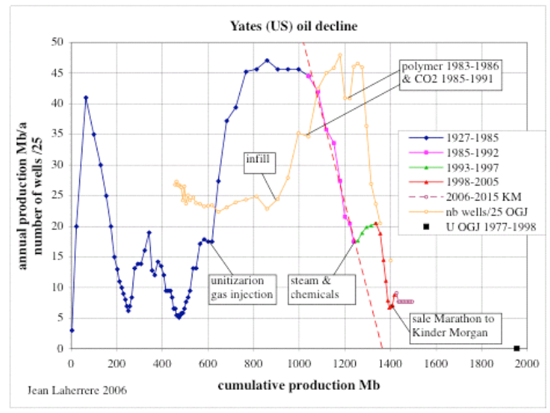
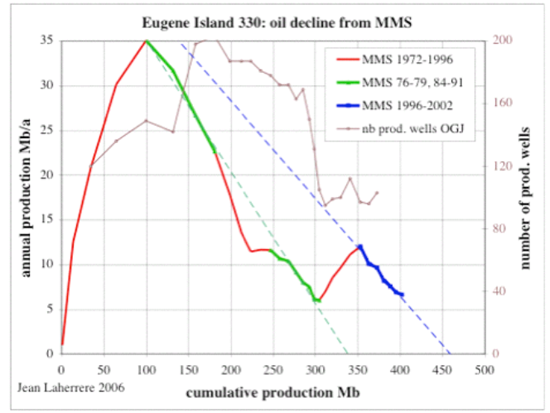
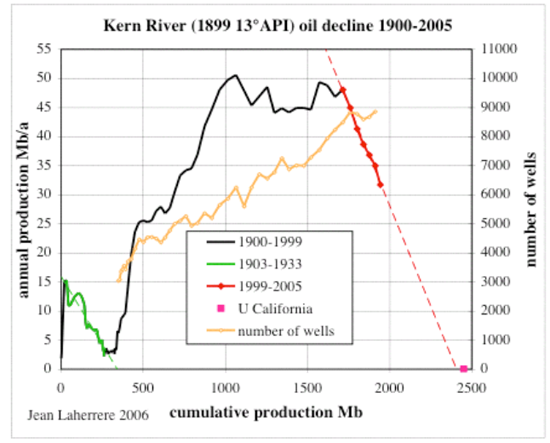
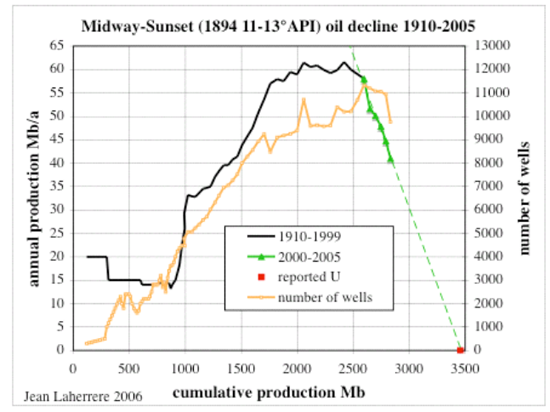
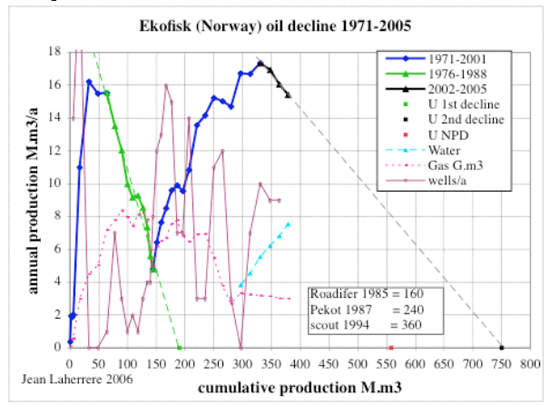
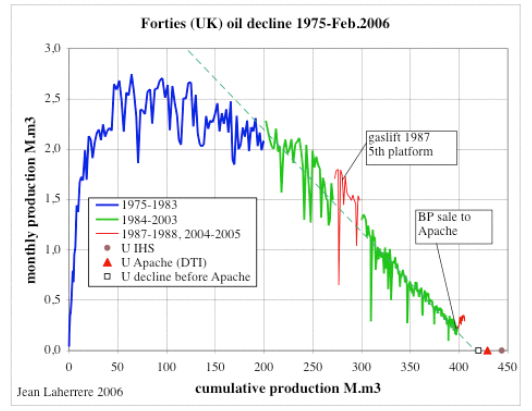
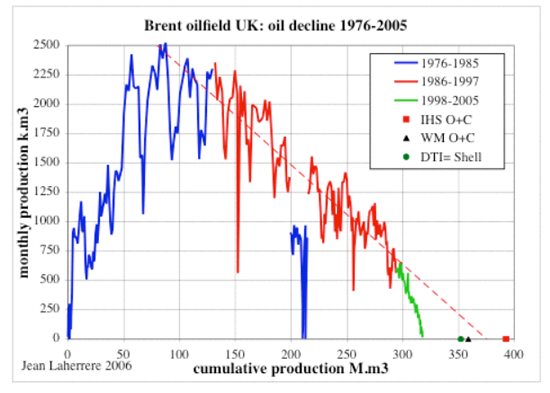
By analysing single field cases better comprehension of the influence of technology on reserve growth can be gained. Jean Laherrère has done analysis on several single fields in the U.S. and the North Sea. By plotting cumulative production versus annual production a reliable estimate can be made of the ultimate oil recovery of the field. Several of his examples are shown below:
Based on the figures and examples that are available with respect to the United States it is not so easy to reach a very clear conclusion on this oil producing region of the world. A large amount of reserve growth in the United has occured due to the practice of reporting proven reserves only. While reserve growth does occur due to technological advancement this seems to be mainly in unconventional oil fields. Several of these fields are also in the case of the U.S. added to the conventional oil reserve pool, and as such used in forecasting reserve growth for conventional oil reserves in the entire world by the USGS. This likely leads to too optimistic estimates with respect to reserve growth for the entire world.
What can we tell from reserve growth in Russia?
In June 2003 a study was published in the Natural Resource Research journal called: Reserve growth in Oil fields of West Siberian Basin, Russia by Mahendra K. Verma and Gregory F. Ulmishek of the United States Geological Survey.
This study compares reserve growth in the following 42 large oil fields in the West Siberian Basin:

The study shows the change shown in the chart below for reserves in two categories, after the discovery year and after producion starts. These categories are divided between four different field sets of the 42 fields.
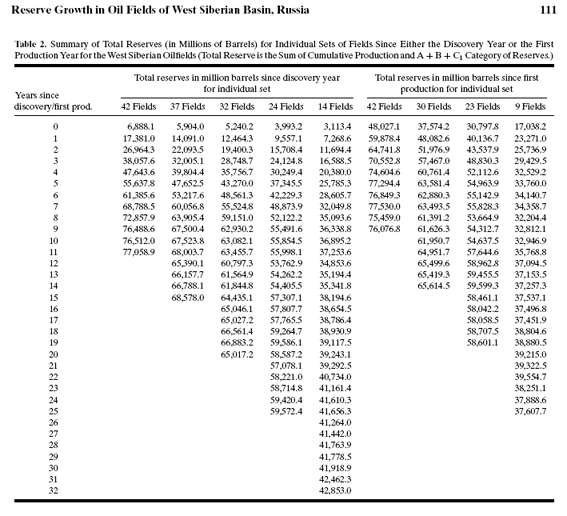
What can be observed is that reserve growth mainly occurs in the first six years after initial discovery. The most likely explanation is an underestimate of initial reserves. Furthermore very little to no reserve growth occurs in later stages of the fields production, supporting the idea that technology does not influence reserves. The authors of the study conclude:
"All the models show rapid reserve growth in the first five years, though to different levels, but the West Siberian models show gentler growth in the following years. Slower growth in West Siberian fields is caused by different reserve booking requirements and probably by insufficient investment in improved production technologies."
In a latter reference to this study the main author, Verma conclude that based on this study and assessments from the US that:
Several doubtful claims about technology are lifted towards reality by the USGS, which are not supported by their own studies. Reserve growth data from Russia does not support the idea that the advancement of technology causes reserve growth in conventional oil fields.
What can we tell from reserve growth in the North Sea?
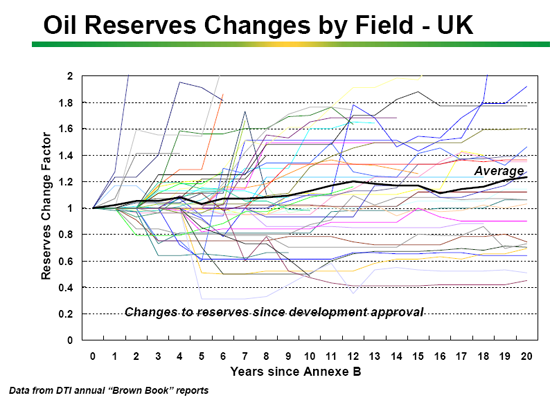
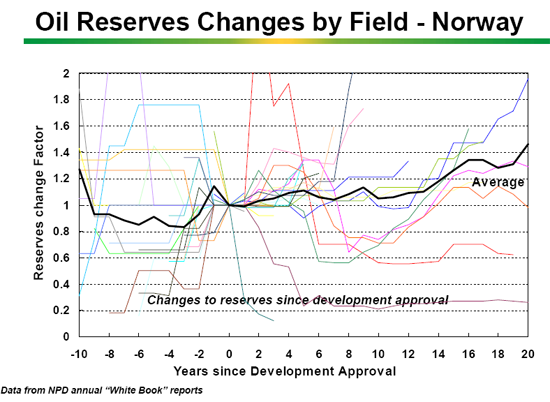
The North sea is very interesting because the historic data for the United Kingdom and Norway vary wildly with respect to reserve growth. At the same time, both regions have excellent (but different) reporting practices. An early study from MIT (1997) showed large reserve growth in Norway and small reserve growth in the United Kingdom. This was confirmed by a latter more detailed study called Characteristics of North Sea Reserve Appreciation from 2002. Both studies looked at reserve growth since first production started. The author of the second study (Watkins) concluded that:
"The size distribution of recoverable oil reserves for oil fields in the North Sea basin has much in common with that elsewhere. It is heavily skewed, with a predominance of smaller fields. The hypothesis of lognormality would not be rejected. The average field size in the UK is less than half that for Norway. In both sectors, a minority of fields account for the majority of aggregate reserves. Reserve appreciation between production start-up and the last observation year (usually 1996) for the average field in the UK was about 20%. For Norway it was close to 50%, over an average production period much the same as for the UK. This difference is marked. And given their larger average size, average appreciation of Norwegian fields approached five times that in the UK."(Watkins, 2002)
The author then goes on looking at the causes of reserve growth in the UK and Norwegian part of the North sea:
"More light on the contrast between appreciation of Norwegian and UK fields is shed by attempting to break down estimates of recoverable reserves into the two components of oil-in-place and the recoery factor, the proportion of oil-in-place expected to be recovered before shut-down. About 75% of appreciation recorded by Norwegian fields was accounted for by increases in the recovery factor, a factor averaging some to 32% at start-up, 42% in the last observation year, a 10 percentage point increase. The rest represented appreciation of oil-in-place of some 13%, on average. The UK experience was quite different. For the field sample used, the great majority of the (lower) appreciation was accounted for by increases of oil in place of 11%; the increase in the recovery factor was some three percentage points between start-up and its value in the last observation year of 47%. However, these UK results are based on information from only about one third of the 96 fields, Norway's on 29 out of 30. The UK oil-in-place analysis, then, must be regarded cautiously. Moreover, comparisons between the two countries may be bedevilled by differences in reserve reporting standards." (Watkins,2002)
"Apart from inherent variations in the physical nature of the fields, much of the difference in reserve appreciation characteristics between the two sectors has to do with the higher average recovery factors at production start-up in the UK. UK field development relied on early inception of ER [Enhanced Recovery] schemes to a greater extent than seems to have occured in Norway. Indeed, by 1996 average recovery factors in Norway still had not caught up with those in the UK."(Watkins,2002)
The first thing that we can conclude from Watkins findings is that reserve growth does occur in the North Sea. The figures he quotes, 20% for the UK and 50% for Norway have been confirmed by Francis Harper, a geologist from BP:
Most of the reserve growth in the United Kingdom can be explained by an underestimate of the Oil Initially In Place. The reserve estimate has been quite accurate over time. For Norway it appears that an underestimate of the recoverable reserves is the right explanation. The conclusion that an influence of technological advancement is the main cause of the increase in the recovery factor for Norway cannot be made from such aggregate figures.
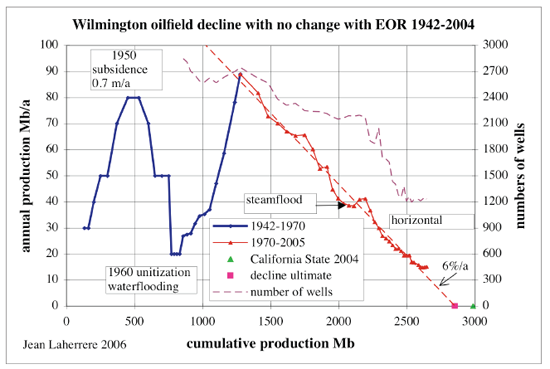
Nonetheless the IEA still uses the North Sea to propagate this view of technological advancement. After showing a chart on the increase in recovery rates in the Norwegian part of the North Sea, the IEA concludes in their resource to reserves report (2006) that "conservative recovery rate increases [from enhanced oil recovery] of 5% of oil in place adds at least 300 billion barrels to the USGS figures.". Again, just like in the U.S. the only way to get a reasonable estimate of the influence of technological advancement over time on North Sea oil reserves is to look at individual cases of fields because the available aggregate data is too imprecise. Jean Laherrère already did a comprehensive field by field study of North Sea oil fields back in 2004. A few examples of his work are shown below:
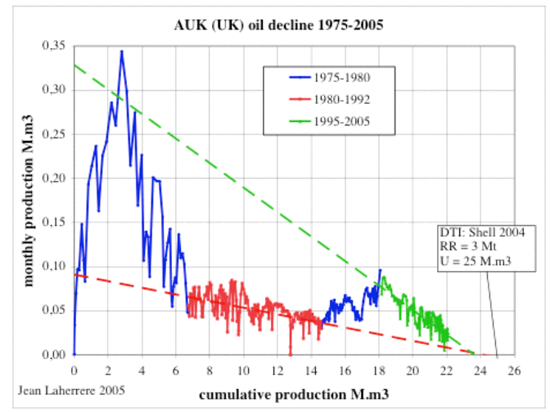
"The estimated ultimate recovery in 1988 was 93 million barrels or about 13 million barrels remaining (Trewin and Bramwell 1991). The estimated ultimate recovery in 1998 is about 180 million barrels or about twice the 1988 estimate. A major share of the reserve additions at Auk is from a large field extension (Auk North) found previously by seismic, but considered uneconomic for many years. Previous work by Shell/Esso showed Auk North production was not feasible to develop from a satellite platform or from extended reach wells from existing Auk platforms. Improvement in economics that make Auk North development now possible for Shell/Esso comes from the use of multilateral wells from existing Auk development wells and the use of electric submersible pumps deployed and retrieved on coil tubing without the need of a semi-submersible rig." (Schneider, 2000)
The expected extension (AUK noth) has, however, not come on-stream yet. The claimed incerase in the recovery factor is not visible in the graph.
While it is apparant that reserve growth is a large factor in the North Sea, it is not so clear to what cause. In the UK it appears that it was mainly due to an underestimates of Oil Initially In Place, in Norway mainly due to underestimates of ultimately recoverable reserves. Technology does not appear to have a large impact, but this could be the wrong conclusion. More study on the North Sea would be necessary to determine what the exact cause of reserve growth is.
Summarizing and Concluding remarks
1) Reserve growth occurs in all the three examined regions, Russia, the United States and the North Sea.
2) The huge increase in reserves due to reserve growth in the United States, which sets the US apart from other countries, can be explained because of the unique practice of reporting proven reserves only. This makes extrapolation of the amount of reserve growth in the United States not applicable towards countries that do report in a different manner, which are most other countries in the world. It is impossible to tell from aggregate figures what the influence is of technological advancement on reserve growth. Separate case studies show that in uconventional heavy oil fields, technological advancement plays a main role in reserve growth. In conventional fields no clear role of technological advancement is visible.
3) In Russia most reserve growth in the Siberian basin occurs in the initial phase after discovery/production in oil fields. No reserve growth occurs in later stages of lives of oil fields that have been studied. Reserve growth in Russia appears to be mainly due to initial underestimates of the oil fields potential, not to technological advancement.
4) In the North Sea reserve growth mainly occured to underestimating the Oil Initially in Place in the United Kingdom, while in Norway it was mainly due to changes in the reserves either by underestimates of reserves and/or by technological advancement. Far less reserve growth occured in the UK then in Norway. In the reserve reporting in the UK, enhanced oil recovery was already being taken into account, while in Norway this was not the case. This could explain the difference between Norway and the UK, with respect to the high increase in the recovery factor in Norway and the lower increase in the UK. However, is the difference due to the EOR techniques, or simply due to underestimating the recoverable reserves because of other reasons? And more importantly, can these effects be extrapolated to the future? If the increase in the recovery factor is caused by EOR techniques, this would probably be the case. Single oil field cases do not show an increase in reserves in later stages of fields lives due to the application of enhanced oil recovery techniques.
5) While technology seems to play a part, reserve growth appears to be mainly a function of reserve accounting. Due to more accurate reporting, reserves grow over time. Technological advancement could very well play a role in reserve growth of conventional reservoirs, but this cannot be concluded from the data available in the studies above. This makes claims that reserve growth will occur in the future as it did in the past unreliable.
Personnel
Editors
Contributors
Peak Oil Primers
Archives
- November 2010 (3)
- October 2010 (6)
- September 2010 (4)
- August 2010 (7)
- July 2010 (6)
- June 2010 (7)
- May 2010 (2)
- April 2010 (8)
- March 2010 (4)
- February 2010 (6)
- January 2010 (3)
- December 2009 (5)
- November 2009 (8)
- October 2009 (12)
- September 2009 (6)
- August 2009 (5)
- July 2009 (11)
- June 2009 (8)
- May 2009 (16)
- April 2009 (10)
- March 2009 (7)
- February 2009 (10)
- January 2009 (15)
- December 2008 (9)
- November 2008 (9)
- October 2008 (9)
- September 2008 (13)
- August 2008 (10)
- July 2008 (14)
- June 2008 (23)
- May 2008 (16)
- April 2008 (12)
- March 2008 (16)
- February 2008 (9)
- January 2008 (13)
- December 2007 (13)
- November 2007 (16)
- October 2007 (22)
- September 2007 (8)
- August 2007 (9)
- July 2007 (16)
- June 2007 (8)
- May 2007 (7)
- April 2007 (7)
- March 2007 (10)
- February 2007 (10)
- January 2007 (12)
- December 2006 (9)
- November 2006 (15)
- October 2006 (4)
- September 2006 (5)
- August 2006 (5)
- July 2006 (9)
- June 2006 (5)
- May 2006 (10)
- April 2006 (9)
- March 2006 (13)
Vital Trivia
License

This work is licensed under a Creative Commons Attribution-Share Alike 3.0 United States License.
This really supports the idea that reserve growth, as defined, is largely a statistical phenomena. So whenever you see gradually increasing reserve growth curves, you can rest assured those are evidence of Bayesian updates to the original estimates. On the other hand, when you see real jumps in the curve, those are usually due to some new technology.
So the reserve growth estimation process is one of climbing up the hyperbolic curve, with the conservative guess for current reserves being just a little beyond where one sits on the curve today.
The Saudis and others don't do this apparently, they just make their estimate as the ceiling of the curve and they leave it there; until of course they decide they need a new ceiling.
Its good to have Rembrandt's primer re-emerge because it really gets one thinking again. I was able to update my blog with a fresh analysis of what the recovery factor curves (see part I) indicate and how they come about:
http://mobjectivist.blogspot.com/2010/10/understanding-recovery-factors....
Isn't it in the oil company's interest to underestimate the reserves in order to maximize the depletion allowance and to make sure that the initial capital investment is depreciated, depleted and amortized before the oil runs out?
I would think in more concrete terms that the reserve estimate is used to decide how many rigs to deploy. It then follows a maturation process as you get better confidence then you deploy more. This is risk discounting at its most elementary:
No wonder that the reserve growth follows a hyperbolic discounting curve.
All these uncertainties play out in exactly the same way, whether it is in terms of risk or in terms of not knowing exactly how much reserves you have.
Merrill - No doubt this motivation has kicked in for some companies at some point in time. But in 35 years I've not once been pushed to lower my reserve estimates. But I've been prodded, pushed and threatened many times to apply more optimistic assumptions to my analysis (usually by a publicly traded company). More than once I've had my contract cancelled because I wouldn't sign off on a reserve report that was based upon overly optimistic estimates.
The accounting department might push for the tax benefit but I’ve always reported to the geological/engineering managers and their corporate well being always hinged on proving as much new reserves as possible…even if it required flat out lies to do so.
"THIS here is a GOLD mine!"
"This, right HERE, is a GOLD MINE!"
"Right HERE! A GOLD mine!"
"Hey! Everybody! Right HERE! A GOLD MINE!"
HAHAHAHAhahaha
Another inside joke round these parts: "MIT Economists"
Ta ta for now...
Only in the US - depletion allowances are largely confined to the US. The vast majority of countries operate under different rules. In particular, in most countries the governments own the oil reserves, and the vast majority of reserves are under control of the National Oil Companies. Foreign companies may be allowed in, but typically on a 50-50 basis with the NOC.
In OPEC, production allowables are based on reserve estimates, so companies have a strong incentive to overestimate reserves.
a choice article in today's Drumbeat:
http://arabnews.com/economy/article168394.ece
-dr
Here is a version the Kern "Hand-dug hole" story: (the link in the article was not working)
.
http://books.google.com/books?id=qseG2ESt-9AC&pg=PA19&lpg=PA19&dq=Kern+o...
.
http://www.onepetro.org/mslib/servlet/onepetropreview?id=00005017&soc=SPE
.
It looks like the last of the oil can be made to flow faster to a sudden end.
Kern is very heavy oil, and using steam can make more come out. I wrote about this a while back:
A Visit to Chevron's Kern River Heavy Oil Facility and
ern River Production Estimates versus What is Economic.
There is a huge amount of very heavy oil in the world. If steam is used, it can greatly increase the total amount that comes out from these fields-but it will come out slowly, so the total available will not be very high. And eventually it will not be economic. Kern River is reaching that point.
In my view, the limiting variable is not oil in the ground (we have a huge amount of very-heavy oil in the ground); it is capital for extraction, and how high a price the oil can sell for. If these things did not matter, we could sell oil for $500 a barrel, and use the huge amount of excess funds for capital. But this cannot happen--it implies we would be able to extract oil with an EROI <1. It also implies that somehow oil demand would stay high, despite high prices. This is not true, because people's salaries don't increase in response to high oil prices.
Early California oil : a photographic history , 1865-1940, is an entertaining book - the price was cheaper than the analogous books on TX and LA, too. Every imaginable scheme was dreamed up to get at that black gold - the discovery well for the Los Angeles City field was drilled with a sharpened eucalyptus tree trunk!
Accounts like this bring home the evolving status of oil's EROEI - roughnecks in the 30s were literally being paid beans. Wood derricks, cable tool rigs, and shallow pools, and you've got some real easy oil. Lots of blowouts, too. Still have the occasional Macondo now, but those rickety frames have been replaced by 6 miles of casing and rigs taller than skyscrapers.
Some operators are increasing their EOR efforts such as Warren Resources(2010) which is increasing floods at Wilmington and hopes to raise
recovery from 33%? to 60% OOIP.
At least they are increasing production from 500 bpd to 3500 bpd over the last 6 years and are continuing to invest in those operations.
http://phx.corporate-ir.net/External.File?item=UGFyZW50SUQ9NTY3MDJ8Q2hpb...
Frankly, it looks like their efforts are succeeding and if they are doing so at a small scale they should be larger applications.
Why would they throw good money after to bad?
Author's claim that the data doesn't support reserve growth from EOR
for the Wilmington field appears wrong. If Warren goes bust in a decade maybe not.
However if this 2006 article is wrong about EOR at Wilmington, it seems likely that its sweeping conclusion is also wrong.
The Wilmington field was discovered nearly 80 years ago, and has probably produced 90% of its ultimately recoverable reserves. The whole field is on waterflood (a secondary recovery technique), but the water cut on the producing wells is now over 95% and there's not much left for secondary recovery.
There is potential for recovering a bit more oil using tertiary recovery techniques (i.e. steam stimulation), but there is a problem in that it is under a major urban area (Long Beach, CA). The tertiary recovery methods are causing the ground to subside, and the laws in the area prohibit doing that.
The area actually looks like a northern Canadian oil sands operation, but with more people around to protest. Having seen both, I think the main difference is that there are still lots of grizzly bears wandering around the oil sands, whereas California exterminated theirs by 1924.
Realistically, there's not much extra in the Wilmington field that is producible under the current economic and legal conditions, and people who think otherwise are deluded.
Also realistically, most countries have already factored EOR into their reserve estimates, so it is unrealistic to assume that EOR will result in an increase in reserves.
This is a very good article on the subject of reserve estimates which clear something that I have been trying to point out to people for years: The rest of the world does not use the same reserve criteria that the US does.
In reality, the criteria in the US are far too strict due to SEC rules. Companies are not allowed to book reserves until they have developed them. In addition, companies are likely to be sued if they are wrong because the US has 50% of the lawyers in the world and they need something to do. As a result, companies are actually estimating reserves at the P90 level (90% chance that reserves will grow as the field is developed, 10% chance that they will decrease). This consistent underestimating of initial reserves results in the phenomenon of reserve growth in the US.
In most countries, reserves are estimated at the P50 level. There is a 50% chance that reserves will increase, and a 50% chance they will decrease as fields are developed. Most countries prefer this because the errors will average out across all their oil fields and they will have a good ballpark estimate of how much oil they have. This is adequate for government planning purposes - they know approximately how much oil revenues will be coming in (in almost all countries other than the US, governments own the oil reserves) so they can base their budgets on that. In addition, other countries have far fewer lawyers than the US, and the courts tend to shut down frivolous lawsuits before they get started. The result is that reserve estimates may not always be accurate, but there is no reason to expect them to grow (or shrink).
The real problem comes with countries where the reserve estimates are politically determined and we have no idea what they are based on. If the estimates are wrong, nobody can sue the people who made them because they are all government employees. There are no consequences for being wrong, and we have no idea whether the people doing the estimating are competent or just hired because they are close relatives or friends of El Presidente or the King. Unfortunately this category includes most of OPEC, which has most of the world's conventional oil supplies.
In the final analysis, most of the estimates of world oil reserves are basically politically determined wild guesses, but there is no reason to expect them to show a consistent pattern of growth.
that would not be the case for the nd bakken. owing to the steep decline and proverbial mythical volumetric based type curves, operators are reporting reserves estimates of about 2x what can be demonstrated by performance. even the ndic has gotten into this game as the cheering section thereof:
https://www.dmr.nd.gov/oilgas/presentations/ActivityandProjectionsWillis...
you may have to advance to page 27.
east texas is another example of excellent recovery from a high permeability, low viscosity and steep dipping oil reservoir. the operators seem to have achieved this recovery in spite of thier waterflood efforts.
i question the 86% revovery factor however. a recent presentation from the eagle ford shale claims that the eagle ford is the source for east texas oil. this may be an example of pseudoabiotic oil in action.
wasson, levelland-slaughter, seminole and hobbs fields are examples of co2 eor in the permian basin of west texas and new mexico.
aneth, rangely, salt creek, wertz, lost soilder and patrick draw are 'rocky mountain' examples. hartzog draw, bell creek and the cedar creek anticline have the greatest potential for co2 eor but are lacking developed co2 supply. elk basin and the various muddy and minnelusa reservoirs in the big horn and powder river basin and many others also have co2 eor potential and lack co2 supply.
the university of wyoming operates the 'enhanced oil recovery institute':
http://eori.uwyo.edu/
lots and lots of material there.
Likely that high values of recovery factor can occur just like super-giants or other gray swan events will occur. What the global analyses focus on is understanding how often these will statistically occur.
I realize that oil geologists concentrate on the individual cases, but mother nature applies the principles of entropy and the result becomes a statistical spread.
I am not arguing so much as trying to remind people of an alternative perspective.
i understand what you are saying, imo, mother nature has biases and predicting the recovery from an individual reservoir on a scatter - plot statistical approach would be a very poor predictor of recovery on an individual field basis. if we knew absolutely nothing about ghawar for example, the scatter - plot approach would be king.
the trouble i am having is that i know, or at least percieve that i know something about ghawar. the 'they are lying' paradigm would conform to the zero knowledge case. that is fine, but where do you draw the line, it seems to me that if you assume 'they are lying', then you have to assume they are lying about everything - no cherry picking allowed.
another of my biases is that i doubt that honest hard working saudi aramco employees are part of a grand conspiracy to decieve the world.
Agree that it's definitely a tough nut to crack. We just have to keep the interpretations flowing, both at a case-by-case low level of analysis and at the statistical high level.
Web - I've had to pop in and out so I might have missed it: have you hit on the operator dependent function in the recovery analysis? We know how unique the US recovery factors are compared to most of the globe thanks to our small independents who keep marginal fields producing long after they would have been abandoned by the big companies. I can only offer some anecdotal support but I would guess that a good 10 -20% of the recovery from Texas coastal oil fields would not have occurred if not for the sweat equity put in by the little guys. I could list the top 20 produces of oil in these old grand oil fields along the Texas coast and I doubt anyone on TOD would recognize any of the names. For instance Hilcorp is one of the premier big independents keeping these old oil fields producing.
I also toss out another anecdote that has no statistical value but does make a good point about the lack of PHYSICAL LIMITS of recovery factors. About 15 years ago I bought an old field from Shell Oil in La. Producing 500 bopd and an unmetered amount of salt water (probably at least 30,000 bwpd). A dozen very strong water drive reservoirs. Conservatively I would say they had recovered 90%+ of the OOIP. The production record was so cloudy it wasn't really possible to realize this before we bought the field (a decision I was very opposed to). The company tasked me with drilling a series of horizontal wells to increase production rates. But I knew the numbers didn't make sense so I tricked my management into letting me drill two pilot holes. The logs of both pilots holes showed virtually every reservoir to be 100% water saturated. No indication that there every any oil in these sands let alone the 50% or so residual oil saturations one might expect. If you understand log analysis the very high salinity of the reservoir water made identifying hydrocarbon saturations very easy. Another confirmation of the high recovery: several months after we acquired the field a flow line cut out on one the "oil wells". Undetected during the night, the well dumped tens of thousands gallons of production stream into the swamp. An oil pollution nightmare, right? Not at all. Not only was there no oil fouling the swamp there wasn't even a sheen on the water. And for those who don't know: it takes only tens of parts per million to generate an oil sheen. This well had been producing 100% water for years probably. Needles to say I didn't drill any horizontal wells in the field. And was, of course, routinly blamed for destroying the value of the acquisition (we were a public company) with my pilot holes. Obviously Shell produced the field well beyond its economic limits. And for good reason: the production facility was huge: 100's of thousands of tons of concrete/steel that would have cost many millions of $'s to dismantle and haul out of the swamp. So they waited for some idiots (my management) to pay them for the privilege of suffering this expense. Fortunately for my company a nearby exploratory discovery encouraged another group of idiot managers to buy the field from us.
Bottom line: there really isn't a specific physical limit to recovery from almost every reservoir IMHO. It's much more a function of economics than Mother Nature.
That will work, just increase recovery fraction in the model.
there certainly are physical limits to recovery factors: zero and 100%.
there are certainly economic limits, but what is the point ? do you have an example of a reservoir that has produced a significant fraction of ooip at say - 1 bopd,1000 bwpd.
there are also limits to the accuracy of physical properties used to estimate ooip.
I can see a process approaching a high recovery rate but at a glacially slow pace. Think in terms of a slow drift or diffusion from other areas. This could hypothetically give a higher than 100% recovery factor because the oil is migrating from areas not originally in in assessed region. But again, this is a slow process which is I think the point that ee is making.
yeah, we have cases of apparent 'pseudoabiotic' oil, eugene island is an example.
east texas is possibly another example. the texas rrc states that the eagle ford shale is the source rock for east texas.
http://www.rrc.state.tx.us/eagleford/index.php
ooip should be replaced by (ooip + oil influx).
That East Texas example is definitely an intriguing case study.
The PDF of part 2/3 is unreadable