| Cost of energy imports to UK trade balance | The Oil Drum: Europe | A Primer on Reserve Growth - part 2 of 3 |
A Primer on Reserve Growth - part 1 of 3 (Revisited)
Posted by Rembrandt on October 23, 2010 - 10:48am in The Oil Drum: Europe
This is a post by Rembrandt that was originally published in 2006.
The difference in vision between so called "optimists" and pessimists" with respect to the peak in world oil production is often caused by a view of future technological development in the oil industry. This development influences both conventional and unconventional oil production. Only a part of the oil in an oil field can be produced. It is claimed by oil companies and various institutes that technological advancement will increase the recoverable amount, thereby postponing the peak in conventional oil for several decades. In essence this means that the amount of recoverable reserve increases over time due to changes in technology, economy, insights. But also expected recoverable reserves increase over time due to past underestimates. This is why the term is called "reserve growth".
The only institute that has done exensive studies with respect to the growth of recoverable reserves over time is the United States Geological Survey. In their World Petroleum Assessment 2000, the USGS claims that between 1996 and 2025 worldwide conventional oil reserves will increase by 730 billion barrels due to reserve growth.A large amount of forecasting institutes such as the International Energy Agency and Energy Information Administration take the figure of 730 billion barrels from the USGS for granted. In addition to forecasting institutes, oil companies often claim that reserve growth is the key to postponing the worldwide peak of conventional oil production. The question is to what extent the USGS prediction can be relied upon.Two weeks ago I posted a piece about the discovery forecast of the USGS. In this second post with respect to the USGS World Petroleum Assesment 2000 we take a first glance at what reserve growth really is and what we can learn from studying the worldwide recovery factor of conventional oil fields
Because the topic is so complex, I have decided to split this keypost into three parts:
- General introduction to reserve growth, what can we learn from the worldwide recovery factor of conventional oil fields?
- What do scientific studies say about reserve growth in the United States, the North Sea and Russia?
- To what extent does the USGS study give a reliable figure for future reserve growth?
This is the first post of this three part series.
Lets start with a simple definition of reserve growth
Reserve growth is an increase in the estimated recoverable oil reserves from the moment that an oil field is discovered and/or starts producing until the end of the fields life.
In order to study reserve growth it is necessary to look at the change in estimates for recoverable reserves over time in the life of an oil field, from initial production until the time at which production seizes.
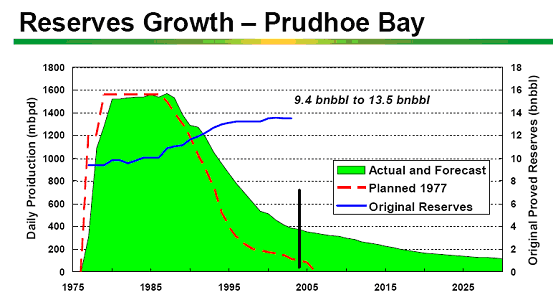
As an example of reserve growth the American oilfield Prudhoe Bay is shown below. Prudhoe bay is one of the largest fields in the world. Production started in 1975. In 1977 it was forecasted by reservoir engineers that ultimately, 9.4 billion barrels would be produced from the field. By 2005 this estimate had been increased to 13.5 billion barrels. Estimated reserves in Prudhoe Bay have so far "grown" with 4.1 billion barrels over time. Of course we won't know until Prudhoe Bay stops producing whether this will actually be the case.
The causes for reserve growth can be classified into three main groups:
1) An Increase in the Oil initially in place (OIIP), for instance by the discovery of an extension to the field or the addition of a satellite (small oil field nearby). This addition is sometimes counted as a discovery and sometimes as reserve growth. The addition of Oil Initially In Place usually does not change the recovery factor.

2) An increase in the reserves of the field due to bad and inconsistent reporting practices. For instance, due to financial reporting rules (conservative) instead of geological reporting rules (probable). The change of reserves from past underestimates falsely change the expected oil recovery factor.
3) Technological development that causes an increase in the amount of oil that can be recovered. These changes cause actual changes in the oil recovery factor.
The way in which overall reserve growth can be measured is by simply looking at past estimates for recoverable reserves and comparing those with present estimates for recoverable reserves in oil fields, countries and the world. By correcting for discoveries in a given timeframe, this comparison gives the amount of reserve growth. However there are a few restrictions that need to be taken in mind. In order to prevent comparing apples with oranges it is necessary to look at the best estimates for recoverable reserves over time (not too conservative or too optimistic). This means taking changes in proven + probable (2P) reserves over time, because this approach gives the best estimate for ultimate recovery of an oil field. This implicates that publications and databases that base themselves on proven reserves such as the World Oil, the Oil & Gas Journal and the BP Statistical Review are automatically ruled out for purposes of making reserve growth estimates!. The only sources that should be taken to study reserve growth are the IHS Energy and WoodMackenzie databases, because these are the best databases which contain proven + probable reserve estimates.
However simply looking at the changes in reserve growth over time do not tell enough for future forecasting. This is because this method does not make clear by which of the three causes reserve growth has occured. This is important to know, because as the amount and reliability of data on the world's oil fields increases it is not likely that reserve growth due to underestimates caused by bad reporting practices will be as large in the future as in the past. If reserve growth is however caused mainly by technological development, it is more likely that the trend in past reserve growth will continue. This is why it is necessary to find a way in which to measure the different types of reserve growth.
One of the better ways to do this is by looking at the change in the recovery factor over time. The recovery factor is the percentage of oil resource in an oil field that is estimated to be recoverable. As an example, if there is an oil field that contains 2 billion barrels of total resource (Oil initially in place), and over the lifetime of the field 26% is recovered (520 million barrels), the recovery factor will be 26%. Many claim that the recovery factor over time will keep increasing due to technological advancements (IEA, resources to reserves, 2005). Since type I (increase in the OIIP) does hardly influence the recovery factor, a seperation can be made between Type I and type II (bad reporting) + III (technological advancement) of reserve growth. Secondly, if the reporting practice is good enough, then reserve growth should not occur anymore due to type II since there is sufficient reliable data that can be tracked over time.
The problems with studying reserve growth
The main problem with reserve growth is that the data on oil field reserves is very bad. The best databases in the world are IHS Energy and WoodMackenzie, of which IHS Energy (formerly petroconsultants) is the largest. These databases have been gathering data for a long time, but it was not until the end of the '90s that the sum of data has become so large to be reliable with respect to looking at worldwide reserve growth. In addition there still is no reliable data for the largest oil producers with respect to recoverable reserves (the OPEC countries in the middle east and Russia). The most problematic example is the huge increase in reported oil reserves in the Middle East in the '80s. The OPEC countries claimed an increase in their recoverable reserves of approximately 300 billion barrels within the space of five years while no significant new discoveries were made. This increase is accepted for several Middle East countries even in the IHS Energy database, and to lesser extent in the WoodMackenzie database. We can count these increases as reserve growth, but to what extent are these increases reality? Is the oil really recoverable? If the claimed reserves from OPEC countries is too high, then reserve growth would also be overestimated.
The second problem is that big assumptions are made based on very little data. There are only three countries in the world for which reasonably consistent datasets are available in the public domain, Norway, the United Kingdom and the United States. The USGS study for reserve growth is based on extrapolation from the past in the United States onto the entire world. The authors claim that this is not a problem, which we will discuss in part 3.
What are the various claims with respect to reserve growth?
In essence there are two different visions with respect to expected reserve growth. The first sees technology as the main driver which will continue to cause a large increase in the recovery factor in the future and therefore a large increase in the amount of oil that will be produced. This group ignores the two other categories of reserve growth (underestimates of OIIP + bad reporting practices). Acting as if all reserve growth comes from technological development. One of the most important publications in this part is the World Petroleum Assessment 2000 from the United States Geological Survey. The USGS claims that there is potential for reserve growth potential between 1996 and 2025 for 730 billion barrels in the entire world. While the USGS in the World Petroleum Assesment 2000 did not promote the view that this was solely due to technology, in latter publications this has been mentioned (USGS,Vekma, 2000). Others who use the USGS figures also claim that there is no problem ahead with respect to peak oil because of technological development. Examples are the International Energy Agency, the Energy Information Administration and oil companies:
"Currently available technologies enable 30 to 35% of the oil in place in reservoirs to be recovered. Increasing this percentage by 10% could represent an additional 200 billion to 300 billion barrels of global reserves, or nearly ten more years of production." (Total, Corporate Social Responsibility Report 2004, page 74)
It is interesting to note that the figures cited in the TOTAL publication are flawed. Since the Oil Initially In Place is estimated to be 5500 to 7000 billion barrels for conventional oil, an increase in the recovery factor of 10% would mean an additional 550 to 700 billion barrels.
The second group thinks that reserve growth is mainly an anomaly due to bad reporting practices. Since the amount and reliability of data has increased over time, this means that reserve growth will decrease in the future. More importantly, if reliable estimates are taken for the recoverable amount of reserves and the Oil Initially In Place, one would not have to account for future reserve growth, since it would no longer occur. While technological advancement serves its purpose to produce reserves faster and more cost efficiently, the amount of recoverable reserves does not increase due to technology in the world view of the second group. One cannot simply change the geology of an oil field due to adding for example horizontal instead of vertical oil wells. The main argument used is that the largest amount of reserve growth occurs in the first six years after initial discovery/start of first production. In later years, when new technology is applied, little to no reserve growth occurs. In some very special cases reseve growth occurs seems to occur due to technology at the end of the life of several oil fields, however this is due to natural causes which change the structure of the reservoir (such as in the Ekofisk oil field in the North Sea). In nearly all cases technology only succesfully enhances early production at the detriment of production at a later stage, it does not increase the recoverable amount of reserves.
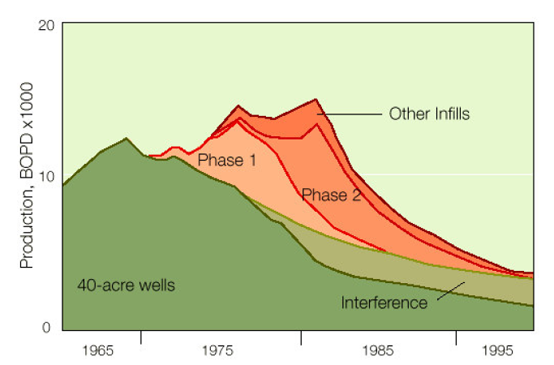
An example of this effect is shown in the chart below. We see a field at which two types of Enhanced Oil Recovery techniques were applied (phase I and II). Due to the introduction of these techniques production by conventional means dropped further then would normally have been the case (darker green). The amount of production shown in the light green part of the graph would have been produced by means of conventional recovery if EOR had not been applied. Now the same amount of oil is produced in phase I and II in red/pink. The light green slice has been added in the graph for comparison purposes. The oil wells of the applied techniques interfered with the normal production wells, causing a sharp drop in the normal production wells. On a net basis, conventional production techniques would have caused the same reserve level at the end of the fields life, but the oil would have been produced much more slowly.
The best known proponents of the second group are investment banker Matthew Simmons (Simmons & Company) and geophysicist Jean Lahherrère (ASPO France).
What does the worldwide recovery factor tell us?
By looking at the change in the worldwide recovery factor in oil fields, we can obtain a rough estimate whether reserves are increasing due to technological advancement or not. The problem is that the change in recovery factor is largely influenced by bad reporting practices and past underestimates. However, over time the data has become better so it is possible to look at what the change in the worldwide recovery factor tells us in more recent years. In general, a figure of between 33% and 37% is often quoted for the worldwide recovery factor. The reliability of such precise figures is highly doubtful as also agreed upon by the International Energy Agency:
"Numbers of this order [recovery factor of 35%] are often quoted, but rarely supported by abundant data. In fact, it is in principle necessary to look at abandoned reservoirs, estimate original oil in place (which is always somewhat uncertain) and compare it with actual cumulative production up till abandonment. Also, because such analysis looks at the past, it does not necessarily take into account current, more advanced technology practices. The data available is mainly from the United States." (IEA, Resources to Reserves, 2005, pag. 51)
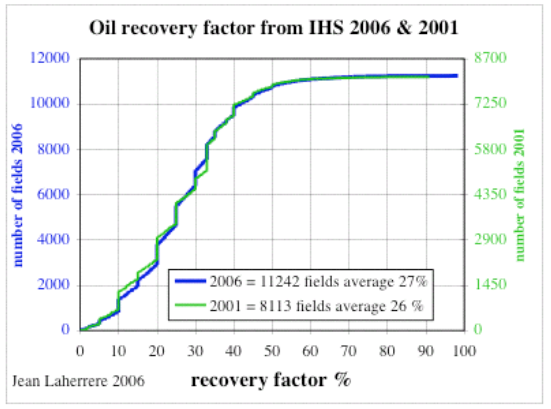
A recent chart from geophysicist Jean Laherrère from ASPO France shows that the worldwide recovery factor worldwide is more likely to be 27%. He bases this on an average of 11242 oil fields from the IHS Energy Database. IHS Energy, formerly Petroconsultants, has a considerable amount of data that is not available to the public. An earlier comparison from the IHS Energy database back in 2001 when the database was less complete showed an average recovery factor of 26%. This implies that the recovery factor has hardly changed over time. The slight difference is more likely to be explained by the increasing number of fields, then an increase in the recovery factor.
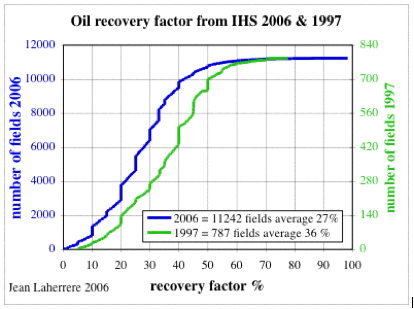
An similar graph from Laherrère comparing IHS 1997 (897 fields) and IHS 2006 (11242 fields) actually shows a large decrease in the recovery factor. This can be explained by the sheer change in fields used for comparison.
Kjell Aleklett, President of ASPO recently gave a presentation in my country in the city of Groningen. There he presented the following graph below on recovery factors which, if I remember correctly, was based on data from Statoil. It shows a current worldwide average recovery factor of 29%. A nice detail is the line which compares the claims from the Saudi's about the average recovery factor in Saudi Arabian oil fields with the average recovery factor of the world. The claimed recovery factor in Saudi Arabian oil fields appears to be unrealistically high at above 50%. There are several claims that Saudi Arabia will be able to increase their recovery factor by 10%/20% in the next decades by Saudi Arabia/oil companies and the IEA/EIA. These claims seem to be even further from reality when comparing recovery factors from Saudi Arabia to other countries such as Norway, which has an average recovery factor of 45 and hopes to get this to 50% in the coming decades.

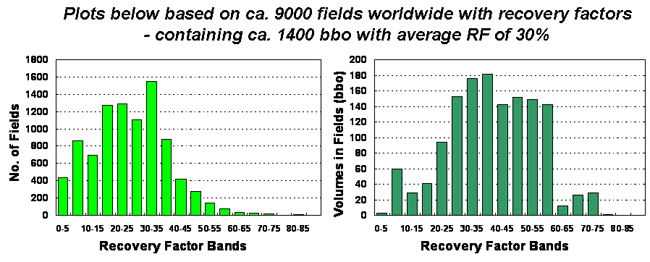
A similar value has been quoted by Francis Harper, a geologist from BP. Based on 9000 fields in the IHS Energy database he came up with an average recovery factor of 30%.
In all the time that I have studied the issue of peak oil I have only come accross one chart that compares the worldwide recovery factor in oil fields over time from the "optimists" perspective. This chart was published in the International Energy Agencies World Energy Outlook 1998, shown below. In this chart the IEA compares giant oil fields from two databases (200 giants Laherrere 1996) and (300 giants Roadifer 1987):
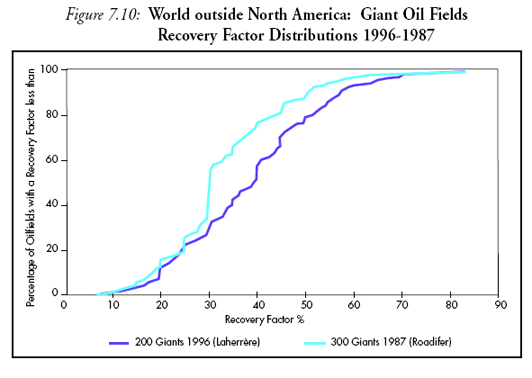
The IEA concludes from this chart that:
"Using data from Figure 7.10, it has been calculated that the average recovery factor for Roadifer's 1987 sample of 300 giant oilfields was 33.3% compared to 38.6% for Lahherere's 1996 sample of 200 giant oil fields. This analysis suggests that the average giant oilfield's recovery factor increased by 5.3 percentage points in the space of nine years, or 0.6 percentage points per annum. In the unlikely event that giant oilfield's recovery factors were to continue to increase at 0.6 percentage points per annum, then by the year 2020 the average recovery factor would be some 14.2 percentage points higher than in 1996. The average giant oilfield in 2020 would therefore have an average recovery factor of 52.8%." (IEA, World Energy Outlook, page 100)
The IEA then goes on with discussing the validity of this comparison:
"One criticism of this analysis is that it is based on two different sets of giant oil fields. In discussions with the IEA about this comparison Jean Laherrère has made the point that the comparison is between two different distributions of fields. Each distribution therefore contains different fields and one is not directly therefore comparing like with like. While this criticism undoubtedly has some validity, the sample sizes are sufficiently large for there to be considerable overlap between them. Put simply, Figure 7.10 shows evidence of giant oil fields' recovery factors improving during the period 1987 - 1996. It may no be possible to extrapolate this result to all fields."(IEA, World Energy Outlook, page 100 - 101)
The problem with this graph from the IEA is that it appears to compare apples and oranges. While looking through several of Jean Laherrère's papers I came accross an old graph which depicts his 200 giant fields set (1996) based on IHS Energy used in the IEA graph. The graph from Laherrère also shows another set of 800 large oil fields from Laherrère (1996), Roadifer's set of 300 giant fields from 1987 and a set of 3300 oil fields Laherrère (1996). The distribution in the 300 giant fields Roadifer set does not show the same difference with the set of 200 fields from Laherrère in the graph from Laherrère! When one looks in more detail, it seems as if the IEA has taken the Laherrère(1996) set of 800 large oil fields, and compared it with the Laherrère set of 200 giant fields (1996). The comparison is shown below (click for large version).
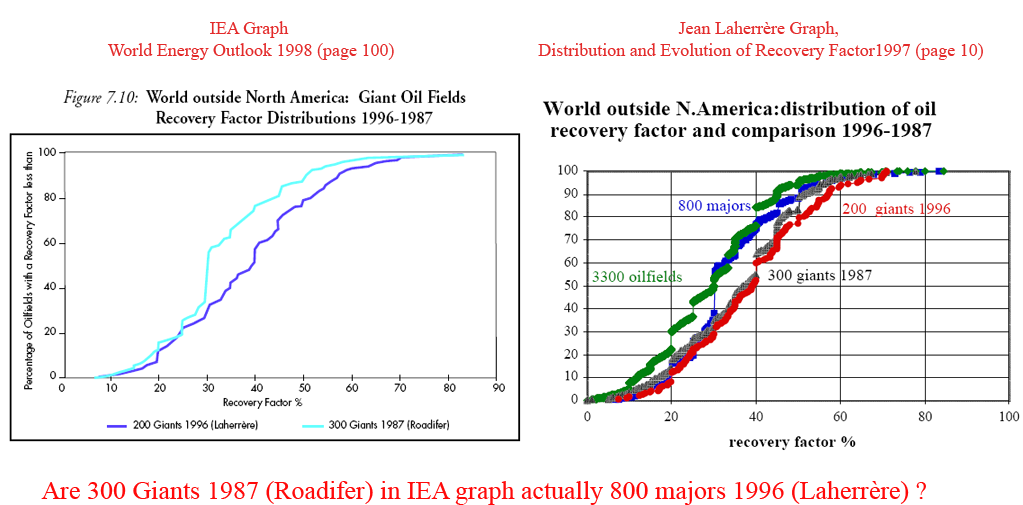
In one of these charts there is a large error. The question is which one? I tried to find out which chart shows the error, however when contacting Jean Laherrère he told me that he has lost the original datasheet from 1997, and I can't find Roadifer's data. Before this case is solved, it is hard to discuss recovery factors based on this specific graph from the IEA. To me it looks like the IEA graph is flawed.
Summarizing and concluding remarks
- The issue of reserve growth is a very complex one that needs to be studied in detail.
- The data that is available to the public is not usable at all to compare reserve growth. One needs to compare data in large reliable databases that contain estimates for proven + probable reserves over time, preferably per separate oil field.
- Claims about reserve growth based on changes in the worldwide recovery factor before the end of the 90's should not be taken seriously. This is because it is only in the last decade that the amount of data in the IHS Energy database is large and reliable enough to make comparisons.
- There are large differences in views with respect to reserve growth from technological advancement. One group sees technological advancement as the leading factor. Since technological development continues this means that reserve growth will continue in the future like in the past. The second group thinks that reserve growth is mainly an anomaly due to bad reporting practices. Since the amount and reliability of data has increased over time, this means that reserve growth will decrease in the future. More importantly, if reliable estimates are taken for the recoverable amount of reserves, one would not have to account for future reserve growth, since it no longer would occur. While technological advancement serves its purpose to produce reserves faster and more cost efficiently, the amount of recoverable reserves is not increased due to technology in the world view of the second group.
- Based on the data in the IHS Energy database it seems that the worldwide recovery factor did not increase in the past five years. This could mean that large reserve growth due to technological advancement can be ruled out. However, the time period is so short that this conclusion could be preliminary.
Personnel
Editors
Contributors
Peak Oil Primers
Archives
- November 2010 (3)
- October 2010 (6)
- September 2010 (4)
- August 2010 (7)
- July 2010 (6)
- June 2010 (7)
- May 2010 (2)
- April 2010 (8)
- March 2010 (4)
- February 2010 (6)
- January 2010 (3)
- December 2009 (5)
- November 2009 (8)
- October 2009 (12)
- September 2009 (6)
- August 2009 (5)
- July 2009 (11)
- June 2009 (8)
- May 2009 (16)
- April 2009 (10)
- March 2009 (7)
- February 2009 (10)
- January 2009 (15)
- December 2008 (9)
- November 2008 (9)
- October 2008 (9)
- September 2008 (13)
- August 2008 (10)
- July 2008 (14)
- June 2008 (23)
- May 2008 (16)
- April 2008 (12)
- March 2008 (16)
- February 2008 (9)
- January 2008 (13)
- December 2007 (13)
- November 2007 (16)
- October 2007 (22)
- September 2007 (8)
- August 2007 (9)
- July 2007 (16)
- June 2007 (8)
- May 2007 (7)
- April 2007 (7)
- March 2007 (10)
- February 2007 (10)
- January 2007 (12)
- December 2006 (9)
- November 2006 (15)
- October 2006 (4)
- September 2006 (5)
- August 2006 (5)
- July 2006 (9)
- June 2006 (5)
- May 2006 (10)
- April 2006 (9)
- March 2006 (13)
Vital Trivia
License

This work is licensed under a Creative Commons Attribution-Share Alike 3.0 United States License.
deleted duplicate
Another masterpiece by Rembrandt as he pencils in the details of reality!
For some reason that reminds of this painting by that other Rembrandt... can you tell who the optimists and the pessimists are in this painting?
http://intranet.haef.gr:61/dilaismas/024.jpg
FMagyar,
You have already spotted the problem, but please edit your first post to remove the huge image.
Cheers!
OOPS! I thought I had done so before, my apologies!
Tiny little point - it is a Gericault, "Raft of the Medusa", painted in the early 1800's. The topic, however, is somewhat representative of our current dilemma - survivors of the wreck of the French naval frigate "Meduse". It hangs in the Louvre.
Indeed it is, I was actually looking at paintings by Rembrandt but choose Gericault's painting instead and didn't change the text of my original post. That's what happens when you wake up before 4:00 AM and don't drink your coffee.
I know the feeling...interesting choice, though, since Gericault painted it without the usual references to an ideological "divinity" watching over the scene, prevalent at the time. Painted from the perspective of an observer, but drawing one into the scene.
Very clear summary, thank you! I will be presenting this conundrum to my energy class in a couple of weeks so look forward to the rest of the series and the inevitable "if I told you what I know I'd have to kill you" comments from reservegrowthrulz2 and his USGS analyst buddies.
The average recovery factor plotted in graph 6 that the Saudis project is not necessarily off-scale if one allows delivery over a very extended timeframe. So the question for TOD experts remains can AramCo really manage reservoir depletion to maintain Saudi production? And the question for IEA/EIA remains who else can build on that shaky base to boost the current global plateau to meet the needs of new customers?
Forgive me if this has been rehashed endlessly, but does boosting both recovery and flow rates specifically from SA secondary fields require proven tech beyond the sophisticated water flood drilling and reservoir visualization that they have mastered for their "oldies but goldies"?
Peak - A generalization: EOR doesn't so much tend to increase flow rates. Maybe a little bump initially. It's as much a method to decrease the decline rate. Though the details are a little foggy the KSA has increased/maintained their rate capabilities more as result of horizontal drilling than EOR. One might classifly horizontal well bores as EOR but I don't. They typically recover oil that would have been recovered by the existing wells but do so at a much higher rate. But the can also add to UUR to some degree. On the negative they also tend to decrease the life of the field. Not only that but the fall to non-economic production rates tends to be much more rapid that with vertical wells. Without the data we can't really speculate but the hz redevelopment of Ghawar could result in a much more sudden decline rate than anyone, even the more pessimistic, are now predicting.
Thank you Rockman for the generalization and observations. I lent out my Twilight in the Desert long ago, but recall little discussion of EOR in it. So comments in this thread will be interesting.
Cutting into research time, I've been reframing Web's/Kebab's Laplace transforms + other's Google Earth sleuthing of KSA field development tactics into a concise package suitable to trigger critical discussion of PO projections among a mix of science/non-science sophomores/juniors. I have time for a class or two "beyond Hubbert linearization" starting in a wk or so.
So Aramco is punching more holes to keep the flow rate up but probably to the detriment of their Ultimate.
Could off-shore and secondary developments now entering production keep them chugging along at the current flow?
peak - I've seen fair evidence that high flow rates from hz wells can reduce URR but also some cases where the decreased spacing aided URR. We don't have enough details to make a reasonable guess in the case of Ghawar IMHO.
Offshore increases might have a difficult time offsetting decline. Offshore wells are so much more expensive so you typically end up with much greater spacing/fewer wells. Also, a serious choke point offshore is processing capacity. Onshore you can expand your facilities indefinately. Offshore all you have is the space on the platform. Secondary recovery efforts (excluding hz drilling) would have a very difficult time making up the differential IMHO. I've never seen any EOR in a water drive reservoir that caused an significant/prolonged upspike in production rate. EOR can increase the profit margin by increasing net oil production even though at an additional operations expense. But the increased URR is typically stretched out over a much longer period than the primary recovery.
I'll point out again what's been previous noted as a very flawed assumption IMHO that US oil recovery is a good model for global oil recovery. Above all else the character of the companies producing the great majority of the last fraction of oil in the US is a polar opposite of most of the rest of the world. US production is dominated by small independent companies (who produce more oil than all US Big Oil combined) who, one average, produce less than 10 bopd per well from privately owned lands. I don't have the stats for the global comparison but it's easy to assume it's significantly greater than 10 bopd/well. Last time I saw number for Saudi they were doing between 3,000 - 5,000 bopd per well. Additionally most of global production is from govt owned lands.
US stripper production is very labor intensive. The smaller margins typically do not allow a large over head....they don't pay much in the way of salaries. Thus stripper operators tend to exist on the basis of sweat equity. A real life example: south of San Antonio, a husband/wife team produce about 25 bopd total from 20 wells. They pay no salaries: both handle all the operations. Might not sound like much but at current prices they are producing over $700,000/year. Multiply that by thousands of similar operations and you see why more than half of US production is attributable to these companies. More significantly, with re: URR, their field is a gravity drainage reservoir. They've made that same 25 bopd for the last 30 years. And those wells will continue to make that volume for the next 50+ years. Just a rough guess but URR for this field could easily exceed 80%. but there's a big catch: it could take about 100 years to reach that number. This is another reason using US URR can be very misleading: the time factor. This is a major assumptive error IMHO: NOC's are not going to bleed the last X% of recovery from their fields over periods of many decades: the profit margin will likely to be just to thin for them to pay for the over head. And without an independent entrepreneurial class there will be no one to take over for the NOC's.
Re: future US EOR efforts - I see nothing of any significance on the horizon as far as new technology/chemicals that will change this game to any significant degree. Every field that could benefit for EOR is undergoing EOR today and, in the majority of cases, have been for decades. CO2 EOR is often touted as a big potential source for NEW EOR. It isn't IMHO for a simple reason: if an operator has commercial access to CO2 and his field would benefit then it's already being done. And if the field doesn't have a source for the CO2 then it's not very likely it will in the future. As far as future improvements the service/chemical companies have spent 100's of millions of $'s over the decades developing better EOR. At the moment none of these companies are pushing anything that amounts to a step change. And these same companies daily offer the various technologies to the NOC's around the world. If the NOC's aren't taking advantage of these state of the art EOR methods there is a good reason IMHO: it's not worth it for them. That might change in time. But I suspect when/if that time comes the prime motivation will not be to increase exports but to satisfy internal demand. And the major fields, like Ghawar, have had EOR methods applied for decades. Some improvements could develop but again the question is how significant and, more importantly IMHO, what is the time? Increasing Ghawar URR by 15% would significant. But if it takes as long to produce that 15% (very typical of EOR methods)as it did to recover the first 50% or so than what would be the impact? I see this as the same problem the "drill, baby, drill" folks have: increased US drilling will add reserves (and that is a good thing). But the flow rate gain of these reserves won't likely be a game changer in the bigger supply/demand picture IMHO.
Hi Rockman,
A question for you. I know its impossible to know, it truly is an unknown, but how much uncertainty is there in estimating OOIP? And how much has it improved over time?
welaka - There are several levels of uncertainty. One of the biggest is well density. Geology can change rapidly over short distances so the visualization of the oil volume and its variation across the field can be great. Even in a reservoir of fairly uniform thickness OOIP will vary with the changes in porosity in the reservoir. Half the reservoir may average 30% porosity while the other half might only be 20%. But if most of you well control encountered the better quality rock you could end up with too high a OOIP. Or just the opposite if conditions were reversed.
The big improvement in mapping OOIP has come from 3d seismic. It's not as definitive as well control but sometimes it's all you have across a large area of the reservoir. So it can help but also increase the potential for error in the hands of someone with a strong prejudice: all seismic interpretation is very subject to interpreter prejudice. Why we have horse races: to prove who's opinion is correct.
But when you jump from OOIP estimates to recoverable reserve you ramp up the potential error greatly. You have to make at least a half dozen significant assumptions/estimations to calculate recovery. Each step of this process could generate a significant error. Stack 2 or 3 on top of each other and it's easy to be 20% to 30% off. Often studying the details of a fields production history can greatly refine URR estimates. But that requires a level of detail we'll probably never have from most NOC's...espectially from the KSA.
So if the estimate of OOIP is +/- 10% and that is generous, the debate over whether the recovery factor is 30 or 35% is false precision. Furthermore, a change in the recovery factor (reserve growth) from 25 to 30% is essentially unknowable.
Is this correct?
welaka - I'll answer this way: what is 2 + 2 + ?
lawyer: what do you want it to be
hooker: it's your money, sweetie...whatever
engineer: 4.0000000
reservoir geologist: 4
honest reservoir geologist: somewhere between 3 and 5.
Or try this: 35 years ago when I started my career at Mobil Oil I was assigned a newly discovered GOM field. They had drilled two expendable holes that found a number of oil/NG reservoirs. Set the platform and gave this brand new development geologist a set of reservoir maps drawn by the exploration geologists. My first 5 wells were dry holes including a twin to one of the expendable wells. The new well landed 300' from the original well that found a 150' thick NG sand. The sand was completely absent in my first well. Not only was that sand never seen productive in any other of the wells...the sand itself was never seen again. The first 5 wells reduced the reserve estimate if 125 bcf to 25 bcf and 25 million bo to 1 million bbl of oil.
Needless to say I'm the last person you want to talk to about the accuracy of reserve estimates if your looking for some optimism.
I think it is a bit of false precision as the mean works pretty well. Whatever gets exaggerated on one side of the mean is suppressed on the other side.
This is a probability density function plot from one of Ace's posts http://www.theoildrum.com/node/4153
(Rembrandt has been showing cumulative density function plots which are a bit harder to interpret for most folks Edit: I noticed that Rembrandt actually has this one)
Note that the mean represents the entire curve so it works as a kind of short-hand. The entire curve and therefore the mean will shift upward by some uncertain amount due to technology advances and better estimates as I described elsewhere.
(
webhubbletelescope posted on drumbeat:
the essential ingredient of making sense of the distribution of recovery factors is to understand reservoir producing mechanism and
management practives. a correlation of recovery factor and size, independent of producing mechanism is essentially a correlation of noise.
if you will look at the chart presented by rembrandt as graph 6, you will see data points with zero and 100% recovery. how are these data points anything other than miss-stated ooip or recovery ?
zero recovery factor ? in the oil industry this is not called reservoir, this is called dry hole.
The beauty about reasoning under uncertainty is that zero and 100% numbers are entirely likely, they are just low probability. Estimates and decisions are made by humans so they are subject to human uncertainties and misjudgements.
But the real reason for this applicability is that disorder in the physical phenomena and uncertainties in the estimate are both just probabilities so they get processed in the same hopper and you can actually reason about the numbers that you are seeing.
well if you start with the assumption that ooip is a primary determinant of recovery, then i suppose you could draw a statistical conclusion based on noise and ignore the more fundamental factors of reservoir mechanism(s)and reservoir management. of what use is that, except as an acedemic exercise ?
i think it boils down to
.
the problem i have with this particular acedemic exercise is that it has been used to try to
baffle them with bullshi....prove that ghawar is already depleted andthere is nothing we can dothe solution is to hide under the bed.All of semiconductor electronics works by statistical noise of electrons and holes that happen to jump an energy gap, so there you go.
And what is diffusion in Darcy's equations but statistical brownian motion.
If you want to call that BS, OK by me.
"All of semiconductor electronics works by statistical noise of electrons and holes that happen to jump an energy gap, so there you go."
But electrons are very different beasts from oil wells. For electrons, there is strong experimental evidence that every electron is absolutely identical to every other electron within an experimental apparatus. This experimental result has been built into the structure of that mathematical theory of elementary particles with great success. I don't see any analogous principle for oil wells. They are absolutely not identical, IMHO. The noise in semiconductors is a manifestation of non-zero temperature. That it follows some particular mathematical form is an experimental result. Not something that can be proved from theory. There are other issues in oil wells, I think.
Wrong argument. Every electron occupies a different position in state-space. They tend fill up all positions in state space given the constraints. Temperature serves as a measure of the disorder and how much they smear out in state-space. This is the theory behind Fermi-Dirac and Maxwell-Boltzmann statistics.
You look at the theory for amorphous semiconductors, things look a bit different, perhaps more like disordered phenomena such as transport in a media. The composition of the material further smears out the characteristics so you have another level of disorder to consider.
This is a comprehensive approach I have developed and I suggest you start to pick it apart at a more fundamental level:
http://mobjectivist.blogspot.com/2010/09/hydrogeology-for-dummies.html
http://mobjectivist.blogspot.com/2009/06/dispersive-transport.html
http://mobjectivist.blogspot.com/2010/05/characterizing-mobility-in-diso...
http://mobjectivist.blogspot.com/2010/05/fokker-planck-for-disordered-sy...
I have several comments and questions about enhanced oil recovery. While EOR is being practiced in a limited way today, maybe that will change in the future, especially in response to higher crude oil prices?
Perhaps we can learn something from the production of natural gas. Even just several years ago, I recall articles by Jean Laherrère in which he was predicting a fast decline in conventional natural gas production here in the US that could not be countered by unconventional gas. But along came shale gas - although there may be serious questions about the environmental impacts and cost-effectiveness of fracking when implemented in a big way (fracking may not be cost-effective at today's prices, but probably would be at higher prices). But still, fracking has been a game changer for natural gas, and the technology came on in a big way when natural gas prices spiked.
So, could today's higher crude oil prices (and future year's even higher crude oil prices) cause sufficient innovation to allow much increased recovery using new enhanced crude oil technologies? If that is the case, I would not expect the increased production to be able to meet new growth in demand, at least it may allow for a continued undulating plateau that will allow us to transition over to renewable fuels replacements and replace the existing fleet of vehicles with more energy efficient ones (due to the recent EPA/NHTSA cafe rules and expected new rules for heavy-duty trucks).
Retsel
It is not the case that EOR "is being practiced in a limited way today". EOR is already being practiced in a BIG way today, and has been for decades. As Rockman has observed, nearly every field which could benefit from EOR has at least some EOR project already happening. Additional use of EOR will certainly happen, in response to higher prices, but it won't be a step change.
I would echo that. EOR is more the rule than the exception in oil field practice today. When you start up a field, the first thing you do is put it on waterflood and/or gas injection.
The places where it is not being used are places where it probably will never be used. The political and economic climate in these places is such that they will try to produce as much oil as possible in as short a time as possible while spending as little money as possible.
The political and economic climate in these places is unlikely to get better during the lifespan of their oil fields, and in all likelihood will get worse, causing the oilfields to be abandoned prematurely.
Retsel - perhaps you mean EOR has had limited applications globally. As far as the EOR in the USA, it has been a mainstay of production for decades. Any field that would financially benefit from EOR has had such methods applied. I don't have the numbers but I would easily guess that the majority of onshore oil fields in this country have some level of EOR going on right now. Often I get the impression that some folks are trying to push the idea that we have vast reserves in known fields that could be recovered by EOR but for some unknown reason it isn't being done. Far from the reality: EOR is a major industry. Not hard to believe: oil companies make their living producing oil at a profit. If there is a proven technique that can economically improve the recovery from any field why wouldn't that operator be doing it? There is no big secret EOR method that Halliburton has been hiding from the oil companies.
Globally there may be significant opportunities for EOR. But as I outlined above there may be barriers to such efforts well beyond the technical.
Rock,
While reading this, I got to wondering, are there people in the oil patch who own/lease oil wells for which a great deal of EOR has been done successfully, but now further enhancement is needed. Maybe they decide to sell rather than make further investment in EOR. Is it possible/likely that some of them might fail to mention all the EOR that has been done to a prospective buyer?
Maybe the stories of all the opportunities for EOR waiting to be implemented have a natural and (un)believable origin.
geek - Another generality: very small operators tend to be capital poor. They can maintain current EOR efforts out of cash flow but don't usually have access to big capex. So any expensive new EOR might not be viable for them. The seller is not responsible to disclose anything about their field beyond state reporting requirements. It’s always up to the potential buyer to do any due diligence. But having said that it’s not easy to hide such efforts. The production records will normally disclose such efforts especially if the EOR had any real impact. If I get the implication of your question: no…there is not a bunch of hidden EOR projects out there. Despite what some might think there really are very few secrets in the oil patch especially when it comes to production history. For instance in Texas any operator involved in EOR classifies the project as such with the Rail Road Commission and the details are not only submitted to the state but are also available to the public. Just a guess but I doubt many other industries in the US have as much of their internal workings available to the public.
Trust me geek: there is no big hidden list of juicy EOR projects laying around like golden eggs on the ground. EOR has been the heart of small operators in the US since the 1950’s. You can get a free publication from the state of Texas describing in detail every EOR project done. And the report is updated yearly.
But let’s just put it on a common sense basis: the oil industry is highly competitive. If there was a big viable EOR project sitting out in the bushes some operator would snatch it up and go for it. Remember this is how small oil companies make their money. No big stock sales. No big bonuses coming in from the board of directors. They make their living by producing oil. Do it well and life is good, Do it poorly and your life is crap. It’s really that simple. That’s the basis of the point I made earlier about how the US producers differ so greatly from most of the other operators in the world.
Maybe the natural and believable origin of the stories of all the opportunities for EOR waiting to be implemented is a sales person.
"replace the existing fleet of vehicles with more energy efficient ones (due to the recent EPA/NHTSA cafe rules and expected new rules for heavy-duty trucks)"
We need to get people out of cars and freight out of trucks and
back onto the 233,000 miles of rail mostly lying idle or vastly
underutilized all over the USA.
Since transportation represents 70% of US oil usage, primarily
for wasteful cars and trucks, we need to run public transit which
is 10 x more efficient as much as possible.
Instead, unfortunately, while the US promoted its "cash for clunkers"
campaign, ironically, over 150 cities have had major public transit
service cuts and fare increases.
Electric cars of the current models require huge amounts of
energy and fleet turnover from any improved CAFE standards
is taking longer and longer in the Great Recession as people
stretch out their current cars as long as possible.
There was a dropoff in US autos oil consumption after the Great Recession but lately a slight uptake as major savings of another 10-20% with expanded public transit have been frittered away
by 150 cities public transit cuts.
About the mom & pop US operations vs. the large, rest of world operations:
Is this a feature of geology, or political economics, or some of both?
In other words, what's stopping the Iraqis and Saudis etc. from adapting the US model, and say in 40 years having 10's of thousands of stripper wells pumping away? Is the geology that much different (is our oil closer to the surface)? Or is the problem that there is no private sector oil business in these areas, and/or an economic/political climate that is not conducive?
Thanks in advance.
Consumer -it's not the geology. It's rather standard business practices IMHO. Or in more simpler terms: scale. It's not so much the NOC's couldn't match the US production model but that they lack the finacial motivation to do so. Small scale production requires a huge amount of skilled hands on the effort daily. Someone will have to pay for that effort. Small US operators pay themselves. I wasn't being overly dramatic when I said these folks thrive on their sweat equity. Would you expect the KSA to produce thousands of stripper wells if they are only netting a few percent of the production? That's the nature of stripper production: the vast majority of the revenue is eaten up by overhead. The US sripper producers thrive because they are paying themselves most of that overhead. More simply: if I have a few wells that produce $60,000/year how can I pay a field engineer $70,000/yr to handle the wells for me? But if I pay myself the $60,000/year to operate the wells they'll keep producing. This is why the big oil companies sell small fields to little oil companies: little no profit for the big guys.
Again, it's not that the KSA couldn't train thousands of locals to be field production engineers and turn the wells over to them. They could and it would increase URR as well as decreasing decline rates for the country. But if the KSA NOC makes little profit from the effort why would they? I can think of only one answe: to maintain enough oil production to supply internal demand. But the question remains: would they?
Then it would seem that we should expect KSA to look something like Texas in 25 years or so, if political stability can be maintained. Of course, with ELM in force that might not mean much to us in the USA.
consumer - maybe but I probably wouldn't bet lunch on it. If the KSA gets to the point where it needs 100% of its production just to meet its domestic demand then they MIGHT let small companies take over some of the smaller fields. So I’m not sure how you see the KSA looking like Texas. Please elaborate.
Well, it would seem that as oil became (relatively) more dear, KSA will find it in their best interests to keep large segments of their population employed in the service of getting more oil out of the ground. If the big wells aren't producing 10K bopd any more, why not loan your populace the money to buy up the land and work the wells. It keeps people employed and keeps the economy functioning.
Consumer - I fully agree with your thoughts as how the KSA could transition. My question was will they? And more to the point: if their social support system collapses with a major short fall in oil revenue will there be enough political stability to implament such plan?
Private Property and Infrastructure. If you own or lease the minerals and you expect to profit from producing it, then you will do it. If you can transport the production to where it is consumed and expect to profit, then you will do it. In most of the rest of the world, the governments own the minerals, the pipes and production and private citizens have no expectation of profit.
If the price of oil is rising at an annual percentage that is higher than the percentage rate of return that you can get by investing the profits from production, then the rational owner of reserves will keep them in the ground, rather than producing them.
Merrill - Even rational oil producers have bills to pay. During my career I’ve seen oil prices drop to levels far below replacement cost. But rarely have I seen an operator cut back on production. In fact, more often I’ve seen companies try to increase production even as prices fell lower. Consider Mexico: last time I saw the numbers the govt received 40% of it’s budget from oil exports. So when oil fell to $10/bbl back in the late 90’s did they cut back their production so they would reduce their budget even more? Nope. Difficult to imagine any govt ordering its NOC to reduce income that’s often used to keep its populace subdued. Works at the other far end of the spectrum: is a small ma&pa operator in S Texas going to cut back production when its revenue, already reduced by low prices, is just enough to keep the bank from foreclosing on the note he took out (using their home as additional collateral) to buy their little stripper field?
IMHO it makes more sense to cut production rates as oil prices increase: maintain a nearly constant revenue while increasing the life of their reserve base. Yep…that would go over really well with the importing countries. As a result the US might feel the need to “export some more democracy” around the globe.
The rational strategy for exporting lands would be to:
- maintain production from existing fields at the current levels with the expectation that increased global demand in the face of zero growth in supply would cause prices to rise 5 to 10% per annum.
- the 5 to 10% increase in price results in a comparable increase in foreign exchange receipts which will fund rising imports to grow the general economy and keep the population happy.
- inflate estimates of reserves in existing fields in order to keep speculators from spiking the oil prices.
- conceal any new discoveries as a state secret.
As for the reaction of the United States, this is a "boil the frog" strategy. A passive agressive behavior on the part of an export land is very difficult for the US to deal with.
"which will fund rising imports to grow the general economy and keep the population happy."
Actually a government doesn't need oil revenues to pursue a policy of pandering to the populace with imported goods. And actually it doesn't work to 'grow the general economy'. Case in point is the good ol' USA. Almost everything that people need or merely want is obtained as an import and our economy is gutted. Example, that a government doesn't need oil export revenues in order to be totally destructive to its citizens.
I think this is a great topic to revisit since no one seems to understand the main idea. Rembrandt says that "The only institute that has done exensive studies with respect to the growth of recoverable reserves over time is the United States Geological Survey." , but doesn't delve into their own analyses which were originally covered by Attanasi & Root, Verma, and others of the USGS. They essentially gave up on an explanation apart from applying some questionable heuristics.
Much of this reserve growth is purely a statistical phenomenon.
Any time you have a level of uncertainty in some measurement and all you have are indirect means of estimating, conservatively you will always have a phenomena such as reserve growth.
It is very easy to show that with a degree of uncertainty given some constraints (i.e. applying the maximum entropy principle) you will get what is called a hyperbolic reserve growth curve. Laherrere has consistently referred to this empirical observation without ever giving a derivation for it.
I have derived this a while ago in a top-level post on TOD. The basic gist in this situation is that you have an initial uncertainty of how far along searching the volume you are at and you also have uncertainty in how much to try to probe. Whenever you have two uncertainties that act as a ratio of probabilities you end up with what is called a ratio distribution. The ratio distribution for the simplest case of maximum entropy in these uncertainties gets you the hyperbolic distribution, which looks like:
U(x) = U0/(1+L/x)
where x related to the amount of perceived amount of the volume probed, and U0 is the initial estimate of the recoverable amount, with L representing he median value of volume probed. The amount of reserve growth is a conservative indication of where you are at on this curve, placed a few years in the future. It is never reported as the UO since the USA requires conservative estimates, and that is actually a bit of a WAG. Note that the middle east OPEC countries will always report U0 since all we see are step functions in the reported reserve amounts. They don't bother to give the smooth transition, quite opposite to the USA's practices. This is very important to understand the continuous transition observed by the USA versus the step functions reported by SA and others!
The key thing about hyperbolic reserve growth is that you can be anywhere on the curve. Get on it too early where you have the greatest uncertainty and it looks like you have quite a bit of growth. Later on where the uncertainty goes down, you have much less reserve growth. The thing that makes it different than an exponential profile is that it is much more gradual and actually falls into the fat-tail category of statistics. That is why people have a lot of problems with it as well, as it is not amenable to conventional statistical measures. For example, a hyerbolic curve in time doesn't have a variance or even have a concept of expected value, as in average time to reach the asymptote! It does however have a concept of URR because you have to supply some sort of initial estimate, the only issue is how slowly you will climb this curve.
The ideas behind hyperbolic growth come from laws of probability, maximum entropy, and Bayesian reasoning. The only way that it would not apply is if you can actually physically measure something by building up enough constraints. When your guiding constraints have uncertainty in themselves, you will always get hyperbolic growth.
Here is an example of one of Laherrere's hyperbolic curves. A creaming curve only differs from a reserve growth curve in that the number of wildcats takes the place of time (I am likely the only person that has pointed this out):

Note the glitches that occur when either new sources are discovered or new technologies are applied. These become new estimates in the original U0 estimate.
The beauty of this approach is that it will lead directly to the Logistic sigmoid when you apply an accelerating exponential rate to the search function. That is, you replace x with exp(rt) where r is a search rate and t is time, and you get this:
U(t) = U0/(1+C/exp(rt))
which is exactly the Logistic that King Hubbert suggested long ago. I refer to the general form that covers both reserve growth and discovery as the Dispersive Discovery Model.
There is also a way to "linearize" the constant growth reserve growth curves, analogous to Hubbert Linearization
http://mobjectivist.blogspot.com/2008/10/significant-no-hyperbole.html
(I shifted my curve slightly vertically, because it aligns exactly on top of Laherrere's hyperbolic curve)
The next step is to apply uncertainty to the U0 as well. This will get us another curve that will appear similar to the hyperbolic curve, but will actually have even a fatter tail.
BTW, you will not find this explanation in any professional textbook, as afar as I am aware. Most of the professionals still call it an "enigma", as in they don't understand it. Even Laherrere has not bothered to explain it, seeming to keep it at the level of a heuristic. This drives me crazy that no one ever tries to explain this stuff, because understanding is really the basis of making good analysis and policy decisions.
So the sad fact is that you can only find this explanation on TOD and on my blog http://mobjectivist.blogspot.com.
Really sick to my back teeth with statistical conjectures.
Declines at Thunder Horse and Ormen Lange are recent examples of statistical conjecture gone sour in the face of actual results. Dry holes in the Santos pre-salt have been hushed up. But my absolute favorite has got to be booking blue sky reserves against Soviet-era 2D and speculative trendology innocent of well control.
Well that's maximum entropy for you. The standard deviation in the case of maximum entropy equals the mean, so having much smaller than expected values is not out of the realm of possibility. No one really does this kind of analysis, and that's what makes what I am doing different than the conventional approaches (i.e. Normal distributions with tighter variances)..
thanks for this post rembrandt. i have a couple not so tiny disagreements with the post.
graph 6 makes no distinction between reservoir drive mechanisms which can cause recovery to vary from 10 to 90 % depending upon the drive mechanism and reservoir management practices and independent of size. so correlation based on ooip is meaningless, possibly worthless and certainly misleading.
saudi arabia's recovery factor of 50% is probably too low. take a reservoir with high porosity and permeability, low viscosity oil, and steep dip and you have gravity separation. water injection/pressure maintenance only assures that the oil viscosity and gas saturation will remain low or zero(think ghawar - arab d). my wag for recovery factor for ghawar -arab d is 65% . many,many examples of the > 65% recovery from gravity separation exist and you only have to look a short distance north, abqaiq, for such an example.
i don't see much need for or benifit from eor for ghawar - arab d.
It appears to me as an outsider that "technology improvement" is a little too glib. I assume that the geology and mechanics of an oil field are pretty well understood. From that would it be reasonable to conclude that it is possible to plot out a path for what will need to be done to increase recovery rates? e.g. while we may not have the capability to get a man to Mars and back today we have a pretty good idea of what technology we will need to overcome the obstacles to get there. Didn't people imagine horizontal drilling before it became practical. If I am right then "technological improvements" 10 years from now should already be in the discourse -if not on the drawing boards.
The alternative view is that technology improvement is the equivalent of punctuated equilibrium. Something dramatic comes to pass that nobody imagined and it radically alters the situation.
If the former is the case then past is prologue and the increased recovery rates and the technology should be pretty firm. If it is the latter then expecting future increases is really more akin to buying a lottery ticket.
crazy - Actually the roots of horizontal driling began over 35 years ago. It began with the development of methods to drill a well other than vertical. Offshore drilling feed this advance. Having to drill from a fixed location offshore required development of equipment and methods to drill away from the platform. The first wells were drilled out at angles of just 20 to 30 degrees from vertical. I worked on one of the first well to drill over 60 degrees from the vertical in the GOM. But the late 80's the angle had increased to 90 degreess...horizontal IOW. But that wasn't then end of the process: drilling horizontal was one thing...completing and producing a horizontal well required step changes in those technologies.
EOR is not my main area but I feel comfortable to say that no significantly changes in the methods have occurred for at least 30 years. Many improvements for sure. Better/more effective chemicals, more efficient pumps, more efficient water disposal systems. But no big radical changes. IMHO one of the big factors in any research to significantly improve EOR in the US is the lack of opportunity: the majority of existing fields have been undergoing EOR to some extent for decades. There isn't much production left to enhance. Not much incentive to build a better mouse trap if you've already eliminated most of the mices.
Actually, there has been one big advance in the last 30 years - Steam Assisted Gravity Drainage (SAGD). It allowed Alberta to move about 170 billion barrels of oil into the "proven reserves" category, which people found rather startling at the time. It's not normal to find oil through the research lab rather than through the drill bit.
However, it took about $1 billion in government research money to to make the breakthrough, which came after 70 years of prior research. It wouldn't have happened without industry improvements in horizontal drilling technology. And it's only useful for oil sands and extremely heavy oil, which only Canada and Venezuela have in large quantities.
As for conventional oil - no, there hasn't been much new in the last 30 years.
That's a good point Rocky but I my mind thermal recovery techniques are old hat so I included those in the back of my mind. Hz drilling was a big boost to thermal recovery methods for sure. But as to your point this has already made its contribution. It’s an existing methodology. My comment dealt with "what's next?". I know of dozens of fields in south Texas that could recover 100's of millions of bbls of stranded oil from insitu combustion (air injection) based on successful pilot projects conducted by Texaco in the early 1960's. It hasn't happened because the process is beyond the capabilities of the small operators that own these fields now. But the method is already on the self and ready to go...just like your SAGD.
And that's back to the point I was trying to make: beyond EOR methods we have today: what's the next big step change in EOR that might change, even to a small degree, future oil recoveries? This is where I see nothing on the horizon.
rockymtnguy posted on drumbeat:
many,many examples exist to show that recoveries of >65% are possible with reservoirs with 1) high permeability 2)steep dip 3)low oil viscosity 4)operated under gravity stable conditions. perhaps the claim can be made that the combination of 1), 2), 3) and especially 4)are extremely unusual. this is not the case for ghawar field.
i don’t disagree with your contention that the best results are obtained if pressure maintenance is started from day one. indeed, ghawar did produce for years under partial water drive and with gas flaring. however, ghawar did not get anywhere near bubble point pressure, so the loss of recovery seen in other fields with a delay in waterflood is not applicable to ghawar.
you cite 47% recovery for prudhoe bay. based on data presented in wiki, ultimate recovery is expected to be more like 52%. this a minor quibble.
prudoe bay offers a case in point to show the contrast with ghawar.
1) reservoir dip in prudoe bay is somewhat less than in ghawar.
2) viscosity of the oil in prudoe bay is higher than in ghawar.
prudhoe bay has a variable oil gravity and temperature and thus a variable viscosity. further, prudhoe bay contains 2 gb of 20 deg api gravity oil and the balance of the oil in place at prudhoe bay is closer to that of the much maligned manifa field of saudi arabia.
most importantly, the depletion rate at prudhoe bay has been almost an order of magnitude higher than for ghawar. prudhoe bay has been on production just 33 years and is already 85 % depleted. prudhoe bay has about 1000 wells with an ooip of just 25 gb, approximately the same number of wells in all of saudi arabia.
these two examples, prudhoe bay and ghawar, demonstrate the contrast between the modus operandi of public traded ioc's -vs- saudi aramco.
Heuristic--pertaining to a trial-and-error method of problem solving used when an algorithmic approach is impractical.
Web Hubble Telescope--I always read your posts because you have something very useful to say. Yet I don't understand them because I am not mathematically savvy. My education on statistics is limited to one graduate level course. From your writings, I am believing that your understanding of statistics is better than the average geologist or economist.
I am posting this rather than just emailing you because I assume that many others have the same problem. I really want to understand what you are saying. You may talk more about my concerns in your blog. If so, refers us to specific articles in your blog. You frequently talk about how frustrated you are when others use heuristics. I want to know more in lay terms about why. What are the limitations of heuristics? What can they tell you? What are the alternatives? What are their strengths and limitations? My assumption is that heuristics identify data patterns without any valid explanation for the cause of those patterns.
Your understanding of what a heuristic is spot on.
I am usually driven to what lies behind the heuristic in terms of the fundamental behavior, and especially statistical behavior.
To me, it is the only rational way of moving forward and making connections between the observations we make.
A heuristic is a fallible method of solving a problem or making a decision.
So when it fails, you have no idea of why, unless you have a fundamental understanding of how it came to be in the first place.
As a prime example, I understand deeply how Hubbert Linearization can fail because I can derive the conditions as to where it can apply.
Other people can't do this, so when it fails they shrug their shoulders and look for another heuristic.
On the other hand, I will try to reason about the premise and adjust the model to account for the different conditions.
Does that help?
Thanks for your reply. Yes, it helps. A heuristic is a description of observations without explanation. If you don't know the governing variables, you may see very different observations under different conditions from the original. When it comes to big events in complex systems, determining causation is quite difficult. Best hopes for separating signals from noise.
Take a look at Digital Signal Processing: Everything linear can be modeled with add, multiply, and delay (+, X, T-1) -or- (Sigma, X, Z-1).
The Fourier Transform allows signals to be represented as the sum of sine-waves. The Fourier can be implemented with add, multiply, and delay*.
Walsh, Hadamard, Harr: Signals can be represented as the sum of pulse-trains... just ON and OFF.
Correlators, made from +, X, and T-1, can recover signals buried deep in noise.
--> IN THE COMPUTER simulation, the linear world is made from +, X, T-1, On, and Off. Nonlinear? Just add some decisions, like >, <, and =.
So... it is all really, really simple. It should be taught in 3ed grade: Adds, Multiplys, and Delays with lines connecting them together in two dimensions make integrators, filters, sine-cosine generators (4 multiplies, 2 adds, 2 delays)... **
To make it difficult, well... the usual human tricks of using people's names is common: Fourier, Laplace, Hilbert, Walsh, Haar, Hertz... Or using Latin... ("Substantia Nigra" is my personal favorite: "The Black Stuff"... hiding from common view, at the time, the complete ignorance of the black stuff's function.) These are a type of compression: a reduction in the number of words, a short-hand. They render simple concepts as opaque to the uninitiated.
*
-or- with flames and cans:
http://physics.kenyon.edu/EarlyApparatus/Rudolf_Koenig_Apparatus/Fourier...
-or- with balls and string:
http://www.phys.cwru.edu/ccpi/Harmonic_analyzer.html
**
http://www.earlevel.com/Digital%20Audio/StateVar.html
http://www.music.mcgill.ca/~gary/307/week2/filters.html
(not the best examples of these drawings... the texts are opaque)
***?
http://www.zappinternet.com/video/kejBqeWbuR/Symphony-No9-in-E-minorop95...
Well KalimankuDenku , I don't know what DSP has to do with anything.
With Rembrandt's post as a motivation, I actually worked on a complete derivation of the Recovery Factor curves that Rembrandt showed above.
It's all in this Mobjectivist blog post:
http://mobjectivist.blogspot.com/2010/10/understanding-recovery-factors....
So for anyone that wants to understand the fundamental behavior as rdberg was pointing out, this is the way to do it. Click and read on, as I prefer not to spam the TOD comments.
It is just a fun piece of the practical arts.
In many cases, DSP combines analysis and synthesis to produce a realistic model that matches or predicts a sparsely characterized reality.
Linear Predictive Coding
Airframe control-surfaces
Yes indeed, Stults did a FFT variation of the oil shock model.
http://j-stults.blogspot.com/2010/03/uncertain-rate-in-fft-based-oil_06....
It works well except for not handling the temporal perturbations.
The IEA is making a basic error in methodology here, even if the figures quoted are valid. The 0.6% per annum increase in recovery factor is not really that at all: it is an 0.2% per annum decrease in the amount of oil left in the ground when the field is abandoned. As the amount of oil left behind decreases each year, the additional amount of oil represented by a constant percentage of that amount decreases. In other words, if we are to extrapolate anything in a linear fashion, it should be a fraction of what would otherwise be left in the ground.
According to my calculations using this method, the recovery factor by 2020 will be 41.9%, not 52.8%. Or to be more in keeping with the accuracy of the numbers we are dealing with, around 40% instead of around 50%.
That's not to admit that I believe the 1987 data is in any way similar to the 1996 data. I'm just pointing out that even if the comparison is valid, the conclusion from it about increased recovery factor is not.
I think the EOR, technology, and "rate" vs "ultimate recovery" issue is a good deal more complicated than is suggested in this discussion. It is certainly true that in many cases EOR and technoloigical advances only allow us to produce the same amount of oil faster. Rockman, in a post above has a good example of how stripper production works. In some situations very low rates can be maintained profitably over a very long times.
However, I would argue that there are many other cases where increased rate does in fact result in increased recovery. For example, at Prudhoe Bay, much of the remaining oil is in "Zone 1" (roughly the bottom quarter of the formation). Unlike the superb reservoir rocks in the upper 3/4, the oil in Zone 1 is in thin, discontinuous sands with much lower porosity and permiability. The technology of coil tubing horizontal side track wells have made it possible to produce these sands at a reasonable rate. In theory one could produce them at a much slower rate with conventional wells. However, there is the matter of maintaining a high enough rate to keep the the Alaska pipeline ("TAPS") in operation. When the rate falls below some level, TAPS will cease to operate. At that point oil which might have been produced (at a lower rate) will be left in the ground. In this situation, higher rate (due to technology) directly translates to higher ultimate production.
I believe a similar argument would hold for nearly all deepwater production. No matter how much oil is in place the rate needs to be high enough to to support the infrastructure necessary to get the oil ashore. So from a big picture point of view, to understand the rate vs recovery issue, we need to somehow separate those cases where we will ultimately recover the same oil but more slowly, from those cases where either we recover it fast or not at all.
In many cases so-called reserve growth is not a mystery because a field is not a single pool but a series of adjacent pools which a) were not identified at the time of discovery and declaration of OOIP and b) are made econokmic for development because of the infastructure installed for the first pool. Anybody who has watched the development of any one field over time could see that the named field is in fact many or several pools added to the main discovery over years. The cobined set of reservoirs usually retain a single name so that when we look back at production history we see more reserves, both recovered and in place, than were first declared. Various stages of EOR or simply more intensive drilling also raises the value of the recovered volumes. In the current oil world especially in high cost deep water plays we often see quite low levels of recoverable reserves simply because the operator sets his production levels at the most profitable, choosing to leave the rest in place. In other words, the volume produced is a financial not a geological function. When the USGS raises the potential for the Orinoco Belt for example, they are simply adjusting the recovery factor in view of expected oil prices and the application of more intensive drilling or in this caser horizontal wells. So this kind of anlayis si important but more simple than the real world of oilfield economics and geology.
In many cases so-called reserve growth is not a mystery because a field is not a single pool but a series of adjacent pools which a) were not identified at the time of discovery and declaration of OOIP and b) are made econokmic for development because of the infastructure installed for the first pool. Anybody who has watched the development of any one field over time could see that the named field is in fact many or several pools added to the main discovery over years. The cobined set of reservoirs usually retain a single name so that when we look back at production history we see more reserves, both recovered and in place, than were first declared. Various stages of EOR or simply more intensive drilling also raises the value of the recovered volumes. In the current oil world especially in high cost deep water plays we often see quite low levels of recoverable reserves simply because the operator sets his production levels at the most profitable, choosing to leave the rest in place. In other words, the volume produced is a financial not a geological function. When the USGS raises the potential for the Orinoco Belt for example, they are simply adjusting the recovery factor in view of expected oil prices and the application of more intensive drilling or in this caser horizontal wells. So this kind of anlayis si important but more simple than the real world of oilfield economics and geology.
Can we stop using the word "pool" please? Reservoirs are rocks.
avon - Actually reservoir are not rocks alone. Rocks are rocks. Oil/NG reservoirs are rocks with pore spaces in them which contain oil or NG. A field may be one reservoir or multiple reservoirs. And one reservoir may be one pool or multiple pools.
Perhaps that’s a little more techspeak then some would enjoy. OTOH some folks still think there are giants lakes of oil in the earth caused by the rotting carcass of a dead dinosaur. So using “pool” has a potential to add confusion for some folks.
In reservoir engineering terms, "pool" is an example of trade jargon:
see http://oilgasglossary.com
Exactly Rocky. Just as we know the genes of engineers are typically found at the shallow end of the pool.
Rembrandt,
You may recognize the following as a sentence from you lead article:
"If reserve growth is however caused mainly by technological development, it is more likely that the trend in past reserve growth will continue."
I recognize that at the point where you say this, you are presenting a argument that further on, you seem to reject. But can you explain a detail of the argument that puzzles me? For me 'technological development' is an ambiguous phrase. In this context is it the development/discovery of a new technology? the deployment of a recently discovered technology to a particular oil field? or something else? Depending on what is meant by technology development, the conclusion 'growth will continue' may or may not be true. Is this ambiguity something that you can explain? Or is it something that you intended to display?
"Recoverable reserves" (an economic term, not a geologic/SI term) could just as easily decrease in time due to changes in technology, economy and insights.
PDV - A valid point. I’ll put it in even more simplistic terms. There is one factor that adds to the recoverable reserve increase more than everything else combined: drilling more wells. One successful exploratory well can add more reserves than improving the efficiency of a hundred wells in a water flood. Collectively EOR projects represent very big percentage of recoverable reserves. But these projects are already in place. There will always be some marginal improvements in these fields but there is no big step change in view. IMHO there are very few fields not involved in EOR where such methods are viable. This is very true in the US but probably not as clear across the rest of the globe.
But drilling more wells can, at times, decrease recoverable reserves. As I mentioned in another post I drilled 5 dry holes in a new field discovery which resulted in an 80% decrease in RR. This was an extreme example, of course. But for the most part there is one factor the can reduce economically RR far more than everything else combined: price decline. The most obvious example is the bust in the shale gas play. During the peak of the hype some were postulating 100’s of TCF of SG RR. Perhaps true at $15/mcf. But at the current price under $4/mcf certainly not. Even the head cheerleader of SG drilling, the president of Chesapeake, last week came out with an amazing press release: the SG play is over…busted. As far as his company was concerned not only is SG over but they were going to abandon all other NG development projects and focus on oil. No amount of drilling can replace the loss of NG RR from the reassessment of the SG plays. Wanna guess how big a decrease in NG RR has occurred in just the last 18 months? Breathtaking to say the least.
Bottom line: IMHO any discussion of the validity of any RR estimate has to be broken down into the individual components. And that assessment has to be updated on a regular basis. The game can change radically over short time spans. And just a gentle reminder when talking about RR: the conversation sometimes blurs the distinction between technically recoverable reserves and economically recoverable reserves. The US has a huge reserve of technically recoverable NG. But not nearly as much when you apply the price factor. Price increases in the future will certainly increase the NG RR numbers. But we have to remember how a recession induced demand destruction can cut those RR values in a heartbeat. The time lag factor can also add confusion to the analysis. The US had a very nice increase in NG RR and production rate the last few years. Consumers are enjoying the low NG prices that resulted. But it's good to remember that the industry may well have lost money in the process when you factor in the billions spent in the SG plays. Eventually the supply/demand balance will push NG back up. IMHO I doubt the industry will renew NG drilling enthusiasticly. The bad memeories will still be close. That and the fact that the bust in NG prices pushed many of these companies out of existance.
"That and the fact that the bust in NG prices pushed many of these companies out of existance."
Rock,
I'm pretty sure I'm correct in thinking that the detailed data that goes into keeping RR estimates updated is the property of the kind of companies that are going bankrupt. It belongs to them and no one else has copies. Right?
What happens to their data? I just read a little blurb on a sign beside an antique farm tractor outside a local food market. It said restoration had been difficult because when the manufacturer went out of business, it had a giant bonfire of its design drawing in the parking lot. Analogously, will the results of a lot a expensive geological research be lost?
interesting... where did you see that Chesapeake news? I looked on their website and googled a bit to no avail. The only thing I see is that they are selling 5 year forward production at 2.95. Obviously not too bullish for NG.
Rgds
WeekendPeak
Sorry peak...thought I had saved the link. I'm guessing I saw it on aol news link but couldn't find it there. I'll check my machine when I get to the office Monday.
But unless someone made the whole story up those were his exact words. Very shocking. But Nichols, the president of Devon, made a similar statement the week before. I suppose all they can do now that the facts are becoming evident to everyone is to try to re-invent themselves.
Great. i'm looking forward to it. Alternatively, if you can send a link to
mjcomment at yahoo period com
so it doesn't get lost in all the articles
Rgds
WeekendPeak
Rembrandt, are you still doing your excellent oilwatch monthlies? I haven't seen one for a couple months.
Hi Rembrandt, good work, I have a question. In these graphs of recovery percentage versus number of wells it is not clear how the caption percentage is computed. When you get to it, this not an urgent thing.
cheersJuan