| BP's Deepwater Oil Spill - Flushing and Fishing - and Open Thread | The Oil Drum | BP's Deepwater Oil Spill - Fishing Resumes - and Open Thread |
| OPEC's Spare Crude Oil Capacity - Will it Disappear by the End of 2011? | The Oil Drum: Europe | Things Fall Apart: Complexity, Supply Chains, Infrastructure & Collapse Revisited |
Oilwatch Monthly August 2010
Posted by Rembrandt on August 20, 2010 - 10:45am in The Oil Drum: Europe
The August 2010 edition of Oilwatch Monthly can be downloaded at this weblink (PDF, 1.24 MB, 33 pp).
The Oilwatch Monthly is a newsletter that is available free of charge with the latest data on oil supply, demand, oil stocks, spare capacity and exports.
Below the fold is an executive summary, subscription form to receive the Oilwatch Monthly by e-mail, and latest graphics. For much more detail and a country by country profile, download the .pdf.
Subscribe to receive Oilwatch Monthly by e-mail
Latest Developments:
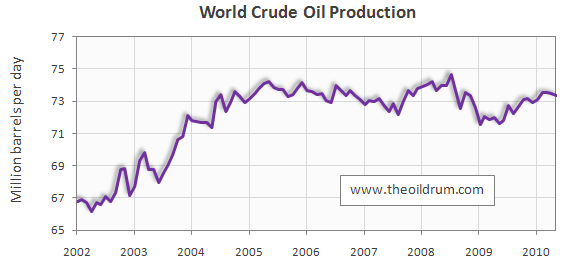
1) Conventional crude production - Latest figures from the Energy Information Administration (EIA) show that crude oil production including lease condensates decreased by 103,000 b/d from April to May 2010, resulting in total production of crude oil including lease condensates of 73.34 million b/d.
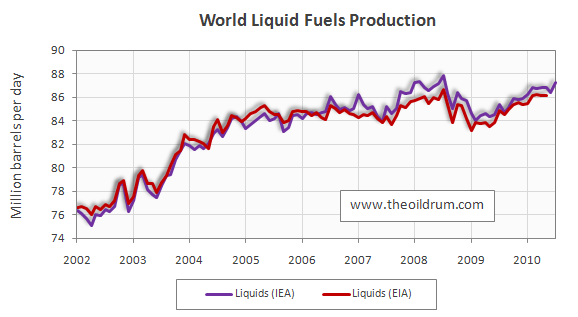
2) Total liquid fuels production - In July 2010 world production of all liquid fuels increased by 860,000 b/d from June according to the latest fgures of the International Energy Agency (IEA), resulting in total world liquid fuels production of 87.22 million b/d. Liquids production for June 2010 was revised upwards in the IEA Oil Market Report of August from 86.15 to 86.36 million b/d. Average global liquid fuels production in 2009 was 84.94 versus 86.6 and 85.32 million b/d in 2008 and 2007.
3) World oil production capacity - Total oil production capacity in July 2010 increased by 820,000 b/d from 90.16 million b/d in June 2010 to 90.98 million b/d in July. World production capacity is measured here as the sum of world liquids production excluding biofuels plus total OPEC spare capacity excluding Iraq, Venezuela and Nigeria.
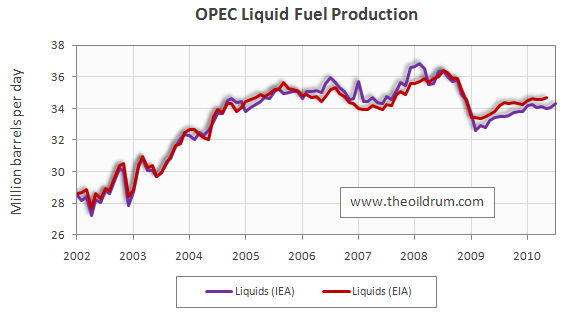
4) OPEC Production - Total liquid fuels production in OPEC countries increased by 230,000 b/d from June to July 2010 to a level of 34.28 million b/d. Liquids production for June 2010 was revised upwards in the IEA Oil Market Report of August from 33.97 to 34.05 million b/d. Average liquid fuels production in 2009 was 33.7 million b/d, versus 36.09 and 35.02 million b/d in 2008 and 2007 respectively. All time high production of OPEC liquid fuels stands at 36.4 million b/d reached in July 2008.
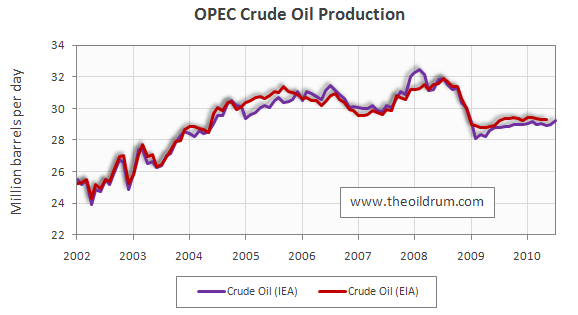
Total crude oil production excluding lease condensates of the OPEC cartel increased by 230,000 b/d to a level of 29.2 million b/d, from June to July 2010, according to the latest available estimate of the IEA. Average crude oil production in 2009 was 28.7 million b/d, versus 31.43 and 30.37 million b/d in 2008 and 2007 respectively.
OPEC natural gas liquids remained stable from June to July 2010 at a level of 5.08 million b/d. Average OPEC natural gas liquids production in 2009 was 4.67 million b/d, versus 4.47 and 4.55 million b/d in 2008 and 2007 respectively.
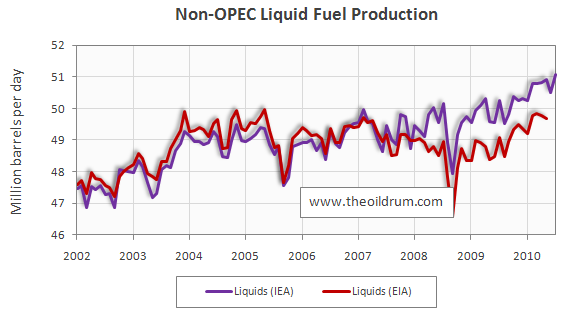
5) Non-OPEC Production - Total liquid fuels production excluding biofuels in Non-OPEC countries increased by 580,000 b/d from June to July 2010, resulting in a production level of 51.11 million b/d according to the International Energy Agency. Liquids production for June 2010 was revised upwards in the IEA Oil Market Report of August from 50.38 to 50.52 million b/d. Average liquid fuels production in 2009 was 49.67 million b/d, versus 49.32 and 49.34 million b/d in 2008 and 2007 respectively.
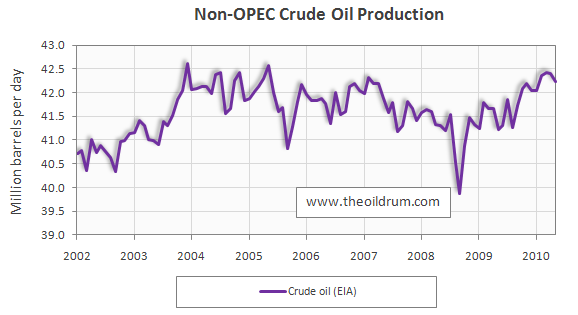
Total Non-OPEC crude oil production including lease condensates decreased by 165,000 b/d to a level of 42.23 million b/d, from April to May 2010, according to the latest available estimate of the EIA. Crude oil production for April 2010 was revised downwards in the EIA International Petroleum Monthly of August from 42.48 to 42.40 million b/d. Average crude oil production in 2009 was 41.61 million b/d, versus 41.32 and 41.80 million b/d in 2008 and 2007 respectively.
Non-OPEC natural gas liquids production increased by 8,000 b/d from April to May 2010 to a level of 3.38 million b/d. Average Non-OPEC natural gas liquids production in 2009 was 3.34 million b/d, versus 3.65 and 3.79 million b/d in 2008 and 2007 respectively.
6) OPEC spare capacity - According to the International Energy Agency total effective spare capacity (excluding Iraq, Venezuela and Nigeria) increased from June to July 2010 by 10,000 b/d to a level of 5.6 million b/d. Of total effective spare capacity an additional 3.92 million b/d is estimated to be producible by Saudi Arabia within 90 days, the United Arab Emirates 0.36 million b/d, Angola 0.26 million b/d, Iran 0.31 million b/d, Libya 0.12 million b/d, Qatar 0.2 million b/d, and the other remaining countries 0.43 million b/d.
Total OPEC spare production capacity in July 2010 dereased by 10,000 b/d to a level of 4.96 million b/d from 5.05 million b/d in June according to the Energy Information Administration. Of total effective spare capacity an additional 3.75 million b/d is estimated to be producible by Saudi Arabia, the United Arab Emirates 0.30 million b/d, Angola 0.1 million b/d, Iran 0.1 million b/d, Libya 0.15 million b/d, Qatar 0.26 million b/d, and the other remaining countries 0.15 million b/d.
7) OECD liquids demand - No update from last month
8) Chinese liquids demand - No update from last month
9) OECD oil stocks - Industrial inventories of crude oil in the OECD in June 2010 decreased to 1016 million from 1028 million barrels in May according to the latest IEA statistics. Current OECD crude oil stocks are 46 million barrels higher than the five year average of 970 million barrels. In the July Oil Market Report of the IEA a total stock level of 1041 million barrels was tabulated for May which has been revised downward to 1028 million barrels in the August edition.
Industrial product stocks in the OECD in June 2010 increased to 1440 million from 1435 million barrels in May according to the latest IEA Statistics. Current OECD product stocks are 30 million barrels higher than the five year average of 1410 million barrels. In the July Oil Market Report of the IEA a total stock level of 1417 million barrels was tabulated for May which has been revised upward to 1435 million barrels in the August edition.
Personnel
Editors
Contributors
Peak Oil Primers
Archives
- November 2010 (3)
- October 2010 (6)
- September 2010 (4)
- August 2010 (7)
- July 2010 (6)
- June 2010 (7)
- May 2010 (2)
- April 2010 (8)
- March 2010 (4)
- February 2010 (6)
- January 2010 (3)
- December 2009 (5)
- November 2009 (8)
- October 2009 (12)
- September 2009 (6)
- August 2009 (5)
- July 2009 (11)
- June 2009 (8)
- May 2009 (16)
- April 2009 (10)
- March 2009 (7)
- February 2009 (10)
- January 2009 (15)
- December 2008 (9)
- November 2008 (9)
- October 2008 (9)
- September 2008 (13)
- August 2008 (10)
- July 2008 (14)
- June 2008 (23)
- May 2008 (16)
- April 2008 (12)
- March 2008 (16)
- February 2008 (9)
- January 2008 (13)
- December 2007 (13)
- November 2007 (16)
- October 2007 (22)
- September 2007 (8)
- August 2007 (9)
- July 2007 (16)
- June 2007 (8)
- May 2007 (7)
- April 2007 (7)
- March 2007 (10)
- February 2007 (10)
- January 2007 (12)
- December 2006 (9)
- November 2006 (15)
- October 2006 (4)
- September 2006 (5)
- August 2006 (5)
- July 2006 (9)
- June 2006 (5)
- May 2006 (10)
- April 2006 (9)
- March 2006 (13)
Vital Trivia
License

This work is licensed under a Creative Commons Attribution-Share Alike 3.0 United States License.
Because of the magnified nature of the scale I think it is always interesting to place the data on the real scale, which shows the zeros and the full temporal range. See the short black segment.
Sorry if this is a bit of a PaintShop rendition, but the data range is pretty small on this scale.
Is a new world liquid fuels production peak that would surpass July 08, a distinct near term possibility?
Yes.
But is there room for say 2 years of 2% growth in the world economy, with proportional increase in all liquids?
I wouldnt bet on that.
Production is flat, the economy follows. And the other way around, economy gets a hickup and production decreases a year.
But within +/- 2 mbpd.
All liquids.
Oil price goes from 40-140 $ per barrel in these cycles. Well ok during the next 12 months maybe the 95% interval is 'only'
60-115 $ ;(
Great society we have created. Perfect for stability and a platform to create something better for the next generation. End sarcasm.
I will go out and do the best I can today in my community.
Having the graphs show the Zero point is rather useful. I was looking for it.
Yes, I don't really understand this infatuation with what I consider noise riding on top of the more important overall scaled profile. There must be a need to see this magnified view that I don't quite grasp.
Is it because people are accustomed to using the information for futures trading or anticipating the stock market? I presume that every little glitch is a chance to make some money.
Or is it climate change envy where temperature trends are studied to death? Well that requires a different context because temperatures normally occupy a narrow range and the signal is kind of hard to extract from the measurement noise.
Or are we looking for that sudden, precipitous drop that will signal us going over the cliff? Could be, but then we should just devise a metric that can display a "cliff-meter" based on the month-to-month numbers.
More likely the answer is that we continue to plot the magnified view because we can and it gives us a strawman to argue back and forth over. Word-of-the-day: tasseography
Concerning Figure 2. As late as 2007 the IEA and EIA figures tracked each other pretty closely. Now a wide disparity has opened up. There is well over one million barrels per day difference. Why is there such a disagreement between these two agencies? Which one should we believe?
Ron P.
More biofuels in IEA?
If you read figure 5, it's "excluding biofuels."
To me, it's kind of reassuring that the data sets are different. It tells me that they aren't looking at each other for data. I'd guess that the IEA is projecting an overly conservative decline rate for mature North American oil fields whereas the EIA is closer to the actual data. Just a guess...
When the current is compared to 2005, OPEC is producing 4% less crude oil with prices 65% higher. I will have to go back to my ECON 101 book to determine why this inverted relationship exists.
I'm not sure if your ECO 101 book would have an adequate explanation. Firms don't just look at prices in the market but also their own price of production when choosing how much to produce. So, the short answer is that production costs are higher (read: EROEI is lower) and therefore firms aren't willing to put as much capital at risk (read: they don't have as much capital/energy, relative to 2005, to put to work).
All of the low hanging fruit was picked long ago....
Thanks Rembrandt!
I was looking at some of the consumption graphs based on JODI that you show in Oil Watch Monthly.
EU-27 consumption seems to continue dropping:
So does Japan's:
China's consumption is rising, but the new peak may be = to the old peak:
India's consumption is rising, but from a much smaller base than China.
OPEC's consumption continues to rise:
These consumption amounts seem to track well with how well the countries are doing economically. The US's consumption seems to have picked up recently. We will have to see how well that holds up --hiring numbers seem to be off now, and diesel use seems to be down recently.
JODI data for June is now avalible: http://www.jodidb.org/WDS/TableViewer/tableView.aspx?ReportId=2413
China definitely reached a new peak in June.
Thanks Pollux. Looking at the Jodi numbers it jumped out at me the tremendous difference between what they say Algeria produced and what the EIA says Algeria produced. I have no idea why I had not noticed this before. Anyway I decided to check with OPEC's Monthly Oil Market Report data, which I keep a spreadsheet on, and the EIA numbers.
Keep in mind that the OPEC numbers are crude only while the EIA numbers are C+C. So the EIA numbers should be about 10% higher than the OPEC numbers. The extra 10% being condensate. But what I found was the same thing I noticed in the Jodi numbers, the EIA numbers for Algeria off by a whopping 42 percent. That is beyond all reason.
Bots sets of numbers are for May 2010 in thousands of barrels per day.
Notice that the average difference is 10.31 percent, just about exactly what would be expected when condensate is added to the mix. But how can the EIA's figures for Algeria be so far off from what everyone else is saying? The Qatar numbers are strongly suspect as well.
Every day I seem to find some reason to have less and less faith in the data the EAI produces.
Ron P.
But Algeria do produce a lot of condensate: http://www.eia.doe.gov/emeu/cabs/Algeria/Oil.html
EIA (IPM) Table 1.2 excludes condensate: http://www.eia.doe.gov/emeu/ipsr/supply.html
Pollux, thanks for your input. I guess Algeria produces a lot more condensate than I thought. I guess that is also the reason that Qatar produces so much condensate. That is, they have mostly natural gas therefore produce a lot more condensate than most folks.
There is something wrong with your Jodi link above. It gives totally the wrong numbers.
Compare this on:
http://www.jodidb.org/WDS/TableViewer/tableView.aspx?ReportId=2411
With the one you posted:
http://www.jodidb.org/WDS/TableViewer/tableView.aspx?ReportId=2413
The only difference is the last digit but there is a lot of difference in the numbers. The first link gives the correct numbers. The link you posted gives totally bogus numbers.
Ron P.
The first link is production (ReportId=2411) and the second link is demand (ReportId=2413):
http://www.jodidb.org/wds/ReportFolders/reportFolders.aspx?sCS_referer=&...
Oh, sorry I did not notice that. I just looked at Russia and saw they had a zero and knew that could not be right. Then I looked at China and saw that number??? I did not even realize that they Jody produced demand figures.
Thanks, Ron
These consumption amounts seem to track well with how well the countries are doing economically.
I see a modest level of correlation: especially for China. OTOH, Germany's economy is growing strongly, while oil consumption is falling. Japan's economy is flat, while oil consumption is falling fairly sharply. US GDP fell to the level of spring 2007 and started growing again, while US oil consumption is still well below spring of 2007, and has only grown slightly. We see this in other OECD countries, like France: OECD countries overall are showing modest economic growth, while OECD oil consumption is falling.
I don't see a very good correlation overall.
It would be useful for someone to quantify this, if they had a bit of spare time to do so. They might want to include some controls for comparison, like electricity, copper or concrete.
As it happens I have a chart ready, and compile data on nations when the chance arises. Here's Japan:
Average YOY change 2004-2008:
Compare France over the same time period:
Nothing like the reductions Japan shows, and their economy did better. I agree that this requires much more detailed study, but breaking consumption down into separate streams is a good start. There have been detailed studies on the correlation between GDP and oil, too, don't have time at the moment to fish them out.
Nothing like the reductions Japan shows, and their economy did better.
Yes, we can expect that there will be simultaneous trends: one trend in which oil is being replaced by substitutes or reduced by efficency improvements, and another in which variations in GDP cause variations in economic activity (transportation, etc) which causes changes in oil consumption.
If we're looking at two countries which are working to reduce oil consumption, but one has higher economic growth, then we might see the kind of thing you're talking about. Eventually, of course, oil will be replaced entirely by substitutes, and the partial correlation will end. A good example is electrical generation, which went from 20% oil in the US in 1979 to .8% oil in the present. 30 years ago rising GPD would have increased electrical consumption, and that would have increased oil consumption. Now, that no longer happens. Eventually the same will happen in other sectors.
There have been detailed studies on the correlation between GDP and oil, too
There's the study by Ayres, which found that primary energy accounted for 13% of growth in GDP.
Such study would have to be done carefully: it would have to look at the difference between periods where GDP was the independent variable, and oil consumption followed GDP, versus periods where changes in oil supply affected GDP.
There was a study by the Philadelphia Fed which found a one-time 2% reduction in GDP from a 10% reduction in oil consumption. source.
Maybe because France is networked (through its geography) to the rest of Europe it can keep an economy going on less oil. People come and go over the borders, the same person crossing back and forth maybe every day, to trade.
Japan is an island and exports/imports are expensive to ship in and out.
Recently there have been a lot of MCDonalds shutting down in Japan (600 out of 3000 and mostly the drive-in kind where motorists were main customer. The ones that are left are in the cities and big train stations geared towards pedestrians). All the paper, plastic, the food from far-flung networks---it was a cost nightmare and the restaurants couldn`t pass along the costs to the (broke) customers so "sayonara". Some of the shut-down MCDonalds were there for 20 years, ever since the bubble burst and people looked for low-cost fast food. If you`re wondering why oil use is decreasing here, look no further than the shut-down McDonalds!
I think the recent French experience with MCDonalds is quite different. McDonalds is doing OK there. Maybe they can get food from nearby countries where costs are lower. Maybe their customers aren`t quite as broke as the ones here.
Check out the McDonalds in your country as a bellwether of PO. When the McDonalds start to shut down some stores, check where in the country they still operate. Have fun with it. I am!
I remember reading that the young in Japan are completely getting away from cars. They don't even get driving license anymore. Given the paucity of parking, that makes sense.
That's the theory, anyway.
Bioplastics are an obvious poster child; but even they have a long way to go:
And how about substitutes for something like asphalt? Nix on the concrete, let's make that carbon neutral. Hell, they may have bioconcrete for all I know. Any one of these could make for a detailed and interesting article here; figures that Big Gav would be the one to cover those bioplastics: The Oil Drum: Australia/New Zealand | Bioplastic - Better Living Through Green Chemistry ? From late 2008.
And of course if we move away from oil in transport hydrocarbons can suffice for lower value products like asphalt for a long long time.
My own calc gives 2.46 mb/d used for power generation in the top 10 countries alone. Mean to have a dedicated article on that ready sometime, it's quite the dark horse in the consumption sweepstakes, as you state.
Making the 2bn tonnes of cement used globally every year, for concrete and other things, pumps out 5% of the world's CO2 emissions - more than the entire aviation industry.
A new cement has been developed, which consumes rather than produces CO2.
http://www.guardian.co.uk/environment/2008/dec/31/cement-carbon-emissions
Good discussion and charts of US crude grades and gasoline stocks today
http://ftalphaville.ft.com/blog/2010/08/20/320156/nobody-%e2%9d%a4-gasol...
Rembrandt,
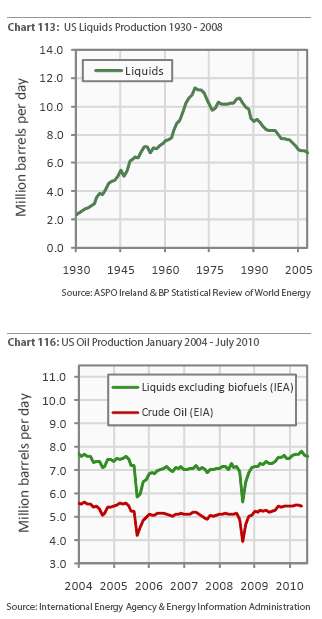
Chart 54 is still incorrect. As we discussed earlier, we see in charts 54 and 116 that the drop in US imports should be much larger.
Hello,
Is the yearly production peak still 2005?
Thanks. François
No.
http://www.consumerenergyreport.com/2009/03/10/the-2005-peak-falls/
To be fair to Kenneth Deffeyes he was referring to conventional oil, so the figure is much lower than the aggregated figure quoted.
Conventional oil is what we're talking about here.
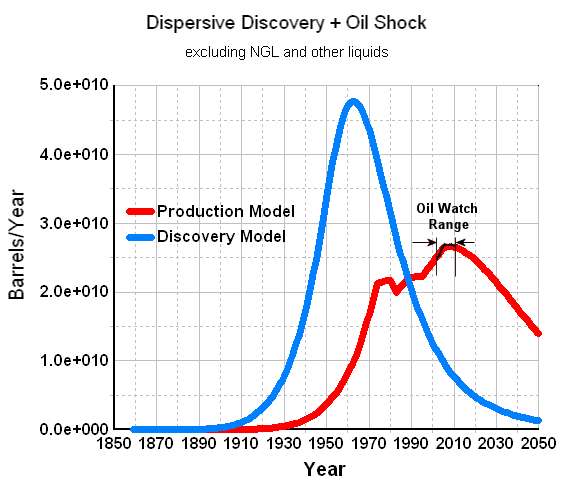
Based on the work I have done applying discovery data, I used to routinely get a 2004-2005 date but this did not have any allowance for future discoveries and reserve growth. The discoveries always stopped at the present date. Sam Foucher had some ideas with the hybrid shock model which corrected for this. But when I came up with and started to apply the dispersive discovery model to extrapolate for future discoveries, you could really explain the peak moving beyond 2005 to the curve shown at the top of the comment thread.
Note that I tend to use only conventional oil in the model, in that prior discovery estimates are only available for conventional.
Yet, as we are seeing, the peak is sufficiently rounded and the fluctuations big enough that trying to pin the date down to an accuracy better than a few years will only be possible in hindsight.
Note that I tend to use only conventional oil in the model, in that prior discovery estimates are only available for conventional.
Well, perhaps you should modify the raw data upon which your model depends?
Rice University lists Standard Oils discovery well in 1935 for the Orinoco.
http://cohesion.rice.edu/naturalsciences/earthscience/research.cfm?doc_i...
The USGS has done the recoverable size.
http://pubs.usgs.gov/fs/2009/3028/
Considering its size, it will do for starters. I'm trying to see how many other heavy oil accumulations have both discovery dates and recoverable sizes done to a reasonable standard or another, I can generally find estimates of the sizes but not broken down by discovery year, at least in publicly available information.
A good analogy is to capture the distribution of water body sizes and compare against oil reservoir size distributions. What I have found is that the size of fresh-water lakes follows very precisely the same power law as crude oil reservoirs. OTOH, salt-water lakes or seas have a completely different distribution with the average size much higher. But do we or should we include salt-water with the fresh-water when doing the book-keeping? I wouldn't, and thus wouldn't include Orinoco, oil sand, or any of the other reservoirs when counting conventional sizes.
Yet if we do have the discovery dates and size data on these, that's good to know.
But do we or should we include salt-water with the fresh-water when doing the book-keeping?
That would depend on the question being asked. If the question is, "which ones can a human jump into and drink?" the answer is just fresh water. If the question is "which ones are available for watergoing transport" we count both.
In the case of oil, the answer is relatively easy, everything with a viscosity less than 10,000 cp is in as oil production. Greater than that and its more of a mining operation. Unfortunately, even with that standard definition of flowing oil, the mining operations will still matter. Heck, one day the conversion of hydrates into natural gas into syncrude will matter. I haven't even framed out how to calculate a future oil production rate from that yet.
Classification is the key to entropic modeling. The conditions for a a salt-water lake to form must be vastly different than for fresh water, otherwise we would see many more salt-water lakes. And they are usually fairly large which supports the notion that they require a different model classification. Same thing goes for the more unique oil formations, such as Orinoco or the tar sands. Why don't we see many more of these kinds of formations? Yet we see tens of thousands of conventional crude oil formations. That is the process of logical modeling, asking these kinds of questions.
Same thing goes for the more unique oil formations, such as Orinoco or the tar sands. Why don't we see many more of these kinds of formations?
In the case of the Orinoco, its because its near perfect geology. Outstanding source rock, the Caribbean plate coming along in the right spot, lots of geologic ability for the oil to run updip, traps along the way, and presto, thousands of square miles of oilfield and not just the Orinoco but other conventionals to the north. I am not as familiar with the geology of the tar sands, and I generally exclude them on the grounds that they are more mining than standard oil production anyway. Same as the oil shales in the Rockies. My feeling is we do see these Athabasca like formations around the world, just not in the same size class as Alberta. Yet.
I have never tried to estimate the likelihood of an oilfield of this size within explored basins, my personal concept would be that they are unlikely. This idea only applies to mature basins, so it excludes Africa, the Arctic and Antarctic, chunks of Russia? Give or take.
The real question when it comes to future oil production rates (not gas) will probably be less and less related to conventional discovery but more and more the changes in recovery factor in conventionals with the application of technology, the scale of unconventional development, and any desire to begin full scale conversion of natural gas to syncrude because of the value difference between the two forms of fuel. The less that oil (liquids) production depends on even the limited discovery curve you use, the less any prediction based on it will have even a chance to be meaningful.
To continue my analogy, Orinoco is like the world's interconnected salt-water ocean. We know that the ocean formed as a unique case and it does not fit into any category for statistical purposes. The entire ocean's basin is due to its perfect geology, being the region of low interconnected elevation. We know that another ocean doesn't exist and so it makes a complete statistical category of rank 1. If I included the ocean on the power-law distribution of water-body sizes, it would cause the plot to wildly diverge. So is that fair to not count it? Does the ocean classify as an outlier, black swan, or simply different and not applicable.
Same goes for Orinoco in some fashion. Like the ocean's geological properties, something about it makes it different than the tens of thousands of other bodies.
The lognormal distribution (or whichever skewed distribution you might prefer) of field sizes on this planet is so skewed that it implies by its very definition that the 1 in a 10,000 case can have an effect on any information, model or effect derived from this particular population. An effect large enough that this type of exclusion negates the value of any work based upon the overall population. A point you and I are comfortable with, but one which Peakers in general do not appear to understand or consciously avoid.
The question of, how many OTHERS might there be is something else entirely and may be dependent on another factor, such as the level of exploration of any particular basin or province, the odds of another 1 in 10,000 case decreasing with respect to maturity. Sort of like sampling without replacement, while using a total URR per province from which to deduct any given discovery size. Without replacement, it only requires a single hit into the super giant size to drop the possible size of all other discoveries along the same distribution.
Well, there's the Bakken, with 400B bbls (only 5B estimated to be recoverable at the moment), and someone recently told me that there might be a similar field in Alberta.
The Bakken estimate of 400B barrels is sketchy at best. The actual estimate was of "technically recoverable" which isn't time dependent but technology dependent. Might new technologies unlock more? Sure...but until those come into view, the best number to date is approx 4B barrels. And yes, there are Bakken sourced fields in Canada. Primarily conventional in nature, if memory serves. And not of any particularly large size.
The actual estimate was of "technically recoverable" which isn't time dependent but technology dependent.
That's what I meant. Drilling techniques are evolving reasonably quickly.
yes, there are Bakken sourced fields in Canada. Primarily conventional in nature, if memory serves. And not of any particularly large size.
I wasn't talking about the Williston Basin, or the Bakken Formation. I saw a claim that there was a different formation in Alberta. I'll see if I can track it down...
That's what I meant. Drilling techniques are evolving reasonably quickly.
Drilling techniques aren't the problem, or the solution, with the Bakken. They can drill it fine.
Could you expand on that?
It's my understanding that older vertical drilling techniques produced a relatively small amount of oil, mostly decades ago, and that newer horizontal/fracturing techniques have produced very different results, in a process similar to that of the changes in the nat gas industry. And, that those new techniques are still evolving.
Horizontal drilling is not new. Neither are multistage frac jobs. The combination is relatively new, but is not itself a "new" technology. And these techniques certainly produce more per well results than an older vertical well, in part because of increasing drainage areas. They also cost more. Its a constant balancing act, which appears to revolve around the IRR generated by the front loaded production volumes because of the horz/multistage combination.
The same issue is going on in natural gas...shale gas has a longer production history than crude oil in the United States. The economics of it have been crappy when compared to, say, the Norphlet formation. Still are...but the lack of discovery risk appears to balance things out.
How would you describe the changes that have happened in roughly the last 5 years in NG? Certainly, the results we've seen recently were not anticipated 5 years ago.
I have the impression that fracturing techniques are still evolving, with the development of new proppants, and other things. What do you think?
Certainly, the results we've seen recently were not anticipated 5 years ago.
Depends on what you consider "anticipated". Shale gas has been produced, economically, in the 19th, 20th and 21st century. It isn't new. But the problem was never with the presence of shale gas, those of us who were developing it back in the 80's certainly aren't surprised by self-sourced reservoirs. The entire game revolves around economic recovery. Shale gas reserves tend to be moderate in initial production and long lived, and this doesn't reflect well in a PV10 calculation of value.
The higher IP's accomplished by opening up every natural fracture within half a mile of the horizontal section make the PV10 of the production stream much more attractive.
Fracturing techniques are still evolving. Some of it is amusing, you can just see an engineer saying "hey! If a 3 stage frac is good, a 20 stage one must be better!". We are predictable that way.
Sooner or later the optimal configuration of frac stages and cost will be balanced against an optimized flow rate and the procedure will be standardized to a better extent.
Ok, then 2 questions (if you have the time):
First, what does the experience in NG tell us about Bakken oil recovery potential? and,
Shale gas reserves tend to be moderate in initial production and long lived, and this doesn't reflect well in a PV10 calculation of value.
This seems to conflict with what some people on TOD have been saying about high depletion rates for these NG wells. What's your take on that?
First, what does the experience in NG tell us about Bakken oil recovery potential? and,
The engineer who wrote the Bakken piece for TOD did a good job. Ignoring any conclusions he mentioned, I tend to concentrate on someones factual accuracy when I read technical articles, anyone can draw any silly conclusion they want from reading tea leaves, so I usually skip that and check out factual accuracy. He did fine.
The Bakken recovery potential runs a solid 20-30% in sweet spots, I was hearing about CO2 injection nearly 2 years ago as pilot projects in Elm Coulee. Never checked back to see how or even if they went. The USGS estimates from April in 2008 are perfectly acceptable in my mind for anything I can see right now.
This seems to conflict with what some people on TOD have been saying about high depletion rates for these NG wells. What's your take on that?
Most people around here screw up the terminology so badly I'm not sure I know what they mean half the time. Confusing depletion and decline rates are usually just the beginning.
The fact of the matter is some wells decline faster than others. Some wells IP higher than others. Some wells do one better or worse than the other. Horizontal wells can decline differently than vertical wells, which decline different than other vertical wells just drilled into a different area. Considering the range of variability within the same formation and same type of well with the same type of completion, it is difficult to answer this question without some real specifics. These Barnett wells, drilled this way, in this county, versus those Haynesville wells, drilled that way, in that county.
Hmm. That would kind've suggest that the latest levels forecasted for the next year or so, 500k bpd, might be a ceiling on production.
As far as NG wells are concerned, I'm trying to get your sense of whether the recent optimism about NG production is justified: there have been some skeptical articles recently on TOD and elsewhere.
As far as NG wells are concerned, I'm trying to get your sense of whether the recent optimism about NG production is justified: there have been some skeptical articles recently on TOD and elsewhere.
Shale gas is great. But it isn't the cheapest stuff in the world, although in the US the price differential between it and tight gas or CBM isn't that big of a deal. The quantities claimed for it as a resource strike me as near classic promoterism, Art's bashing of its current economics strike me as being the exact opposite.
This is TOD, the world ending tomorrow gets as much airtime as the much more likely scenarios.
Ah, so the truth is somewhere in the middle: not cheap, but not prohibitively expensive; not 100 years of supply, but not dying in 10 years either.
Thanks.
I agree with that sentiment and it's why I consider the analysis of size distribution a very serious research area. Only a few people show real interest. BTW, the size distribution I use is much more skewed and has an even fatter tail than the log-normal. The log-normal comes out of multiplicative probability processes and I haven't needed to resort to that argument. Yet, Orinoco could be an exception in that all the probabilities needed to create a reservoir are common enough but the one factor that allows for Orinoco has occurred. Thus the probability of its occurrence was multiplied by a factor and, voila, you have a huge super-giant.
Sampling without replacement is the mechanism behind the dispersive discovery model and how many you may find per time. The size model sits on top of this since reservoirs have a small volume in comparison to the sampling volume. The URR scaling argument is the value that we hone in on as we collect more and more data.
Yet, Orinoco could be an exception in that all the probabilities needed to create a reservoir are common enough but the one factor that allows for Orinoco has occurred. Thus the probability of its occurrence was multiplied by a factor and, voila, you have a huge super-giant.
The Orinoco goes well beyond super giant, it is simply the largest oil accumulation yet discovered by man. Ranked #1 in field size and recognized as such at least a quarter century ago, and it hasn't gotten any smaller since. The question from the geologic point of view would be, at what other places on the planet has the same combination of wonderful geology come together and offered up the possibility of another one? The Arctic tends to look gassy because of its development, so the current possibilities are Russia and Africa probably. I don't know if the salt plays along the rift basins in Brazil can achieve this physical size of trap. Can't say I know enough about the geology of either Africa or Russia to comment on useful probabilities though.
Just the fact that an Orinoco has happened once means that it has to be included into any Bayesian analysis for future occurrence. The challenge is to generate a meaningful prior.
Because the power law fits so well for most conventional oil reservoir sizes, you could say that Ghawar is a 1 out of 50,000 or so occurrence. In other words, we would have to go through another 50,000 to get even odds of finding another Ghawar somewhere in the bunch. If we wanted to force Orinoco into the same category, it would have to be a 1 out of 500,000 occurrence (if Orinoco is at least 10 times the size of Ghawar). We would say that Orinoco was a fluke and then estimate that the next Orinoco would still be a 1:500,000 chance. I don't think we will ever accommodate that number of potential finds.
As another analogy, consider the Amazon river. This dwarfs all other rivers and carries 20% of the water draining into the ocean. The Amazon by itself carries more water than the next 10 largest rivers combined. Could there be another Amazon in a hypothetical alternate Earth?
Or is Orinoco more like the Everglades? Is that a lake or a river or just a huge non-specific swamp? I wonder how many Everglades we would expect to find.
Yes.
http://www.eia.doe.gov/emeu/ipsr/supply.html (Table 4.1d)
My guess is it would depend on what exactly you are graphing on a production vs. time graph. According to this http://www.eia.doe.gov/aer/txt/ptb1105.html, the yearly crude + condensate peak is still 2005. I think if you look at similar data that includes crude, condensate, biofuels, NGL, CTL, etc it is 2008 according to the data in this spreadsheet - http://www.eia.doe.gov/emeu/ipsr/t44.xls.
given the current global situation, the question you are answering is largely energy 'trivia'. (I.e. behind the headline fact of when ultimate peak was/will be, are some underlying hard truths about future availability/affordability)
Let us hope we get ahead of the depletion curve, by reducing our need for oil.
It's fascinating to see the disagreement.
It looks like the 2008 figures were revised downward slightly, so that 2005 is technically the peak.
On the other hand, it seems clear that 2008 would have been the peak had the recession not reduced consumption. If you take 6 month periods, quarters, or months, the peak is in 2008.
That question is partly why I posted the oil shock model of the production at the top of this thread. When you plot the curve at the resolution shown, it makes the exact date seem less significant.
That's only useful if you think you know which way the curve will bend in the future.
Higher resolution is useful if you've misplaced your crystal ball...
If you don't have a model, I am not sure what you can do with the data. You can do a variety of extrapolations based on the previous set of points. But even that presumes a kind of dead-reckoning model that is projecting a bend in the curve, either up or down based roughly on the second derivative.
So I don't really follow how higher interval resolution will get you anywhere.
In signal processing you sample based on the highest frequency you might observe, as per Nyquist. But we all know that the most critical time constants will operate over the span of years, and that is what we are trying to deduce, the decline of oil production due to dwindling resources. All the adjustments we will see are unpredictable and those are handled as perturbations on production ala the oil shock model. New information is added to prior information via the Bayes rule and you can end up with something similar to a Kalman predictor... Which certainly beats tea leaves, coffee grounds, or a crystal ball.
You can do a variety of extrapolations based on the previous set of points. But even that presumes a kind of dead-reckoning model that is projecting a bend in the curve, either up or down based roughly on the second derivative.
Sure. That's useful, and it may be the best we can do.
The upward bending curve is the model that the cornucopians like to tout whenever they see favourable movements in the data. Obviously that has the problem of resulting in an infinite URR. It is definitely a model but is certainly not "the best we can do".
The upward bending curve is the model that the cornucopians like to tout whenever they see favourable movements in the data.
I don't think we need to worry about "the cornucopians". We just need to our best analysis.
Obviously that has the problem of resulting in an infinite URR.
Not really. Production could be flat, or rise modestly for a surprisingly long time, and still not suggest an infinite URR.
Forecasting is a very difficult business. Hubbert predicted that natural gas production would fall off a cliff in the 1980's!
I'm fascinated by increasing US production...
... over the span of one year.
Nick, if nothing else, you have a flair for the rhetorical argument. But you can't leave your thoughts open-ended or someone will finish them for you.
... over the span of one year.
US oil production has been growing for several years, and the rate of growth has accelerated:
05 8,322 -4.3%
06 8,331 0.1%
07 8,457 1.5%
08 8,514 0.7%
09 9,056 6.4%
10 9,769 7.9%
You can't leave your thoughts open-ended or someone will finish them for you.
Well, if we argue with good faith, it won't be a problem. And if we don't, nothing will save it...
From Rembrandt's report
Nick --
Please respond to the above graph without placing any rhetorical spin on your argument.
Ok.
We see in Chart 113 a long-term, secular decline from a peak.
We see in 116 a distinct bottom, and a clear recovery from that bottom, with reasonably strong growth.
Flaws in the charts: #113 needs to be updated, to show the growth in #116. At the moment, #113 is quite misleading. Finally, the numbers in both appear to disagree with EIA historical numbers - the EIA has a lot of flaws, but as far as I know no one has questioned their production numbers for the US.
"Secular", that's a variation I haven't heard. In any case, its now clear that you just admitted that the oil depletion will "exist or continue through the ages or centuries".
Investors define "secular" simply as "Long term, not temporary or cyclical." http://www.investorwords.com/4433/secular.html
OTOH, I was simply telling you the obvious interpretation of the chart, not what I think is the overall situation. I think there's very likely enough oil in the US to maintain current production for decades, and I think there's a decent chance that production can be increased significantly. N. Dakota, for instance, is continuing to surprise with strong growth.
WHT,
I think knowing the exact date is important to the extent that if affects our collective credibility when talking to folks who are ignorant or denying of peak oil. After all, the big picture is the collection of all the data points. It's helpful to show people that we are on top of the data. Consider the following: it's much more rhetorically effective to say "US oil production peaked in 1970" than to say "US production peaked about four decades ago (the exact date doesn't matter)."
I see your point. But then again, we can't even guess the global peak in oil discovery very accurately even though it happened in the early 1960's. The data set on discovery is noisy and spiky and whose peak date was likely influenced by the discovery of a single super-giant field.
The dispersive discovery curve is a stochastically smoothed model of that 1960's peak discovery profile which gives the average date assuming that the discoveries occurred randomly over time.
The distinction between the two approaches is only observable in hindsight as we have no control over statistical fluctuations, only the probability flow over time.
So what I am saying is that only a model can give you a prediction of the peak date. For the real peak, you have to wait many years and then look at in hindsight. So it is OK for us to say that USA peak production occurred in 1970 and that is about what Hubbert predicted. Yet, we are in the here-and-now, so we have to make do only with the model, and I personally would not rely on the data at face-value.(BTW, I would never use Hubbert Linearization either)
2005 production was also impacted by the hurricanes. I think that the cumulative shortfall in crude oil production may be the most meaningful metric:
Global Cumulative Crude Oil Production Versus US Oil Prices
2002-2005 & 2005-2008 (EIA, crude + condensate)
Here are the average total global crude oil production numbers per day by year, versus average annual US spot crude oil prices:
2002: 67.16 mbpd & $26
2003: 69.43 mbpd & $31
2004: 72.48 mbpd & $42
2005: 73.72 mbpd & $57
2006: 73.43 mbpd & $66
2007: 73.00 mbpd & $72
2008: 73.65 mbpd & $100
Relative to the 2002 production level of 67.16 mbpd, in the following three period, 2003-2005 inclusive, the cumulative three year increase in production was 5,164 mb, versus a three year increase in oil prices of $31.
But then we have the 2006-2008 data.
Relative to the 2005 production rate of 73.72 mbpd, in the following three year period, 2006-2008 inclusive, the cumulative three year decline in production was about 400 mb, versus a three increase in oil prices of $43.
Deffeyes predicted a C+C peak between 2004 and 2008, mostly likely in 2005, based on his assessment that global conventional crude oil production would be about 50% depleted in this time frame (he made an erroneous observation about a 2000 peak, but he never backed away from what his model showed).
Deffeyes thought that rising unconventional production would not be sufficient to keep total crude production increasing, and so far he has been right.
I assume what you mean to say is that in the 2nd period prices rose, but production didn't respond, signalling a peak?
Relative to the 2005 production rate of 73.72 mbpd, in the following three year period, 2006-2008 inclusive, the cumulative three year decline in production was 632 mb, versus a three increase in oil prices of $43.
How are cumulative production shortfalls useful to the analysis? I mean, first you'd have to prove that production declines in 2006-07 were involuntary, which as we both know is mighty controversial.
It's quite a coincidence that global producers, especially Saudi Arabia, suddenly decided to voluntarily cut production, and especially net oil exports, in the 2006 to 2008 time frame (relative to the 2005 rate)--in response to rising oil prices--at about the same time that Deffeyes predicted a global peak, all of which was in marked contrast to the steep increases in production and net oil exports from 2002 to 2005, in response to rising oil prices.
I am reminded of the recent article that I posted to the effect that "facts don't matter." People (on both sides of the Peak Oil debate for example) sometimes tend to dismiss data which don't fit their preconceived notions.
According to Robert Rapier, tnventories were rising from 2006-2007, and it made perfect sense for KSA to anticipate a bubble and pre-emptively cut production. They had been through a similar experience very recently, and didn't want to repeat it.
As for Deffeyes, I'm told he's made enough predictions that something had to turn out eventually:
He first called the peak for the year 2000. In an article called "Brace yourself for the end of cheap oil" in New Scientist*, Deffeyes had this to say:
And he [Deffeyes] believes the highest single year may already have passed. "2000 may stand as a blip above the curve and be in the Guinness Book of World Records."
Similar remarks are recorded in the ASPO August 2003 newsletter:
This may substantiate the view, voiced by Ken Deffeyes, at the Paris ASPO Meeting [May 2003], that peak oil production may turn out to have been in 2000 as much from falling demand as supply constraints.
According to the EIA, oil production in 2000 was 77mbd, while today it is pushing 85mbd.
Next, in his book "Hubbert's Peak", published in 2001, Deffeyes claimed that "the numbers" showed that peak would occur in 2003, although he admitted the possibility of error, as described in the review of his book in the October 2001 issue of Scientific American:
The numbers pointed to 2003 as the year of peak production, but because estimates of global reserves are inexact, Deffeyes settled on a range from 2004 to 2008. Three things could upset Deffeyes's prediction. One would be the discovery of huge new oil deposits. A second would be the development of drilling technology that could squeeze more oil from known reserves. And a third would be a steep rise in oil prices, which would make it profitable to recover even the most stubbornly buried oil.
Then, in the New Scientist article* referenced earlier, Deffeyes made the following claim:
I am 99 per cent confident that 2004 will be the top of the mathematically smoothed curve of oil production.
Next Deffeyes stated that the peak would occur on Thanksgiving Day (Nov. 24) 2005.
Source: http://peakoildebunked.blogspot.com/2006/04/279-many-wrong-predictions-o...
Prediction accuracy is a fascinating topic all by itself. Because oil discoveries are discrete and stochastic but essentially countable, we have to deal with the vagaries of counting statistics. This makes it less predictable than statistical mechanics, where one can guarantee the operation of a transistor because of the zillions of electrons involved. For oil discoveries, we are talking about tens of thousands of discrete events (i.e. discoveries in size and time) and so the fluctuations and possibilities of alternate outcomes are significant.
Read through this blog posting to get a handle of potential outcomes:
http://mobjectivist.blogspot.com/2009/12/monte-carlo-of-dispersive-disco...
In that post I have run Monte Carlo simulations assuming a finite number of discoveries of varying size occurring over a time span, and then contributing to a greedy production rate and the outcome is here:

This reinforces your statement:
One discovery can indeed change the future slightly, but one electron can't change the operation of a transistor. That's what makes this work challenging, but not necessarily intractable. It is also why the predictions keep getting better -- as we get more data the law of large numbers says that one more discovery will make less of a difference and we can use Bayes rule to update all the past information with new information and zero in on the actual outcomes shown in the above figure. All of the possible outcomes that occurred in the past are discounted and the new bunch will show a narrower profile.
Deffeyes was not wrong but simply ignorant of the statistics and probability that would place his predictions on a more solid foundation. It all boils down to making a prediction and calling it the most likely outcome based on the available prior information.
An erroneous observation about 2000 is not a prediction. Deffeyes has been quite consistent about what his model showed, a conventional crude oil peak between 2004 and 2008, which he later refined as most likely in 2005. And he thought that rising unconventional production would not be sufficient to keep total crude oil production on an upward path. So far, he has been right.
The fact is that EIA data show that annual global crude oil production has been at or below the 2005 rate for four years and for 2010 to date, with only one year (2009) showing a year over year price decline. This inability to increase production, beyond a prior peak level, in the face of rising oil prices is the same pattern that we have seen in other post-peak regions, e.g., Texas, overall Lower 48, North Sea, etc., but as noted up the thread, people believe what they want to believe.
An erroneous observation about 2000 is not a prediction.
That wasn't an "erroneous observation", it was speculation that the peak was behind us. That's even worse than an inaccurate forecast: he had several years of data after the proposed peak to work with, as well.
This inability to increase production
1) I find Robert Rapier's explanation for the 2006-07 drop to be reasonable. Do you disagree with his observation that inventories were rising during this period?
2)Clearly, the world was able to increase production (to a new peak) in 2008.
3)Obviously, the decline since the 2008 peak was due to declining demand, not declining production capability, and it's also obvious that OPEC has now chosen to support oil prices at a much higher level.
------------------------
I should say that I actually do agree that oil supplies are much tighter than they historically have been. It's just not clear to me what's going to happen next. People on TOD have been speculating for years about Russia and KSA declining, and instead they stubbornly refuse to cooperate. Similarly, the US is showing a pretty clear production increase (8% over 2009). So, the top 3 producers are being pretty durable.
Okay, speculation is not a prediction. The point is, he never backed away from what his model showed, a peak from 2004 to 2008.
Okay, speculation is not a prediction.
Actualy, it is: a statement made in 2003 that 2000 might be the peak is a prediction that production will fall from 2003 on out.
He's made many claims:
"2000 may stand as a blip above the curve and be in the Guinness Book of World Records." in 2003
"peak oil production may turn out to have been in 2000 as much from falling demand as supply constraints." in 2003
"I am 99 per cent confident that 2004 will be the top of the mathematically smoothed curve of oil production." in 2003
"In the January 2004 Current Events on this web site, I predicted that world oil production would peak on Thanksgiving Day, November 24, 2005. "
"In hindsight, that prediction was in error by three weeks. An update using the 2005 data shows that we passed the peak on December 16, 2005" February, 2006
"peak oil can be expected to occur somewhere between Nov. 2005 and April 2006 " in 2006
-------------------------------------
This is a similar technique to that of Jeanne Dixon: in the 1950's she made dozens of predictions each year, all wrong. Finally, in 1963 she made a prediction that could be interpreted to predict Kennedy's assassination, and she found fame.
-------------------------------------
The latest peak is in the first half of 2008, so all of the predictions above were wrong. We still haven't seen a clear peak, as production is now rising towards the level seen in 2008.
So, in summary: yes, the fact that Deffeyes made a prediction that appeared to match with a peak was in fact a coincidence.
Making predictions about inane things such as Jeanne Dixon is different than making predictions in your field of expertise.
Plus, the obvious point that you will likely refuse to agree with that is that all the wrong predictions will be the ones on the short side, i.e. "undershots". There will never be any wrong long predictions unless we are sufficiently beyond the peak so that we can look at them in hindsight. But by that time, no one will care that they "overshot" or even who made those predictions.
If you don't agree with this, name a person who has made a certifiably wrong long prediction on global peak oil. (Don't answer this or you will find yourself in a Catch-22)
The point is: Deffeyes has made a lot of wrong predictions. If he makes a lot of wrong predictions, and only one right prediction, he has a poor track record. More importantly, if he simply keeps on revising his predictions to meet the latest data, he isn't really making predictions at all, he's simply waiting until the reality matches his forecasts. If observers forget all of his wrong predictions, and only remember his correct "prediction", then they have the illusion of accuracy, when all they really have is coincidence.
It's something similar to "a stopped clock being right twice per day", and stock market permabears being right every 5-7 years when the business cycle turns down.
Eventually, of course, PO forecasts have to be realized, but this kind of "forecasting" doesn't help us know when it will happen.
Use some logic, man. At this point there can only be wrong predictions.
Sufficient time has not passed for there to be any verifiably right predictions regarding global peak.
You still havn't given me the person who has made the correct prediction yet.
At this point there can only be wrong predictions.
Not true at at all. I have far more faith in people like Charlie Maxwell, who has made only a single PO prediction, which at this point is still in the future.
See: http://www.futurepundit.com/archives/006340.html (and look for my comments about Maxwell's economic forecasts).
Deffeyes would still have a bit of credibility left if he had made 1 or two predictions, and admitted that he was wrong, and showed why he was wrong. He hasn't done that.
This discussion started with Deffeyes being used as an authority:
"It's quite a coincidence that global producers, especially Saudi Arabia, suddenly decided to voluntarily cut production, and especially net oil exports, in the 2006 to 2008 time frame (relative to the 2005 rate)--in response to rising oil prices--at about the same time that Deffeyes predicted a global peak, all of which was in marked contrast to the steep increases in production and net oil exports from 2002 to 2005, in response to rising oil prices."
But, in fact, as I showed above, these two things are precisely a coincidence: Deffeyes has made a long string of incorrect predictions - anyone who does that is simply not useful as a source of forecasts. When, inevitably, his PO forecast finally is fulfilled, it will be demonstrably because of persistence, not useful information about fundamentals, models, economics or anything else.
Now, is modelling and forecasting a valid thing? Sure, but the lack of necessary information, the low level of reliability, and the very wide confidence intervals have to be acknowledged. Deffeyes' habit of pointing to a single month or day smacks of a PR stunt. Here's an interesting article about forecasting: http://www.nytimes.com/2010/08/22/business/economy/22view.html?src=me&re...
This industry stooge's prediction is neither right or wrong at this point, it's PENDING.
Try again.
Sure, at this point there are only wrong predictions and pending ones. Still, the long series of Deffeyes' specific predictions have been proved wrong (the only one left is the general "2004-2008" band, and that would have been in danger without the coincidence of an intervening recession). We can differentiate between forecasts of different levels of credibility.
Maxwell is pretty well respected. Why do you use the word "stooge"?
Because I didn't happen to use "tool".
Gail and me did some calcs on that in 2007:
Did Katrina Hide the Real Peak in World Oil Production? and Other Oil Supply Insights
http://www.theoildrum.com/node/3052
The official number we're working with for 2005 is 73.72. With the "Katrina adjustment", what would that number be for the year, and what would the peak month be?
And, could you estimate what 2008 (annual and peak month) would be with the "credit crunch adjustment"?
What is significant about providing 4 digits?
Without the last digit, 2005 and 2008 production levels are identical. Heck, the preliminary statistic for 2008 was higher than 2005, and only a revision made it lower.
Although, it appears likely that the discussion is moot, as the Katrina adjustment isn't likely to equal the recession adjustment, even assuming that a production side adjustment is as appropriate as a demand side adjustment.
Then they are identical!
I take it you never had an engineering or physics degree.
And that assumption would be wrong - I understand significant digits quite well (I still remember my 20 inch and 5 inch slide rules affectionately).
Unfortunately, Deffeyes apparently does not understand significant digits:
"The US Energy Information Agency now reports the 2005 production to have been a tiny bit larger than the price-boosted year of 2008. It was a close game, sports fans, but 2005 won. When they give out the Super Bowl rings, they don't look at the point spread."
http://www.princeton.edu/hubbert/current-events-09-11.html
---------------------------------------------------
So, we're all agreed that the total annual crude oil production statistics for 2005 and 2008 are effectively identical, and that monthly and quarterly production levels were higher in the first half of 2008 before demand fell, making 2008 the clear "peak-so-far"?
But one could argue that flat production since 05 led in part to much higher oil prices in 08, leading to the recession that then placed 08 behind 05. In other words, the recession of 08 cannot simply be ignored to wonder how much consumption could have occurred.
We're talking about production, not consumption.
They are exactly the same thing. Consumption is just another word for demand. Production always equals demand with price the arbitrator.
Check it out if you don't believe me. Every year, year after year, the world has always consumed what it has produced, no more, no less. The tiny yearly changes in storage are a tiny fraction of one percent when compared to world yearly production.
Ron P.
They are exactly the same thing.
Of course, from a simplistic point of view. The point is, there are times when production is clearly constrained by lack of demand. We saw a monthly/quarterly/semi-annual peak in the first half of 2008, and there's little doubt that was not noise (i.e., an aberration in production), and that we would have seen an annual peak had demand not faded. Therefore, the clear peak was 2008.
That is a very curious statement when you consider that all the machinery, transportation, manufacturing, agriculture, and miscellany that has depended on petroleum over the years has been on a stable growth path with very few identifiable periods of low utilization. I think the problem is that you treat demand as some sort of profit opportunity, whereas we should really consider it as a steady driving force. In other words, we will use all that we can to maintain our current state mitigated only by somebody knocking us on the side of the head with a 2x4.
Look at water usage in a desert community. Do we think that lawn sprinkling reduction is caused by lack of demand? I don't because the demand is still there, but the limited use is caused by limited availability traded off against common sense.
all the machinery, transportation, manufacturing, agriculture, and miscellany that has depended on petroleum over the years has been on a stable growth path with very few identifiable periods of low utilization.
In the last 18 months all of those things have been badly underutilized - that's the definition of a recession.
you treat demand as some sort of profit opportunity, whereas we should really consider it as a steady driving force.
"Demand" is defined as purchases by those who are ready, willing and able. Oil purchases in the US did drop by 10% in the last couple of years...
Hello the effects of Peak Oil, caused by a reduction in world-wide availability.
Yes, I agree that a reduction in world-wide availability caused a price spike, and that contributed to declining US consumption: there was
1) a retracing of a classic demand curve, as well as
2) increased substitution and efficiency: declining oil for electrical generation; declining use of home heating oil; more efficient cars; thinner plastic bottles, etc, etc.
OTOH, it's also clear that we had a classic business cycle (bubble, bank panic) that also contributed to a sharp decline in oil consumption.
The flipping peak is right now! We hit the peak in 2005, or more correctly, late 2004 and we have been on that peak ever since. Everything in between is just noise, noise that is within the margin of error.
The only question to be answered now is when do we fall off the peak. I am predicting 2012 or no later than 2013.
Ron P.
To my eye, we reached the plateau level in late '03 and have been bouncing around on it--between about 71.5 and 74.5 mbb/day--ever since. I would love to see the graph smoothed with two, three, four, five...year averages. I think then we would get a better sense of the statistical peak. But really, as you say, we've been at about peak for 6-7 years already.
I would say that when we start seeing numbers below 71 for a number of months that would be a pretty clear sign that we're sliding down the other side of the curve.
Are mega projects still coming on line that will help push us toward your 2013 figure?
Watch out about predicting anything dire in 2012 or you'll be accused of following (or misinterpreting) Mayan calendars '-)
I agree, and if we start using multi-year moving averages we might as well displaying a wider time interval, because we are acknowledging that changes of 5 years or less hold little significance. That is the hallmark of low-pass filters.
I'm fascinated by US oil/NGL production, which is growing at about a 8% rate (2010 monthly data, year over year). 2009 production grew by 6.4% over 2008. http://www.eia.doe.gov/emeu/ipsr/t14.xls
I have the impression that the growth is coming roughly evenly from onshore and offshore - do we have good data?
How long does this plateau have to go on before folks admit we are on a plateau with no cool inflection point so prized in high school calculus courses.
This mesa of oil production could go on for a decade or more.
When do you just throw out that precious curve?
Then what happens your curve based prophecies?
The inflection point is where the second derivative changes sign. Maybe you were thinking of the production cumulative.
Actually I was thinking about your logistic dispersive curve.
How long does the plateau have to last to disprove your mathematical model?
If the plateau last until 2015 (and we are half way there) will it invalidate your mathematical theory? Suppose it lasts until 2025?
To me that is quite likely as 15 years x 32 mpd = 470 Gb.
If we were at peak oil in 2005, having burnt about 1 trillion barrels of oil and we add in another 470 billion we end up with a total of 2470 billion URR only 20% more than originally estimated.
The idea that production will follow your curves is illogical if the data doesn't resemble your model.
The Dispersive Discovery curve applies to discovery data, which has shown a confirmed peak in the past, almost 40 years ago to some time in the early 1960's. That curve definitely has a standard shape as it is based on accelerating search efforts on a finite volume. It doesn't have to be a logistic, and actually can't unless you believe in sustainable exponential growth in search technology. That is the Blue curve in the figure. It has a fatter tail than the logistic because I assumed search can't sustain at an exponentially increasing rate.
The Oil Shock Model predicts the greedy rate-driven behaviour that we would see as producers extract from the reserve. This can go through all sorts of perturbations such as showing negative shocks (less extraction pressure) and positive shocks (greater extraction pressure). The latter can give the impression that we are sitting on a plateau, where actually what it means is that we are simply counteracting the decline.
As a tautology, that is certainly true. If the future data doesn't fit the model, the model won't fit the data. But don't turn around and say that proves something. Tautologies will never get you anywhere.
In other words, the peak should have plotted on a graph as a bell curve, but efforts, like drilling to install more horizontal super straws to draw the black gold out at a much faster rate, is artificially extending the curved peak into a plateau.
But wouldn't that mean the drop off from plateau would be steeper than expected? A use more now, but have less available later type scenario. But wouldn't a less later scenario accentuate the economic problems associated with post peak oil? Could it cause an economic freefall, a sudden collapse?
Precisely right. Whenever I add positive extraction perturbations to the model, the result is that the ensuing decline becomes that much more steep. I did this a while back and I called it TOP -- The Overshoot Point.
http://mobjectivist.blogspot.com/2005/12/top-overshoot-point.html
Very interesting. Thanks for the link.
Baloney.
Your dispersive discovery curve should be asymmetrical to include reserve growth. Instead you revise old URRs.
Now we have a new claim, that 'overproduction' will result in steeper exhaustion in short order.
"The expression "exhaustion of our coal mines," states the subject in the briefest form, but is sure to convey erroneous notions to those who do not reflect upon the long series of changes in our industrial condition which must result from the gradual deepening of our coal mines and the increased price of fuel. Many persons perhaps entertain a vague notion that some day our coal seams will be found emptied to the bottom, and swept clean like a coal-cellar."--W.S. Jevons
Has anyone looked exhaustively at the relationship between reserves and production? Semi-rhetorical question, I guess. A while ago I plotted US R + P and they're basically the same line; tried the same just now for UK and both peak in 1999, leading me to conclude that the whole concept comes up a bit short in the utility department, cf eternally rising real estate values. Peak comes at ca. 50% of URR, after that the country in question is pretty much a write off, which in the case of the US or UK hasn't been the end of the world; Russia or KSA would be a bit more problematic though.
I suppose every country in the world could grow its reserves a titch as they all decline in production, and the result would rulz. But that would just be Hirsch's EOR wedge at work.
2008, Matt Mushalik: The Oil Drum | The Disconnect Between Oil Reserves and Production
Watch the ratio of oil production to reserves, the P/R ratio. That can go down when people get spooked, but it will go up when the crunch really hits. For example, it went way down in the 70's/80's when people seriously started energy conservation measures. It will go up eventually, but the two effects can mask each other. That is the way I model perturbations.
Hmmm. OK, for the world I get sharp spikes on '88/'90/'03. These are due to the OPEC quota wars and the SEC waving its magic wand and declaring the tar sands to be P1. Where do you see these perturbations? Post 2000 there was an uptick from negative territory, could that have predicted flat supply in the 2nd half of the decade? I do see reduced volatility in this number.
I'm attracted to simple approaches like taking a tally of how many nations in a given year are increasing or contracting production:
Probably a lot to learn there if a dullard like myself can cough up some numbers.
This is actually what is happening:

The average extraction rate, which is in proportion to actual current reserves, held to a high level until people got spooked. The fastest downward adjustment occurred around 1980.
This started to level off by 2000 but who knows which way it will go in the future. Will it stay constant as shown above? If that is the case, with dwindling reserves, it means the absolute production levels will certainly drop.
Take the blue curve I posted above and fold it over as a mirror about its peak and you will see that it is asymmetric. The discovery process is an illustration of reserve growth -- all discoveries are not made at one time, but they appear over time depending on the effort expended. The discoveries are there independent of how accurately one can estimate them initially.
So how accurately the discoveries actually are WRT to their reported values is a matter I cannot control and is what makes the task more challenging than the breakthroughs I have made in applying dispersion theory to amorphous semiconductors, for example :)
A tautology. Of course, trying to figure out what the URR actually is is part of the objective. If you didn't have to revise them, then the first prediction ever made should work. Evidently, you don't understand the utility of Bayesian reasoning.
I don't know how this is a new claim, as I originally posted this idea almost 5 years ago on my blog.
BTW, did you go back to your high school texts and read up on inflection points?
If you have based your math on Bayesian theory then you are the tautologist, WHT.
In Bayesian theory, you come up with subjective a priori
probability and use it to prove your conclusion. It's circular reasoning, which is what I've always said was the problem with your curves.
http://en.wikipedia.org/wiki/Bayesian_probability
Points of inflection can ALSO be categorised according to whether f′(x) is zero or not zero.
if f′(x) is zero, the point is a stationary point of inflection, also known as a saddle-point.
http://en.wikipedia.org/wiki/Inflection_point
Your continuous dispersive curves have a saddle point of maximum production/discovery followed with steep declines.
I maintain we are on an extended plateau, a discontinuity
which disproves your curves.
How many years of flat production are needed to disprove your Bayesian theory?
Don't fly in an airplane if you don't believe in Bayesian reasonng.
Kalman filtering and optimal control for the flight management system incorporate Bayesian probability and statistics.
You are in the dark ages as far as probability and statistics are concerned. Fisher and the frequentist school of statisticians tried to poison the well of Bayesian reasoning over the last century, yet they were no match for engineers that decided to use Bayesian ideas in everyday applications. You can't argue with success.
The frequentists have been pretty much defeated except for people like you that hang around Wikipedia entries and find tired old arguments written by people that refuse to give up the ghost.
Do you mean a decade from when we first reached this plateau in late 2004? If that is what you mean then I agree. But do you mean a decade from now? If that is what you mean then I say: "No way in holy hell will that happen! We will fall off this peak we are on by no later than 2013. Well, that is my prediction and you can hold me to it.
There will be some event, between now and late 2013, that will convince the world that we are post peak. I expect that event to be either Saudi Arabia, or Kuwait, or the UAE admitting that they cannot increase production. That will be the snowball that starts the avalanche. (The rest of OPEC is already producing flat out and only these three countries have any surplus capacity.)
Anyway, stay tuned. Things are going to get exciting very soon. But until then just watch the mundane events of the day until one day all hell breaks loose.
Ron P.
The US and Russia are important too: both had peaks some years ago, but both are now growing. US oil/NGL production, which is growing at about a 8% rate (2010 monthly data, year over year). 2009 production grew by 6.4% over 2008. http://www.eia.doe.gov/emeu/ipsr/t14.xls
Yes both were growing. The EIA's Short Term Energy Outlook predicts that both the US and Russia will decline in 2011 verses 2010. In fact both will show significant declines in the second half of 2010 verses the first half of 2010. The serious decline, I believe, will start in August of 2010.
I don't track All Liquids. NGLs have very little to do with transportation fuel, which is about 70 percent of all crude oil production. Peak oil is crude + condensate. When Crude + Condensate peaks, (actually it already has), then that is the peak.
Ron P.
The STEO projects 30kbpd growth in US crude production in 2011 despite the GOM drilling moratorium, so they must be expecting declining NGLs due to low nat gas production, in turn due to low NG prices. That is much slower growth - I wonder what they project for onshore production? Have you seen data?
NGLs are pretty fungible with crude - e.g., both can be chemical feedstock.
As I was posting before, Saudi Arabia lost production share to Russia, indicating the Saudi production drop was not really voluntary:
13/8/2010
Saudi Arabia lost production share to Russia
http://www.crudeoilpeak.com/?p=1800
Moreover:
31/7/2010
Saudi Aramco's crude oil exports peaked in 2005
http://www.crudeoilpeak.com/?p=1738
Saudi Arabia lost production share to Russia, indicating the Saudi production drop was not really voluntary
That logic only holds if we assume that KSA thinks that market share is more important than keeping the price high. I don't think that assumption makes sense.
In fact, keeping prices high but conserving production for later is probably much better for them. That strategy is consistent with their public statements lately.
WHT,
Thanks. I had not seen that post. Have you ever looked at applying the dispesive discovery model to coal? The overshoot you propose looks somewhat like what has been happening with coal extraction in China since around 2005. China may see crashing coal production in 5 to 10 years and though this would be good from a climate change perspective due to higher coal prices worldwide, the economic consequences might be dire.
Dennis
As far as I can tell, data for discovery dates of coal do not exist. Lots of data on yearly coal production but nothing on discovery. So I can't really compare a model to anything.
From Water Resources Research Report
The farther back in history you go the cloudier the picture gets. The other complicating factor is in the grades of coal, anthracite, bituminous, and lignite, and making sure that the discovery data reflects the distinction. We all realize that burning lignite, which is only a few steps removed from peat moss, is really bad news.
A couple of people have asked me about this.
For better or worse, there's way too much coal in the world for us to run out soon (with the possible exception of China).
Heck, Alaska alone likely has somewhere between 2T and 5T tons of coal!
Dude,
You may want to read this about coal.
http://www.energybulletin.net/node/48240
"The U.S. almost certainly does not have a 250-year supply of coal. The nation will be fortunate if its coal supplies can stretch for another century. And even if the U.S. continues to use coal at current levels of output — which is unlikely in the face of the looming political controls on carbon — the supply issue will almost surely come to a head in as few as 10–20 years."
Nick is just some sort of techno-fantasist, don't mind him. I probably have 20 years worth of fissionable materials miles below the surface under my house. It doesn't mean they will ever be extracted.
I think that the proportional extraction rate from known reserves is the key metric when evaluating resource depletion. I don't think conventional crude oil has ever dipped below about three percent extraction rate per year since oil was first discovered. Remember, this is extraction based on known reserves, and so we use a sufficient amount of effort to exploit what we think is available.
If certain resources show fractions of a percent, we have to consider them differently. So we know that there is a lot of uranium in sea-water but we don't expend anywhere near the proportional effort to exploit it because of the futility of the endeavor. Due to human greed, the extraction rate is a measure of the easy exploitability of a resource, somewhat complementary to EROEI. I think its kind of a different take on resource depletion.
So we know that there is a lot of uranium in sea-water but we don't expend anywhere near the proportional effort to exploit it because of the futility of the endeavor.
There is a basic paradigm that's useful here: "feasibility" vs "competitiveness". In most industries a very small cost difference can make you uncompetitive. That means that slightly higher cost solutions will be avoided, which can give the impression that those solutions are higher cost than they are. On the other hand, if changes in the business environment (or natural environment!) change the costs of alternatives for everyone, suddenly alternatives can become acceptable in that industry.
So, for instance, recycled materials are in general slightly more expensive than virgin materials, plastic included. But, if oil becomes more expensive then recycled materials may suddenly become the standard. If something can be recycled with only 10% loss at each generation, that can reduce the consumption of virgin materials by 90%, with only a very small additional cost for the industry.
Similarly, electric vehicles cost more than internal combustion engines fueled by dirt cheap gasoline. But, they don't cost any more than ICEs when gasoline reaches $3 per gallon, a level we only reached relatively recently.
So, we have to "think outside the box", and consider that we could have whole industries that eliminate oil entirely, at a cost which is surprisingly affordable.
We are talking about oil here which has the high extraction rate. What is the extraction rate of coal from known reserves?
Oil is unusually well explored. Coal reserves, like those for many other minerals, are not well understood. Alaska, Indonesia (IIRC) and Australia have enormous amounts that have not been quantified.
What did you think of what I said about there basic paradigm: "feasibility" vs "competitiveness"?
Alaska also has a lot of peat moss buried under the tundra. Big whoop.
On the one hand, there's a lot of stuff that can and will be burned to generate power, if needed. We often dismiss "oil shale" as a source of oil, but it's an enormous source of easily burned fuel for electrical generation.
On the other hand, there's 150B tons of coal in the Illinois Basin, that's easy to find and burn - it's only problem is a slight cost penalty (about 2 cents) for sulfur scrubbing.
We aren't going to run out of things to burn any time soon.
I think that the proportional extraction rate from known reserves is the key metric when evaluating resource depletion.
I would disagree. Who cares how fast we use up reserves, what matters is how fast we convert from the resource category into the reserve category and the size and availability of that resource. Who cares what happens to be economic under some arbitrary set of conditions this year or next? Humans can effect that by simply choosing to use less one afternoon, but human behavior does NOT change the size of the resource base available for conversion into the more useful category of reserves.
Decisions on the amount to extract are based on the best estimates of available amount, i.e. reserves.
This is pretty obvious to any capitalist businessman. If he knew he was sitting on a 100 million barrel field he would take advantage to the greatest possible extent. If he had confidence that it was only 1 million barrels, he would likely set his sites lower. Even if the site actually contained 1000 million barrels he would plan for that; if he didn't have confidence that it was a lot higher he wouldn't risk it. This is just basic logic and common sense, and that is all I ever do in my models.
If we are confusing what is meant by reserves, it doesn't matter. These are abstractions that play roles in the oil shock model and they exist whatever the definition really is.
If we are confusing what is meant by reserves, it doesn't matter. These are abstractions that play roles in the oil shock model and they exist whatever the definition really is.
Yeah, tell that to the bank, see how much money they loan you to drill your next well. "Don't worry about those pesky definitions of reserves before you loan me the money, just look at this here model I built which says economically recoverable is just an abstraction."
Sorry, but there are more than a few people who devote more effort than even I find reasonable to sorting these issues out, and for the world which exists outside of mathematical models, those definitions really, really matter. You and I can argue abstractions forever, but there is a reason for why these issues "matter".
You misunderstand what modeling is about. I am describing what happens in the real-world via the model-based analysis. The model isn't being used to drive the business. How could it? I am the only one that has developed this particular model and I am not in the oil business!
You misunderstand what modeling is about.
Yeah, what do I know about models....silly me....
:>)
That's an interesting discussion of Alaskan coal - It'll be interesting to reconcile it with other sources.
On the other hand, this article makes unrealistic assumptions. Take the following:
The Coal of the Interior U.S. - Despite how it appears on the map, the interior region of the U.S. (Illinois, Arkansas, Indiana, Kansas, western Kentucky, Louisiana, Mississippi, Missouri, Oklahoma and Texas) produces the least amount of coal of all the nation’s producing regions. The Illinois Basin boasts large reserves of bituminous coal, but production has dropped there since the mid-1990s. Coal from that region generally has high sulfur content (3–7%), so according to the U.S. Clean Air Act it cannot be burned, absent expensive pretreatment and combustion cleansing.
Yes, sulfur is a problem. OTOH, sulfur scrubbing costs at most about 2 cents per kWh. That won't stop high sulfur coal from being used if it's really needed.
Similarly, no one realistically believes that "looming political controls on carbon" will succeed if coal were essential to the economy. I think that coal won't be essential, but if it were, it would be used.