Oilwatch Monthly February 2010
Posted by Rembrandt on February 24, 2010 - 10:20am in The Oil Drum: Europe
The February 2010 edition of Oilwatch Monthly can be downloaded at this weblink (PDF, 1.24 MB, 33 pp).
The Oilwatch Monthly is a newsletter that is available free of charge with the latest data on oil supply, demand, oil stocks, spare capacity and exports.
Below the fold is an executive summary, subscription form, and latest graphics. For much more detail and a country by country profile, download the .pdf.
Subscribe to receive Oilwatch Monthly by e-mail
Latest Developments:
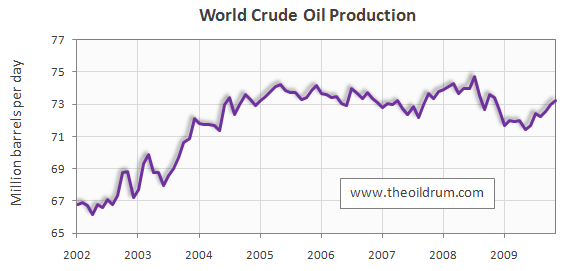
1) Conventional crude production - Latest figures from the Energy Information Administration (EIA) show that crude oil production including lease condensates increased by 283,000 b/d from October to November 2009, resulting in total production of crude oil including lease condensates of 73.22 million b/d.
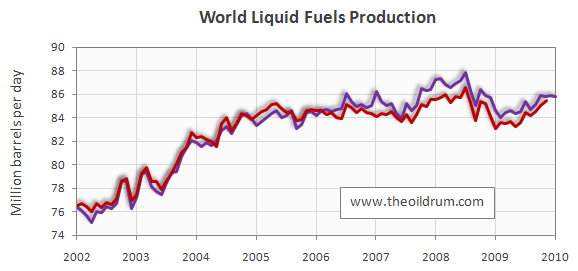
2) Total liquid fuels production - In January 2010 world production of all liquid fuels decreased by 40,000 barrels per day from December according to the latest fgures of the International Energy Agency (IEA), resulting in total world liquid fuels production of 85.83 million b/d. Liquids production for December 2009 was revised downwards in the IEA Oil Market Report of February from 86.17 to 85.4 million b/d. Average global liquid fuels production in 2009 was 84.94 versus 86.6 and 85.32 million b/d in 2008 and 2007.
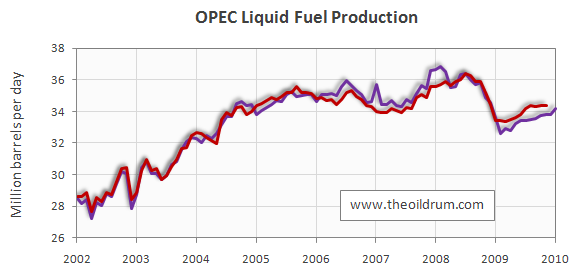
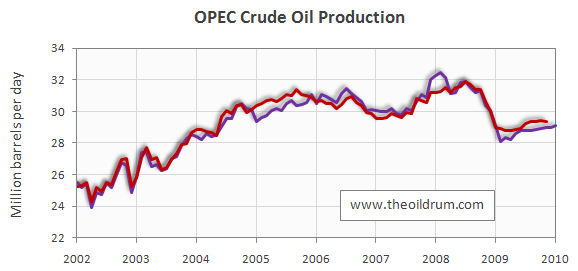
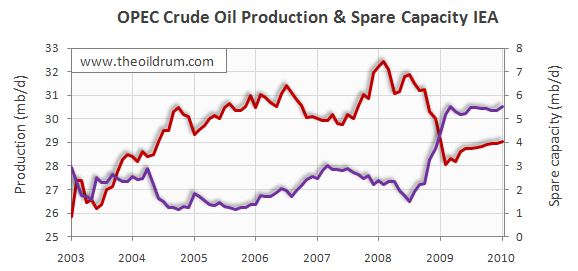
3) OPEC Production - Total liquid fuels production in OPEC countries increased by 410,000 b/d from December 2009 to January 2010 to a level of 34.2 million b/d. Liquids production for December 2009 was revised downwards in the IEA Oil Market Report of February from 34.21 to 33.79 million b/d. Average liquid fuels production in 2009 was 33.7 million b/d, versus 36.09 and 35.02 million b/d in 2008 and 2007 respectively. All time high production of OPEC liquid fuels stands at 36.4 million b/d reached in July 2008. Total crude oil production excluding lease condensates of the OPEC cartel increased by 100,000 b/d to a level of 29.05 million b/d, from December 2009 to January 2010, according to the latest available estimate of the IEA. Crude oil production for December 2009 was revised downwards in the IEA Oil Market Report of February from 29.05 to 28.97 million b/d. Average crude oil production in 2009 was 28.7 million b/d, versus 31.43 and 30.37 million b/d in 2008 and 2007 respectively.
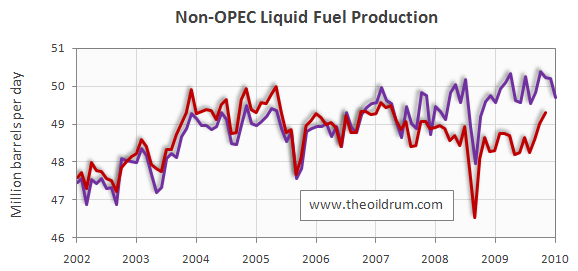
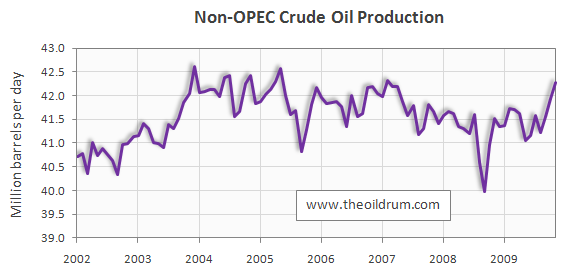
4) Non-OPEC Production - Total liquid fuels production excluding biofuels in Non-OPEC countries decreased by 495,000 b/d from December 2009 to January 2010, resulting in a production level of 49.71 million b/d according to the International Energy Agency. Liquids production for December 2009 was revised upwards in the IEA Oil Market Report of February from 50.17 to 50.2 million b/d. Average liquid fuels production in 2009 was 49.67 million b/d, versus 49.32 and 49.34 million b/d in 2008 and 2007 respectively. Total Non-OPEC crude oil production excluding lease condensates increased by 335,000 b/d to a level of 42.26 million b/d, from October to November 2009, according to the latest available estimate of the EIA. Crude oil production for October 2009 was revised downwards in the IEA International Petroleum Monthly of February from 42.11 to 41.93 million b/d. Average crude oil production in 2009 up to November was 41.55 million b/d, versus 41.32 and 41.80 million b/d in 2008 and 2007 respectively.
5) World Oil Production Capacity - Total oil production capacity in January 2010 increased by 85,000 b/d from December 2009, from 89.36 to 89.45 million b/d. World production capacity is measured here as the sum of world liquids production excluding biofuels plus total OPEC spare capacity excluding Iraq, Venezuela and Nigeria.
6) OPEC spare capacity - According to the International Energy Agency total effective spare capacity (excluding Iraq, Venezuela and Nigeria) increased from December 2009 to January 2010 by 17,000 b/d to a level of 5.54 million b/d. Of total effective spare capacity, an additional 3.80 million b/d is estimated to be producible by Saudi Arabia within 90 days, the United Arab Emirates 0.40 million b/d, Angola 0.21 million b/d, Iran 0.30 million b/d, Libya 0.18 million b/d, Qatar 0.10 million b/d, and the other remaining countries 0.55 million b/d.
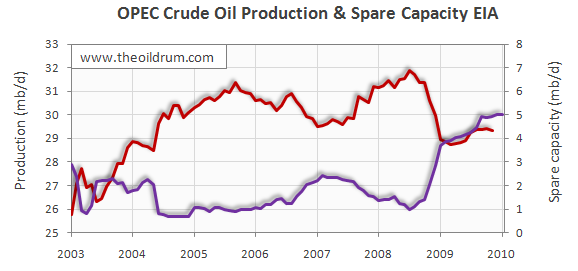
Total OPEC spare production capacity has not yet been updated for January 2010 by the Energy Information Administration at the time of writing. In December 2009 spare capacity increased by 10,000 b/d to a level of 5.03 million b/d from 4.93 million b/d in November according to the Energy Information Administration.
7) OECD Oil Consumption - Oil consumption in OECD countries decreased by 697,000 b/d from October to November 2009, resulting in a consumption level of 43.51 million b/d. Average OECD oil consumption in 2009 up to November was 43.80 million b/d, versus 46.10 and 47.68 million b/d in 2008 and 2007 respectively.
8) Chinese liquids demand - Oil consumption in China decreased by 840,000 b/d from October to November 2009, resulting in a consumption level of 8.14 million b/d according to JODI statistics. Average oil consumption in China in 2009 up to November was 8.03 million b/d, versus 6.92 and 7.29 million b/d in 2008 and 2007 respectively.
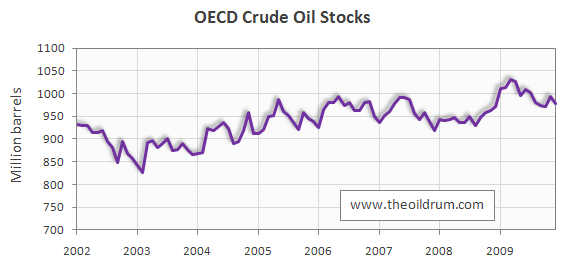
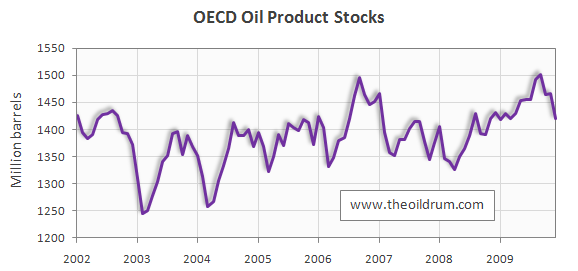
9) OECD oil stocks - Industrial inventories of crude oil in the OECD in December 2009 decreased to 979 million from 994 million barrels in November according to the latest IEA statistics. Current OECD crude oil stocks are 16 million barrels higher than the five year average of 963 million barrels. In the January Oil Market Report of the IEA a total stock level of 984 million barrels was tabulated for November which has been revised upwards to 994 million barrels in the February edition. Industrial product stocks in the OECD in December 2009 decreased to 1420 million from 1467 million barrels in November according to the latest IEA Statistics. Current OECD product stocks are 16 million barrels higher than the five year average of 1404 million barrels. In the January Oil Market Report of the IEA a total stock level of 1466 million barrels was tabulated for October which has been revised upwards to 1467 million barrels in the February edition.
Personnel
Editors
Contributors
Peak Oil Primers
Archives
- November 2010 (3)
- October 2010 (6)
- September 2010 (4)
- August 2010 (7)
- July 2010 (6)
- June 2010 (7)
- May 2010 (2)
- April 2010 (8)
- March 2010 (4)
- February 2010 (6)
- January 2010 (3)
- December 2009 (5)
- November 2009 (8)
- October 2009 (12)
- September 2009 (6)
- August 2009 (5)
- July 2009 (11)
- June 2009 (8)
- May 2009 (16)
- April 2009 (10)
- March 2009 (7)
- February 2009 (10)
- January 2009 (15)
- December 2008 (9)
- November 2008 (9)
- October 2008 (9)
- September 2008 (13)
- August 2008 (10)
- July 2008 (14)
- June 2008 (23)
- May 2008 (16)
- April 2008 (12)
- March 2008 (16)
- February 2008 (9)
- January 2008 (13)
- December 2007 (13)
- November 2007 (16)
- October 2007 (22)
- September 2007 (8)
- August 2007 (9)
- July 2007 (16)
- June 2007 (8)
- May 2007 (7)
- April 2007 (7)
- March 2007 (10)
- February 2007 (10)
- January 2007 (12)
- December 2006 (9)
- November 2006 (15)
- October 2006 (4)
- September 2006 (5)
- August 2006 (5)
- July 2006 (9)
- June 2006 (5)
- May 2006 (10)
- April 2006 (9)
- March 2006 (13)
Vital Trivia
License

This work is licensed under a Creative Commons Attribution-Share Alike 3.0 United States License.
Thanks again for this report--I always look forward to it.
And thanks for putting the crude chart (rather than the liquids) up top. Just a glance at the chart from the linked report that shows total liquids along with total liquids minus biofuels shows how far including biolfuels skews the data since, given its low EROEI, counting biofuels is essentially double counting.
I notice that most of the recent increase in crude production is from non-OPEC sources. Any ideas what country or countries are primarily responsible?
Anyone care to guess how long this upswing in production might last? Will it test earlier peaks in production any time soon?
For 2009 compared to 2008 as a whole, I think Russia, the US, and Brazil have all contributed to the uptick in non-OPEC production, with the US actually being the biggest contributor.
According to the EIA, the amounts in thousand barrels of oil per day are
Country 2008 2009 increase
Brazil__1,812___1,946__134
Russia__9,357__9,484__127
USA__4,950___5,296__346
Non-OPEC total__41,207__41,207_41,551__344
So the US increase is pretty much equal to the Non-OPEC total increase. The US increase has come from some new wells coming online in the Gulf of Mexico, and also Bakken production increases.
I work in the industry and follow several of the independent producers. One thing I have noticed is that many of these companies are now focusing on more oily unconventional shale plays. The Bakken is the big one, but they seem to be working on proving up others. The Niobrara shale in NE Colorado and SE Wyoming seems to be getting a lot of attention. EOG has a position that I think they call the Barnett Combo that must be in the oil leg of the Barnett shale. The Eagleford shale in South Texas also seems to be getting a lot of attention lately because it has a lot of liquids associated with its gas (higher BTU content gas). There are lots of potential shale's out there and many of these companies are focusing on the ones with higher liquids content because natural gas prices are weak (partially because of the success of all the shale gas plays).
Another oil play that must be pretty significant, but does not get the attention that the Bakken does is the Spraberry (now called Wolfberry) in West Texas. The Spraberry was once considered the biggest un-economical oil field in the world, but of course that has changed in the last four or five years, and consequently, there have been thousands of wells drilled in this play over that time.
Obviously the Spraberry is not going to bring Texas back to its original peak production (as I am sure "westexas" will point out if I don't) and obviously all of these shale plays won't bring the US production back either, but as the recent data suggest these plays must be making a dent.
Thanks for the update!
What do the new oily shale producers do with the natural gas that comes with the oil? Wait until pipelines are built? Flare it? I understood the oil was being moved by trucks from Bakken.
I know that getting oil out of North Dakota has been a problem for several years now. Some has been trucked, I think they have increased pipeline capacity out of the area, and I think EOG has set up some kind of rail transportation. I also know that gas gathering has been a definite problem there. I am pretty sure that quite a bit of the gas was flared, which is kind of hard to believe in this day. From listening to some of EOG's conference calls it sounds like they have worked with mid-stream companies to put in a new gathering system. I am sure you could listen to Whiting's conference call today and learn more.
I think the other oily shale plays will generally be closer to existing gas gathering systems. I am sure there is existing infrustructure in NE Colorado that companies can tie into for the Niobrara, although it will probably require more investment in SE Wyoming. In EOG's Barnett Combo play they probably tied right into the gas gathering systems for all the Barnett gas wells. I have heard in south Texas that Anadarco is working to expand the gas gathering for their Eagleford wells. I think it is a standard procedure for all the new shale plays oily or dry gas. I know all the recent Wolfberry activity has associated gas production that is tied into existing gathering systems.
In general I would think that all the associated gas production from these plays will just put further downward pressure on gas prices. It is probably not a great time to be an owner of marginal Rockies gas production.
The way that I have put it is that there is a big difference between oil companies making money in post-peak regions and making a material difference, i.e., bringing production back up to or above a prior production peak. Consumers confuse the two at their peril.
I was surprised by the Texas data; production has been effectively flat since 2004. Oil accounted for 38% of well completions, a big number considering all the drilling for gas. Top 25 fields and RRC districts for 1999. Leanan linked this FT piece yesterday: Interest grows in transferring shale gas success to oil | FT Energy Source | FT.com Not much of substance in the article though, and the author didn't know the diff between Bakken type plays and extraction of kerogen...amateurs!
RRC Monthly Drilling, Completion, and Plugging Summaries
Texas oil production, for the second time since we peaked in 1972, showed a year over year increase in 2008, from 0.92 mbpd in 2007 to 0.95 mbpd in 2008, versus a 1972 rate of 3.45 mbpd. So, the 1972-2007 rate of decline was 3.8%/year, which fell slightly to 3.6%/year for 1972-2008. In percentage terms, 2008 production was 72% below the 1972 rate, while 2007 production was 73% below the 1972 rate.
And your point is? Texas accounts for 21% of the US total, staving off declines has done much in the last 5 years to address our import/export balance.
I'm not denying that this isn't a permanent fix to the FF problem, or that the US has declined a great deal since its peaks; but something like "shale oil" has potential to make the global decline more gradual, assuming it can be widely implemented in the first place. Aside from that I simply found it interesting.
I vote that we call it "shale oil" drilling, too, so that the MSM will be slightly less confused/misinformed. Like the drilling itself that's a problem with no solution, of course...
This is my latest graph:
http://www.crudeoilpeak.com/?p=1149
Dohboi, May was the low month for Non-OPEC in 2009 but since August to November Non-OPEC has gained 1,050 kb/d of production. In both May and August there was a lot of downtime in the North Sea due to maintenance. The big gainers since then, in thousand barrels per day were:
What makes this gain look so dramatic was there were no big losers during those three months. Those with the largest losers were:
No, earlier peaks will not be tested. I don't expect this gain to last very long. December will be flat to perhaps down slightly and January, according to the IEA, will be down a bit further. Russia and the USA reached their post Katrina peaks in November and December respectfully. Both will be flat to down in 2010. Norway the UK and Mexico will resume their downward trends in 2010.
I expect the first quarter production from Non-OPEC producers to be pretty flat then turn down rather steeply in the spring and summer when the North Sea shuts down a lot of production for maintenance. But when they all come back to full production they will still be well below the last quarter of 2009 and the first quarter of 2010.
Well, that is my opinion anyway. I track Non-OPEC producers very closely and, I believe, I have a pretty good handle on what is happening there. Well, pretty good for an someone with no inside information anyway.
Ron P.
Not bad, Ron. It looks like we're wringing out the last drops from US sources now. How rapid is the decline predicted (if it is) from US fields? How long will the US remain at its current levels?
Craig
All the gains come from new projects in the GOM. The new production peaked in December. The decline, I believe, will begin in a couple of months. We will be back down to 5 mbd by the middle of next year and the decline will be pretty slow from then on. But that is just my opinion of course. The shale plays will not be enough to make a noticeable dent in the numbers.
Ron P.
You nailed it pretty good Ron. Current rate is a combination of the old heritage fields and the new DW GOM. As you point out those DW fields will decline fast but also won't have any "striper" phase: operating costs are just to high to support it in the DW. The old fields average less then 10 bopd and will continue their rather low decline rate. But the are a lot of those old wells operated by ma&pa companies that can make a decent living doing so.
The disconcerting thing is that while US production has been increasing lately, proven reserves are falling fast. If I read the EIA web site correctly, production has increased to nearly 5.5 million barrels per day, which is 2 billion barrels per year, while reserves fell to just over 19 billion barrels.
It's less than 10 years of reserves in the ground. That's not very good. I don't think the cornucopians realize what is going on.
It's like owning a store and thinking you're making a lot of money because sales are so good, when what you are really doing is selling off all the stock below cost without putting any more into inventory. (That's a classic way for a small business to go bankrupt).
Yell louder Rocky...I don't think Joe6Pack heard you. Oh..yeah...he did...19 billions barrels. Party on!!! J6P knows that billions is a very big number.
Frustrating, ain't it? I had not been think about it but the low decline rate of the old fields might be one of the biggest problem with getting folks to appreciate PO. A low decline rate but a decline towards zero none the less. And there's no possible way to explain to them how absolutely unreplacable these fields are. As you say, a warehouse full of inventory you're selling like hot cakes is great for cash flow. And when the hoppers are empty?
Old oil patch joke down here: why do you pay you Cajun hands weekly and not monthly? Because they would starve to death the last three weeks. Cash that pay check and it PARTY TIME!!!. A week later and they're broke.
If a steep decline is near and inevitable, why are they pumping oil at all? It's not rational. Or perhaps the people who actually own the assets have a different supply/demand outlook.
Does "Joe Sixpack" own oil assests and is just living for beer money?
dc -- As one of those "oil pumpers" I can offer you the very simple answer: to make a profit. The oil industry runs on the free market concept. We invest in drilling to make a profit. We are not responsible for the energy security of the US. We are not responsible for conserving our resources for future generations. Those smarmy adds from Chevron et al are just PR for the masses. And yes, J6P often owns those oil/NG mineral rights. And they are almost always very happy to lease to us. Then when that "mail box" money shows up every month they can run down to the liquor store and refill their ice chests.
You want this country's resources managed in a thoughtful and long term mind set write a letter to your congressman. They have the power to enforce such business practices. Unfortunately, J6P, as well as most of our citizens, won't re-elect politicians who try to steer them away from BAU. As I said the other day, we ain't your mommy. Don't whine to us. We follow the same financial principles as every other business in this country. And as well as those of 99.9% of the citizens. When was the last time you chose an investment with a lower rate of return because "it was the moral thing to do?"
I know it sounds harsh dc but that's the bottom line.
Thanks, Rembrandt!
OPEC's production has been surprisingly flat, it seems like. Either they are showing amazing restraint at not raising production in the light of higher prices, or they really can't. I know they are not down to the original quota amount. It is non-OPEC that seems to account for increases, to the extent they have happened.
It looks like OPEC's production could be as much as 5 million barrels a day higher though - look at the spare capacity graph
If the demand was there, daily production could exceed the previous record according to this data
Raindog, I am unsure whether you are really serious or just being sarcastic. OPEC, all OPEC, was producing flat out in July of 2008 when oil prices hit an all time high. They are currently producing 2.48 million barrels less. Since then there have been some additions come on line but likely just as much, if not more, decline.
Saudi Arabia brought Khurais on line but their old fields are declining at an alarming rate. Saudi Arabia
Five OPEC nations are still producing flat out, at or higher than they produced in July 2008. In fact Angola reached a new all time high last month (January 2010). If all OPEC nations were to start producing flat out I doubt seriously that combined, they could exceed the level they reached in 2008. In fact I think they would be producing considerably less.
The spare capacity figures by the EIA and the IEA are pure fantasy.
Ron P.
With respect to your whole reply Darwinian.
.... Well, that's the question, isn't it.
And please understand I am most assuredly in the post-peak camp. But there is always that nagging possibility that this peak isn't quite The peak. :)
I have no way to judge whether this data is correct or not. But let's assume that by shutting in 3 million barrels a day and producing 9 million instead of 12 million that the Saudis can keep the price around $70 instead of $40. 9 million x $70/barrel = $630 million while 12 million x $40/barrel = $480 million. I think I would do that if I were them. They produce less but make a whole lot more money. Less work for more money wins for me every time. I find it plausible. They aren't stupid. 70 is cheap enough that most other fuels can't compete but high enough to make a boatload of dough.
Raindog, it is obvious that OPEC did cut production in the fall of 08. They initially cut 3 million barrels per day. Since their cuts bottomed out about .6 mb/d has been added so they are producing about 2.4 mb/d below their peak of July 08. My point was that this is the absolute maximum of their spare capacity, not 5 mb/d.
They are not producing 9 mb/d. They are producing just a tad over 8 mb/d and there is not a snowball's chance in hell that they can produce 12 mb/d. In fact according to the Joint Oil Data Initative database, (JODI) they are producing less than 8 mb/d.
There is strong evidence that their old fields are in steep decline. This fact was released by an Aramco Vice President in 2005. (See my link above.) Khurais has made up for some of that decline but that new production, along with Manifa in 2013, can only delay the inevitable.
Ron P.
OK then 8 million/day x $70 = $560 million/day while 11 million/day $40 = 440 million/day. It still works for them.
You may be right that they could not go to 11 or 12 and that the shut-in production is less than what is stated. Then again, maybe you aren't right and they could do that if they had to. Even if they couldn't do it today that doesn't meant they couldn't do it next year. We don't know (and I think that is just how they like it!).
The point is that it would be sensible for them to shut in production if that 3 MMBOD is enough to keep the price at 70 instead of 40 so their stated position is plausible.
I used to read this site a lot but I have become convinced that any meaningful peak in energy supplies is at least a decade or two away. Shale gas will bail us out for a while and a lot of oil is economic at $75-100/barrel that doesn't work at $40/barrel. The Saudis still have an operating expense of around $3/barrel and haven't really touched any oil that is more expensive to produce and they probably have a lot of that. The Bakken doesn't work at less than $50-60 nor does the oil offshore Brazil or the Alberta oil sands. But all of that becomes available in a world of high oil prices.
Raindog, we are not nearly as ignorant about Saudi's ability to produce as you seem to think. We do have it from the horses mouth, or at least an Aramco Vice President, that their existing fields are declining at a rate from 5 to 12 percent. (An average of 8 percent.) Here is the link again. Saudi Arabia The statement is in my blockquote in my original reply to you. However Aramco claimed, in 2006, to have gotten that 8 percent decline rate down to almost 2 percent with new drilling in those old fields. Saudi Arabia’s Strategic Energy Initiative: Safeguarding Against Supply Disruptions
Saudi began drilling Horizontal Multiple Reservoir Contact wells in Ghawar, and all their other old fields, in 2002. This is how the they got their decline rate down from 8 percent to just over 2 percent. This of course, while lowering the decline rate would increase the depletion rate. That is they are simply sucking the oil out a lot faster. And there is reason to believe that the decline rate has increased again, perhaps higher than it was before these new wells were drilled. Since they are pulling the oil out a lot faster the decline rate would soon have to catch up and surpass the old decline rate.
For instance Saudi has anounced that they exploring in the Red Sea, under 2 kilometers of water and 7,000 feet of salt bed. And they are making plans to inject C02 in Ghawar in order to try to stem the swift decline. At any rate it must be admitted that speaking of dramatically increasing oil production while desperately trying to keep the decline rates of all their giant fields at below 8 percent, is absurd.
So let me repeat, we are not nearly as ignorant about Saudi's ability to produce more oil as you seem to believe. However if you choose not to read TOD because of you think Brazil and the Tar Sands and the Bakken Shale will bail us out, then so be it. However even the CEO of Brazil's Petrobras has a different opinion. Petrobras CEO: Peak Oil Production is Now
Ron P.
Didn't Petrobras contact TOD and clarify their position that they could not predict the peak in world oil extraction?
Floridian, I realize you are being sarcastic however... Everything is a guess. Some guesses are an educated guess. And some guesses are a lot more educated than others. And I am NOT being sarcastic.
Some of us here at TOD follow every news release and every official report very closely. And some of are watching what Saudi does not just what they say. And I believe a very educated guess as to their production capacity can be gleaned from all that.
Ron P.
The Oil Drum | Petrobras Shares Some Considerations in a Response
I think the concern is that Saudi Aramco may be just as self-deluded as Pemex was before Mexico's Cantarell field went into freefall.
Pemex put Cantarell on a massive nitrogen injection program to maintain production rates and thought they were doing wonderfully well until all the wells started producing nitrogen instead of oil.
Then they decided to drill up their #2 field, Chicontepec, as fast as possible to maintain exports, but have discovered it is not possible to develop it nearly as fast as they thought, and it is going to be a money-losing proposition even at current world prices. It won't be long before Mexico is a net oil importer.
The real fear I have is that Ghawar may turn out to be another Cantarell, and the other Saudi fields more similar to Chicontepec.
The world can afford to lose Mexico as a net oil exporter, but not Saudi Arabia.
The shale gas is also a critical piece of the puzzle which you didn't mention. And not only the Bakken, Oil Sands and Offshore Brazil, but many other plays that fall into the category of economic at $75-100 but not at $40. Reserve growth with higher prices is a key factor not taken into account by some.
When I say meaningful peak I mean a peak in energy supplies that is going to cause real long term distruptions in the way we live. Crude oil may peak sooner but could be at least in part replaced with gas for a few years anyway. So the meaningful peak is when the combination of energy sources peaks, not just peak oil.
Most of us here at TOD look at flow rates not reserves. The highest oil prices in history have not increased flow rates above those of 2005. We are at peak today and have been since mid 2004. The next big move will be south.
It would take 20 years and many billions of dollars to convert our transportation fleet to natural gas. Then natural gas filling stations would have to built everywhere. There are virtually none today. Peak oil is peak oil and that will be the meaningful peak!
Ron P.
Cars will eventually become more electrified and gas can be used to make electricity. Fleets such as cabs and buses could be pretty easily converted to natural gas and have been already in some cases.
Flow rates mean less than you might think. If the world is only demanding 85 million barrels a day why produce 90 million even if you can? All that will do is drive the price down. Production certainly would have gone higher when oil was 145 a barrel if the economy had not collapsed.
I still am certain that there is a finite amount of oil and that this will eventually be a problem - I just think the problem is a little further off in the future than you appear to think that it is.
Never mind, party on dude.
Alternative Fueling Station Locator. 827 CNG stations in the US, dispersed unevenly of course - Hawaii has none, Alaska 1, California 201; but they do exist. Others have discussed the refueling issues in exhaustive detail at dedicated sites like CNG FORUM if you want to investigate further.
You are confused. Flow rates are the key.
If there is spare capacity, oil production would have risen dramatically when oil rose above $100.
It didn't.
Therefore no spare capacity.
Higher prices were driven by demand and hence are the market's signal to produce more.
Hi Raindog,
The question is how much production can get out of these fields. What are plausible flow rates?
I dislike the Oil Drum's penchant for Apocalypse.
Nonetheless tar sands and these other unconventional oil plays are minor in importance.
You are not going to get 4, 6, 8, 10 or 12 million barrels a day out of these projects.
So high production is a sign that the end is near. Got it.
Dog -- looking at the non-OPEC production data it seems like there's really only two possibilities. With the non-OPEC producing every drop of oil they can we should be very thankful to OPEC for holding back and letting us reap the rewards of current high prices. And I do mean high. I doubt very little of the non-OPEC production was drilled years ago with such expectations. It shows remarkable (and highly uncharacteristic) discipline on their part. Of course, holding back production and supporting higher prices certainly doesn't help the world economy to recover. Which should be a goal of OPEC that would allow a return to BAU and thus increasing demand for their crude. If this is the explanation then as a domestic producer of oil I should really put these folks on my Christmas card list as an indication of my appreciation.
OTOH, maybe that estimate of spare capacity is a tad high. But I can offer one possible explanation for just the KSA to be holding back: they should be able to see the diminishing capabilities of other OPEC producers and foresee a day when the KSA alone controls the price of oil. Beyond the revenue aspect consider the political power they might have when that day comes.
The Jul08 peak to Jan09 trough in C+C was 3068.17 kb/d, for liquids 3475 kb/d, if you want to look at it that way - effective shut-in capacity at full. As Ron says we've gone back to utilizing some of that SC in the meantime.
Khurais Ph 2 was slated to come online last month - now press reports seem to imply that the whole shebang was fired up last year. Perhaps the phases were just shorthand for a long gradual buildup.
That's an interesting thought. It would imply the KSA may have a motivation in ensuring other producing countries either run out of any reserve capacity asap, or that they never reach full production capacity in the first place (IraQ - springs to mind)
I think the Saudis have had a pretty strong influence on the price of oil for quite some time. I read an article that actually attributed the fall of the Soviet Union to...Saudi Arabia. The story was that the Saudi's glutted the market with oil in the late 80s early 90s and basically bankrupted the Soviets who were eventually forced to ask for loans from Western Europe just to feed their citizens. The loans apparently came with strings such as leaving the Poles alone (this was the time of the Solidarity movement) and that eventually led to the collapse of the entire Soviet Union. This same period of low prices in the late 80s early 90s directly led to Saddam's invasion of Kuwait. AS the story went, he was bankrupted as well and wanted to have as much control over the oil price as the Saudis did and the combination of Iraqi and Kuwaiti production would have given him that or something close to it. Of course we did not want Saddam to have that sort of power so we all know how that went. Fast forward ten years and we invaded Iraq for reasons that aren't entirely clear but one of the most plausible to me is that with the possible 6-8 million barrels a day that could come from Iraq the US might have some control over the price of oil. Having that control does give one enormous power to get one's way.
Saudi Arabia is a negative swing producer now. It couldn't produce enough in 2008 to stop oil prices from skyrocketing to $147 in July 2008. But they can still afford to decrease production to stop oil prices from dropping too much.
Read:
http://www.crudeoilpeak.com/?page_id=51
OK, that is just unnatural. The top 6 monthly contractions in US demand were as follows:
-14.96%
-12.27%
-12.03%
-11.83%
-11.18%
-10.11%
These were all in the 70s, when US demand was much more seasonal owing to greater use of heating oil. This latest cutback in China is only 10.7% - yet it barely registers on this graph! From that Dec '08 trough of 5444 kb/d they rose to an Aug 09 peak of 8932 kb/d - 3.488 mb/d. OK, are you sitting down? That's a greater chunk of consumption than is accounted for by the entire continent of Africa.
Of course an awful lot of this must be government stimulus at work. Note this graph of Chinese electrical demand, h/t manolo over at Early Warning:
China: The Mother of All Black Swans?
As was widely reported, the trough in Summer of 2008 was due to the government restrictions aimed at improving air quality during the Olympics. (Yes, it certainly was unnatural.) I'm not sure that the spectacular rise seen thereafter should be attributed more to government stimulus than to a resumption of the prevailing trend; probably both are involved. Nonetheless, your points about the scale of the changes are well taken.
Here's what Wiki says:
2008 Summer Olympics - Wikipedia, the free encyclopedia
What percentage of overall Chinese demand is wrapped up in Beijing's drivers and backhoes? It all seems a bit too steep to be accounted for, I should run some numbers on consumption in US cities. Might learn something about the extent of the recession in China as well.
Well Beijing is not China its a city. Equating significant changes in demand to the complex variation in fuel usage in Beijing before and during the Olympics is probably not correct. At the minimum one has to at least guess that overall fuel usage required to prepare for and hold the Olympics had to balance out against any air quality control efforts in the city.
I was actually in Shanghai right after 9/11 when Bush came for the APEC meetings. The city was basically shutdown think New York without a person on the streets or a car to be seen. I don't recall and great announcements about changes in oil consumption during this event so I can't imagine that the Olympics would either. Perhaps there is data that does show some significant savings I don't know however I don't recall anyone suggesting that Shanghai shutting down was having and effect on world oil prices.
Well obviously there's more at play here, Beijing is only 1.3% of the PRC population but vehicle ownership would be greatly skewed towards cities, of course. For the US I can find Oil Consumption statistics at StateMaster; but breaking it down further would take some work. Found this chart just now:
TABLE 2
Energy Consumption per capita, 2002
_____________________________________________________
Coal Oil Gas Electricity Total
(kg) (kg) (cm) (kwh) (kgce)
_____________________________________________________
Developed provinces
Beijing 1779 526 148 3064 3164
Tianjin 2909 671 64 2790 3001
Shanghai 2883 877 27 3974 3766
Jiangsu 1309 191 n.a. 1686 1302
Zhejiang 1295 267 n.a. 2186 1589
Shandong 1425 179 n.a. 1354 1216
Fujian 782 96 n.a. 1436 1007
Guangdong 846 250 n.a. 2148 1445
Developing provinces
Anhui 1054 49 n.a. 615 839
Guangxi 442 15 n.a. 740 618
Guizhou 1355 n.a. 14 1281 1165
Yunnan 774 n.a. 12 908 909
Shaanxi 939 192 38 1018 1011
______________________________________________________
From Energy consumption in China : past trends and future directions (pdf). So Beijing would account for 15.88% of this total, but these numbers would be short of the total I'm sure. Still, the stated 45% cut would amount to ca. 8%, not far off the mark. Throw in some recession and you're getting there.
Again your not balancing the increases from supporting the Olympics themselves. It was not a pure cut.
Like I said Shanghai was a ghost town I was there it was and unforgettable experience. Also probably one of the best fireworks displays in history ! I recall nothing about this effecting oil consumption. So offsetting your inner city cuts is and unknown amount of consumption preparing for and hosting the event. I don't agree with your math the total is lower in fact I'd not be at all surprised to see overall oil consumption increased.
Lets forget about China for the moment lets consider say Katrina or any other hurricane take your pick if you can get the numbers I suspect that the final difference in consumption averaged around the event is the same as if it did not happen or higher.
For a hurricane of course you would have to include the excess fuel usage before the event and afterwards for clean up and of course it makes sense to look for heightened usage even out to a year as people work more to make up for lost wages and of course pay for damages.
Similar economic conditions apply to Beijing and the Olympics almost certainly oil usage was increased before during and after the Olympics its really tough to believe that a cut actually had any long term effect even averaging over say a six month period or less.
Oil consumption shifted over a few months by and event is not conservation. I don't have proof but I'm not the one willing to make this argument as I don't see its useful i.e in all probability most local averages probably show overall consumption is actually higher. In general because in the end a significant amount of additional work was done either dealing with the disaster or the event and in preparing or recovering afterwards.
Its the logical fallacy of the the broken window adding to the GDP. Given that the argument suffers and intrinsic logical flaw why pursue it ?
If you think your right then plenty of examples exists if events radically altering consumption over a brief period of time pick one that has the data and see what the results are. On logical grounds alone the chances of it not being the same or higher is remote.
Or I blew it :)
Where did I imply that the Chinese were engaged in any form of conservation? I was merely drawing attention the staggering volume of consumption shifts they are displaying, and attempting to get a hold on how this is broken down by geographic region. I'm not after perfection; even for the US EIA data on product supplied only goes as far as PADD districts; that Statemaster data uses a broken link to a 2001 document. Chinese data is an order of magnitude lower resolution and reliability.
Since '02 PADD III consumption has averaged -0.07% month to month, -.027% since '05. The only advance into positive territory post-Gustav has been an anomalous 1.17% spike in Oct '09. This is total finished products I'm talking about. Sum of Sept '05 to Aug '06 = -4.04%, followed by four months of positive territory amounting to 3.43%. If that was recovery it lagged the disaster quite sharply, and as I said PADD III hasn't rebounded at all in the wake of the '08 hurricanes. Different patterns will show up for different products, of course.
I see base Crude Oil struggling at 73 to 74 mb/d over the last 4yrs. The growth I mostly see in the last year is ngl's and bioful. Even though biofuels graph looks exponential, I suspect that it will peter out eventually due to Leibeg constraints. So most of the growth in crude oil has been decscibed in other comments on this post. Its really non-crude fuels that are responding to price, mostly from OPEC.
It looks as though we will be able to chart prices in a band that is prescribed, pretty much, by EROEI and economic restrictions.
When prices drop below a certain level, looking like near $70/bbl, production drops off. That drives prices higher. When prices hit a certain level, looking like near $80/bbl, the economy grinds down (farther), and demand drops. That causes prices to fall, to that certain level...
What would seem likely is a gradual rise in that price band, and probably a narrowing of the price band, over time. Once the lines come together, as maximum production drops, prices will rise, demand will fall, and economies will fail. The only question is, how fast does all of this happen? And, what, if anything, could end it?
Craig
A related observation is that there is a price above which people are motivated to invest in alternatives, and can somewhat afford to do so, and there is a higher price above which so much economic damage is done that societies can't afford to invest in much of anything. If that band is too narrow we are in worse trouble than if it is wider.
What will end it? A necessary (though perhaps not sufficient) condition would be that petroleum ceases to be the largest source of energy for global civilization. The effects on the economy would also end if/when other sources of energy grow faster than petroleum declines. That's of course leaving out a lot of complicating factors...
Understatement of the year award :)
zaphod42:
This is a variation of the peak demand argument and actually probably the best version I've read so far. The claim is of course that prices will be stable where they are now for years if not decades. Extending this is the assumption that although prices won't go high the force of economic contraction aka falling demand somehow will spur alternatives to allow for growth.
I'd call it the Little Red Riding Hood economic model. Demand flexibility and underlying price support needed to spur production will result in a price thats just right for the current economy even if this means a bit of demand decline. However this demand decline is steadily building potential demand for alternatives like EV's that will allow the economy to begin growing again even as oil production declines.
Its certainly a very interesting model. And of course one can argue that currently the long term futures market support this model. The Saudi's with tons of spare capacity have the ability to manage oil supplies to support this fairy tale model via spare capacity thus it has to be true.
Now that was not a slip saying its a fairy tale model because thats exactly what it is. If anyone of the components that make up the model are false then the entire thing fails.
1.) 70-80 is a fair price and will spur development of new oil production to offset declines.
2.) Oil Demand is very flexible and retreats rapidly above a certain price point.
3.) Saudi Arabia has ample spare capacity and the price is high enough they will maintain it.
Well lets look at history.
1.) Oil prices rose from 30 a barrel to 140 over a number of years and production remained relatively flat even as prices increased.
2.) After the sharp fall in prices during the height of the financial crises they have risen steadily even as unemployment and a large range of economic indicators have remained weak to negative i.e a jobless recovery. Also looking at the report supposedly oil production has steadily increased. No matter how you slice and dice it the truth is that OECD demand changes have had little effect on prices through most of the time period. Attributing the price collapse to intrinsic demand in the OECD is simply wrong. Fear of the end the world drove prices it was not a rational price change related to supply and demand. Rational if you think we are headed for the stone age but not rational if you thought we would survive. Of course once it was clear that the world was not coming to and end then price rose. Of course it takes time for smashed markets to recover and of course in the midst of the crises it just so happens that production exceeded demand allowing substantial quantities of oil to be stored that would later help temper the price increase.
Of course it just happened to work that way right ? So now back to demand well at no point in the progression of events has OECD demand clearly been a driving factor in oil prices. Its not to date and probably not in the future regardless of what its real level is. Economic crisis in the OECD shaking the foundations of our economy certainly can and will have and effect on prices in the future but the next time around it could just as easily be a rapid devaluation of their currencies as they are no longer seen as a safe haven.
3.) Saudi Arabia has not once in almost a decade convincingly increased production to a level that had any long term impact on oil prices. The one exception is perhaps continuing to pump oil beyond the level needed for the shocked demand during the crises resulting in a build in offshore storage before finally perhaps cutting back to "support" prices. Certainly I think there is some truth in that how much as unknown. My best guess is the sequence of events was actually different as prices rose over 70 they actually started storing oil taking it off the market spurring even higher prices than would have naturally occurred then only after the US just happened to spark the banking crises with its meddling later in 2008 and problems where starting to mount did they release the stored oil back on the market driving down falling prices even further. So yes I think they did flood the market but the sequence is obviously important.
I've included my counter arguments for the fairly tale model simply because its become so common few look at alternative explanations.
But even without my own interpretation its I think obvious that at no point did the model work with all its criteria met. Its been incorrect since its inception. You don't have to consider alternative explanations to prove its false since the published facts don't support the model.
And last but not least I say published facts because at some point I'd assume that the fact that oil prices are touching 80 right now simply does not square with whats reported in this article. At some point one has to think that blaming speculators betting on a rapid recovery will ring hollow and just perhaps its time to consider that there might just be a small chance that the truth is different from the "official" facts ?
I guess oil is going to have to hit 100 a barrel with all the official numbers claiming everything is over the 5 year averages and plenty of spare capacity from OPEC before people finally wake up and consider that things might not be as claimed.
To a large extent I don't really care people can believe in fairy tales it makes no difference however if I'm even close to right about what the real situation is at some point and not to far out into the future the fairy tale will be forcefully unmasked as the lie that it is. Care to guess the price of oil if we have such a rude awakening ?
Thats one of the most beautiful things about the real world and that is eventually if your lying the lies catch up with you and you have to pay the piper. From a larger perspective the US has lied to the world for almost 50 years thats obvious looking at our various imbalances. Sure we "got away" with it but in the end we are going to pay. Oil is no different and in fact since its a consumable commodity the length of time you can bluff is much shorter. We are not in a fairy tail economy but on the verge of the biggest margin call in history. My opinion is oil will be one of the first but its not the last by a long shot as we have 50 years of IOU's to deal with and once the margin calls start they are not going to stop.
Looking back at the past then 140 dollar oil and the financial crises was nothing more than a warning or tremor the earthquake is coming.
Nothing been fixed nothing works the current theories about are economic situation are bogus etc etc. The chances of the real situation with oil being as claimed are zero. When faced with the warnings in 2008 all we did was double done split and double down again moving to a command economy model to hide the losses aka Soviet style. You want to play Soviet economy fine but your going to eventually play the final round of that game and we know how that ended. Realistically however thats not the game we are playing certainly its inspired by the Russians but its called Roulette.
memmel---you always create a narrative in your commets.... you have some plot lines that certainly seem plausible enough...there is a certain drama there. I don`t mean this as a snide way of saying your comments are too creative or way out.
Seriously, there are some excellent writers on this site (I think you all know who you are out there) and I think you all should get into the book business A.S.A.P. There is a desire--whether consciously recognized or not---to know about this, so I think that PO/energy related/inspired stuff should do well. It doesn`t have to be openly about the topic. It can be a disguise type of thing!
Recently there was a complaint by someone on TOD that it`s hard to tell people face-to-face about PO--we Cassandras get all kinds of grief, hassles, tears, bad treatment, veiled hostility the cold shoulder. True enough! So---to all of you---why not write about it in one way or another? Fiction/non fiction/ editorials/journalism/cartoons/TV/lowbrow/highbrow/ whatever you`re good at! Find places to publish...of course the I-net works for a start.
No I am not a literary agent but I play one on the Internet!
I agree that things are not going to go smoothly down the slope. At some point all those cement buildings and roads are going to block "progress" and they are going to be tough to take down without cheap oil. Recently I`ve found myself mentally sizing up buildings and thinking "how many tons of cement? How long to take away without machines?" I don`t want to keep thinking "we`re in for a lot of trouble!" but it is impossible to avoid that thought.
psssst. Something is brewing.
They plan on slapping a limit to the length of posts and grammar checker ?
Disaster !
Actually my dad wrote a really cool book.
http://www.amazon.com/Louisa-Richard-Emmel/dp/0978656733
Its about a slave girl in new england really powerful stuff. It draws on some of my own family history which is very tragic.
And I might as well add this in since this is obviously personal.
http://www.arkansas-cares.org/
You reading way too much into the data.
All data has a stochastic component. You're confusing noise with signal.
Global Cumulative Crude Oil Production Versus US Oil Prices
2002-2005 & 2005-2008 (EIA, crude + condensate)
Here are the average global crude oil production numbers per day by year, versus average annual US spot crude oil prices:
2002: 67.16 mbpd & $26
2003: 69.43 mbpd & $31
2004: 72.48 mbpd & $42
2005: 73.72 mbpd & $57
2006: 73.46 mbpd & $66
2007: 73.00 mbpd & $72
2008: 73.71 mbpd & $100
Relative to the 2002 production level of 67.16 mbpd, in the following three period, 2003-2005 inclusive, the cumulative three year increase in production was 5,164 mb, versus a three year increase in oil prices of $31.
But then we have the 2006-2008 data.
Relative to the 2005 production rate of 73.72 mbpd, in the following three year period, 2006-2008 inclusive, the cumulative three year decline in production was 632 mb, versus a three increase in oil prices of $43.
The numbers that I look at are:
- growth rate of China consumption
- growth rate of OPEC consumption
- OECD decline rate
- global capacity production rate
the top two are about 5 point something over the past 5 years. Pretty steady lets say 5.5% growth, and lets throw in India and misc Asian countries (Viet Nam etc)
so we get
- China plus Asia at lets say 10 MBD growing 5.5
- all OPEC at 6 MBD growing at 5.5
so total of 16 MBD growing 5.5
- OECD decline rate overall 5 year average hmmm... 2 %?
- global capacity production, based on megaprojects, will decline about 1.5 MBD
put it all together and my WAG is that we will see another "knee of the hockey stick" uptick sometime this year - 4Q or 2011 1st half at the latest.
speaking of hockey, how about those Canadians in the Olympics?
I see gold!
Poly,
Let's hope. They have to get past Ovetchkin and crew, first.
The game is over and Canada has pounded the Russians into submission. Ovetchkin never saw open ice.
Well well well. Whadya know? Less than a year ago, we were told non-OPEC liquids production was supposed to be somewhere around 44 mbpd by now. But the chart at the top of the page shows us somewhere around 49 mbpd. It just gets curiouser and curiouser! In fact . . .
. . . being around 49 mbpd, not only does that forecast leave something to be desired, but we are now in record territory (at least according to the IEA).
No, we were told less than a year ago that OIL production was supposed to be at some level. Then oil production was defined. After you've checked out the IEA's definition of liquids and have some numbers for the products included therein, especially those not included in Ace's definition, please come back with your report.
While you're at it, why don't you work out the amount of liquids production, which is used for liquids production. See any trends there?
thanks in advance for your efforts to set your record straight.
You are correct, I should have compared the same categories. I saw the NGL's in ace's first chart and thought it meant all-liquids.
At any rate, I wonder if ace is still willing to maintain his prediction in the other thread:
My answer to that question is, No.
abundance.concept,
Do you care to back that up? I suppose that you have some sort of model that you can use to substantiate your claim.
After a while, it gets pretty tiresome to hear these empty assertions. Show us your concept of abundance please.
Abundance.
That word will come up in my next TOD posting. Watch for it, the concept I have brewing looks like a breakthrough.
I'm not going to waste my time providing a nation-by-nation breakdown of where I believe new oil production will come from, because I have done that elsewhere and every single time peakers scoff at my claims. For example, if I told you I think oil production in the US will continue to rise for at least the next few years, would you believe me? Probably not. So why should I bother? All I will ask is that you remember my prediction, which I will repeat once again: 2004 was not the peak of non-OPEC oil production.
I happened across the computer scientist pioneers Conant and Ashby who formulated the "Good Regulator theorem" which states that "every Good Regulator of a System Must be a Model of that System".
Apparently you have no model so you have no business trying to predict the direction of oil production. A nation-by-nation breakdown is not a model. You have essentially made the epic blunder of every neophyte engineer -- trying to control a system by running open loop. See how that works out.
He's OilFinder2 from peakoil.com, if you want to check out some of his scoffery. His model, if you want to call it that, is a catalog of discoveries, primarily oil. Sometimes he throws dubious figures like additional Orinoco or out of this world finds in Iran into the pot; even so he never tops a year's consumption.
Minus the FSU non-OPEC has been in decline since 2002.
I remember OF2. He does a great job of keeping tabs on new discoveries. Never bought into his optimism about the future though but he did make a nice contribution as far as detailing the new fields.
I am not interested in your prediction. Only your reasoning.
Let's assume an annual decline in oil production of 4 million barrels from oil fields in decline.
Show me the scenario just significantly pumps us global oil production.
Ace has gained a reputation for making projections that the falling edge is near. Eventually he will be correct.
I think global crude oil production is still on an extended plateau, and am uncertain when the falling edge will arrive. I expect global crude oil production to continue increasing through out 2010 and bump into the limit causing the price to rise above $100 / barrel. We shall see.
It does not surprise me that liquid fuels production is still able to rise because global peak natural gas is still decades away. Biofuels have a low ERoEI, but the energy invested comes from a variety of sources, natural gas, coal and crude oil. The graph of liquid fuels counts these other types of energy.
I am hoping for expensive oil to finally put an end to the little construction (mostly now it is the govt funding it to dole out jobs) that is still going on. I am really happy when it`s over $80 now (it often is) and am cheering for $90-$100 soon. We are definitely seeing a slow rise in prices and I think $100/bl by summer. It is just an intuitive guess. Maybe that will cause another crash---maybe in China as some are predicting----shortly thereafter, who knows. We can only hope. We all want the oil god to just go away, I`m sure, and bring us back the sun god instead!
-I think global crude oil production is still on an extended plateau, and am uncertain when the falling edge will arrive.-
I think if you put a line of best fit through that top graph, i'm betting a slow decline from 2005 onwards will be shown. Your plateau appears to be subsiding i'm afraid.
Oops, I mean maximum global crude oil production, i.e. actual production plus real spare capacity. Since the spare capacity numbers reported by the IEA and EIA are suspect and demand has been less than maximum supply since July 2008, I am uncertain about that value. I am waiting for maximum global supply to intersect with demand (or possibly maximum export supply intersecting with import demand per ELM) creating the next oil price shock to determine the value. Put another way, will global crude oil production rise above the peak of about 74.8 Mb/d in July 2008 and stay above it for at least three consecutive months?
You could be right. It could be an extended plateau because the OPEC oil fields appear to decline more slowly according to this Upsala University Peak Oil group study.
I think the plateau will be extended in part due to Saudia Arabia's efforts to maintain production. Iraq could also make a difference.
Still, if the world is losing 4 million barrels of daily production each year, that requires a new Saudia Arabia every three years.
I don't think tar sands and shale oil and even Iraq stand a chance against erosion of the base of production. .
Thanks for the update and some interesting discussion.
OPEC more or less has the world by its balls but again, it's partly psychological. Data is hard enough to interpret when its transparent; when it's nontransparent, everything is a guessing game, particularly when it relates to spare capacity. I have no doubt though, that when the Saudis say that $70 to $80 dollar oil is perfect, they mean it. Low enough that it doesn't cause (further) economic contraction and spur lifestyle changes or alternative sources/technology, high enough that they can develop offshore at a profit.
What we need, of course, is sustained $100 oil to drive the Yergins and Lynchs of the world into permanent hiding. Like Dow 10,000, the number itself is meaningless; what matters is how it interacts with people's, business's, and governments' perception of how fat the fowl is.
May 2005
The end
May 2005
The beginning.
Oh wait, that sounds just as ominous.
Peak oil is what you make of it... and I look forward to making lots of new things.
indeed
End as in end of the argument rather than doomerville....
ain't no doomer myself
double post .....
** edit ** oops - sorry - meant to post this on the Oilwatch post - will repost there.
Perhaps a dumb question given all the advance math geeks on this site... but couldn't we use the US as a proxy for the rest of the world? We have diverse sources ranging from super-giant regions like Texas and the North Slope of Alaska to offshore GOM to the myriad stripper wells in Ohio and Illinois and we have the very best technology generally unencumbered by government intervention.
Using data from BP's Statistical Review of World Energy, US production was 11,297kbd in 1970 and 6,736 in 2008, an annual decline of 1.4% / year (CAGR).
If the rest of world peaked in 2005 or 2008... or perhaps hasn't peaked yet... won't the decline mirror the US simply because the rest of world is as (or more diverse) than the US from a production and geology perspective?
Perhaps I'm just reluctant to completely jump on the doomer bandwagon, but given all the gains we could make from an efficiency standpoint (at least in the US), 1.4% annual decline seems at least manageable one the world accepts that we well and truly facing inexorable decline. Given that rate of decline, and presupposing sufficient consensus, it seems that ramping up electric vehicles would be achievable.
JJ -- I can offer a few points as to why future global decline rates might not mirror that of historical US rates. The first critical factor to appreciate is that the US is the third largest oil producer on the planet. And this is not due to the efforts of ExxonMobil and the other big oils. Almost 2/3 of US oil production is from the smaller independent companies. In fact, some very small ma&pa companies. The average oil well in this country produces less than 10 bopd. The overhead cost of the big oils cannot support such low yield wells. The little guys can because they are often paying themselves to do works. Paying an employee to do the same kills the economics. This lower tier of operators is unique in the world. Likewise, much of US oil/NG production comes from privately owned mineral rights. Across most of the planet those rights are owned by gov't. The British gov't isn't going to be as motivated to see a 40 bopd produce on 20 acres of their leases as would a corn farmer in Nebraska.
We also have the most advanced technology available when it comes to oil/NG production especially in the area of enhanced recovery. And many of these service companies are small and owe their existence to the small operators. Just MHO but if the oil/NG rights in the US were owned AND OPERATED by the Federal gov't I doubt we would have even half the production we have today. With that point in mind consider all the political factors that might come into play in all those oil producing nations where the national oil companies run the show. I really don't like picking on our friends down south but Mexico's PEMEX might stand as a good example of how to not maximize ult recover. Not so much a technical issue as it that the Mexican gov't strips PEMEX of most of its operational income to support about 40% of their budget.
As I said I don't think anyone can quantify the answer for you. But my WAG is that global declines from similar US fields won't come close to what we've seen in this country.
This assumes that the world will be able to import oil from Pandora, or Titan. In other words from someplace else, like the US did after its peak to smooth out the bell curve.
So that we will continue to have a functioning economy with high demand for oil, meaning enough margin for producers to extract the difficult stuff from below miles of salt domes, or vaporise vast slag heaps of tar sands, well into the future, enough to ameliorate the decline.
Now, you got to ask yourself one question, do you feel lucky?
USA is an excellent proxy for the rest of the world.
Oil discovery is purely a statistical science and has nothing to do with geology at all once you obtain a representative set of numbers. Everything proceeds according to standard probability.
By that logic I don't believe you would have predicted, in the year 2000, that U.S. production would have remained essentially flat for the coming decade.
How did U.S. production remain flat? Is it because a few months had production figures close to those of the year 2000?
http://tonto.eia.doe.gov/dnav/pet/hist/LeafHandler.ashx?n=pet&s=mcrfpus2...
When you look at the graph with the years averaged, it is still trending downwards.
Indeed. Data from Floridian's link, linear trendline added:
Because with my historian hat I discounted the two sharp dips and added points to the upswing last year. We didn't end the decade much difference than we started.
Now if were doing regression analysis I will point out that the downward trend is far from a cliff. It seems to me that the doomers cherry pick the worst statistical data and combine it with subjective bias. I'll rephrase what I said: Not many doomers would have believed in 1999 that U.S. production would fall off at a gradual rate.
If global warming is real a trend line like U.S. production may be a good balance between meeting current energy needs while encouraging lowered carbon emissions through alternate energy sources. If worldwide production does "fall like a rock" then we haven't done nearly enough this century to be prepared. If the decline is more like that trend line then we're probably O.K.
Of course, once or twice, I have talked about how single digit production decline rates in exporting countries, either with or without rising consumption, tend to result in an accelerating rate of decline in net oil exports. However if the rate of increase in consumption is high enough, a country can slip into net importer status, even before its production peaks, which is what happened to the US. We went from finding our largest Lower 48 oil field in 1930 to net importer status only 18 years later, in 1948.
My present outlook is that developed oil importing countries like the US can look forward to having to make do with a declining share of a falling volume of global net oil exports. Perhaps as soon as 2018, eight years from now, Chindia's net oil imports, as a percentage of total net oil exports from Saudi Arabia, Russia, Norway, Iran and the UAE, may be at the 100% level. This metric increased from 19% to 27% in just three years, from 2005 to 2008.
US Imports are declining, owing to some combination of demand destruction/ethanol/increased efficiency. Rapier attempted to suss out how much of the signal was in the ethanol, for a start. Complex subject.
US is a poor proxy for the world what with NOCs in other countries controlling 90% of reserves and the private ownership of wells in the US skewing its decline profile. Look at the EIA data for Distribution and Production of Oil & Gas Wells. 302,220 out of 355,537 producing oil wells are <=15 bbl/day. This does not obtain in other nations, both the number of wells and private ownership of same, owing to unique US regs on mineral resources, thus in all likelihood they won't decline quite so gently as the US has with its literal Mom and Pop operations extracting crude from bit rate stripper wells.
Calculating averages for all YOY % changes in BP data 1965-2008 you see a wide range of numbers; US is -0.67%, Venezuela -0.65%. Malaysia is only nation in double digits, 10.80%. Most OPECers are in the 3-4% band. Of course these cover ramp ups, declines, and political cutbacks indiscriminately. I've been meaning to feed these numbers from peak to current production to get a handle on what real world declines are truly like.
Looking at EIA data
U.S. Field Production of Crude Oil, billions of barrels:
2000: 2.13
2001: 2.12
2002: 2.10
2003: 2.07
2004: 1.98
2005: 1.89
2006: 1.86
2007: 1.85
2008: 1.81
Although this is not in the EIA dataset, I believe that 2009 production will show a bit of an uptick in production, but it is offset by a steep decline in reserves. When prices went high the companies cranked up the pumps and produced more oil, but this is short term and comes out of future production.
This decline has been going on for 40 years, and its future path is highly predicable. It is a long, slow, relentless decline in production. Production has fallen to little more than half of what it was in 1970: 3.52 billion barrels. Over the same period US oil consumption increased by about 50%.
The US now only has 19 billion barrels of proven oil reserves in the ground, so if production went up to 2 billion barrels per year, it would take less than 10 years to produce it all. That is not what will happen. It will not fall off a cliff, but neither will there be any significant increases in production. US oil production is approaching zero asymptotically.
How much oil have you discovered?
Web -- I would readily agree with you re: oil discovery. Though some of the trends are old and fairly worn out we have essentially the same type of petroleum provinces as seen around the world. But production profiles between the US and the rest of the world may not appear as similar. See my post above for details if you're interested.
The IEA has looked at oil fields in decline. So have the Cornucopians in Cambridge.
The big oil fields are declining at a weighted average rate of 6.7% according to IEA.
The US is not typical.
Regarding decline rates, America never had to deal with a rising China originally. Oil is massively affected by politics and the economy and there is a lot of economic fallout at the moment. Add to this that as SaturnV points out, Americas oil curved quietly down originally due to others taking up the slack pretty much.
I expect the world plot to be similar to the american graphs in shape only and the peaks, troughs and drop-off will be far different... much more spiky with a steeper gradient...
It had puzzled me a bit why in the depths of the financial crisis those with very high quality oil assets would continue to even sell their oil at prices just over US$30 per barrel.
It was only in reading the extended disclosures of a number of top oil producers that it was revealed that maintenance periods were entered into over some of those very low oil price periods.
Of course there's nothing firm to tie in a connection beyond any doubt, but it makes perfect sense they just decided to shut in production basically and label it maintenance as the reason.
There were a couple of examples I found of this but the clearest was from Nexen the operator of the largest North Sea field - Buzzard.
To me it seemed it's rather extended maintenance seemed to overlap quite nicely periods of very low oil prices.
Nexen you could say did exactly the right thing for its shareholders.
Why sell at US$35 a barrel if the price in say three years would be $140 and say $250 in five years?
Best to just leave it under the sea!
Now, my question to the board is would it not make economic sense for Norway and the UK to just announce a five year moratorium on oil exports in order to increase the economic value of their resource over the long term?
To me it would and I'm curious to see what everyone thinks of this concept...
Goverments tend to put oil revenues into the general budget.
They can't just shut down. And today their deficits are large enough ...
Also many governments don't take seriously depletion. The UK has always scoffed at it.