Oilwatch Monthly January 2010
Posted by Rembrandt on January 21, 2010 - 10:15am in The Oil Drum: Europe
The January 2010 edition of Oilwatch Monthly can be downloaded at this weblink (PDF, 1.24 MB, 33 pp).
The Oilwatch Monthly is a newsletter that is available free of charge with the latest data on oil supply, demand, oil stocks, spare capacity and exports.
A summary and latest graphics below the fold.
Subscribe to receive Oilwatch Monthly by e-mail
Latest Developments:
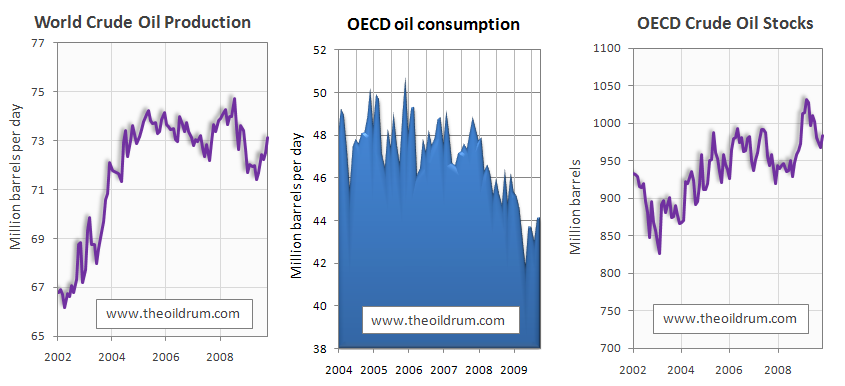
1) Conventional crude production - Latest figures from the Energy Information Administration (EIA) show that crude oil production including lease condensates increased by 592,000 b/d from September to October 2009, resulting in total production of crude oil including lease condensates of 73.12 million b/d.
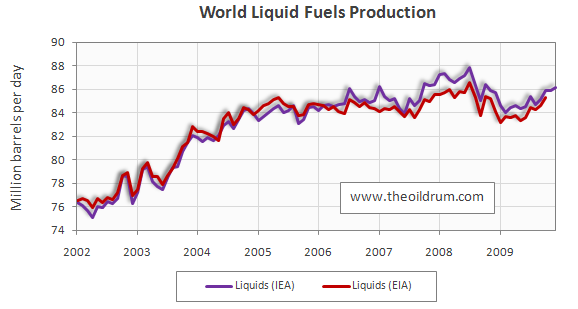
2) Total liquid fuels production - In December 2009 world production of all liquid fuels increased by 270,000 barrels per day from November according to the latest fgures of the International Energy Agency (IEA), resulting in total world liquid fuels production of 86.17 million b/d. Liquids production for November 2009 was revised downwards in the IEA Oil Market Report of December from 85.94 to 85.9 million b/d. Average global liquid fuels production in 2009 was 84.97 versus 86.6 and 85.32 million b/d in 2008 and 2007.
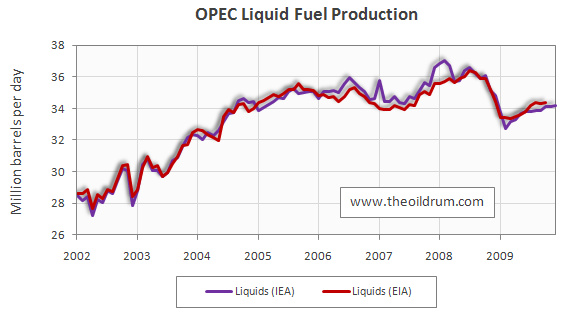
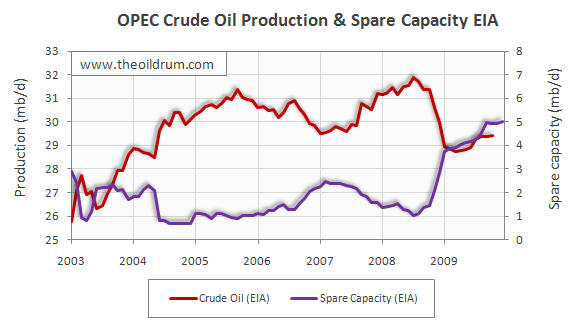
3) OPEC Production - Total liquid fuels production in OPEC countries increased by 70,000 b/d from November to December to a level of 34.21 million b/d. Average liquid fuels production in 2009 was 33.7 million b/d, versus 36.09 and 35.02 million b/d in 2008 and 2007 respectively. All time high production of OPEC liquid fuels stands at 36.58 million b/d reached in July 2008. Total crude oil production excluding lease condensates of the OPEC cartel increased by 80,000 b/d to a level of 29.05 million b/d, from November to December 2009, according to the latest available estimate of the IEA. Average crude oil production in 2009 was 28.7 million b/d, versus 31.43 and 30.37 million b/d in 2008 and 2007 respectively. OPEC natural gas liquids remained stable from November to December 2009 at a level of 5.17 million b/d. Average OPEC natural gas liquids production in 2009 through November was 5.0 million b/d, versus 4.66 and 4.55 million b/d in 2008 and 2007 respectively.
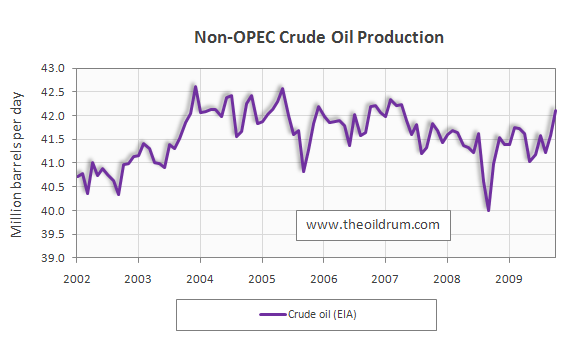
4) Non-OPEC Production - Total liquid fuels production excluding biofuels in Non-OPEC countries increased by 147,000 b/d from November to December 2009, resulting in a production level of 50.17 million b/d according to the International Energy Agency. Average liquid fuels production in 2009 was 49.68 million b/d, versus 49.32 and 49.34 million b/d in 2008 and 2007 respectively. Total Non-OPEC crude oil production excluding lease condensates increased by 542,000 b/d to a level of 42.11 million b/d, from September to October 2009, according to the latest available estimate of the EIA. Average crude oil production in 2009 through October was 41.51 million b/d, versus 41.32 and 41.80 million b/d in 2008 and 2007 respectively. Non-OPEC natural gas liquids production increased by 61,000 from September to October to a level of 3.42 million b/d. Average Non-OPEC natural gas liquids production in 2009 through October was 3.39 million b/d, versus 3.65 and 3.79 million b/d in 2008 and 2007 respectively.
5) OECD Oil Consumption - Oil consumption in OECD countries increased by 25,000 b/d from September to October 2009, resulting in a consumption level of 44.11 million b/d. Average OECD oil consumption in 2009 through October was 43.86 million b/d, versus 46.10 and 47.68 million b/d in 2008 and 2007 respectively.
6) Chinese & Indian liquids demand - Oil consumption in China increased by 127,000 b/d from September to October 2009, resulting in a consumption level of 8.98 million b/d according to JODI statistics. Average oil consumption in China in 2009 through October was 8.06 million b/d, versus 6.92 and 7.29 million b/d in 2008 and 2007 respectively. Oil consumption in India increased by 103,000 b/d from September to October 2009, resulting in a consumption level of 2.82 million b/d. Average oil consumption in India in 2009 through October was 2.84 million b/d, versus 2.60 and 2.43 million b/d in 2008 and 2007 respectively.
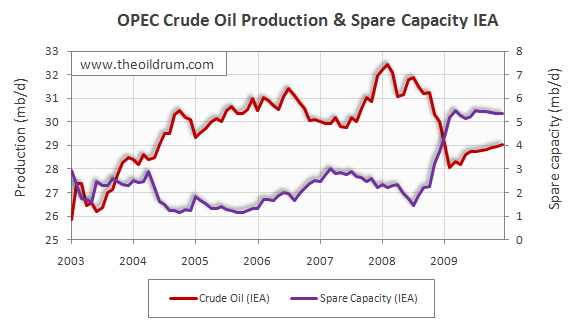
7) OPEC spare capacity - According to the International Energy Agency, total effective spare capacity (excluding Iraq, Venezuela and Nigeria) increased from November to December 2009 by 2,000 b/d to a level of 5.37 million b/d. Of total effective spare capacity, an additional 3.55 million b/d is estimated to be producible by Saudi Arabia within 90 days, the United Arab Emirates 0.42 million b/d, Angola 0.24 million b/d, Iran 0.28 million b/d, Libya 0.23 million b/d, Qatar 0.10 million b/d, and the other remaining countries 0.55 million b/d.
Total OPEC spare production capacity in December 2009 increased by 10,000 b/d to a level of 5.03 million b/d from 4.93 million b/d in November according to the Energy Information Administration. Spare capacity figures from May 2009 to November 2009 were significantly revised upwards in the latest Oil Market Report, mainly due to an adjustment in Saudi Arabian spare capacity from 2.8 to 3.7 million b/d for November 2009.
8) OECD oil stocks - Industrial inventories of crude oil in the OECD in November 2009 increased to 984 million from 967 million barrels in October according to the latest IEA statistics. Current OECD crude oil stocks are 22 million barrels higher than the five year average of 962 million barrels. In the December Oil Market Report of the IEA, a total stock level of 968 million barrels was tabulated for October, but this level has been revised downwards to 967 million barrels in the January edition. Industrial product stocks in the OECD in November 2009 remained stable at 1466 from October levels according to the latest IEA Statistics. Current OECD product stocks are 64 million barrels higher than the five year average of 1402 million barrels. In the November Oil Market Report of the IEA, a total stock level of 1499 million barrels was tabulated for October, but this has been revised downwards to 1466 million barrels in the December edition.
Personnel
Editors
Contributors
Peak Oil Primers
Archives
- November 2010 (3)
- October 2010 (6)
- September 2010 (4)
- August 2010 (7)
- July 2010 (6)
- June 2010 (7)
- May 2010 (2)
- April 2010 (8)
- March 2010 (4)
- February 2010 (6)
- January 2010 (3)
- December 2009 (5)
- November 2009 (8)
- October 2009 (12)
- September 2009 (6)
- August 2009 (5)
- July 2009 (11)
- June 2009 (8)
- May 2009 (16)
- April 2009 (10)
- March 2009 (7)
- February 2009 (10)
- January 2009 (15)
- December 2008 (9)
- November 2008 (9)
- October 2008 (9)
- September 2008 (13)
- August 2008 (10)
- July 2008 (14)
- June 2008 (23)
- May 2008 (16)
- April 2008 (12)
- March 2008 (16)
- February 2008 (9)
- January 2008 (13)
- December 2007 (13)
- November 2007 (16)
- October 2007 (22)
- September 2007 (8)
- August 2007 (9)
- July 2007 (16)
- June 2007 (8)
- May 2007 (7)
- April 2007 (7)
- March 2007 (10)
- February 2007 (10)
- January 2007 (12)
- December 2006 (9)
- November 2006 (15)
- October 2006 (4)
- September 2006 (5)
- August 2006 (5)
- July 2006 (9)
- June 2006 (5)
- May 2006 (10)
- April 2006 (9)
- March 2006 (13)
Vital Trivia
License

This work is licensed under a Creative Commons Attribution-Share Alike 3.0 United States License.
18/1/2010
What is the world prepared to pay for crude oil above 73 mb/d?
http://www.crudeoilpeak.com/?p=976
"Somewhere between $60 and $100 a barrel, with a speculative spike of +40% on that..."
-The Industry needs to spend Trillions to go much above that figure, indeed spend hundreds of Billions just to maintain it given depletion. All that spending must come out of profits, low prices = reduced profits = less investment = lower supply = higher prices (given constant demand). And then we have the issue of exchange rates, Inflation/Deflation and the actual value of the Dollar...
Given QE maybe $100 is the new $80?
Nick.
What happens when the cost of producing the marginal barrel of oil and the price at which a barrel of oil begins to ruin the economy have the same numerical value?
Do you mean the pickup truck economy, or the prius economy? The one that pays a western middle-class wage, or a Chinese one?
Ha! As if we'll have a choice.
Rickshaw economy?
http://www.google.com/imgres?imgurl=http://www.phototravels.net/japan/pc...
Hi dohboi,
When I worked in India a dozen years ago, the Rickshaw was pretty much obsolete and replaced by the auto Richshaw:
http://img.alibaba.com/photo/10824019/Auto_Rickshaw.jpg
In my area, a number of people have created their own bicycle rickshaws.
http://www.johnnyjet.com/images/PicForNewsletterSingapore6252004JJONTRIS...
Production declines. Or, alternatively, somebody borrows and pay the hight price for a certain time, then production declines. At least that is what theory says, any similarity to the real world ought to be a coincidence :)
I'm not seeing any short-term peak oil doom here. OPEC has 3+ million barrels of spare capacity to help moderate prices.
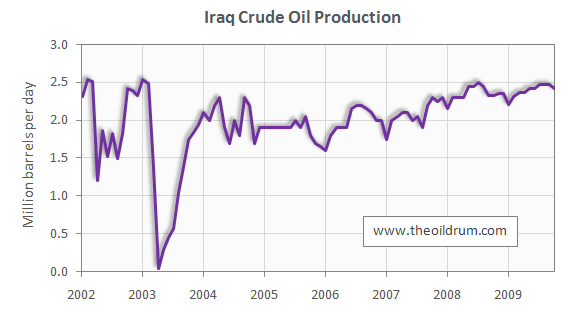
The exclusion of Iraq is no longer negligible. It looks like it will be a major player in the years ahead, ramping up to a minimum of about 5 MB/d by 2020. Venezuela is also currently auctioning its Carabobo oil patch.
Taking account of currently planned megaprojects, and the improving situation in Iraq, my guess is that the current plateau +/-2 MB/d will hold out till 2016 at least.
"will hold out till 2016 at least".
That's interesting.
That is when the Report to the Club of Rome (RCR from here on in) predicts that the per capita industrial output peaks and plunges precipitously.
I plan my panics around that date.
It's a good point. As I have pointed out several times, Texas has also increased its spare capacity to close to 2.5 mbpd since 1972.
WT -- Shhhh. If the Pentagon hears you they might send troops to Texas to bring us "freedom" too.
Here in Oregon there are huge pools of abiogenic oil coming up from deep in the earth along side the volcano's but the tree hungers are trying to suppress this info to keep the oil companies out.
Anyone that understands the theory realizes the volcano's are linked directly to the deep abiogenic pools where do you think the C02 comes from to drive the volcano's ?
I think there just trying to force the Texans to pump all of theirs first so the oil price to go higher so they can make all the money.
Sarah Palin's trying to get the truth out as these pools extend all the way into Alaska.
best Oil Drum post evar
I have noticed that people get addicted to sarcanol lately. Bad sign. The end must be near ;).
Oh dear! Could we be approaching Peak Sarconol? No way...not as long as the Rockman has westexas to pick on.
A sarconol in every pot!
Sarconol is made from oil, thusly where oil goes... sarcanol will soon follow.
The "Rock" is still dealing with personal issues, since he has recently "Come out of the (exploration) closet," and realized that he has secretly yearned to be an exploration geologist for years.
no sign of a downturn in production or supply on an aggregate global basis
we are on the plateau that we have been on since 2004/2005
what could possibly go wrong?
i look forward to the updated global supply forcasts and projections from the usual experts
Oil Watch Monthly indications seem to confirm that the trend toward higher production that Dave Summers (Heading Out) noted in a in a recent post is apparent in the IEA data as well as the EIA data, and in the most recent months.
This higher production (supported by higher consumption) would seem to be supportive of higher prices.
I think that the financial situation plays a role in this as well, though. There seem to be a lot of financial issues now, with China squeezing back credit, and Greece having problems. For example, see China Chokes Credit while EUR Plummets. These may cut back demand in enough of the world that prices do not rise--in fact, demand may start falling again if EUR and China are having difficulties.
My thought is: I wonder if the economic news about China is related, or just coincidence?
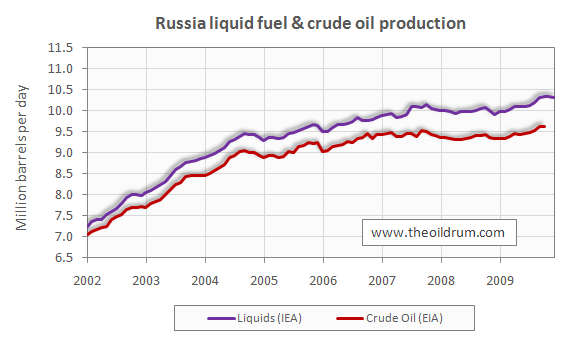
If one looks at Rembrandt's graphs from Oil Watch Monthly, one can see that Canada's oil production (including the oil sands) has been relatively level, while Mexico's production has been plummeting.
These two countries used to be the US's biggest source of imports, but needless to say, Mexico has dropped down a few notches in exports. Canada has remained our biggest source of imports, but without the oil sands, we would be facing a similar situation north of the border that we are facing south of the border (although not quite as severe a decline--the oil sands are increasing enough to keep production level, but that is it.)
A number of environmental organizations have been putting out very distorted information on the CO2 emissions of the oil sands. Oil sands emissions are a little worse than average, but no more than that, over the full cycle, including burning the fuel. The Pembina Institute, which is behind most of the numbers quoted by environmental organizations, had to resort to pretty poor practices IMO, in order to come up with the CO2 emissions ratios they quote. Pembina Institute did a post for The Oil Drum in which they document in the footnotes what studies underly their assertions. Below are charts from two of the reports footnoted in Pembina's post, showing that oil sands CO2 emissions are not much higher than those of other types of oil production.
The bars in the above chart relate to different studies. Emissions of conventional oil is shown in the last two bars. The upper studies are of various types of oil sands production (although in practice, in situ plus upgrading really doesn't exist, or didn't exist as the time of the studies, so are conjectures). The indications of three of the oil sands studies are in the range between the higher and lower "conventional" study shown at the bottom of the graph--which is the reason the authors show the vertical dotted lines on the graph. It seems like a strange study to be quoting, if one wants to talk about how bad emissions are.
In the above analysis, Canadian oil sands come out above the others listed, but not by huge amounts. If oil sands is being substituted for Mexican oil, the difference seems to be about 10%.
These are links to some of my comments to the Pembina Institute post, documenting some of the issues with Pembina's assertions:
http://www.theoildrum.com/node/5771#comment-542839
http://www.theoildrum.com/node/5771#comment-542823
http://www.theoildrum.com/node/5771#comment-542861
http://www.theoildrum.com/node/5771#comment-542904
Combined net oil exports from Canada, Mexico & Venezuela, to all of their import customers, dropped from 5.0 mbpd in 2004 to 4.0 mbpd in 2008 (EIA), a decline which continued in 2009.
"
A number of environmental organizationsGail and the oil companies she shills for have been putting out very distorted information on the CO2 emissions of the oil sands."Fixed that for you.
Do you really expect us to believe that a substance that needs that much high energy processing is about the same as oil that bubbles out of the ground?
And the other point about tar sands is the vast quantity. If oil is on the downward descent in production it seems to be on, many environmentalists seem, rightly or wrongly, to mostly give it a pass. If there is a extra trillion barrels of it, especially a dirtier form of it, oil looks like a major future threat to the viability of the planet.
dohboi -- If we don't find more oil to burn we'll burn more coal IMHO. Pick your poison. No solution...just worse choices.
Tar sands and coal are actually the same choice: BAU
Given the recent climate science, it looks like the choices actually boil down to collapse or extinction (via BAU). I choose collapse.
Dohboi,
Any cop will tell you that in any domestic dispute there is his story, her story, and the real story.
I like to think of myself as a person who hears both sides of any dispute before I make up my mind, having found it necessary to change it many times even then.
Now if we could wiegh the ethics and motives of big oil , or any other big business or industry,against the ethics and motives of the environmental movement AS A WHOLE, I'm sure the oil companies would smell like sxxt and the environmentalists like roses.
This does not mean however that there are no environmentalists willing to distort the truth for thier own ends-which MIGHT justify the means, and might not.Firthermore a lot of environmentalists are wacko dreamers more than ready to push us into programs and policies that will not work.
There are numerous people out there who may or may not be considered real environmentalists, as they are pushing programs and policies from which they stand to benefit handsomely.Some of these programs are going to be real dogs and may result in anti environmental backlash and real economic hardship.
Can we all say "corn ethanol" in unison ? We listened to the starry eyed dreamers and they crawled in bed with the banks and republican (mostly) congress critters and big ag and brought us this boondoogle.
I doubt if it would have become anything like the monster it is without ill informed envronmental ists puhing it along.It might never have even been born in the USA.
I doubt if there are more than a handful of regulars here who read or watch any pro oil news or websites.
We need to hear both sides of the story.Even an oil company flack(who may try to use Gail as a conduit ) has something truthful to say occasionally.I believe most of us are getting to be pretty good at sniffing out self serving "one side only" info or comments and sorting out the real facts and need not worry ourselves in this case.
So far as I can see (being a relative newcomer here myself I could be wrong) Gail is up front about it when she gets a tour of a site or a plane ticket to a meeting or something of that nature at industry expense.
I think she is ok myself , and a realist about such things.Her work has contributed significantly to my growing understanding of the energy situation in general.
She obviously contributes enormously in all sorts of ways here and elsewhere to all of our understanding of PO issues. But I have never seen her say anything negative about any oil companies, and I'm afraid that makes me suspicious. I tend to assume that she is just naive about how their influence works, since, as you say, she has been upfront about it in the past when she has gotten paid by an oil company to cover their side of the story.
I actually wish that she had continued her series on Ecuador (I believe it was), but include a bit more from other sides. In fact, I think it would be great to have articles based on each of the chapters of Peter Maass's recent book "Crude World" to go over the impacts oil has had on various areas where it has been extracted from. Such a set of discussions may actually put the oil sands thing in perspective, since this is not the only place where oil has had vast and negative effects on the land, water, air and people near where it is being produced.
If environmentalists are seen as dishonest it can't help their cause certainly. They should just show all the dead birds and poisoned rivers and birth defects among natives if they want to stop the tar sands developments in its tracks.
But they can't, so they won't. They aren't there, so they're tough to photograph.
They have to stick to photographs of oil sands plants belching clouds of "dihydrogen oxide" crystals into the subarctic winter air.
It's ice fog, guys. Some of you from warmer climates have probably never seen it.
Gail,
The Canadian Assosiation of Petrolium Producers have published a paper "Environmental Challanges and Progress in Canada´s Oil Sand".
www.capp.ca/GetDoc.aspx?DocID=135721
The figures on CO2 emissions pretty much agrees with yours.
I think everyone's numbers are pretty much alike. There are some groups that are very creative in how they report those numbers, though.
Pembina Institute started down one path with its reporting when it found a fluke in the way the CO2 emissions were reported. It turned out that Stage 1 (of a five stage life cycle analysis)--loosely referred to as "production"--included included emissions from both mining and upgrading for oil sands producers who upgraded bitumen on site, before sending it to a refinery for further refining. For conventional oil, Stage 1 "production" comprised only pulling the oil out of the ground. So with this "apples to oranges" comparison, one could legitimately say that global warming gasses for oil sands "production" (including upgrading) were three to five times those of "conventional oil"--but this relationship only existed, because an apples to oranges comparison was being made.
But then, in situ production of oil sands took off, and in situ producers did not have on-site upgrading, so suddenly the comparison did not work well, because the Stage 1 for in situ production was just melting the bitumen in place. CO2 emissions for this process were roughly half those of mining plus upgrading (making the ratio for in situ production more like 2 times conventional). So Pembina found the apples to oranges comparison it chose to exploit was disappearing, as the comparison started to move closer to what most people would consider "production" vs "production", instead of "production plus upgrading" vs "production".
With the changing mix to more in situ production, Pembina could go out and tell people that well, no, the comparison they had made in the past wasn't really true any more, because they had cherry-picked the comparison for a particular situation that was disappearing. That would be awkward though.
So instead, they have worked really hard to find sources that would "prove" something that is increasingly not true. When they sent us the draft of their post, they initially used only one source to document the finding--a recently published paper that made what I would consider bizarre comparisons. When I objected to the source, they found some different sources. But if one puts together global warming gas comparisons oneself, from the papers they reference, the numbers do not come out as high as they claim. This is what my comparison, using their references, showed:
For more information, see this previous comment and this comment.
Wow, a lot of loaded words there.
So if one form of hydrocarbons needs to be turned from something that is not oil into oil before further processing, that process should be completely overlooked in determining total CO2 emissions? How about for determining EROEI? And somehow including these inputs, inputs that are not necessary for other forms of oil extraction, is cherry picking?
Perhaps you are cherry picking what you choose to call cherry picking?
Really,your postings on this are becoming more and more disingenuous.
Speaking of loaded words, the "tar" sands that some organizations are fond of talking about actually contain bitumen, and bitumen is merely a very viscous form of oil.
Oil varies considerably in specifications, and some of it is so thick it doesn't flow unless heated. Oil companies usually ignore it because it is too expensive to produce, but the bitumen in oil sands is present in volumes too large to ignore. Oil refineries can process bitumen directly, and many are being modified to do so because there's not much difference between bitumen and the heavy oil that many countries produce.
Speaking of CO2 emissions, the Alberta government has a $2 billion fund to subsidize injecting CO2 into deep formations to dispose of it. Shell is moving forward with it on its upgrader near Edmonton. Others will follow.
A comparison of the CO2 produced extracting oil sands is misleading. While it produces more CO2 than extracting light oil, that is a small part of the overall system. Producing light oil doesn't require very much energy, but light crude oil is an increasingly rare commodity and the global crude stream is becoming heavier and heavier. The best analysis of CO2 production is on a "well to wheels" basis - which is the amount produced between the oil formation and the tailpipe of your car. If you look deeper, you will find that the vast majority of it comes out the tailpipe of your car.
In evaluating electric cars, most people completely ignore what is on the other side of the electric socket. In the US, nearly half the electricity is produced from coal, and the process is not very efficient. I've driven around the remote deserts of the western US, I've seen some unbelievably big coal-burning power plants sitting in the middle of nowhere, and all the power lines seem to lead in the direction of California.
I don't know what the CO2 production of an electric car would be on a "shovel to wheels" basis, but I suspect it would be pretty bad. Especially if you factor in the energy required to produce the batteries, and the fact they won't last nearly as long as the car will.
So you've lost the argument on tar sands and you want (understandably) to shift the topic of conversation to electric vehicles.
OK.
Let me first say that it seems clear to me that we have to shift away from the car culture entirely. People need to live near enough their places of work and pleasure that they can get there mostly by walking and biking, occasionally using public transportation, perhaps.
As to EVs, the main advantage of the best models are that they are so small, light and modest in their capabilities, that the addition of the efficiencies of an electronic motor means that they use a small fraction of the energy required to move a big, inefficient ICE vehicle. Now you can obviously make EVs that are big and inefficient, and you could make ICE vehicles that are much more light and efficient than anything on the market currently.
But the best EV's are now massively more efficient in operation than anything else on the road--Zenn claims something like the equivalent of 300 mpg. Even the dirtiest source of energy is not likely to make that less efficient than a 10 mpg gas guzzler. And of course electricity, unlike gasoline, is relatively easily produced from non-fossil fuel sources.
And yes, you need new batteries, but
a) all cars have batteries that wear out, so this problem is not unique to EVs
b) batteries are not tossed into the land fill--most of the elements are recylced, and while this takes some energy, it is not as though you have to mine new lead for each battery
and c) batteries continue to improve, and new technologies and mixes of elements promise ever greater efficiency and longer operating lives.
So presumably you will want to now change the topic again? What's your pleasure?
Gail,
Respectfully, it is about much, much more than CO2. It is about clean water, boreal forest ecosystems, huge pools of toxic sludge, indigenous health and rights, and still more. Even absent CO2 emissions, tar sands mining is an environmental nightmare. Three links:
The Athabasca Tar Sands is thought to be about the size of Florida and is also said to be the dirtiest and most destructive project on earth. The environmental consequences are devastating.
Tar sands development has a direct impact on local and planetary ecosystems. In Alberta, this form of oil extraction completely destroys the boreal forest, the bogs, the rivers as well as the natural landscape. The mining industry believes that the boreal forest will eventually colonize the reclaimed lands, yet 30 years after the opening of the first open pit mine near Fort McMurray, Alberta, no land is considered by the Alberta Government as having been "restored."
...refinery communities face air and water pollution from tar sands oil, which contains 11 times more sulfur and nickel and five times more lead than conventional oil.
Unfortunately, they've fudged all the numbers about those issues as well. Frankly you can't trust any of their numbers because they've been very selective about what they quote and what they don't. It's all very politically motivated. They have their agenda and they're sticking to it.
And of course oil companies, that are looking to make billions of dollars on these developments, never skew the numbers or do anything politically motivated.
Riiiight.
That really is very rich. There is a well documented trail of Exxon intentionally putting out deceptive material about GW and casting aspersions on scientists who have been most active in showing that it is real and serious. This seems to be a further attempt at just such an approach.
I'll take the numbers of those trying to avoid local and global catastrophe over those trying to make gobs of money any day.
Off topic somewhat:
The Supreme Court has ruled that corporations can spend unlimited amounts of money on campaign adds. They can't donate directly to candidates, though. I really don't see the difference since most of the money goes to adds anyway. So what effect will this have on getting BAU changed? 5-4
http://www.nydailynews.com/news/politics/2010/01/21/2010-01-21_supreme_c...
"So what effect will this have on getting BAU changed?"
None. BAU will not be "changed." BAU will need to generally collapse, leaving room for something else capable of functioning in a no or negative growth environment to evolve to replace it.
Antoinetta III
So, what are you doing to help collapse it? Do you think just wishing it away will work?
Attack of the air conditioners!
Middle East Plan to be Leader in Renewable Energy
‘Keep oil for future, tap solar energy’
As Jeff Rubin noted, the Saudis are subsidizing domestic gas consumption @$.25/gallon, and oil-based electricity generation @$.07 per gallon. Might as well call it "free" compared to the cost for net importer nations.
At that rate, there will be no demand destruction, serious interest in "green" energy, or even modest improvements in the efficiency of FF-based energy in the KSA. And why would there be? What do Americans do when the cost of something they need is virtually free? If gold were being offered @$.07 per pound from the U.S. Mint, we'd be building houses and paving our streets with the stuff.
Damn, those are crazy numbers. Still, weren't the comments from the King about saving oil for future generations indicative of a bit of perspective on their behalf? Beats being invaded, bombed, disposed. A few CSP plants could free up a few hundred kb/d for export to thirsty customers, who will be seriously pissed off if shortages appear. The trend in news articles shows a general movement upwards over the decades on this topic, after a typical brief dalliance in the 1980s. And maybe they'll just futz around with PV for a few villages and then give up. But this isn't your typical glut of oil we're dealing with at the moment, and this warrants continued observation. As I've remarked elsewhere, OECD demand was considered intractable in the early 80s as well.
If the KSA realized that they've peaked, they might want to say something shiny, polished than merely accepting "peak" and causing panic. The shiny thing to say is "Go green"!
I'd have to think this has something to do with Saudi oil consumption.
http://www.arabianbusiness.com/579321-saudi-aramcos-ras-tanura-refinery-...
http://oilgasrefining.energy-business-review.com/news/saudi_aramco_delay...
http://gulfnews.com/business/oil-gas/saudi-arabia-shuts-down-ras-tanura-...
Anyway you can follow the news on this troubled refinery its been up and down since 2008 at least. Sure oil consumption is probably down on average this is a big refinery 550kbd oil input. What you need are distillate and gasoline imports. And of course one has to guess they are forced to burn some unrefined oil in their electric generation in some cases.
http://www.ameinfo.com/204993.html
Thats enough but you also have to go do some digging on the NG side as they are also aggresively switching to NG as much as possible.
http://www.ngoilgasmena.com/news/aramcos-khursaniyah-ready-for-production/
Some Gas might have been coming online from this project to offset oil for electricity. In general I've noted that Saudi announcements about certain events don't necessarily coincide with the exact timing on the ground. Various announcements seem to be off by a few months here and there.
http://www.rigzone.com/news/article.asp?a_id=63307
http://www.arabianbusiness.com/556049-saudi-arabia-to-slash-petrol-impor...
Of course we are not supposed to ask questions just believe everything that comes out of Saudi Arabia and stick with the program.
Anyway feel free to try and figure out Saudi net exports as lots of things have happened over the last two years.
What I am curious about is a comparison of the where the uptick in demand is coming from - US vs China. I am becoming more prone to the view that we are well into the "competition for limited resources" phase of things, and that the US has lost round one decisively. This would be indicated by the upswing in demand from Asia in general, while US demand is still flat.
Or in other words, peak oil may be a moot point here compared to the results of economic and geopolitical positioning, which are to some extend shuffling us out of the game. In that event, regardless of peak we don't have real access to increasing supplies of oil...
does it mean we can get over 3 million b/d above 2008 summer peak just with current spare capacity alone?
I remember Back in 2004 SA kept saying they had lots of spare capacity.
As oil prices kept climbing through 2008, SA had NO major increase in production, even though oil reached 147/barrel.
I do not believe that SA has anywhere near 3 mmbl of spare capacity.
I think it is just a continuation of more disinformation.
Thats my opinion on the situation at SA at the present time.
duplicate (deleted)