| Some predictions on the forthcoming Russian-Ukrainian gas 'crisis' | The Oil Drum: Europe | Carbon Capture and Storage |
Oilwatch Monthly November 2009
Posted by Rembrandt on November 19, 2009 - 10:18am in The Oil Drum: Europe
The November 2009 edition of Oilwatch Monthly can be downloaded at this weblink (PDF, 1.24 MB, 33 pp).
The Oilwatch Monthly is a newsletter that is available free of charge with the latest data on oil supply, demand, oil stocks, spare capacity and exports.
A summary and latest graphics below the fold.
Subscribe to receive Oilwatch Monthly by e-mail
Latest Developments:
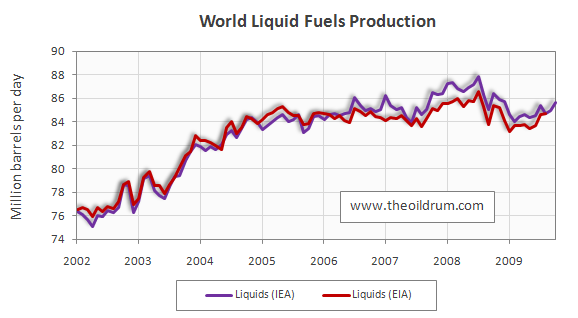
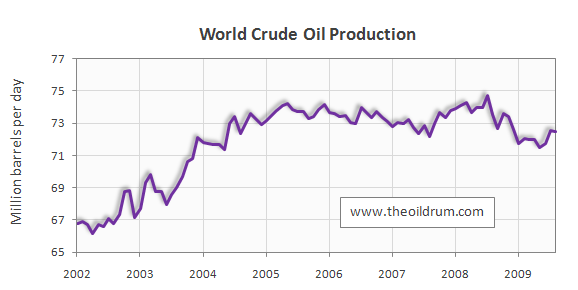
1) Conventional crude production - Latest figures from the Energy Information Administration (EIA) show that crude oil production including lease condensates decreased by 21,000 b/d from July to August 2009, resulting in total production of crude oil including lease condensates of 72.50 million b/d. Crude oil production in the EIA International Petroleum Monthly for July 2009 was revised upward from 72.42 to 72.52 million b/d. The all time high production record of crude oil stands at 74.74 million b/d reached in July 2008.
2) Total liquid fuels production - In October 2009 world production of all liquid fuels increased by 630,000 barrels per day from September according to the latest fgures of the International Energy Agency (IEA), resulting in total world liquid fuels production of 85.61 million b/d. Liquids production for September 2009 was revised upwards in the IEA Oil Market Report of November from 84.92 to 84.98 million b/d. Average global liquid fuels production in 2009 up to October was 84.73 versus 86.6 and 85.32 million b/d in 2008 and 2007.
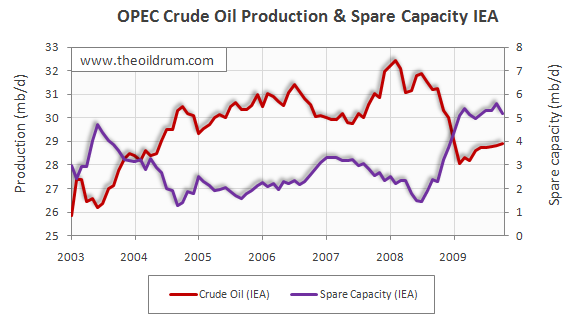
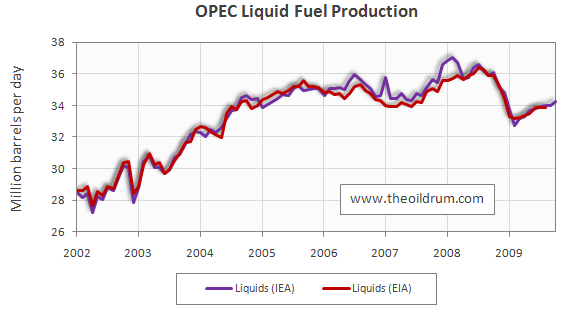
3) OPEC Production - Total liquid fuels production in OPEC countries increased by 250,000 b/d from September to October to a level of 34.25 million b/d. Average liquid fuels production in 2009 through October was 33.65 million b/d, versus 36.09 and 35.02 million b/d in 2008 and 2007 respectively. All time high production of OPEC liquid fuels stands at 36.58 million b/d reached in July 2008. Total crude oil production excluding lease condensates of the OPEC cartel increased by 110,000 b/d to a level of 28.94 million b/d, from September to October 2009, according to the latest available estimate of the IEA. Average crude oil production in 2009 through October was 28.64 million b/d, versus 31.43 and 30.37 million b/d in 2008 and 2007 respectively. OPEC natural gas liquids rincreased by 140,000 b/d from September to October 2009 at a level of 5.31 million b/d. Average OPEC natural gas liquids production in 2009 up to October was 5.02 million b/d, versus 4.66 and 4.55 million b/d in respectively 2008 and 2007.
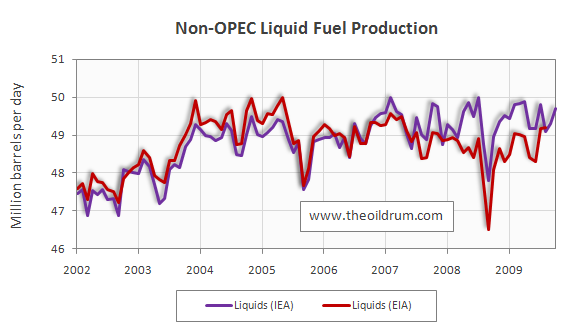
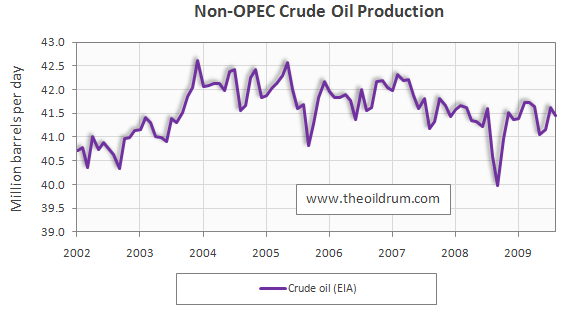
4) Non-OPEC Production - Total liquid fuels production excluding biofuels in Non-OPEC countries increased by 380,000 b/d from September to October 2009, resulting in a production level of 49.69 million b/d according to the International Energy Agency. Average liquid fuels production in 2009 up to October was 49.52 million b/d, versus 49.32 and 49.34 million b/d in respectively 2008 and 2007. Total Non-OPEC crude oil production excluding lease condensates decreased by 167,000 b/d to a level of 41.46 million b/d, from July to August 2009, according to the latest available estimate of the EIA. Average crude oil production in 2009 up to August was 41.47 million b/d, versus 41.32 and 41.80 million b/d in respectively 2008 and 2007. Non-OPEC natural gas liquids production decreased by 48,000 from July to August to a level of 3.24 million b/d. Average Non-OPEC natural gas liquids production in 2009 through August was 3.37 million b/d, versus 3.65 and 3.79 million b/d in 2008 and 2007 respectively.
5) OECD Oil Consumption - No Update
6) Chinese & Indian liquids demand - No Update
7) OPEC spare capacity - According to the International Energy Agency total effective spare capacity (excluding Iraq, Venezuela and Nigeria) decreased from September to October 2009 by 430,000 b/d to a level of 5.2 million b/d. Of total October effective spare capacity Saudi Arabia can produce an additional 3.4 million b/d within 90 days, the United Arab Emirates 0.56 million b/d, Angola 0.19 million b/d, Iran 0.35 million b/d, Libya 0.22 million b/d, Qatar 0.12 million b/d, and the other remaining countries 0.36 million b/d.
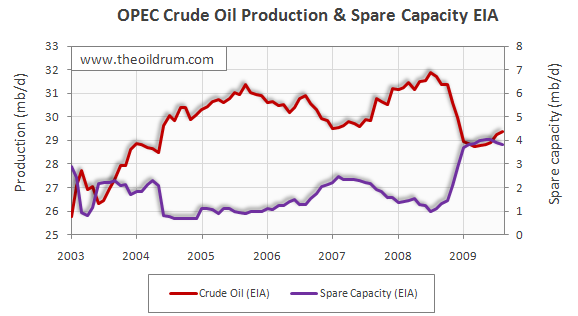
Total OPEC spare production capacity in October 2009 increased by 60,000 b/d to a level of 3.97 million b/d from 3.91 million b/d in September according to the Energy Information Administration. Of total September spare capacity 2.80 million b/d is estimated to be from Saudi Arabia, 0.21 million b/d from Qatar, 0.16 million b/d from Angola, 0.30 million b/d from Kuwait, 0.30 million b/d from the United Arab Emirates, 0.10 million b/d from Iran, and 0.10 million b/d from other countries.
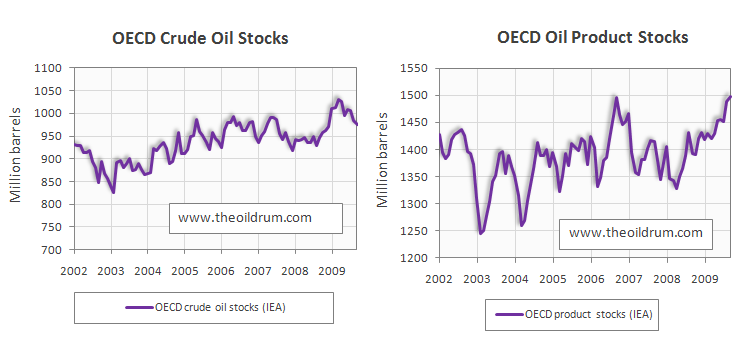
8) OECD oil stocks - Industrial inventories of crude oil in the OECD in September 2009 decreased to a level of 976 million from 986 million barrels in August according to the latest IEA statistics. Current OECD crude oil stocks are 15 million barrels higher than the five year average of 961 million barrels. In the October Oil Market Report of the IEA a total stock level of 985 million barrels was tabulated for August which has been revised upwards to 986 million barrels in the November edition. Industrial product stocks in the OECD in September 2009 increased to 1498 million from 1488 million barrels in August according to the latest IEA Statistics. Current OECD product stocks are 97 million barrels higher than the five year average of 1401 million barrels. In the October Oil Market Report of the IEA a total stock level of 1471 million barrels was tabulated for August which has been revised upwards to 1488 million barrels in the November edition.
Personnel
Editors
Contributors
Peak Oil Primers
Archives
- November 2010 (3)
- October 2010 (6)
- September 2010 (4)
- August 2010 (7)
- July 2010 (6)
- June 2010 (7)
- May 2010 (2)
- April 2010 (8)
- March 2010 (4)
- February 2010 (6)
- January 2010 (3)
- December 2009 (5)
- November 2009 (8)
- October 2009 (12)
- September 2009 (6)
- August 2009 (5)
- July 2009 (11)
- June 2009 (8)
- May 2009 (16)
- April 2009 (10)
- March 2009 (7)
- February 2009 (10)
- January 2009 (15)
- December 2008 (9)
- November 2008 (9)
- October 2008 (9)
- September 2008 (13)
- August 2008 (10)
- July 2008 (14)
- June 2008 (23)
- May 2008 (16)
- April 2008 (12)
- March 2008 (16)
- February 2008 (9)
- January 2008 (13)
- December 2007 (13)
- November 2007 (16)
- October 2007 (22)
- September 2007 (8)
- August 2007 (9)
- July 2007 (16)
- June 2007 (8)
- May 2007 (7)
- April 2007 (7)
- March 2007 (10)
- February 2007 (10)
- January 2007 (12)
- December 2006 (9)
- November 2006 (15)
- October 2006 (4)
- September 2006 (5)
- August 2006 (5)
- July 2006 (9)
- June 2006 (5)
- May 2006 (10)
- April 2006 (9)
- March 2006 (13)
Vital Trivia
License

This work is licensed under a Creative Commons Attribution-Share Alike 3.0 United States License.
Thanks Rembrandt. Excellent post. It may be worth asking the IEA how they calculate their OPEC spare capacity number of 5.2 million barrels per day and why their calculation differs from the EIA?
@Buster Cagney
It is not documented how OPEC spare capacity is calculated, Ill see what I can find out by asking the IEA
Rembrandt
Thanks Rembrandt. Apologies for the late reply; I have been traveling. It is an important question which nobody else is asking.
It may be of interest to note that, in terms of yearly production, the all time peak of crude oil production, including lease condensate, was 2005. The individual monthly peak was in 2008 (indeed, that year also had the second largest monthly figure) but 2005 saw the largest yearly production. This is according to the EIA estimates.
Excellent point. I just finished reading Taleb's Black Swan last night so of course I will interpret this statement through the lens of "NNT".
What Taleb warns is that often "too much data" can mislead. I interpret that to mean that we are subject to what Taleb calls "confirmation bias", in that we start looking at micro-trends and read too much into this. Every bit of noise or hiccup in the data is treated with unwarranted deep meaning. This is actually no different than climate deniers pointing at weather fluctuations to prove their point, however momentarily. Signal processing engineers came up with the whole discipline of data filtering for a reason. Filtering of course reduces the amount of data, but it often exposes the larger picture much better.
Of course, a more fundamental model laying underneath the numbers does wonders for the overall interpretation.
Here is another bit of insight I can get from the field of signal processing. If you recall, many of the peak oil deniers such as Lynch always point to Campbell and his incorrect calls of peak oil date. Lynch claims that this should discredit the entire analysis. Au contraire! An entire subfield of signal processing called optimal estimation uses Bayesian probabilities and an underlying model to update the predictions in the face of noise. Bayesian statistics is all about the assumption that predictions always get better with time as recent data is merged with prior data to make the next prediction that more accurate. What the peak oil deniers miss is that this whole Bayesian learning mode has been going on since the first "wild" estimate of peak in the early 1900's. My point is that the deniers do not realize that these "incorrect estimates" do not discredit the idea of peak oil -- instead they just provide a continually updated and improved estimate. We really need to start using such arguments, as this is a highly-regarded scientific method, IMO.
I got some good ideas from Taleb, but I think he also goes south in a few places.
Web -- the best insights I took away from the "Black Swan" were not so much about BS's but the misuse of data to which you refer. Especially the way "the story" is used to support the interpretation of the data. For those who haven't read Taleb's book his point has to do with "spin". He points out that such spin does more than reflect a view point. For the majority of folks it's adds a context to the data which in turns makes the interpretation more valid then it actually merits. Simply put we tend to remember and accept the story about the data more than the data itself. After reading this aspect in the BS I noticed how very common this approach is for everyone with a point to make...including myself. Let's face facts: the great percentage of chats on TOD don't deal with the "data" but our conversations about the data.
Yes, Taleb calls this the "narrative fallacy" : our need to fit a story or pattern to a series of connected or disconnected facts. The statistical application of this is data mining and how the results get interpreted. Taleb sends mixed signals on this. He lauds intuitive empiricism, but only if done correctly. He doesn't say how to do it correctly though (he is the expert on such matters). By the same token, he does not like statistical modeling, unless it borrows ideas from statistical physics. That recommendation on page 267 made my day, as that is all I try to use.
Web -- What is the recomendation? I only have it on a cd.
ROCK - here's a link to the page in question (or close to it). You could search your CD doc for the word "Ormerod" and get there.
That's the one. Taleb essentially recommends that we use real physics-based statistical models while "avoiding econometrics and Gaussian-style non-scalable statistics like the plague."
This is completely a fresh way of looking at the problem, and one that I had been developing the past few years. I knew kind of what was in the Black Swan book, but it wasn't until I finished reading it in the last couple of days that I completely understood Taleb's mind-set. Most everyone that has referenced the book have drawn different conclusions about its deeper meaning. This is partly because of the way the book is written -- very personal, blunt, and also allegorical. This book is so blunt in fact, that if it was written as a series of blog posts on TOD, they might actually get deleted. No one is immune to the criticism of NNT :)
Mucho thanks KLR. Not sure if what I picked up was Web's point but what caught my eye was his position about folks using models as predictors and not just a descriptive mechanism. I've debated others here in that regards. To me all models are correct (as long as the construction is proper). For me a model is just a formula with all the assumptions filled in. One can argue if the assumptions are realistic. Regardless the model does provide an "correct" answer if designed properly. That doesn't mean that correct answer is a prediction. Just that, for this set of assumptions, the model is correct. Where I see folks make huge mistakes is offering such models as predictions. For me the value of a model is its ability to show a system's sensitivity to the various components. A model that shows the great sensitivity of oil prices to global economic activity is one example. Another would be the relatively low sensitivity oil prices might have relative to new production from the Bakken Shale. IMHO where folks stub their toes is when they make predictions of the future. My argument might sound subtle to some but it explains why I don't care to debate the validity of predictive models. For the most part they are not close to being reliable even when I think the model is constructed properly. And then, as Web points out, to make matters worse folks will use the conversation of the model as spin to support their proposed accuracy of their prediction. And the spin suddenly offers more credibility then the "model" deserves.
Along the same lines, the spin thing is the main reasons polling data is what it is. Spinning the construction of the questions, their ordering, the type of responses recorded and on and on can steer the result very sigfnificantly toward the direction whoever is funding the poll most prefers. Modelling is all similar in that way, if you hang a bunch of fabric on a skinny 5'11" runway strutter you aren't going to get a very good prediction of what it will look like on the average 5'4" big mac butted couch sitter ?-)
We are so obviously at the peak, it's gobsmacking. How can anyone deny it?
Well . . . yes, anyone can. But should anyone deny it? Perhaps those looking for a precise month, day, hour and minute, like pondering angels standing on the head of a pin. We're close enough to Peak, by end of 2010, at the latest, if not past it, that anyone denying the seriousness of the situation needs to have their head examined.
Looks like Dave from ASPO thinks things could go along fine until about 2018:
http://www.energybulletin.net/node/50759
I am not too motivated by that kind of analysis. The article seemed to be more about one person's intuition about the extrapolated trends versus any kind of rigorous analysis. This is not just me speaking, but the fact is engineering and science really doesn't (and shouldn't) work that way. Look at his Figure 7 and Figure 16, where Cohen draws in some extra lines. Where did these come from? Are they just there as talking points (or talking lines)? And I am not trying to attack, just trying to put this into a more formal framework and push for a different approach.
Point taken. His argument is that the various scenarios cited are extremes, so he makes a nice line through the middle and says that looks best. Reminds me of Goldilocks with the porridge that was not too hot, not too cold, but "just right".
I'm not sure why you think Dave Cohen thinks we'll be fine until 2018. Maybe you are thinking of his red line in figure 7, in which case, that is referring to production of fields yet to be developed, not to total production.
@Mamba
That we are at peak is not so obvious to me, given spare capacity in the market and the number of projects on the table I am quite sure we will surpass highest production levels reached in July 2008 (based on solely a supply side analysis).
Rembrandt
I was wondering about the same thing. At the end of '06/beginning of '07 it sure looked as though the peak was in '05 and that we were now on a downward trajectory. Then we got the new peak in '08 (even if total production for that year didn't reach the '05 total). Now we see an even deeper and steeper drop than in '06/'07, but there could well be a new surge, as Rembrandt suggests.
How many more bumps are we likely to see on this bumpy plateau? Are we likely to continue the pattern of higher monthly values but ever-lower yearly values we saw between '05 vs '08? Will the next 'bump' be the last to rival the previous two by any measure?
Thanks as always, for this presentation (even if we take all the numbers with a few more grains of salt these days than we have in the past).
Oh oh, you used the word "deny". This is related to the word "denier" and that brings up the whole Holocaust deal. (see thread above http://europe.theoildrum.com/node/5972#comment-561759)
Anyone taking bets on a new peak? One thing for sure, as we climb back up, the oil price will spike again putting the slammer on any recovery. I think we may come close in 2010.
http://www.theoildrum.com/node/5884
I think it could still happen. Rembrant's bottom-up analysis using data about upcoming oil megaprojects concludes that the plateau will hold out till 2014-2015, with perhaps another peak:
Oil prices will certainly spike, but I doubt we'll be seeing $500-$1000/bbl at any point in time. Most of the oil exporting countries depend very heavily on globalized trade. IMO, for them to drive prices up this high would spell economic suicide for them just as much as for the rest of the world. Besides that, I doubt that the free market system will be applicable to oil trading once we go into decline. It may well become a system of rationed exports to various countries, at a fixed price which the global community can tolerate.
These are perhaps oil-geologically possible maximum envelope curves which may not materialize under real world conditions. Airlines will struggle already at $100 - $120 oil. They haven't even digested the 1st price shock.
Anxious airlines agonise over alliances
November 4, 2009
The statistics are startling: the peak airline body the International Air Transport Association recently revised its forecast for losses worldwide this year from $US9 billion ($9.9 billion) to $US11 billion. Qantas, one of the best-placed airlines worldwide, is still wallowing in its worst profit slump since it was floated in 1995.
http://www.smh.com.au/business/anxious-airlines-agonise-over-alliances-2...
Thanks for bringing up the airline industry Matt. A classic case is Dubai, in the UAE, which is an oil-exporting country relying heavily on globalized trade. Dubai is currently building what will soon become the world's largest airport by far: 6 parallel runways, 4 airplanes can land simultaneously, 120 million passengers per year, the largest cargo-hub in the world, upwards of $80-100 billion to build. The scale of the construction project is truly breathtaking.
They are building it in the belief that air travel in and out of the region will explode in the coming decades. Oddly enough, they already have a huge airport, which has a building with the largest floor space in the world.
Truly those Dubai folks live in an industrial dreamworld. I'm guessing that soon they will discover that they've been living in many other dreamworlds. Anyway, the point I'm trying to make is that this countries and others like it cannot possibly drive oil prices to a point which will deter airlines and travellers from going there to visit, work, invest etc.
IMO, the three key factors affecting global oil prices are (generally flat to declining) OECD demand (generally increasing) non-OECD demand and a long term, and accelerating, rate of decline in net oil exports. We really only have good short term data on OECD demand. The other two factors, non-OECD demand and net exports, contribute to higher oil prices. Many non-OECD countries, e.g., China & India, showed large increases in consumption as oil prices rose at 20%/year from 1998 to 2008. It remains to be seen what will happen from 2008 to 2018.
Regarding living in dreamworlds, I suspect that the net oil importers, especially those with a large sector of their economy dependent on discretionary spending, e.g., the US, will be hit far harder than the net oil exporters, especially since the recent data show that the US has been effectively outbid for oil exports by a range of developing non-OECD countries.
Incidentally, a fairly stunning animation of unemployment rate by area in the US, with time, from January, 2007 to September, 2009:
http://cohort11.americanobserver.net/latoyaegwuekwe/multimediafinal.html
My guess is that after 2010-2011, there will be a drilling boom of epic proportions. Iraq's production will likely be ramped up to say 5-6 Mbd.
As for the US, in the last resort it can fall back on its coal, shale and most significantly, much reduced consumption and more energy efficient machines. Such options are not available to emerging economies, and so they are more aggressive in their bids for the last remaining oil.
The trend in net US coal exports in recent years, on a BTU basis (EIA):
Is that based on total volume, or quality of coal? In what way does it reflect trends in domestic production?
Back to oil/imports:
Update (had chores to do): Note the spike in the late 70s/early 80s, which we mitigated by and large through fuel switching away from petroleum in electrical generation. This is a problem for many producing nations, KSA being the one I've examined in depth - they are even burning raw crude oil for power. One might imagine a scenario where a peak becomes evident and the sensible response is enacted whereby an open arms policy is extended to IOCs to develop stranded and associated gas reserves to their maximum, to enable the Kingdom to move away from the ruinous situation they are in with regards to the electricity sector. Alternatively, companies specializing in solar power could be brought in to assist them in moving away from use of hydrocarbons for electricity altogether.
Alternatively alternatively, a whole other stripe of "open arms policy" could be enacted by importers, of course...but let's hope for something peaceful in nature. The Middle East is chockablock with untapped NG: Stranded Gas Reserves Map. Each dot represents 25 trillion cubic feet of gas. Source: R-Squared Energy Blog: XTL: Promise and Peril
WT -- This won't be a surprise to you or many others but I had not done the math before. What brought it to mind was again hearing the report of how much interest China is collecting daily from all the US sources: $500 million. At last report China was importing about 5 million bopd. At $75/bbl that's $375 million. Intuitive I know but still interesting when you look at the numbers. The US economy is spending around $750 million/day for oil imports and competes with China that has 100% of their oil imports paid by the US. And pockets an extra $100 + million. And that's just their interest income. They still have their export sales income. Haven't seen that number but I'm sure some TODer has it at their finger tips. Easy to see how China can afford to be on a shopping spree around the globe for energy resources. Folks have been speculating for years how unsustainable China's growth must be. Granted I've offered only a simple picture but it tends to make me think that China can't help but continue to grow. Imagine if all the oil imports into the US were paid by a third party....how strong would be our growth?
Another factor is that I think that many developing countries are using petroleum for more productive, non-discretionary, purposes than the US. For example, consider a farmer in Africa who wants to use three gallons of fuel per day to partially mechanize his operations, versus a Dallas real estate agent, who wants to use three gallons per day as he navigates his SUV around the wilds of outer suburbia, attempting to sell McMansions.
And another related question that I have periodically posed is at what point does the high level of US petroleum consumption become more of a negative factor for developing countries than the benefit that the developing countries get from selling stuff to the US?
Our economy is basically on life support, courtesy of our creditors. It would seem to be when, not if, that we see an incredible wave of government layoffs on the local, state and federal levels, combined with cutbacks in government services. However, the longer it takes for the next leg down in US oil consumption to occur, I suspect that the less effect it will have on oil prices--as non-OECD consumption increases and as the rapid depletion in post-2005 cumulative net oil exports proceeds.
BTW, did you seen the animation of the unemployment rate by region, with time?
According to Wikipedia, United States entities owned 56% of the U.S. national debt in 2007. What is the interest on that? The U.S. is the third largest producer of oil in the world. The U.S. is the second largest producer of natural gas in the world. The U.S. is the largest producer of corn in the world. The U.S. is the largest exporter of wheat in the world. The U.S. is the largest developer of new medical technology in the world etc.
I wonder what would happen if foreign creditors stopped lending us the money that we need to maintain our status as the world's largest net oil importer?
That "doomsday scenario" is tossed around all the time.
When you realize that the three players in this game (the US, China and Saudi Arabia) all have the same currency (the US dollar) it all makes a whole lot more sense. The Yuan as well as the SAR are pegged to the dollar. Both are relatively hard pegs, which is why the "sinking dollar" doesn't really affect either China or SA very much. The Riyal and Yuan are de facto pegged to each other through the mechanism of the dollar peg.
A depreciating USD means a depreciating Yuan and a depreciating Riyal.
The countries which aren't pegged, like the Euro zone, Japan et al are the one really feeling the brunt.
Why would China stop lending money to US? The moment they would stop the dollar would really tank, US rates would be likely to spike and the Chinese holdings would fall in value because of the double whammy of dollar depreciation (vv other ccys) and the decrease in values (as rates go up, bond values go down). Europe would be very unhappy with their strengthening ccy, making exporting harder.
And if the US can't borrow the Dollars how can we buy Chinese made goods? Btw, the Eurozone is China's biggest export market, not the US, and it would make sense that they would start to build more Euro reserves. I'll see if I can find out what the trend is in their Euro holdings, but I wouldn't be surprised if there is an uptrend.
And what would China do with all their excess reserves? buy gold? There isn't enough around.
You can view (IMHO) China as a "forced USD saver" and the US government knows it. As so many times has been said "Yes, it is our weak (fill in the currency), but it is your problem".
Rgds
WeekendPeak
Good question....
Perhaps when what the oil sellers receive in return (usually USD) is no longer an adequate compensation. But in order for that to happen the USD would first have to loose a lot, a lot of value.
My guess is that a seller of oil would rather sell (from a political point of view) to a country which represents no threat rather than to a country which potentially is a threat. That threat could be militarily or economically.
I don't think an oil exporter particularly cares who he/she is selling to, as long as they get paid and as long as the seller doesn't use the goods sold against the seller. Yet that is what we have been doing. We get oil from the middle east (I am referring to the west as a whole, not just the US) and bombing them with planes and boats fueled with their oil. That can't be sitting well.
But all of that is just me rambling....
WeekendPeak
He was talking about China. At a certain point, China is going to stop carrying the USA public-nobody knows for sure when that is, but there isn't enough oil down the road for China and the USA public to each have their share.
We make a lot of popular movies here, too!
But really, you bring up good points to remember. If we scale back to our average per capita consumption by 3/4 or 4/5th to about that of the early '50s the US could be largely energy self-sufficient.
But the corn production numbers hide many deep problems, many of them nicely presented in the movies King Corn and Big River (whose premier I just saw last night): http://www.fmr.org/participate/events/king_corn_big_river_double_feature...
We harvest this quantity of low-quality corn at an enormous expense to ourselves, our soils and our waters (pesticide and fertilizer run off being the primary cause of the huge and expanding dead zone in the Gulf of Mexico).
And of course it is all a very energy-intensive, highly subsidized business. At some point this system is going to have to change quite radically or crumble under its own weight.
Another good film on the un-sustainability of our food system just out on DVD is Food, inc. http://www.foodincmovie.com/
What is the source of that interest number?
500mm/day *365= 182,500 mm/year (182.5bn)
They have around 2trillion of treasuries and other government backed securities. In order for that 2 trillion to generate 182.5bn in interest the rate would have to be 9.13%.
Rates are a a whole lot lower that that, so either the interest amount is too high or the notional amount (the 2 trillion is too low). Assuming prevailing rates are around 4% ( and that is generous given that the Chinese buy at the short end of the curve) they would have to have about 5 trillion of US securities.
Something seems to be off....
Rgds
WeekendPeak
Sam's best case is that the combined post-2005 cumulative net oil exports from Saudi Arabia, Russia, Norway, Iran and the UAE will be 52% depleted by the end of 2013, four years from now. In other words, his best case is that for every two barrels of oil that they will (net) export after 2005, they will have shipped one of the two barrels of oil by the end of 2013. In the 2005-2013 time frame, this is a net export depletion rate of about 9%/year for these countries.
As I have described several times, this rapid net export depletion rate is consistent with what our model and case histories shows, e.g., if we sum the production and net exports from Indonesia, UK and Egypt, their post-peak cumulative net oil exports were more than 50% depleted only three years after their combined production peak.
But if the megaproject data is based on what secretive kingdoms claim, what use are they?
But is there a dollar value associated with the production in each of those upcoming oil megaprojects?
The only way any single project would be developed per schedule / per plan would be if the production costs were comfortably under $80.
I'm not hopeful for a new peak, based on the chart and discussion at:
http://www.theoildrum.com/node/5851
Joseph -- For a practical matter development costs will have to be a good bit lower then $80/bbl for any comfort factor to develop. Oil/NG drilling projects are very sensitive to the time lag between when the money is spent and when production begins. Offshore megaprojects can take 5+ years to begin producing. The number will vary greatly depending whether the project is onshore or off but any project that can't be justified on a develoment cost of $40/bbl or less won't be very attractive to most companies. The time value of money is one of the big draw backs to low flow rate projects. Essentially the Net Present Value of the revenue stream beyond 7 or 8 years is essentially reduced close to zero using the standard discount rate (10 -15%).
Judge for yourself what the OPEC spare capacity was in July 2008, at maximum oil price:
From latest crude oil graphs: http://www.crudeoilpeak.com/?page_id=51
My emergency planning slide show presented at the conference "Smart Urban Peak Futures" of the Municipal Association of Victoria in Melbourne is downloadable as PDF here:
http://www.crudeoilpeak.com/pdfs/1
Saudi Arabia certainly does not show any long-term upward trend. Iraq is up a little recently, but still below where it was in the 2001 -2002 period.
Matt:
I do not understand your graph that seems to show Saudi Arabia only producing a little over 1 MMb/d. What am I missing?
The graph essentially shows the top "slice" of the graph--how production has changed in recent years. For example, if the production at the lowest point since 2001 was 9 million barrels a day for Saudi Arabia, then 9 million barrels a day would be subtracted from all the amounts, leaving small amounts in addition, which is what Matt graphs. Matt calls this "incremental production". (Matt is in Australia, so probably is not replying at this time of day.)
From uptop:
Recent annual US oil prices versus recent annual average Saudi net oil exports (EIA):
Oil price & net exports:
2002: $26 & 7.1 mbpd
2003: $31 & 8.3
2004: $42 & 8.6*
2005: $57 & 9.1
2006: $66 & 8.6**
2007: $72 & 8.0
2008: $100 & 8.5
*Saudi Arabia reiterated their support for the $22-$28 OPEC price band in April, 2004, and they made good on their promise to attempt to bring prices down, as they increased net oil exports in 2004 & 2005--but then we have the 2006, 2007 & 2008 data points. From April, 2004:
http://www.independent.co.uk/news/business/news/opec-studying-plan-to-bo...
**In early 2006, the Saudi oil minister complained of an inability of find buyers for all of their oil, "Even their light, sweet oil," as annual oil prices traded in excess of twice the upper limit of $28 that the Saudis had pledged to support only two years earlier. Of course, I guess the Saudis could have offered to sell another one mbpd for $28 per barrel, if they had the oil to sell. In any case, as I have previously described, based on the HL models this was coincidentally at about the same stage of depletion at which Texas started having trouble finding buyers for all its oil, "Even its light, sweet oil," in 1973.
Now some of us (such as you and I), following Matt Simmons' lead, hold the heretical point of view that Saudi Arabia's oil fields are not immune from the laws of physics. And maybe, just maybe, when the bulk of your production comes from a group of oil fields that are several decades old, your production might be peaking.
Thanks again for the update! This is always a welcome report.
About storage. Vopak's recent quarterly analysis shows that demand in both oil exporting and importing countries is growing at a brisk pace:
Combine this with the fact that reports on Bloomberg are saying that the stockpiled copper in China is going to get re-exported soon, because there aren't enough domestic buyers (i.e. industrial users) for it.
Then again all the signals I'm reading from yield curves to even analysis from Goldman Sachs tend to agree that the likelihood of a V-recovery is very slim and we will get another leg down as stimulus unwinds. Even with stimulus 2, which many say is already a matter of mere timing at this stage (i.e. been decided or a forced move soon), we may not get enough demand to justify all the storage plays.
All this signals that there is again either hedging or speculative buying in commodities that may have gotten ahead of itself.
A correction in oil price and other commodities may be in the cards, perhaps even before year's end (if copper starts to correct before fiscal calendar year end, as some speculate).
Again, I'm not an analyst in this arena, I don't really know what I'm talking about, merely thinking about various possibilities. So take this for what it's worth.
Thanks - great as usual.
a minor glitch occurs in your PDF where Chart 81-Norway and 82-UK are the same (both are UK production)
This data confirms, especially when spare capacity is taken into account, that peak oil is a long way into the future. With peak demand in developed countries, China's rapid development of alternatives and move towards efficient premium technology, I can with reasonable confidence stick to my original hypothesis that oil will peak around 2050, if not later. Nothing I have heard or read on the oil drum has changed my mind.
It's getting close to that time of year when predictions for 2010 come out.. my first thoughts go as follows:
1) The fundamentals of the oil market (like all bubbles the fundamentals always win the day) will finally come back into play, and the crude oil price will fall to around $30 to $40 a barrel (biased on supply and demand, not fantasy arguments on supporting alternatives energy/unconventional sources). Only 15% of the US land has license for oil drilling.
2) Gold price, along with other bubble commodities, will crash by May 2010 to around $600 per oz ('peak production' by April 2010 will seem like a bubble ploy argument).
3) 2010 deflation in the OECD, chiefly due to collapsing raw input prices, will prove a major problem, similar to deflationary cycles in Japan.
4) Due to collapse in commodity prices (hedges), I expect another wave of bank failures, possibly starting around August 2010 - dependent upon the timing of (2).
My range of crude oil prices are from $85 to $28 per barrel in 2010.
Sauce for the goose.
Assuming your post isn't a parody:
Just for fun, do you want to take a grudge bet on that gold price level for May '10? I'm an anti-gold bug, but even I have trouble understanding how it could fall to that level in your scenario. Some token sum, I'm not looking to rip you off, even though you'll be wrong :)
I'm also willing to entertain a bet on the oil price (your $30-$40/brl), but you have to specify a time frame.
Prof Baldwin--It is good to have a contrary view on these pages. I certainly want to understand your arguments, if arguments there be. In point #1 for example, you present a prediction and a fact. I'm not sure how the two are related. Only 15% of US land has license for oil production. How much land has oil under it? If more land were licensed would we be able to produce significantly more oil? On what do you base your reasonable confidence of a peak of 2050 or later? I'm someone who would rather see a peak later rather sooner, so I am open to contrary arguments. However, I have yet to see substantive arguments that make sense to me for a peak much later than 2020. Most arguments that I find credible predict a peak between now and 2020, with declining net exports as far as the eye can see.
rdberg -- The professor's 15% leased minerals point (if accurate...I don't know of anyone in the oil patch that tracks that number) actually argues against his assertion. If there were more potential oil bearing leases then there would be more leases taken. I'm involved in oil/NG exploration daily. If the 15% is correct it will only get smaller with respect to oil prospects. The only significant increase in leasing activity over the last several years has been in the shale gas trends. And most of those companies are chocking on those big and expensive acquisitions since their drilling budget have shrunk. Mineral leases have a time clock...drill in so many years or the lease automatically expires. And one more fact about this increased leasing activity: the objective was NG and not oil.
Companies only take leases where they suspect oil/NG to exists. Not only does that not include areas where there is absolutely no possibility of oil existing but, more importantly, areas where the oil has been depleted. We've got a $300 million drilling budget for the next several years. We would love to drill nothing but oil prospects. But they are few. The great majority of our efforts will be drilling for conventional NG. More NG in the system doesn't change the PO effects in the short term. Even in the long term it's difficult to be very emphatic about the benefit IMHO.
This analysis could probably happen if there was no government intervention. How can anyone seriously make predictions when the price is so obviously tied to US fiscal and monetary policy? If I wanted to guess prices of oil next year and had a choice between 2010 supply data and 2010 Fed policy, I would take the 2010 Fed policy.
Thanks again Rembrandt for this excellent analysis.
What I am not sure about is if there will be really an incentive for OPEC to increase its production capacity - for an obvious reason:
Since the peak of Non-OPEC oil production OPEC can act as a true cartel again, at least as soon as world oil demand picks up.
And the economical mechanisms for cartels are different from those valid for competitive markets: A cartel can take advantage from a supply shortage as there are no competitors that could rise production and thus lower the price. Thus for the cartel the rule is: Maximize revenue by *decreasing* production, as the oil-addicted consumer will pay any price.
Of course the limit of this mechanism is "demand destruction" - be it due to the substitution of oil by other sources or simply by by an economical downturn. So finally the cartel will act like a smart drug dealer: It will keep the oil price low enough to prevent an economical breakdown, but then it can be sure that due to the long time lags for establishing alternatives to oil the world will stay oil-addicted for a long time - assuring comfortable revenues for the shrinking number of oil producers.
I'm curious. How do you differentiate between Spare Capacity that a country is willing to produce and Spare Capacity that a country is not willing to produce? Will some countries have the discipline to stop pumping oil and save it for their next generation? Will countries who will soon become net importers import more oil than they normally would because they feel keeping some of their remaining oil, including any Spare Capacity, in the ground will pay off more in the long run?
My point is that the definition of Spare Capacity could be changing rapidly in the next few years and that would mean all current projections as to when, or if we already have, reached Peak Oil, go out the window. We may have in theory a few million barrels of Spare Capacity a day, but if countries have economic, social, and political reasons that justify either not using it for their internal use (and therefore importing someone else's Spare Capacity) or not exporting it, do we need a second definition of Spare Capacity?
I hope I explained this clearly.
I think you have just described - more or less - Export Land Model.
http://www.theoildrum.com/node/2767
Yes, there are theoretically different 'spare capacities' as you describe them. They are just not called that:
1) Maximum capacity to produce (unsustainable, reduces URR) - current production rate dictated by oil price economics
2) Maximum capacity to produce sustainably (maximizing URR) - current production rate dictated by oil price economics
3) Maximum capacity to produce (unsustainable or sustainable) - current production rate dictated by internal politics, domestic consumption and willingness to save for future generations
in general people try to gauge number 2, but even that is not an exact figure as it is based on guesstimates and public announcements by the producers.