| Oilwatch Monthly October 2009 | The Oil Drum: Europe | European gas buyers unwilling to pay for security of supply |
Insights Regarding Future World Oil Production Based on ASPO Denver Presentations
Posted by Rembrandt on October 26, 2009 - 10:27am in The Oil Drum: Europe
"Peak oil can be a very tricky topic, the way I talk about it and deal with it at the end of the day is: We need to revolutionize the way we consume and produce energy... We need to really be the leaders in saying: the future for our children and our grandchildren as far as energy consumption and as far as production, it looks like this" with those words Colorado Governor Bill Ritter started his closing speech at the ASPO conference in Denver that took place from 10 to 12 October 2009.
Telling our children and grandchildren where they will draw their heat, electricity and liquid fuels from was not a topic of discussion in Denver. Nonetheless, much information was conveyed on the relationship between the economics crisis and the future of oil. This post is an attempt to summarize the main points on oil and the economy from the conference presentations--concluding that there are three distinct future trajectories as we go forward.
At the Denver conference, world oil production was discussed from both the supply side (what flow rate can be reached) and the demand side (how much can the economy afford). It is really the combination of the two that is important--so I bring together both in this post.
Oil - the supply side - what flow rate can we reach?
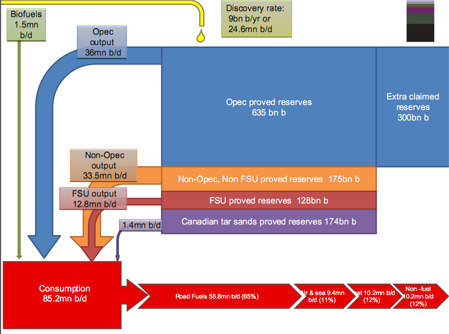
An overview of the future of oil at the conference was given by Ray Leonard of Hyperdynamics Corporation (PDF) and Chris Skrebowksi of Peak Oil Consulting (PDF). Ray Leonard who has extensive experience as former Vice President of Yukos in Russia and Kuwait Energy Company in Kuwait, showed that conceptually dividing the world of oil into 3 segments makes sense:
- OPEC controlling 73.9% of world reserves and 44.9% of worldproduction
- The Former Soviet Union (FSU) controlling 12.7% of world reserves and 15.6% of world production
- The Rest of World controlling 13.4% of reserves and 39.5% of production.
This distinction makes sense from a political perspective, as OPEC and the FSU operate under much different political and economic circumstances than the Rest of the World. Ray Leonard estimates that Russian production could theoretically increase by another 4 million b/d with new field developments but that this is unlikely to happen due to the Russian tax system and Russian firms lacking the necessary capital. OPEC is in a similar situation of not being able to expand production due to a lack of capital as International Oil Companies are barred from investing in secondary and tertiary recovery. In Ray Leonard's words: "Limitation on production level for OPEC is mostly due to politics, lack of motivation, investment level and type of crude; NOT shortage of reserves." OPEC could hence be increasing production greatly by implementing secondary and tertiary production techniques such as water injection but this possibility is nigh impossible in his view. The division Ray Leonard made between these regions was neatly depicted by Chris Skrebowski in a chart reproduced here.
Ray Leonard showed that production in the Rest of the World peaked in 2002 and by 2008 declined by 7%. With OPEC and Russia unable to increase production significantly due to politics and economics, we are nearing World Peak Oil Production. "Production peak of ultra deep water fields will allow 'peak' to be a 'plateau' in the coming decade, followed by a sharp fall" according to Leonard. Unconventional production is not set to change this situation, as his expectation is that the contribution of this category of oil will be less than 3 million barrels per day in the short to middle term.
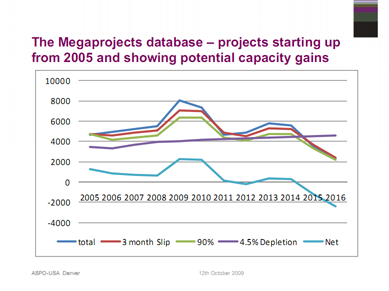
The specific path of future oil production was projected by Chris Skrebowksi using the oil megaprojects approach, wherein all the large fields expected to come on-stream in the next seven years are tabulated and compared with decline rates in current fields. In this approach, only the supply side is taken into account and the demand side is ignored. From that perspective according to Chris Skrebowksi the current plateau will continue until around 2014 when the decline sets in, shown in figure 2 below.
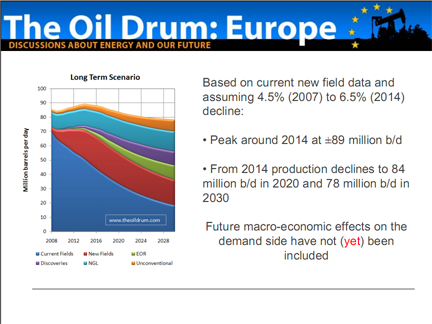
A similar approach was presented by myself in the first update of a new project where I showed a continued plateau with potentially a small increase before the decline starts around 2014. This date is based upon an analysis using a database of individual projects and the assumption that the decline rate will accelerate from 4.5% to 6.5%. The difference between my analysis and Skrebowski's is that I use a more severe decline rate and also include many more projects. There are around 600 fields in my database versus around 250 in Chris Skrebowski's, because he did not include smaller fields, hence the term megaprojects. A post on this is in the works with publication due in November here at The Oil Drum.
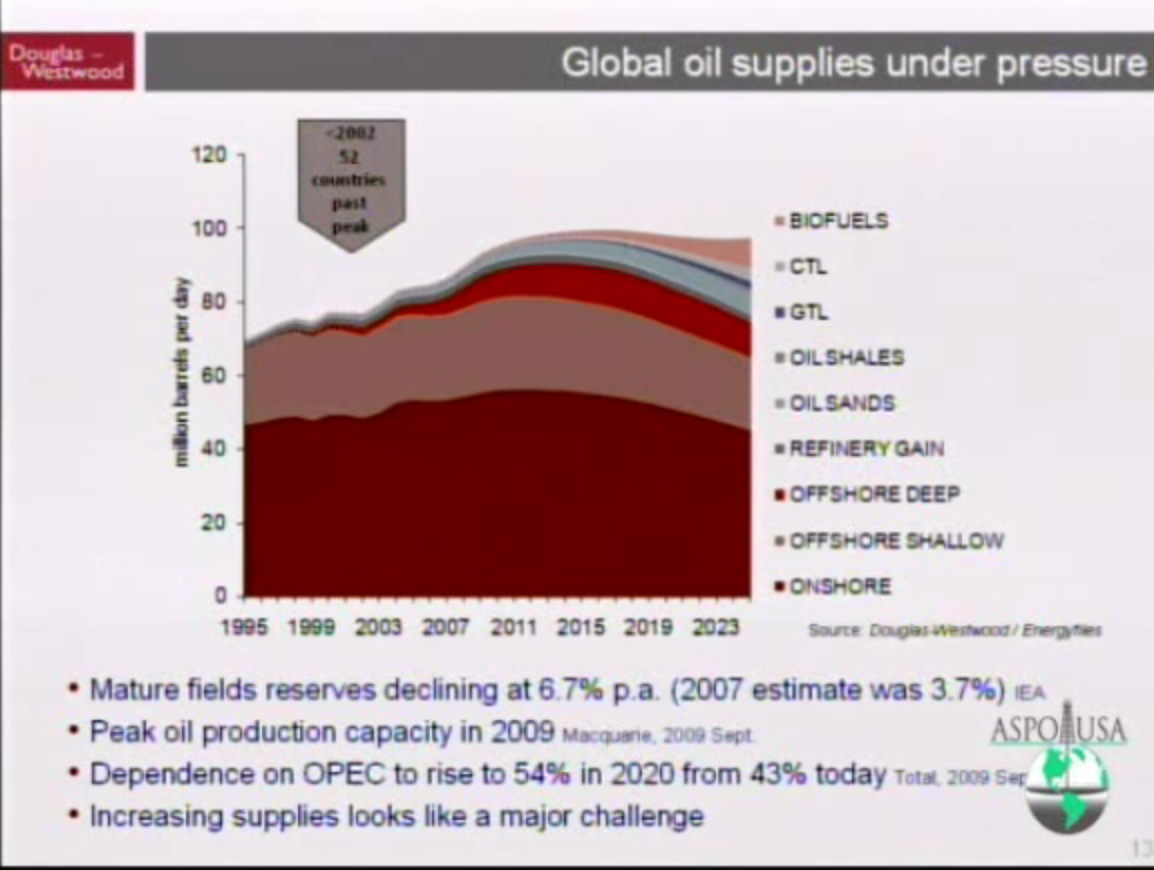
Interestingly another speaker at the conference, Douglas Westwood, presented a similar scenario with a plateau continuing until around 2014, after which the decline sets in:
Such analyses however do not include demand side effects and are therefore limited in portraying an accurate picture of the future. A major factor that was discussed extensively at the conference was fortunately the interplay between supply, demand and prices.
From oil supply analysis to demand analysis - three future trajectories
Steven Kopits from Douglas-Westwood (PDF presentation not available) kicked off the discussion on the role of demand and prices in oil supply by showing that growth in the world economy did not stop despite a lack of growth in oil supply since the fourth quarter of 2004. "Oil supply stopped responding, GDP growth still went up, oil prices rose, and that put us [the United States economy] in a recession, and that's why I argue that this is the first Peak Oil recession," according to Kopits. Based on this reasoning, future oil prices will be determined by how quickly demand will again hit oil capacity limits. Kopits thinks that this could happen quite soon, as he foresees huge growth levels in China. The country is expected to overtake the US in oil consumption by 2018, at 21 million barrels of production per day. The general pattern that he presented is that emerging economies will overtake supply from the developed economies of the world. Oil consumption in the latter will be driven down by high prices resulting in increased fuel efficiency and the development of large scale alternatives. "Belt tightening is expected to happen" says Kopits. So in one future possibility a 'bullish path' emerges where the pattern we just saw happening repeats itself, emerging economies grow, prices rise and developed economies have to give way and are forced to use less oil. The big question in this future is the amount of growth in emerging economies, most notably China. Allen Stevens, of Stifel-Nicolaus (PDF) showed an interesting graph in his presentation comparing per capita consumption in various countries, showing the huge gap between oil consumption in emerging and developed economies.

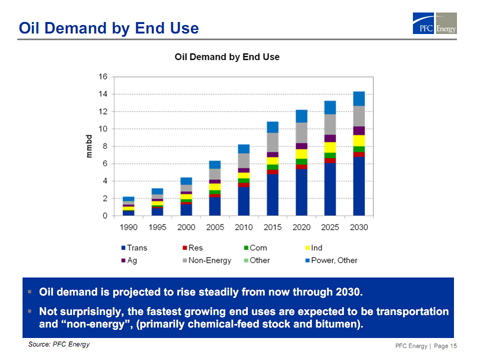
The view that Chinese demand will move up so quickly was contested by Michael Rodgers of PFC Energy (PDF) who gave an outlook on future oil & gas production and consumption in China (PDF). Based on their model that included eight categories of oil demand, energy efficiency, solid but slowing GDP growth patterns, and a similar car trajectory as in developed countries, Chinese oil demand was foreseen to hit 11 million b/d by 2015 and slightly more than 12 million b/d by 2020, shown in the figure below.
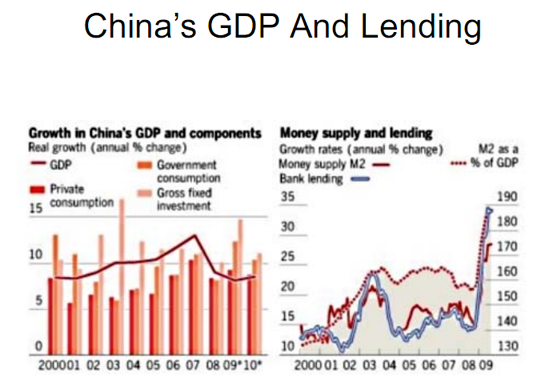
This slower growth was also portrayed in Dave Cohen of ASPO-USA (presentation found here (PDF). Cohen showed a second type of future with a more protracted economic downturn--either a very long slow recovery with many up and down patterns or a more L shaped depression similar to the great depression of the 1930s. The underlying mechanism for this pattern would be the inter-linkage between the Chinese and United States economy. It is clear that Americans must repair their balance sheets and are in deep debt trouble, but also the Chinese economy is not faring so well according to Dave Cohen. He showed that China's GDP numbers are inflated because of the way output is calculated, and that recent GDP growth in China is (almost) entirely due to a huge internal governmental stimulus which is not a sustainable economic investment pattern. "The Chinese, traditionally a nation of savers, needs to build up their domestic demand. This requires steady “organic” year-over-year growth over the next decade or longer. Otherwise, the economy overheats and you get mis-allocation of resources (capital) and bubbles (like now)," according to Cohen. He concludes that China will not provide the consumption engine the world economy needs for sustained growth as their economy and domestic demand is too small, and because of these factors, that Chinese oil demand will not grow in the future at the levels seen pre-2008. The implication of these factors is that there will be a much slower return to high oil prices and several cycles of contraction before the world's balance sheets are again at a reasonable level.
A third possible future which looks at the financial system as the driver of our current situation was shown by Nate Hagens of The Oil Drum (PDF1), (PDF2). Hagens disagrees with Kopits in calling this the first peakoil recession: "I do not think peak oil caused this financial crisis; peak oil is one of many symptoms of an exponential growth based system running into finite limits." Due to continued exponential growth in our financial system that was not based on accumulating sufficient resources, we have accumulated so much debt that this can no longer be paid off under any scenario. "We have an amazing overshoot of debt, by my calculations the total amount of debt, not derivatives but total debt, is between 230 and 290 trillion dollars...That's beyond the ability to pay back...Basically we have overextended the relationship between debt and real assets." according to Hagens. He showed the amount of debt accumulation in the United States shown in figure 8 below, but it isn't just the United States. "The whole world is around 300% to 400% in debt relative to GDP."

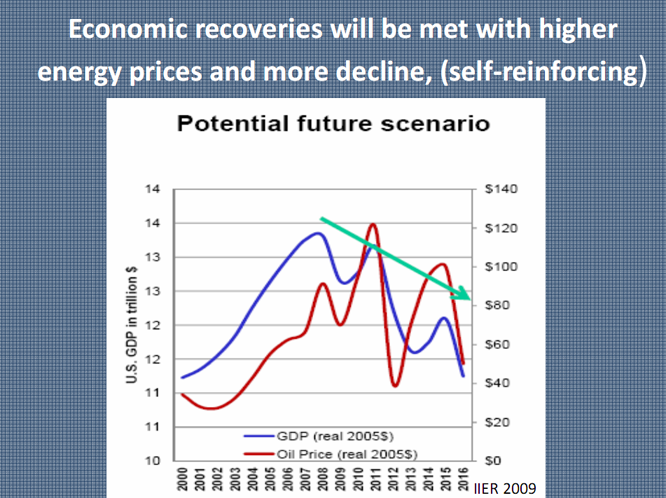
As money is a claim on future resources, and these resources cannot be forthcoming due to limits of growth, a debt deflationary spiral will ensue, resulting in a downward trajectory of GDP, causing a decline in resource prices that results in further underinvestment in resource production. As the world comes out of this deflationary cycle, the physical resource basis for renewed growth will have degraded significantly, higher prices will kick-in again and GDP will be affected. There was no comment on how long this reinforcing cycle would continue or where it would end. Under this scenario we would have already reached peak prices according to Nate Hagens because the future economy can sustain only much lower prices due to the erosion of resource capital. Conceptually this trajectory is shown in figure 9.
Synopsis - uncertainty over our future path
Although supply side analyses show that oil supply can remain on a plateau until around 2014 and would decline relatively slowly afterwards, the picture may change significantly because of the current disconnect between levels of debt in most economies of the world and the physical resource base. Several future scenarios could emerge as a result of this situation. In one future scenario we will witness continued high oil prices as emerging economies are able to sustain renewed strong growth and thereby outbid developed countries with respect to future oil consumption. The resulting decline in consumption in OECD countries will be relatively smooth as high prices induce massive investment in energy efficiency and alternative fuels. This assumes that such fast growth is possible on the existing physical resource basis and that the current debt situation can be managed in some way. In a second future scenario, we see a much slower growth scenario in emerging economies as they too suffer from overhanging debt and are too interlinked with developed countries to be able to sustain high growth levels. The future will in that case be more like a U shaped or even great depression like L shaped situation; oil (and resource) price cycles will occur with high price volatility and a lack of sustained investment. We can muddle through, but at significant reduction in GDP as huge shocks ripple through the system, and also huge risk of political and geopolitical cascades. In a third scenario, the debt situation has become too big to solve globally, and we enter a deflationary self-reinforcing spiral. GDP will spiral downward, resulting in much less investment in the physical base of our economies. In this scenario, even when the economy recovers, resource scarcity kicks in due to a serious lack of investment, and GDP again declines under the pressure of very high prices.
As to which of these futures (or variants) will occur, I have not made sufficient analysis to offer an opinion, but I am sure that collectively there is sufficient knowledge to point to which direction is most probable.
Thanks to ASPO-USA
I want to expressly thank ASPO-USA for organizing this great conference in Denver which has brought me many useful insights in the relationship between oil and our economy.
Insights Regarding Future World Oil Production Based on ASPO Denver Presentations
PDF version
155 comments
Insights Regarding Future World Oil Production Based on ASPO Denver Presentations
PDF version
155 comments
Personnel
Editors
Contributors
Peak Oil Primers
Archives
- November 2010 (3)
- October 2010 (6)
- September 2010 (4)
- August 2010 (7)
- July 2010 (6)
- June 2010 (7)
- May 2010 (2)
- April 2010 (8)
- March 2010 (4)
- February 2010 (6)
- January 2010 (3)
- December 2009 (5)
- November 2009 (8)
- October 2009 (12)
- September 2009 (6)
- August 2009 (5)
- July 2009 (11)
- June 2009 (8)
- May 2009 (16)
- April 2009 (10)
- March 2009 (7)
- February 2009 (10)
- January 2009 (15)
- December 2008 (9)
- November 2008 (9)
- October 2008 (9)
- September 2008 (13)
- August 2008 (10)
- July 2008 (14)
- June 2008 (23)
- May 2008 (16)
- April 2008 (12)
- March 2008 (16)
- February 2008 (9)
- January 2008 (13)
- December 2007 (13)
- November 2007 (16)
- October 2007 (22)
- September 2007 (8)
- August 2007 (9)
- July 2007 (16)
- June 2007 (8)
- May 2007 (7)
- April 2007 (7)
- March 2007 (10)
- February 2007 (10)
- January 2007 (12)
- December 2006 (9)
- November 2006 (15)
- October 2006 (4)
- September 2006 (5)
- August 2006 (5)
- July 2006 (9)
- June 2006 (5)
- May 2006 (10)
- April 2006 (9)
- March 2006 (13)
Vital Trivia
License

This work is licensed under a Creative Commons Attribution-Share Alike 3.0 United States License.
What is interesting to me is that America has over 2-trillion barrels of oil in its Utah oil sands and Colorado oil shale -- yet all official U.S. government figures plot a very slow and relatively insignificant addition of this oil to the national oil mix.
The oil industry and government officials seem to blindly accept that the only way to extract oil from oil sands and oil shale is to heat it, to boil out the heavy oil so it starts to flow. Obviously, by using heat, there are unintended environmental consequences that only Canada has been willing to accept - the consumption of huge amounts of riverwater, burning of half the natural gas in the North country, emission of more green house gases than an oil refinery and the creation of effluent waste tailing ponds that pollute the groundwater.
But now in the 21st Century, using American ingenuity and geochemical science -- there is a new, improved, zero-discharge, environmentally-friendly way to extract oil from rocks -- using a tested, demonstrated and proven technology: EncapSol solvent.
Check out these videos to see the potential future of clean oil production -- this technology obsoletes all the government and industry projections based on the inferior heat-based technologies with all their negatives...
www.EncapSol.com/media -- to see oil sands dissolved cleanly in ice water... and
www.EncapSol.com/tar-sands-and-oil-shale-extraction/ -- to see scaled-up equipment proven to extract oil from tar sands / oil shale without emitting any pollution or consuming any water or natural gas.
With its delivered production cost of <$33 a barrel -- I believe EncapSol may be the one true game-changing technology that can help America produce the 10-million barrels a day that it would need to totally replace oil imports within the next decade.
And by what I saw in the videos -- EncapSol may also be a better EOR method to employ than CO2 or steam-injection to dislodge and recover the stranded, immobile oil that water-flooding fails to free.
So how does this magic EncapSol manage to chemically convert the Kerogen in 'oil shales' into oil before extracting it?
Sounds to me that they don't even understand what oil shale is and this is just a marketing device. TBH I seriously doubt that this would help much; solvent/detergent extraction is fine under highly controlled conditions, which is the case in cleanup and possibly surface mined oil sands - start using this stuff underground and it'll probably just vanish into the rock.
Terrific trader. Please be sure to report back when EncapSol's production reaches 50,000 bopd. I wish them well...really. Because at that point much of our energy problems will have been solved. But until they reach that point nothing is proved. Video's are wondeful. I especially like the ones Disney puts out.
I dunno. I kind of like the Shrek line of videos. I suspect that these Kerogen production facilities will be located in Shrek's swamp, where other fantasy creatures hang out, and where Michael Lynch lives.
I know this is kind of crazy, but would nukes be able to convert some of the shale to oil at a reasonable ERORI?
Definitely possible - you could then chain two (relatively) low EROI techs together to add some decent energy gain to system. But then you'd have to contend with non-energy input limitations - for example how much free water is there in Colorado region for nuclear cooling? I don't know.
Estonia burns crushed oil shale to generate electricity, they do not have to worry about upgrading the kerogen. Most of their electricity is from oil shale.
Estonia has close to the highest kerogen rich shale in the world -- also possibly the easiest/cheapest to mine. Still many problems such as pollution ash from burning etc. The Estonian word for shale translates as 'burning stone'. http://en.wikipedia.org/wiki/Narva_Power_Plants
If you're willing to accept minor reductions in efficiency, you don't need all that much water. How much water does your water-cooled car use per mile? Same thing -- a "radiator" -- can be done for nuclear power stations.
I cannot remember the state in which it was done (I'm thinking New Mexico), but the DoD conducted an underground test in which they used a low yield fission device to fracture formations and liberate NG.It was successful and the extraction of natural gas was done with relative ease; the only problem - it was highly radioactive.Not really sure why they expected any other outcome, it is axiomatic.All those craters in the NV test site are still hot and workers (must) wear badges to detect radiation at all times in those areas to this day.
Some people in the general public might object to burning radioactive gas refined from nuclear liberated oil shales in their autos...
Perhaps those pesky Prius owners!?
Alberta was looking at this back in the ~30s, too (can't remember exactly when). Never happened for the same reason: your oil comes out radioactive.
'the ~30s'?, you wouldn't be from the future and be talking about the 2030s :-)
That was certainly the kind of thing the U.S. nuke boys were looking at in the 1950s and early 1960s. "The Firecracker Boys" by Dan O'Neill is worth reading. 'Project Chariot' fortunately was never brought to fruition. The idea was to blow a deep water harbor out of the earth at Point Thompson, AK using different combinations of hydrogen and fission devices (depending on at which plan was being considered as time went by). The whole project was to be a pilot for blasting a sea level canal through the Panama isthmus with fusion devices. We get a big new toy and we want to see what we can do with it.
Sorry, you're right. (I did put the ~ sign there, in my defense, and I actually had 50s first, but then convinced myself it must have been earlier without thinking about when nukes were developed.)
I didn't remember the exact date; I just remembered reading about it somewhere... probably even on TOD...
My apologies for the brain fart.
No apologies for making me smile, please :-)
I'm hoping your pushing nuke a decade or two back means your a bit younger than me, that all those decades were way before your time. Thinking younger folks are always good to hear from. If your a bronze age relic like me the slip is equally understandable though :-)
I'm in my late twenties, so I suppose that still makes me a young'un! ;)
The thing is, I knew that nukes were developed during WWII, but I wasn't thinking about that considering when people were contemplating using nukes to liquefy oil in situ, as silly as that sounds!
How does this work? Kerogen is insoluble in normal organic solvents.
Sounds a lot like these old detergent ads to me...
EROEI?
-- can't possibly be as good as just sticking a staw in the ground and slurping it up --
Not to burst any balloons or anything, but by the time you dig up the entire formation, crush it to a fine powder, treat it with detergent or whatever, then separate the powder from the kerogen (and recover the detergent?), you may have a useful product. But it isn't going to allow the exponential growth to continue exponentially. And I sort of doubt that it will allow for a flat plateau.
** watches videos **
So you're selling carbon tet?
DIY -- I suspect he's more likely buying options on EncapSol. Not realy a bad play IMO if we see oil spike up this winter. Not my type of game to play but to each his own.
Rockman, Are you expecting oil to spike this winter?
CRM -- It might surprise but I don't spend time contemplating such matters. If I were an oil speculator trying to make money on such a possibility I would. If I think about future prices at all in more in the time from of several years down the road.
But since you asked I make a guess: it's possible. But that's based on expectations of unpredictable events occuring. Is that a confusing statement? Is to me also. Guess that's why I don't try to make a living guessing oil price movements.
I continue to think that burning the stuff in situ and capturing the heat to drive a generator is going to be the best strategy. One might actually get a good positive EROI with that approach, and the capital investment and environmental impacts would probably be more manageable as well. Whether the EROI and ROI would be better than renewables like wind or solar would determine whether or not such a scheme would actually fly.
This looks a little strange.
If this process works both with raw Utah tar sands AND with Colorado oil shale(type 2 kerogene) it seems to use a solvent to remove only bitumen from the both. Bitumen amounts to only a 2% part of Colorado oil shale hydrocarbons(kerogen) which is 50% of raw oil shale. Heat would then be required for cracking bitumen to make syncrude.
http://pubs.acs.org/doi/abs/10.1021/i460003a029
OTH, the government is backing reseach into sequestering CO2 back into in-situ oilshale retorts after oil/gas extraction.
https://newsline.llnl.gov/_rev02/articles/2008/dec/12.12.08-shale.php
If that gentleman giving the demonstration wants to really impress with the evironmentally friendly aspects of EncapSol extraction - he should extract all of the dissolved bitumen from that glass of cold water and drink what remains.
Don't mean to be a smart ass here; a little more transparentness on your part would make your sales 'pitch' go much further.
btw...All controversy aside, it is an impressive bit of chemistry.
Rembrandt - a wonderful summation which will take me a while to digest, many thanks.
I like Chris Graph.
I'll go through my interpetation of the world using this graph.
For the Non-OPEC non FSU case.
Production 33.5 mbd or 12GB a year.
Reserves 175 GB.
At a constant production rate then the reserves would be empty in 14 years or a 7% depletion rate.
Next assume that a lot of the remaining reserves are not going to be produced at this high production rate.
Say 50% will be at a lower rate. This puts you at a 14% depletion rate for the "fast oil" or your out in 7 years.
Next of course I think this is itself no longer true since we are declining already i.e the fast oil is much closer to gone or these numbers where true about ten years ago not today. So the fast oil is closer to zero.
Next assume the world actually produces the same way from its reserves as the better documented Non-OPEC Non-FSU
Using this chart and adjusting the reserves to match output gives.
OPEC 182 Bnb
Non-Opec Non-FSU 175 Bnb
FSU 66.5
For a total of 432.
And as I said this number is dated i.e it was true ten years ago effectively non of the oil produced in the last ten years has been removed from reserve claims.
At 30GB a year globally then you run out in 14 years.
Assuming production rates decline rapidly say 70% of the way through the 432GB of fast oil suggest you decline about 10 years after you maximize your depletion rate.
Now this is really rough obviously regardless assuming a 10% depletion rate and using this sort of argument that everyone is producing oil the same way therefore the supporting reserve levels are the same then noting that they haven't changed much in years despite the high depletion rate and low new discovery rate.
You get the same answer. And no reason to believe the 175GB number for Non-OPEC Non-FSU has not been inflated some its almost certainly high not low.
And I am disregarding a lot of oil thats probably real and booked as reserves right now but this is oil that is expensive or slow to produce are generally both and the production rate for this oil will be low. Notice I completely ignore tar sand production as being irrelevant to our future. It literally does not matter if oil production falls 50% over a span of a few years the tar is not going to save the day.
In any case its not that hard to pull my scary scenario out of the graph all your really doing is assuming OPEC is lying and same for the FSU countries and to much smaller extent even the Non-OPEC Non-FSU group.
I think the graph should be renamed the stack of lies :)
Whats funny is simply assuming everyone is actually about the same and the Non-OPEC Non-FSU is close to reliable makes the situation interesting and thats not a bad assumption to make at all.
It alone is sufficient to decide no way can the world produce at its current levels for much longer and probably it will decline rapidly.
Then all you do is recognize that if thats true these numbers are time shiftied i.e given what happened in 2008 you know the "decline" is in the past.
That's nonsense. You have to get your terminology right. Depletion rate = Common or conventional definition of depletion rate which is annual production as a percentage of remaining reserves (assumed to be the same as total reserves less cumulative oil reserves produced). Or Aramco's definition of depletion rate which is annual production as a percentage of total reserves (assumed to be the same as initial proved reserves). See Sam's definitions: http://www.theoildrum.com/node/2476
In this case, 14 years at 7% is (1-0.07)^14=0.36, which means 64% is depleted after 14 years. It sounds like you are multiplying 0.07 by 14 and getting close to 1. That is within an order of magnitude but anything is within an order of magnitude when talking percentages in this way.
I am with elwoodelmore on this one, and agree that we have to use terminology correctly. I use this all the time in the Oil Shock Model, and would be way off if I made these kinds of mistakes.
Crazy.
Why would oil production fall like negative compounding interest?
Does oil production follow the laws of radioactive decay;
N=No*exp(-t/T)?
Please explain your reasoning without falling back on definitions.
How about some observations? The Lower 48 has fallen at about 2%/year since peaking in 1970. Texas, about 4%/year since peaking in 1972 and the North Sea at about 5%/year since peaking in 1999. There are of course fluctuations from year to year and even occasional year over year increases in production.
In any case, the crux of our argument regarding Net Oil Exports is that once production peaks in an exporting country, the net export decline rate tends to accelerate with time.
You can model it as a linear decline as well.
[(-3.1) +(-5.9)+ (-1)+(-.3)+(-1)+(-1.1)+(-4.6)+(-4.4)+(-1.5)+(-.7)+(-2.2)]/10 = -2.58% US average
10th root of 96.9 x 94.1 x 99 x 99.7 x 99 x 98.9 x 95.4 x 95.6 x 98.5 x 00.3 x 97.8 =96.7 or -3.3% geometric decline.
http://www.eia.doe.gov/emeu/steo/pub/gifs/Fig13.gif
I agree that oil is declining but the overall declines are smaller than is presumed by many here, so the assumption of large extraction rates in a plateau followed by a cliff seems more logical to me than a smooth continuous decline.
Depending on the decline rate the functional form will be obvious in a matter of months or years.
The question is did we globally maximize our depletion rates to maintain a high production rate as a side effect ?
If we did then with a very broad view the production curve for the world should approach a shark fin like curve.
Since the depletion rate depends on remaining URR its a bit of a catch 22 to figure it out your forced to guess esp if published URR are themselves suspect.
Hueristics like HL that use changes in production to model the underlying URR can't detect acclerated depletion rates they are assuming in essence a constant depletion rate. This is a constant technology solution.
Most other models include reserve estimates esp backdated reserve additions to model future production but obviously if the expect URR is wrong then these models are including bad data and eventually have the wrong answer.
I see no reasonable way to solve for real depletion rates since you have to have real URR's which is what your interested in.
However you can readily assume that global depletion rates i.e remaining oil is closely related to the average lifetime a field remains in its primary production phase. If fields on average produce at their peak production level over ten years then the depletion rate of the "fast oil" is 10% and this is what I'm focused on.
Field by field production tends to be effectively a square wave the field is rapidly brought online produces close to its maximum rate for several years then goes into a steep decline that eventually slows at a much lower production rate and can remain there for many more decades.
So certainly there is a floor to global production even after most fields have entered decline and its not small but also not close to todays rates where fields in their mainline production sequence make large contributions to overall volume.
Rockman mentioned it and I've seen the numbers but a substantial amount of the US production today is coming from a small number of fields most deep water plays that where brought online from a late round of discovery and are in their mainline production phase. If these fields are not replaced with new production then you should see a steady decline in overall production as the aggregate get smaller and a sharp decline as the last fields in mainline production decline.
Assuming a low discovery rate and maximum depletion rate then without significant replacement if your mainline depletion rate is 10% you have ten years from the time you maximize depletion rate until the onset of rapid decline.
And easy way to think about it is to take every field in production today remove those being produced at high water cut and low depletion and production rates.
For these fields map them 1:1 with the replacement field given a ten year time of maximum production then their replacement fields should be in some stage of development. Where is thunderhorse's replacement for example or Cantarells ?
I argue you better have a large number of fields coming online to offset the decline of fields running in mainline production just to ensure that the overall production decline rate follows the lower decline rate of depleted fields.
No real equation just a mapping. I've looked and in general most of the worlds fields go into decline without replacement. Once the last of the "fast oil" is gone which supports the worlds fields that are in mainline production then its gone.
Next of course as a field leaves it primary production time generally you have a flurry of work that often arrests decline for a few years this is common enough that you have a sort of second level. But the time at this level is even shorter and generally the next onset of decline is even steeper.
Next in many cases remedial work thats profitable onshore is simply not worth it in offshore fields over the last few decades offshore fields which tend to have even steeper decline rates and less workover have made and ever increasing percentage of total oil production.
Now there is no real synchronization of course fields are brought online randomly however as discovery fails to replace fields even though their is a spread in when fields where brought online the discovery profile is assumed to be heavily weighted towards the begining of the period providing effective synchronization of the last group of "fresh fields" brought online. Basically the last set of decent size reserves in well explored regions are identified and brought online in a distribution heavily weighted to the end of the last discovery sweep. Also of course as discovery ends fields that had been previously found and had their production delayed as being uneconomic are brought on at this time.
Overall you get a sort of surge where all remaining assets or fields tend to be developed over a fairly narrow time span as discovery across all basins reaches its mature phase.
Its important to understand that actual discovery plays a very small role in all of this the contribution of fields from the last round of discovery is small the vast majority of these fields consist of resources that had been known for a very long time decades in many cases yet for a variety of reasons the production was delayed. In many cases they are reasonable to produce simply better opportunities existed. Think of someone moving slowly in a line with people constantly cutting in front of them or a slow moving car in traffic. They are not exactly bad fields just never managed to make it to the front of the line until no one was left to cut in front of them.
Discovery or rather the tail off of discovery thus primarily acts as a trigger event and tends to cause the last set of fields to be brought online in a fairly tight group.
Next this is not based on some sort of financial signal i.e oil prices did not suddenly rise when this happened its just that for oil producers to maintain current cash flow they had no choice but to develop the less desirable assets that they had put off for a rainy day. In fact as they bring these marginal fields online they actually book steady if not increasing proved reserves.
Next in our particular case extraction technology had improved rapidly a lot of the improvements driven by operators that reached bare cupboard stage first i.e the first to be forced to do this spurred the technical advanced ensuring that the technology was ready and waiting when the majority of field operators started to get pinched.
In fact it was a very smooth handoff as we had to develop less desirable reserves early marginally profitable work in doing this had already solved the technical problem of developing them at high production rates.
Everything looks fantastic ! The oil flows reserves are ample the ability to extract marginal reserves is seen as a new lease on life the only mistake is ignoring the fact that your bringing online fields which had been repeatedly deferred as previous rounds of discovery found better opportunities.
From this point on the clock is ticking. Real discovery cannot hope to replace these fields that where brought online. The extraction methods ensure maximum depletion and when they are gone oil production falls rapidly. The gaggle effect if you will caused by the desire to maintain production levels ensures greater synchronization in the timing of decline then you would expect. Certainly at first some fields can be mapped to replacements i.e at the field level you have serial replacement maybe one or two rounds but this generally only serves to cover the most rapidly depleting fields. Say you have in your group of last fields a number that decline in five years instead of ten. Given you goal is to keep production levels constant your simply covering early decliners with later developed fields most often getting another five year field to replace a declining five year field.
Here you can think about a number of queues with a small bunch of people held from entering a queue if one of the lines moves faster you send the people in your group to the fastest line balancing the queues until you run out of your bunch of people. This is of course generally accomplished via the transfer of productive assets and potential fields between companies. For the NOC's its similar except your simply bringing on more assets faster if needed and if they exist.
On the technology side its obvious that we have the technology to develop basically any field from the Bakken to deep water plays technology for the most part lead the need to develop marginal fields so its not restrictive. Certainly in some cases we hit new extremes but the basic technical capability existed to do it.
Then you just wait the first major price spike signals that the game is over you can then pin down the exact situation very well after the price spike discount fictional reserves as not contributing to high future production levels and your done and oil production is done.
I too was wondering whether to be 'reassured' that oil would plateau and taper off, but a couple of the PDFs I looked at left out:
- slow ramp-up from deepwater plays
- disappointing flows from new fields
- faster fall-off from mature fields
- Net Energy
- ELM
.. and dificulties refining heavier sourer crudes (around which there were fascinating discussions a couple years back..)
This intuitive grasp of whats going on appeals to me, and left me wondering what they missed in the presentations I looked at.
But there sure remains the possibility that for whatever reason we won't see a severe drop-off for a decade or so..
Well first and foremost is the simple lack of understanding about how horizontal wells mature not that they don't fall off rapidly when the water hits or gas depending on the field thats known but when a horizontal well is going to water out of fail in some manner is difficult if not impossible to judge.
Next as far as I can tell mundane well workovers not something most people think about seem to be the culprit if you will. In the good old days often when primary production ended or a well became problematic you just shut the field down or capped the well and went on to something else. This is say back in the 1930's. Of course people without other fields to exploit took time to try and fix the field and get the oil flowing again even back to the very dawn of the oil age workovers where by no means unkown.
However over time of course we got better and better at managing fields slowly at first then better and better overtime. Something hard to quantify but true. As we got better the general effect was to maintain high flow rates through a good bit of the fields lifetime. Its something that looks innocuous at first but lets say you have a problematic well and you do some sort of workover and the well flows at its past production rate or higher for say two more years. Then multiply that buy several thousand wells all producing at higher flow rates for a few to several years after workover when they would have been capped without the workover.
If they had been capped the oil would not have been lost to production maybe produced later in the high water cut phase or produced via a horizontal well drilled as the oil column fell etc.
For us to have a fast collapse in oil production while the oil industry is claiming production will climb out into the 2030 and most models predict a slow decline then it means something or probably several basic things have been overlooked about oil production.
1.) Horizontal drilling (super straw ) Known but not quantified in any oil depletion model I know.
2.) Well workovers extending the productive life of the well. ( Probably first time this has been discussed)
3.) Advanced remedial action including infield drilling (horizontal)
4.) Better imagining technology i.e we drill the wells in the sweet spots less guessing.
5.) General advance in field management and monitoring.
6.) A slew full of technical advances in all phases of production not easy to categorize.
7.) This is HUGE the artificial cutbacks in production also resulted in a higher price for oil then geology would have dictated this of course acts as a tremendous driver to expand extraction as fields that should not have been profitable perhaps for decades are brought online profitably because of the artificial price support.
Associated with artificially high prices for oil was a related expansion of credit and fiat money system that allowed the economy to readily absorb the high prices indeed despite the large jump in prices after the 1970's vs before oil was considered cheap and not a big expense in the overheated fiat money economies. Of course this easy credit was just as available to the oil industry as any and the fairly steady growth ensured future demand so drill baby drill.
Look at the insanity of the housing boom which resulted from artificial market conditions. For a very long time the artificial price support made most reserves profitable many decades earlier then the would have otherwise been.
8.) How much did OPEC really cut back ?
The following offered without a shred of proof but just consider if its correct. Consider how things would have
played out if the following was true vs known history esp recent history.
My own research indicates that "hot oil flows" remained high for decades.
Hot oil is oil sold without being officially recorded. So much was sold out of Texas that the official number for Texas production are practically useless. I've looked at texas several times and as near as I can tell over the course of about 50 years from 1920-1970 it looks like 40-60 GB of oil was probably extracted and sold outside of official channels or about 200-300kbd or about the production of Thunderhorse today. Texas peaked at about 3mbd so about 6% to 20% of its production was not going through official channels. This is hard to figure but the lowest reasonable result I could get was at least 10GB of oil was sold illicitly in Texas. Even with that figure your talking about 10billion high power gold backed dollars many earned at the height of the depression and later during WWII. And this is on top of official production. A fairly small number of primarily Texans controlled enough wealth to basically buy any government they wanted to purchase and then some. This is power beyond anything the world had ever seen. The railroad barrons of old don't even hold a candle.
http://en.wikipedia.org/wiki/United_States_public_debt
To give you and idea the entire US budget deficit in 1930 was 16.2 billion dollars. If illicit oil sales out of Texas in 1930 totaled to even 500 million dollars in 1930 thats huge ! Inflation adjustements don't do justice to the real buying power of cold hard cash and large amounts of it back during this period (If not today).
Next as far as I can tell these Texans primarly having made enough money to practically rule the world for all intents and purposes played the same game later with Saudi Arabia after Aramco was nationalized. Certainly Saudi Arabia pulled back in production to support prices but no where close to the amounts claimed again this is hard to figure out but my best guess is they where shipping at least 2mbd more oil than they claimed for decades. Again we are talking about amassing immense fortunes on both sides of the world at the production and distribution end and this is of course on top of normal production.
Later on yet one more time this exact same game was played after Russia collapse again with real oil flows lower than before collapse but much higher than the official number. The Russian Oligarchs are rolling in cash to rival the Saudi's where did all of it really come from ?
In all cases overtime maintaining the hot oil flows became increasingly problematic and your beyond filthy rich and have money to the point of controlling or swaying large parts of the world from business to politics.
What government can resist concerned super powerful citizens willing to support activities that it wishes to engage in but are difficult to fund even through secret budgets ? Esp ones already corrupted ?
If I'm right then the hidden wealth from oil has had a very profound and corrupt impact on the entire world for decades small wonder the US is not well liked.
Maybe I'm crazy maybe not however it does explain to some extent why peak oil is something the oil industry and government does not take to seriously if real oil production has routinely averaged higher then reported would you believe in peak oil ?
Knowing this makes it difficult to support peak oil even though you can't explain why of course :)
I could see some super rich Texan scoff at peak oil.
I know there is plenty of oil around heck back in the 80's I brought in almost 1 million barrels of day from Saudi they never claimed they produced. From Nigeria over 200kbd plenty of oil boy plenty ..
Opps maybe I should have not said that :)
Who knows the exact numbers but I'm pretty certain they where fall from small and more than enough to ensure the worlds oil supply was ample.
As a side note during the oil embargo of the 1970's official production did not drop all that much in fact many conspiracy theorist point out its difficult to get the gas lines and other problems associated with that period from the small change in oil production. However if what really happened was a much large cut off of illicit flows then it makes more sense and also a much more powerful political statement.
http://en.wikipedia.org/wiki/1973_oil_crisis
If you included the cessation of potentially substantial backroom deals for large quantities of oil then things begin to make sense. If for example you assume hot oil flows out of OPEC where and additional 5% over official production and the cuts where actually 10% of real production off the top with the sweet under the table deals ceasing then the resulting economic fallout becomes sensible.
And last but not least if this is even close to correct even if my guess about the absolute flows our wrong it does not matter. If this hot oil trade exists and is large enough magnitude then at some point of course around the world reported production began to exceed real oil production and the flow of hot oil dried up well before the official number ever reflected even a decline. Obviously this served as a loud and obvious signal right to the top most powerful people in the world that the real situation in the oil patch hand changed and the flows of oil had changed for the worse. So consider this when you ponder the above ground events.
Now as far as overall oil production flows go I doubt the illicit flows ever exceeded 5% of total oil production for the most part if that in the big scheme of things they are not that important their importance lies in if I'm right about their existence then the politics around oil are different from whats commonly assumed and obviously I think it explains the reluctance of the US to "get off oil" even foreign oil as for all intents and purposes we have paid a huge hidden tax directly to the wealthiest people in the world for decades.
Of course I could be completely insane except once you put it all together like this to much makes sense.
This is the basic game that underlies all the others played out on top and neatly explains why we did what we did.
It provided for a few wealth and power beyond imagination on top of public wealth and power that was barely conceivable and of course resulted in a very warped and corrupted world.
In fact I'd not be surprised in the least that sometime from 2005-2008 if we did not briefly have one or a few trillionaires in existence. We may never know but that gives you the scale of what I think the financial clout of the true wealthy is and of course puts working class stiffs like Bill Gates in their place.
Whats funny is if you take the global economy as being being about 30 trillion a year and consider the accumulation of wealth into the hands of a few over decades and in some cases centuries then it actually fits fairly well with the size of our economy. Its not as crazy as it looks esp of course as you consider the many other ways money makes money the oil money simply worked to create the seed insane billions.
So I think the super rich know whats going on via their early warning hot oil network that probably basically gone now however I think they are arrogant enough to think they also know how to profit even more from the situation.
That was indeed a roller-coaster.
In my experience, most things offered without proof are automatically correct. That is why the bible is correct, for instance.
Usually if you are not sure if you are crazy, it means that you are not crazy. Usually.
Wow, you personally brought in 1 million barrels from Saudi Arabia? Color me impressed.
I am even more impressed, kind of like the daily double.
Smart thinking. That's the way to profit while at the same time consider the needs of the world.
TOD really likes conspiracy theories.
Indeed, sound logic is the perfect antidote to prevent the onset of insanity.
All this talk of craziness and insanity has me rethinking my entire strategy. I will invert all my models to return the negative of the square root of the result to account for this. Pronto.
BTW, has anyone ever heard of Phil Hendrie?
Um US oil production peaked in the 1970's we had wars embargoe's etc etc.
And of course Jimmy Carter urging us off oil. We adopted a financial model of infinite growth that will obviously end in disaster. Deficit spending etc etc.
Why ?
It was done for reasons and near as I can tell damned good ones if your at the top. Once you understand it despite the evilness of the decision it has to be one of the greatest con jobs ever.
At the end of the day its nothing more than a fancy variant of selling bootleg liquor or any sort of drug. The basic business model is pretty simple it even includes having the most and best armed thugs on the block.
So in the end it nothing more then a bunch of mafia thugs running rackets except perhaps deeper involvement on part of the banks.
I am not talking about a business model. We are discussing a physical depletion model and how you are interpreting the data. The fact that economists always want to turn everything into a fiscal model is why we never made any progress in modeling in the first place. Only a few people ever wanted to discuss resource constraints and the impact that by itself has on the evolution of peak oil.
The lineaments of why only a few people wanted to discuss resource constraints, was for the simple demonstrable fact - it is not the policy of our government to consider conservation.
In point of fact, these policies of wastefulness are surrogates and substitutes for the real purposes of organized warfare (as a means of controlling the population).
These surrogates must meet two principal criteria:
1. They must be watseful, and
2.They must operate outside the normal supply-demand system.
The surrogates must not be accessible to the whims of the people.In other words, the people must not be able to demand that their government stop spending their tax money or allow natural resources to be used in a watseful manner.
A viable substitute for war as a social system cannot be a mere symbolic charade.It must involve real risk of real personal destruction and on a scale consistent with the size and complexity of modern social systems.Unless it provided a believable life-and-death threat it will not serve the socially organizing function of war.
Memmel is correct in discussing social trends and political agenda in regards to resource constraint; for this is the core root of the current dilemma.
This is why someone of Matthew Simmons caliber can make a perfectly logical argument for conservation on national television and have his pleas for sanity fall upon deaf ears.
People in the industry such as yourself are the real experts, and it would behoove the general public to stand up and pay attention.Unfortunately this is not the case, and the reasons why should be part of the discussion.
May I just add that prices can be discontinuous at the margins, so it's not necessary to postulate conspiracies to explain large jumps in prices for oil/gasoline during the 70s as a result of very small changes in production.
Your right its not but you need a tremendous money pump to create a fiat currency you can print at will out of a gold standard reserve currency. The petrodollar was created from petrodollars.
The Petrodollar - One of the pillars of American hegemony.
Any move away from the petrodollar recycling system by a nation is tantamount to a declaration of war.Just by coincidence when Iran made steps to eviscerate itself from the system Faux Pas News reported that a "new" uranium enrichment facility was found.
Fair and balanced indeed.
In a sense, the American Dollar is backed by oil; it is the oil currency.I believe de Gaulle made a remark on the wonderful advantageous policy that the petrodollar system provided for the United States economy.A PHD in economics is not required to assess how the US acquired such an advantage over the nations of the world:It is axiomatic.
I'm sure winning WWII--after letting GB dangle in the wind until they had accumulated enough debt load to insure U.S. world economic dominance would have no rival for decades-- while not suffering ourselves by being invaded or nuked (geography having been one our greatest allies), had nothing to do with our gaining such an advantage in the world. Our guns economy went to producing record amounts of butter in a hurry, and U.S. business reaped the real spoils of war by grabbing a good chunk of the west's and Japan's industrial profits while our capital did a lot of the heavy lifting required to rebuild those devastated economies. I guess we should have just taken all as tribute and kept those countries on their knees as long as our might would let us. Growth would have been much slower...oh well we blew that one big time.
No doubt our behavior has left a lot of room for improvement, but many, many big victors have acted much worse. I felt we took a major wrong turn when we turned Carter out for Reagan. I truly hope there is still time to make right much of the wrong we have set in motion since then. The arrogance winning the cold war let us assume has set us up for the nastiest of falls.
Question: if the petro dollar system didn't come into effect until after the U.S. once and for all left the gold standard in 1971, and de Gaulle died in 1970 did he make those remarks during a seance? De Gaulle did trade all France's dollars for U.S. gold he could, though. The old Vichy boys who really held the power weren't going to give the U.S. any edge they could avoid giving it, that is certain.
Let me restate that - I believe de Gaulle made a remark on the wonderful advantageous policy that the Bretton Woods USD system provided for the United States economy as all major currencies had to be pegged against the dollar to America's (corporate) economic advantage.That is why I put the disclaimer - I believe - but I knew his discrepancy was against the USD directly.
And just how did the USD become the worlds reserve currency?
The reason why Hiroshima and Nagasaki were nuked was more for the show of insuperable power since all of the generals knew the war was already won; confer with The Joint War Plans Committee.This is the real and tangible reason America imposed its will on the world at the close of the war - lets be realistic here.
"...No doubt our behavior has left a lot of room for improvement, but many, many big victors have acted much worse..."
Is this a good reason to oppress Luke?
I'm sure all empires fed that line to their subjects.As we debate America has upwards of 800 military bases all over the world - Rome could only dream of having that kind of influence.
I suppose entertainment and vise (bread and circus) keep most Americans from contemplating we are an empire.As Carter's reasoning showed us, most of us really don't give a crap; and you obviously are aware of this.
r
Got a couple bases in my town, and telephone solicitors often ask 'what the country of Alaska is like" so I might be the foreign oppressed. Except I just happen to make a good chunk of my livelihood building stuff for those bases. I'm sure we spend plenty locally in 'other' foreign countries. That doesn't mean I think our military is sized properly or that the money couldn't be spent much more productively. One sign of an empire failing is inordinately high military expenditures, the debate lies on the definition of inordinate right now. The U.S. can only dream of having the tenure of Rome, heck we don't even have our own language so our influence will be truly fleeting.
I noticed you didn't rise to my Vichy bait though. As for the nuking, its a shackle that those who are more aware drag along. My father was in the invasion force staging off Japan when the bombs went off. He'd already done somewhere around seven beach assaults, his original platoon had lost over 80% of its personnel and his H.S. graduating class didn't end up faring much better. Whether or not I'm here typing this because those bombs made it so so many others never could is an unanswerable question.
And finally, in answer to your question Just how did the dollar become the world's reserve currency? I'm guessing the normal way. We cheated.
To add since I've not mentioned it. The US left the gold standard in the 1970's we screwed over the entire world beyond imagination and we pulled it off. And on top of that we peaked in oil production ourselves at the same time.
Somehow we managed to not only pull it off but come out on top. The games with oil played a huge role in stabilizing the new fiat money regime.
Crazily enough our oil consumption literally backed our currency. If we had gone down then obviously the worlds oil prices would have collapsed without oil consumption from the US the worlds oil producers had to accept our money but we also had to sweeten the deal.
Certainly it was a rough start the 1970-80's was not a lot of fun but we pulled it off.
I've focused on oil in this thread but the move off the gold standard and establishment of a fiat currency as the reserve currency of the world is the real coup. I'm of the opinion that oil and esp games with oil played a big role in pulling it off it was and is petrodollar standard powered buy US consumption.
Also of course the fact that inside the US we continued to export goods for dollars helped a lot they where not suddenly worthless. However of course to do that we needed oil.
So certainly there is more to the story but for now it makes sense to focus on one important part which was using US consumption to create concentrated wealth in our fiat currency. By literally stuffing he Saudi's with dollars that of course had some value we kept the oil flowing or like I said got it flowing again after some rough patches :)
The key is to appreciate what we managed to pull off the move to fiat technically if you don't look at the debt it bought us forty years of prosperity ( if you look with the right rose tinted glasses :)
Now as far as the US playing games with oil well I doubt you ever find much on Saudi Arabia however we have this.
http://www.washingtonpost.com/ac2/wp-dyn/A58701-2005Feb2?language=printer
And the Shah ?
http://www.britannica.com/bps/additionalcontent/18/34793330/Showdown-at-...
In any case plenty of evidence that the type of actions I argue happened have happened.
The Saudi-US connection remains opaque but ...
And of course the petrodollar part
http://en.wikipedia.org/wiki/Petrodollar_recycling
Evidence of opaque observations without a formal argument does not constitute anything and it likely signifies nothing.
I agree that there are likely errors or biases either way. Depletion rates may well be higher than estimated.
However, it is common to assume in all these projections that whatever the deplation rate is for a country or region, that same depletion rate will continue into the future. However, if the price of crude oil doubles and then doubles again, then existing technology will be used and new technology will be developed to produce more crude oil from existing crude oil fields. These crude oil fields will produce more crude oil. This is called the elasticity of supply. Thus, in addition to an elasticity of demand (as prices increaes, demand falls), there is an elasticity of supply. This fundamental aspect of capitalism needs to be incorporated into these models or else they risk being biased low.
A good example is natural gas from shale. Several years back several individuals hypothesized that natural gas supply in the US would plummet and prices would skyrocket. Natural gas prices did increase which was the likely driver for producing natural gas from shale. Shale gas has increased our natural gas supply, which has caused natural gas prices to fall. Of course there is now debate on whether shale can provide a significant supply of natural gas looking towards the future. But the point is that 5 years ago, this development in natural gas from shale was not forecasted by people within the peak oil community. We may underestimate the ability for increases in crude oil production in response to higher prices.
Retsel
Ambiguous. Please indicate the functional form you are referring to.
Why is high production rate a side effect? Production rate is the MAIN effect.
I have yet to see your shark fin like curve. We have all been imagining it yet you have not shown a GIF of one.
No such thing as a remaining URR. As Elwoodelmore says, we have to get our definitions right so that we can communicate.
No, the logistic curve that is the basis of HL is an exponentially accelerating technology solution.
Backdated reserve additions can be included in the maturation part of oil production no problem.
Wrong, as old mature parts of the discovery curve can be used to fit to a Bayesian-compsited and modeled discovery curve, which then provides an accurate way to estimate depletion rates.
This is in contradiction to your previous statement. See my discussion of the work by Hook, Aleklett, et al elsewhere in this thread where they can estimate the depletion rate form big oil fields with a small variance.
That does not describe a square wave, the real curve is much more continuous and looks more like a 2nd-order gamma function (i.e. the convolution of 2 exponentials).
That is a non-sequitor. Of coarse a "floor" to production is zero, since you can't have negative production rates.
Excepting for the new discoveries that come on line due to the natural dispersive discovery envelope.
10% at 10 years brings it down to 35%. I feel like I am talking to a wall here. This is the second time in this thread I have had to correct your depletion rate definition.
Can't argue with a hypothetical.
A tad pedantic.
OK, I see, the pedanticism is a form of hand-waving. Some of us actually use "real" equations and spend some time doing real modeling.
What is a "sort of second level"? The use probabilities correctly precludes the appearance of any kinds of discernable level transitions. It's all a continuum, for example the transition from an exponential decline to hyperbolic is very smooth.
That is likely correct.
All discoveries are dispersed over time. A good model does wonders to explain this. I use the concept of convolution so that somebody else that wants to investigate this themselves can go ahead and work out a simulation.
This flies in the face of the maximum entropy principle where you should assume a high variance in dispersion unless you have clear evidence that events cluster. In other words, don't assume a synchronicity of events when a stochastic spread applies.
So you say that actual discovery plays a very small role in all this? I really don't know how to respond to this as it seems to push an "immaculate conception" version of oil production. Perhaps what you want to say is that the discovery peak occurred more than 40 years ago? And that new discoveries can't make up for the maturation of those fields?
Wrong, dispersion of various discovery efforts world-wide precludes a "fairly tight group". I might perhaps believe what you assert if you had some evidence or a model of this occurring. What could happen is that production can be throttled or gradually increased depending on global socio-political events.
Reading too many tea-leaves here. Reserves don't necessarily need to be developed to be booked.
A illustration of a cupboard or something might help with your analogy.
This is getting to ba a bi of a slog at this point.
Congratulations on a double-reverse layout with a 360. I have no idea what you just said.
That description is the best reason for using probabilities as replacement for logic (don't laugh, ET Jaynes says that probabilities forms the basis for all logic). Anything that you can describe as a typical field or decline, you can then model as a probability acting on an ensemble. With that you can actually show a graph that people can perhaps understand a bit more readily.
Yes, and queues are best modeled as probability flows. Although I really don't understand the significance of this.
Is this merely a platitude? Otherwise I don't understand it.
"Game over, man! Game over!"
You know that was just a movie, don't you?
Well Web lets give it 3 months then another 3 then another 3.
If I'm right about where we are at there is a reason for me suggesting three three month intervals.
But first and foremost for the first 3 months lets see what the price of oil is January and what storage levels are at.
My best guess is oil should be in the 90-120 range by Jan and storage levels at least in the middle of the five year range by then. Sorry for the spread in prices for Jan but there is some financial games that can still be played that effect pricing at that point. If we aren't at this level by then then even at that point I think a shark fin collapse model becomes highly doubtful. The recent price action of the last week allowed me to narrow down a bit where we might be during a fast collapse.
My point is I don't really care that I'm being "stupid" if you will does not matter much to me. Either TSHTF for oil over the next several months or it does not.
I feel like a real discussion should wait either I'm full of crap or I'm having a hard time explaining myself.
Or probably both which is of course worse.
We are either crashing and burning right now or we are not. Regardless of how messed up I make my presentation of what I'm trying to explain it does not matter.
I'm comfortable enough to instead simply suggest lets see what happens over theses sets of 3 month intervals.
If production started crashing then it was obviously on its way down by 2008 I think that single "fact" is all you need to know. And if its crashing its also obvious that the economic crash bought a very small amount of time thus we hit the wall again rapidly. If we do then and if things turn out reasonably close to how I think they will then I'd argue that my position of lets let the experiment run for a bit and check the results then discuss how to model it.
I'm actually hoping some facts get shaken out during the process that will help matters immensely. I've had to guess way to much but with luck perhaps we either get facts or more likely some blatant lies that are highly questionable.
So many numbers have been fudged in different directions over the last several decades nothing is clean enough to be useful. We went from massively understating oil production to massively overstating it over a span of 40 years.
To the tune of 4mbd or more understating real production to eventually overstating it by that amount or more.
Thats enough to muck everything up. If that alone is true then our "numbers" are themselves basically junk.
Its guess work on guess work to even guess what real oil production was the only reason I'm comfortable with it is its amazingly self consistent. Once you figure out the fraud then turns out everyone played the same game for the most part over and over again. Not surprising since most frauds are simple variants of known approaches.
You don't really care and given before you even start you have to "uncook" the books. I don't know what to tell you once you have the model then you can see where the books where cooked for me its now obvious esp since everyone generally does it the same way but it went from understating oil production to overstating it. So worse not only are the numbers cooked they are cooked in two different directions over the last 40 years.
This off course leaves evidence one you think you know the game being played with the numbers then you can detect the fraud its actually not all that hard once you dig but your never ever going to take this step unless you believe it needs to be taken. If you don't take this step then your never going to develop away to uncook the numbers to figure out reasonable estimates for real oil flows and without those numbers never ever even come close to considering a shark fin production curve.
And see my long post above if I'm right then it was all done for a very good reason it made a few people beyond filthy rich. The fact that the end result is really all about money is what matters so where is all the money in the world and how did it get there ?
I think it does matter. Do you realize that lots of people read this stuff and try to make sense of it? And they do it because they want to understand what is happening? Not that I am any great shakes, but I spend lots of time doing math modeling and creating charts, and it has given me some insight into some of the fundamentals of discovery and production. Since only a few people do the analysis from that perspective, I feel almost obligated to correct the misinterpretations of opinions stated as facts that I see posted here on TOD.
Once again, where exactly is this model that you speak of? If it is all in your head, then just say so.
Linked up thread nothing more than Ivanhoe's model with some adjustments aka fraud needed to bootstrap our fiat currency system.
All Ivanhoe's model says is that the area under the discovery curve is equal to the area of under the production curve. That is perfectly fine with me. However, this does not say anything about a shark-fin. An infinite number of curves will obey the area equality, and he just apparently chose an arbitrary one. In fact, by making a discontinuity at the cusp, he can more easily prove that the areas under the two curves are equal. He simply has to choose a decline curve that can be integrated analytically. Even though this does not match reality, it will prove his equality point. Does everyone now get it? It is actually quite obvious what he intended by drawing the shark-fin.
Otherwise, please give a reference and perhaps a quote for where Ivanhoe discusses the cusp in the profile which supposedly gives the shark-fin. This is starting to feel like a big run-around and the emperor's theory has no clothes.
This is funny.
I've really never said anything different the question is whats the area under the curve.
The analytical integration method is a result of realistically no other choice on how to connect the curves.
How can it happen ?
1.) Aggressive extraction.
2.) Claimed reserves becoming increasingly poor quality from watered out fields.
The general observation is all oil is not equal small reservoirs can be extracted rapidly and the production of the giants declines significantly after passing about 50% URR.
It really depends on the nature of remaining resource production rates post discovery financial model driving demand and thus consumption and thus investment in oil.
If the area under the curve is made up of a relatively small amount of oil that can be extracted at a rapid rate and a much larger volume that might be extracted at a lower production rate at high prices and lower rates then the curves that contain the overall production adopt a shark fin like profile. Other solutions don't work.
Intrinsically of course this is related to EROEI changes which feed back into the economic model since ever more debt is required to force growth therefore you need a economic system that can drive such and extraction profile.
What really intresting is of course that the only economic system that seems capable of driving resource utilization to the point where you accomplish aggressive extraction is exactly one like what we have.
Any sane economic model would have resulted in demand being constrained and a much more sedate symmetric production profile as debt is needed to keep demand expanding past when simply price increases would have indicated supply was not sufficient.
No, you said that Ivanhoe came up with the shark-fin model.
Explain how he came up with the shark-fin. You ascribed the model to Ivanhoe, but now you are backing away from that. It is apparent that you really do not have the courage of your convictions.
This is funny because elsewhere in this thread you said some depletion analysts who were doing some good deep digging lacked "cajones".
Only way to think about it is to consider decline rate from current reserves. That is the abstraction that fits the best.
Deleted due to misunderstanding
Web, it appears to me if the production rate is constant and the reserves (reserves means recoverable reserves I hope) don't magically grow the depletion rate accelerates. Seems clear enough from the definition. Say you started with 100 units and produced 10 units a year steadily for ten years. The first year the depletion rate was 10% or 10/100 the second year the delpletion rate is 11.111111% or 10/90 third year the depletion rate was 12.5% or 10/80 and so on up to the tenth year when the depletion rate is 100% or 10/10. If the depletion rate remains constant and the reserves don't magically grow the oil will never be fully depleted but less will be produced each year. Do I have it right?
I know field's don't produce at constant rates from full to zero (like draining a fuel tank by running an engine at a constant work load and a constant rpm) and that reserves can grow as a field's full extent becomes revealed over time or by new tech allowing a greater % of the oil in place to be recovered (again I hope reserves here means recoverable) but I broke my example down as simply as I could to try and make myself clear.
The idea of proportionate draw-down is a fundamental property. You can't go wrong with this assumption, since it matches physical phenomena like transport drift and Boyle's law as well as human attitudes. To change the mean rate, it does require application of new technology or very greedy drawdown pressure. The average drawdown has been very constant at 4% over the last few decades after coming down from 7% over the bulk of the last century. So the idea is that extraction from an estimated reserve amount stays constant over time.
For proportionate drawdown, the depletion profile is exponentially damped. If there is an entropic disperion about the mean the profile is hyperbollically damped.
Web, I try to follow you as best six hours of statistics and just touching DifEQ during Nixon's first term lets me (not very well)
Drawdown is defined as the change in the head, which in the case of my water well in the yard would be the number of feet the head dropped (probably would it be better to use the gallon and a half to a foot volume measure instead) in the casing as water was pumped. If no more water was entering the entire system my well and all my neighbors wells are draining the drawdown would be the volume that left the system (per time), right? When you state the average draw down as 4% is that the percentage the drawdown (per time) is of the remaining reservor? It appears to my unsophisticated eyes that that percentage would be the same number as the depletion rate. If I have it, please tell in simple terms, I'm a more than a little out of my depth when trying fathom
For proportionate drawdown, the depletion profile is exponentially damped. If there is an entropic disperion about the mean the profile is hyperbollically damped though I think I've a vague idea of the concepts.
Thanks for your patience, Luke.
Precisely
Yes, the same as the depletion rate. I used the term proportional drawdown because in my experience it works better as an explanation for people that have hands on experience. Everyone seems to expect that you get less of something when you have a smaller volume to draw from ... except for oil reservoirs. I suspect people think that reservoirs are so big that this kind of proportional rate does not occur, yet it does.
Thanks, glad to know I was following the right trail :-) I know that plenty of savvy people around here have no trouble understanding accurate math/stat terminolgy, if it sails by me that is my loss. I just want to try and keep myself aimed in the right direction so I can at least see the dust cloud being raised.
You can't just assume straight-line declines because 1) oil fields don't decline in a straight line, and 2) new oil will come on-stream as existing reserves decline. This includes:
* New discoveries (primarily deep-water offshore and Arctic frontier)
* Enhanced production (secondary and tertiary recovery, infill and step-out drilling)
* Unconventional production (oil sands, the Bakken shale, etc.)
* Substitutes (biofuels, gas to liquid, coal to liquid, etc.)
The real question is: "Will these compensate for the exhaustion of existing reserves?" and the answer is "Probably not."
So, what we can look forward to is a long, slow, painful decline, but we won't just fall off a cliff.
You can discount oil sands, but in 20 years Canada will probably be the world's third largest oil producer because of them. That's the good news - the bad news is that everybody else will be producing much less.
That's a big assumption that Canada will continue to produce the oil sands. IMO, contrary to popular opinion, there are a lot of Canadian's that don't agree with the development of the oil sands and particularly the environmental effects. Many of us are ashamed of the mess that is being created and at least imo; we can't keep ignoring that mess for another 20 years. Probably it is worth discounting the oil sands for many reasons.
Basically everyone not in Alberta, who therefore don't have any financial interest in producing the tar sands, either in the form of jobs, or royalty cheques from the provincial gov't.
But that also points to why it probably will continue in the absence of a national carbon tax or cap & trade system: the federal gov't isn't allowed to "interfere" in provincial resource development.
Basically, the Canadians opposed to oil sands development are the ones not in business and not in government.
Let me run the numbers past you: Oil sands production is currently running at about 1.2 million barrels per day. At current prices, that is worth about $100 million per day, or $36 billion per year. The Alberta government makes a lot of money in taxes from that, and the Canadian government makes more than the Alberta government.
From the standpoint of government treasuries, this makes things a lot easier. There are a lot of expensive social programs such as universal medicare, the pension system, and unemployment insurance to fund, and oil sands revenue makes it a lot easier. Remember, when Canadians are unemployed, broke and sick, the government will cover most of their costs, which is not particularly true in the US.
Oil sands also creates a lot of jobs, not just in Alberta but elsewhere in the country. It's capital and labor intensive, and the demand for skilled workers is huge. Oil sands development actually drove unemployment rates in the Atlantic provinces to the lowest level in 100 years.
At the end of the day, government decision makers will look at the revenue stream and think, "Do we want to continue to be the largest oil exporter to the US, and collect all those American dollars, or do we want to be like the US - flat busted broke and hopelessly in debt because of all the oil we import?"
I've been reading "Giant oil field decline rates and their influence on world oil production" (PDF!) by Höök, Hirsch and Aleklett... Particularly interesting are their Figures 10-12 (p. 17 f) that plot average decline rate together with production weighted decline rate: The avg rate is clearly increasing while production-weighted is pretty flat. They write that "The reason for this change is the introduction of new technologies, most notably horizontal drilling and fracturing techniques, in many major fields in former Soviet Union and the Middle East. Using new technologies, it was possible to halt the decline in many giants and keep production stable for some time. Eventually the average and the production-weighted declines must follow each other" (p. 16) and "Sooner or later the production-weighted decline rate must catch up with the average decline rate, but exactly how soon and how fast this development will happen is hard to forecast. Currently, the world may have a false sense of security, temporarily created by decline-delaying technology introduction in underdeveloped fields" (p. 18). Note that their graphs only go to 2005.
1) (observation) There seems to be ample room here for memmel's it's-crashing-right-now - scenario.
2) (question) What exactly do they mean when they say the rates "must follow each other" and "production-weighted decline rate must catch up with the average decline rate"? Are they saying it will revert to mean, i.e. overshoot on the downside, or just that it will come down to the avg trend? The first would be my intuition, but their words seem to say the second?
From your paper.
I assert that OPEC is simply lying its ass off and there is no difference between non-OPEC and OPEC production.
The primary difference is many of the OPEC fields are on land large and well suited for aggresive extraction measures that maintain production at the expense of and eventual steep decline. The poster child is of course the early use of peripheral water injection with Ghawar and in general aggressive adoption of water injection to maintain pressure in the OPEC fields.
Certainly running slightly below maximum production may or may not delay the eventual decline it all depends.
Your reported production profile is of course flatter as you can bring online offline production as needed to cover and offset declines but that tends to simply flatten the profile.
Also of course for the ME they do seem to have a bit of room between stable production an field damaging extraction rates I'd argue most of the excess production capacity is of the latter form one reason why its classified as only being available as surge capacity as its unmaintainable. Non-OPEC probably could do the same but is less willing to push fields into the danger zone. Thus paradoxically more conservative.
The truth ?
Well maybe next time prices get high or the time after that or later OPEC will unleash its vaunted spare capacity and develop its reserves to produce at a rate consistent with non-OPEC one can always hope of course.
In any case literally all you have to do is assume OPEC is not special outside of of their willingness to produce their fields at damaging rates on occasion.
Next of course this paper is not looking at and end of replacement for small rapidly depleting fields that provide the rest of the worlds oil. In short this is our baseline decline rate or best rate and the OPEC values are wrong.
Next even with this the real rate that decline is acellerating is probably underestimated as can be seen from the decline of Cantarell. Even after you correct for OPEC's fraudlent claims and consider that they produce similar to the rest of the world you have to correct for the fact that known declines where underestimated using this sort of methodology. The upper bound on the rate of decline is fuzzy. And of course the strong price signal from the last decade probably accelerated the depletion rate even more.
They are very much underestimating the implications of the plataue in production as its the primary reason why I assert that global production became self similar and maximized depletion rate.
Basically the moment we hit plateau with rising prices you know for a fact that the OPEC numbers are bogus.
You can safely discount the claims.
Regardless despite the fact that I feel this paper is unduly conservative an avoids the obvious discounting of OPEC reserves as it stands it presents a much more worrying picture of future oil production.
Even with the potential of understating future acceleration of decline rates by as much as 50% !
The problem is of course intrinsic in the approach its practically impossible to use accelerating decline rates to predict future decline rates. A linear fit can easily prove to be highly optimistic but you really don't have a mathematical basis to make the leap and assume non-linear acceleration of the decline rates.
Nothing in the past data provides the clue needed to predict future decline rates unless you place a huge amount of importance to the plateau period. Its purely subjective decision and if correct can only really be known after the fact. It does not mean you can't make the prediction it simply means nothing in the historical data allows you to differentiate the two cases.
Regardless simply assuming that the truth is close to the data presented buy your most reliable data sources and going with that results in a far less rosy picture. And as you dig its not clear in the least that the reliable sources are actually all that reliable as the collapse of Mexican production shows. So you have additional reasonable corrections that can be made before you end up with the "worst case" scenario.
Instead of this approach of steadily developing less and less optimistic scenarios why not simply develop the worst case scenario and determine if you can find reason to believe its too pessimistic ?
If you can't and I've so far not found compelling evidence that the pessimistic scenario is false then you probably have the right answer.
Not that this is not a good paper however I wish they had taken the obvious next step and thrown out the OPEC data renormalized it to match non-OPEC production and considered the case that non-linear increases in the rate of decline in production are possible and cannot be predicted from the initial changes in decline rate.
Every curve has a tangent.
Fantastic to see the paper but also realize they where a bit timid in their analysis.
Significant cojones deficit IMHO.
The Hook study demonstrates that a depletion rate approach works well for a large set of data. They observe a characteristic depletion rate value at peak production for a range of 261 giant oil fields. The variance of this value is relatively small.
This is a very important finding since it indicates that an extraction kernel function such as is found in the oil shock model can be applied to the data with confidence. The characteristic rate becomes a more-or-less constant value across a range of fields, providing a confirmation of the first-order model.
I applaud Dr. Hook and his thesis advisor for a very excellent piece of research work.
Shirley you're joking, WHT!
According to Figure 13 world oil production will fall to ~52 mbpd at the beginning of 2014(down 30%) .93^5=.7.
That's -5.1 mbpd this year, -4.8 mbpd in 2010, -4.5 mbpd in 2011,
-4.2 in 2012, and -3.8 in 2013.
Now Iran, the 4th largest oil producer in the world produces 4 mbpd.
So what this means is that an Iran, a UAE, a Kuwait plus Angola are going to suddenly drop off the map each year for the next 5 years, right?
ROFLMAO
I'm not joking ... and stop calling me Shirley.
I thought everyone on TOD had read Hook's thesis when it came out earlier this year http://bittooth.blogspot.com/2009/05/twip-and-mikael-hooks-thesis.html
He has a very nice section on the difference between depletion rates and decline rates. I am personally much more interested in depletion rates because that creates the bridge from recoverable reserves to production. It's a much more fundamental number than the decline rate, which is a result of all the production steps and just looks at year-to-year production increases or declines.
So before you laugh, please get on the same sheet of music.
BTW, Airplane! is my favorite comedy film of all time and, wouldn't you know, Hook has included some humorous movie lines in his thesis to make some interesting points.
That projection would leave way too much of oil in the ground.
Between 1950 and 1975 oil production rose from 4 Gb/a to 25 Gb/a
reached a 33 year plateau at 25 Gb and will fall from 25 Gb/a to 8 Gb/a in 2030. Total oil = 1645 Gb which is a lot less than +2000 Gb.
OPEC produces ~15 Gb/a with +600 Gb of reserves so it is unlikely that they would produce much less. For non-Opec unconventional and heavy oil will have to produce a 'crash mat' of at least 10Gb/a.
New technology and heavy oil can produce another 1000 Gb/a but require major investments and for the last 30 years the national oil companies have underinvested(oil producers divert oil dollars into their militaries or domestic programs or buying ODEC assets).
I agree that 2006 was a peak but 8 Gb/a in 2030 looks silly.
After all, the US is still producing 2.6 Gb/a after all these years of producing.
JMHO
Thanks Rembrant. I found this really useful. Up till now, I have found no other thread in which to ask this one burning question, but now, it is in keeping with the subject:
Would someone please tell me if there is actually a future possibility of greatly enhancing the recovery factor of hitherto unrecoverable oil?? Has this possibility been factored into the whole peak oil story?
I feel compelled to ask this question because whenever I hear of opponents of peak oil rubbishing the theory, I wonder if this could be one of the reasons: That technology would somehow find a way to greatly enhance the average recovery factor worldwide and hence vastly increase remaining reserves. Recently I read about a new technology called nano ResBots - nanoscopic robots which are injected into oil wells, and which are small enough to travel through the rock pores and map out the reservoir in far greater detail, hence somehow allowing greatly enhanced recovery in the end. I also would like to point to the recent unexpected advances in hydraulic fracturing and horizontal completions which greatly enhanced shale gas recovery and greatly increased worldwide potential reserves.
The bottomline is that I keep wondering if new oil technology is in the pipeline but not acknowledged by the peak oil crowd, and that perhaps this is the reason why many other respectable bodies don't care much for the peak oil theory. Perhaps they anticipate that all easy oil will first be depleted and then advanced new technology will be developed and deployed for greatly enhanced recovery, just like it was for shale gas. Is faith in new technology perhaps a justified faith after all?
Please forgive my lack of knowledge on geology. Despite my training in EE, it's often rather difficult for me to distill the meaning and implications from all the geologists' specialist jargon, the graphs and the numbers.
shox -- Don't worry about not understanding geology. We geologists argue amongst ourselves about tech issues. How should you judge a new tech that can save us? Very easy: just ask how much oil/NG that new tech is producing TODAY. Anyone can project big increases in production from one tech or another. Totally meaningless IMHO. Tel me what you're producing today...not what you think you'll be producing in 5 years. The free market is a wondeful mechanism for identifying BS: it doesn't survive very long...if it even starts at all.
Yes, please listen to Rockman. I would also affirm that you need to know nothing about geology but the barest principles. You can look to me as an example. It's not that I actually don't know anything, it's just that you can use logic and the probability and statistics of counting to reason about oil depletion. The idea of Bayesian inferencing is a good place start.
@shox
Its difficult to estimate what effect in terms of production increasing secondary/tertiary recovery/EOR will have. I haven't seen any good models. I think there is a lot of potential but it will take a lot of time not only due to the slow dispersion of technologies in the oil-industry but also due to the political boundaries.
I don't think that if you speak to people working on these technologies (I have been on radio sessions with technical people of the Oil-Industry working on this stuff in the Netherlands for instance) that they have a radically different picture than 'peak-oilers'. Although some of them tend to think that there will be a very long plateau due to sustained high prices, while most 'peak-oilers' believe in a continued decline. I think that a continued plateau is unlikely due to the political/economic situation we are in.
Rembrandt
I thought the Soviet oil production was a good example of just this phenomenon: they peaked using old technology, eventually opened up their fields to Western tech and saw a rebound in production that went higher than the previous peak, and now they've peaked again and are starting to decline again.
So, in short, yes technology can delay or temporarily reverse peaks in oil production, but at the end of the day that's all it does. There will still be a peak and decline eventually because the ultimate recoverable reserves (URR) number is still finite - at best equal to every drop of oil in the ground, although we have yet to see 100% extraction anywhere in the world.
I would add that these predictions all assume a proportionate extrapolation of existing processes, methodologies and thought processes. Economies grow, pull in more oil that raises the price with a consequent reduction in demand - eg negative feedback, dumb system.
However the reality is the future is heavily determined by understanding and realisation. We currently stand at a point where many are beginning to realise the trajectory of the next few decades - even if they haven't taken them onboard as drivers for today's actions.
At some point sentiment will switch, probably quite suddenly and probably severely. The stable state at the other side of this singularity will be very different from the current one - a decline based rather than expansion based model. That includes items such as hoarding by suppliers, military strong arm tactics, movement of energy intensive industry, rationing, financial collapse and underhand actions to collapse demand.
The predictions made are fine for the assumption of BAU, but if you even start to factor in this switch and the cascading set of process changes and novel approaches you rapidly realise they are almost guaranteed to be wrong.
If its got any kind of smooth line over the next decade, its a good prediction.
I might mention that my analysis of the situation comes out very close to Nate's, with a credit unwind likely playing a major role in what likely happens in the future. The presentation I gave is called What's Ahead: Two Scenarios?.
In this presentation, I lay out two scenarios, one the "Slow Slide" and the other the "Quick Crash"--with the Quick Crash being very much tied to the likely credit unwind. In reality, even the quick crash is not all that quick. While it may start relatively soon, it likely will play out over a fairly long period--20 years or more. It will likely play out in several downward steps, as existing infrastructure becomes less usable, but replacements are not made. The "Slow Slide" scenario is more what one gets, if one looks only at supply, driven by the natural decline rate.
A few slides from my presentation:
Gail -- If you allow, I'll add a little shading to your point about the different reinforcements of credit on the energy business. No one in the oil patch doesn't recognized that in the last 6 months we've entered into one of the best investment environments we've seen in many years. Drilling and leasing costs have fallen tremendously. Competition for good drilling projects is probably the lowest in 10 or more years. But very, very few companies are in a position to take advantage of the situation. Many are having trouble handling the debt load they built the last few years let alone trying to expand operations.
OTOH, I've lived through times (like the late 70's) of high expectations and very easy credit. Unfortunately the positives of such a situation are not as good as many expect. Easy credit in the oil patch is similar to easy credit in the housing market: ever inflating investments are made on the assumption that this growth will continue for a long period. I can testify to the fact that the easy credit of the late 70's combined with unbridled enthusiasm to drill, drill, drill did more to eventually damage the oil industry to a greater degree then what we've just witnessed this last year as a result of falling commodity prices. We had over 4500 rigs operating at the peak back then and I can promise you at least half were drilling junk prospects. But the market was shoving capital down our collective throats and no one was going to jump off that train.
Bottom line IMHO: if we see credit markets swell at the same time oil/NG prices spike there will be a huge drilling boom. But the results of that boom will be disproportionately small. There are few matters in which I'll take an emphatic position. This is one. From a point of self interest this is a scenario my owner is anticipating/hoping for. If it happens we'll sell our production to the biggest fool with the biggest credit line and then we'll run like a scalded dog...all the way to the bank.
Exactly right. But what you are pointing out is also an example of how dark/light things look when using different lenses. From perspective of those who can grow from cash flow (without debt) and have access to low-cost natural resource reserves, this is great environment because $50 oil is still profitable to them but is money loser to those at margin. But from perspective of SOCIETY, it is a tough environment because even though EROI is now increasing (because marginal EROI projects have been scrapped so average EROI goes up), total energy gain (EROI X Scale) will decline, implying less BTU for non-energy sector. When introducing risk into the equation, it becomes clear that old school principles will rule the day. (less debt, lower cost as opposed to unproven prospects financed by others.)
What % of E/P would be profitable at $50 in US (and $4 gas)? I would think less than 50%, but don't know. It will be 'interesting' to watch total BTU production and total debt creation in coming years.
Nate -- Check out my response to Gail. This might sound counter intuitive but lower prices tend to raise the success rates. In my career I've seen many operators use higher prices to justify drilling poor prospects. Like the old joke: we lose money on each deal but make it up on volume. It has never been the price of oil/NG that really determines profitability. It's always been if you drill a good well. Obviously $150/bbl isn't going to make you money if you drill a dry hole. I won't offer a number for the industry because we still have some carry over drilling of poorer projects. But I'll offer that my company will run a 75%+ success rate over the next 12 months. While we do use a price platform to grade our deals we actually care little in the decision making process of what to drill or not drill based upon commodity price expectations. We assume a rather modest price deck so we drill only projects with a high probability of success. I can make a profit drilling with oil at $30 and NG at $2.50. But I won't be able to drill too many wells at those prices. As I pointed out to Gail the greatest company failures I've witnessed firsthand have resulted from optimistic expectations during high price periods. I know it sounds overly simplistic but success has always been based upon finding the volumes of reserves you expected and not on the commodity prices. The most profitable string of NG wells I've ever drilled (during the mid 80's) was done selling NG at $0.90 per mcf. It was a result of two factors: drilling cost were absurdly low and I had an 80% success rate (thanks to using seismic technology my counterparts didn't understand).
If we have a commodity price spike there will be many more wells drilled. And, IMHO, profitability will tumble as well as EROI. Always has in the past in my experience and I see reason to not expect the same in the future. It's easy for me to imagine society being a net loser in a booming drilling environment: EROI will suck worse than ever and the oil patch will bleed the credit market of capital needed by other segments (such as alt development). Just the opinions of a very prejudiced geologist who has been there and done that.
ROCK oil drilling at high prices with easy credit doesn't sound much different than the IPO game during the dotcom boom. Everyone is afraid to get left behind so snake oil salesmen have a hayday.
So true Luke. It's difficult to offer a clear picture of what a feeding frenzy it was back in the late 70's. I still recall thousands of greedy citizens mailing checks (often representing big chunks of their life savings) off to P.O. boxes they found in the classified section of the Oil & Gas Journal or the Wall Street Journal. Being trusting is one thing. Being pig headed stupid is another. There are still a few geologists/engineers around who joined this gang bang I won't take a call from today. Like they say, you only have one chance to make a good first impression.
The credit market really has several impacts:
1. The direct availability of credit to oil and gas developers which you mention. I agree with your analysis of this piece.
2. (Indirect) The ability of consumers to buy houses, cars, and a whole host of other things that use oil and gas in their production. Without credit (or with sky-high interest rates), consumers cut back, and oil and gas prices likely fall.
3. (Indirect) Without credit, there are likely to be cut-backs in industrial production (not just oil and gas), because consumers cannot buy, and because industrial organizations cannot get loans. These cutbacks can be expected to lead to layoffs. The layoffs further reduce demand, tending to push prices down.
I see the indirect impacts being as important as the direct impacts. In the long run, I would expect credit contraction would push oil and gas prices down (at least from what they would otherwise be), and further contribute to the contraction in future investment.
Gail,
Has there been any discussion here on TOD of the energy industry being self financing on a grand scale by selling shares?
Are there theoritical reasons why this cannot work?At least insofar as non govt companies are concerned?
Obviously the national oil companies won't do this.
Selling shares worked well-all too well actually-during the computer and internet boom.
mac -- There have been some stunning examples of "selling shares" (i.e. IPO's = Initial stock offerings) to raise oil patch capital. I saw a brand new company raise $260 million in such an offering based upon a reserve report showing a huge potential to increase production in an old field. Investors threw the money at the company and they bought they field. About a year later the same public company took a $240 million right down when the redevelopment plan failed monumentally. How good was the plan originally? IMHO, no engineer/geologist with a shred of ethics would have signed off on the original proposal. Did that company go under? Hell no! When they took the right down they got a $50 million line of credit from the bank because they did have some reserve value in the ground (oil prices were high at that moment) and had no company debt. Of course, the original shareholders were slaughtered. But, hey... pays your money and takes your chances...right? In general boom times (like the summer of '08) are historically the worst time for private investments in the oil patch. Folks just becomes lambs for the slaughter. Greed is a rather common cause of blindness.
Just check out the history of share volumes for anyone of the big shale gas players last year. A very good recent example.
After hitting the (so far) all time record monthly high of $134 in June, 2008, the monthly low spot US crude price was $39 in February, 2009. In eight months, the price of oil has doubled.
In the same 8 month period, Sam's best case is that the (2005) top five net oil exporters shipped about 5% of their remaining post-2008 cumulative net oil exports--1/20th gone in 8 months.
The magic of marginal pricing - copacetic until it's not.
A question: I'm looking for a graph showing how much oil has production costs below $10 per barrel, how much below $20, below $30, and-so-on. X-axis: price, Y-axis: cumulative amount of oil available below a certain price.
Or alternatively any graph showing similar relationships (continuous graphs, geographic, ..).
Thanks for your help.
we're all looking for such details. the graph below is almost a year old so I suspect costs have come down some -question is when they start going up again. The major point is that the low cost reserves, at least according to CERA who is in position to know, are not in middle east-so for a country that imports 2/3 of oil, and in a geopolitical environment undergoing a fiat currency crisis, this is of relative immediate concern.
Canadian oil sands costs are down substantially from that graph. The days are gone when welders got $1000/day for just showing up, regardless of whether they did any work or not.
That's the good news. The bad news includes the fact that Mexican costs are out of control (PEMEX is losing a fortune at current prices) and all the deep water stuff is still expensive.
And things are happening in Saudi Arabia. They are starting offshore drilling in the Red Sea and talking about doing a CO2 flood on Ghawar. None of that is cheap and they can't be the lowest cost producer any more if that's what they are going to do. Makes you wonder if we are about to see another Mexican-style cannonball dive off the high board.
Great! Thanks, also to Gail. Almost what I was looking for. For ag-commodities there's the FAOSTAT which give production prices and volumes, which is very useful.
This is the graph from CERA that has been posted several times previously that gives something similar to what you are asking for. The graph was from about a year ago, when oil prices were about $90 a barrel. My interpretation of the blue band is that it is the highest cost resources that could be profitability produced for $90. So these seem to be oil supply costs, not including the necessary return on investment.
2014?! Wasn't it Michael Lynch that said that according to Peal Oilers PO is always just 5 years away? He was completely right. I've been following the story for 5 years now and it is always 5 years away. Back in 04 everyone was saying 09, now it's 09 and everyone is saying 14.
It's nice to hear from some other residents of Shrek's swamp. I'm sure it's a more pleasant place than the real world, where oil fields actually do deplete. In Shrek's swamp, where Michael Lynch hangs out with the unicorns and elves, they have magical oil fields, where the discrete oil wells deplete and decline, but the field output--the sum of the output of depleting oil wells--increases forever.
However, the debate between Daniel Yergin (we might hit a production plateau around the middle of the 21st Century) and Michael Lynch (we might hit a production plateau some time in the 22nd Century) and Peter Huber (a production plateau is a theoretical possibility, but our total energy consumption will increase forever) is certainly entertaining.
In any case, I find it interesting that world crude oil production was down in 2006 and 2007 and in 2008 basically flat with 2005, which is the time frame in which Deffeeyes predicted that world conventional crude oil production would peak (2004-2008, most likely in 2005). Deffeyes did erroneously observe that we probably peaked in 2000--which he noted was not what his model showed--but since most cornucopians live in Shrek's swamp (inhaling swamp gas) they have trouble differentiating between an observation and a prediction.
Rembrandt's forecast hasn't changed dramatically in the past four years: http://www.theoildrum.com/story/2005/9/9/02536/09753
Nor has Deffeyes. (But I was referring to Cynus as a resident of Shrek's swamp.)
In any case, I suspect that the decline in demand has obscured a steepening decline rate in world crude oil production. The initial three year declines for Texas, the overall Lower 48 and the North Sea were all fairly low, followed by more rapid declines over the following six years. Mathematically, based on the logistic model, the world is now at about the same stage of conventional depletion at which the Lower 48 and North Sea started showing steeper decline rates.
But IMO from the point of view of importing countries, focusing on total production is akin to discussing your dinner plans with your seatmate as your plane does a near vertical dive into the ground. Sam's best case is that the (2005) top five net oil exporters will have shipped more than half of their post-2005 cumulative net oil exports by the end of 2013. Just my 2¢ worth.
@Cynus,
Purely supply side analysis points to a continued plateau and decline around 2014. That is different then saying Peak Oil = 2014 (doesn't make sense to put a year to peakoil). All I say in this post is that the plateau will likely end around 2014 if you only look at supply. If you would have read the bottom half of the post you would see that the demand picture will change this picture dramatically, to which effect and what extent is unknown as of yet.
Cynus - In 1980 Kai Bird the assistant editor of The Nation stated Saudi Arabia, at that particular point in time, had 108 Gb in proven reserves; as of 2004 KSA conservative PR estimates were in the 144 Gb range.At the time of Kai's citation the vast majority of the giant fields in the KSA had already been discovered: i.e. Ghawar, Abqaiq, Safaniya, Zuluf etc.
Though there have been quite a few discoveries in the KSA since 1980,none could compare to the giant fields of past explorations.
Given the fact that improved technology is being used in the form of bottle brush horizontal drilling to maintain current levels of production, all this will do is extract the remaining reserves faster and more efficiently.I have also heard from my own sources that have worked in the region that the water cut percentage caused by sea water injection on the perimeter of the fields to sustain pressure is more problematic that what most people outside Saudi Arabia perceive.(When) Ghawar waters out, we are s.o.l.
Saudi Arabia, without question, is the most important oil producer in the world for the simple fact they can increase production and act as a swing producer when certain scenarios demand such actions (please forgive the redundancy).
If they were to lose their ability to accomplish this redeeming quality, a conflict - say with Iraqs neighbor - could actually collapse completely the worlds economy at this point: meaning bank runs/stock market collapse/severe gas rations.The oil based economy has reached that critical point in which true exponential economic growth is evidently not attainable anymore.We are merely treading water now.
In 1973 The United States suffered a mere 5% reduction in oil imports for a short duration, which consequently caused financial havoc.
I tend to confer with those who make inference that the peak in conventional crude has already been reached: Not only inclusively by the vast amount of data that pertains to depletion; but just as important are the ostensible trends that are transpiring right before our eyes: i.e. economic/de-leveraging/credit rescission, resource conflicts, military preparations etc. etc..
I would not give to much credence to the flowery polyanthos nay sayers like Michael Lynch, they have always been around, and as the story goes the boy who cried wolf to often did eventually get eaten by the wolf in the end.
True science is observation not theory, it is not that hard to figure out.
hope all goes well with you...
Rembrandt,
Would it be possible to have a discussion of why/how your megaprojects projection differs from the wikipedia one often seen on TOD (e.g. http://www.theoildrum.com/node/4419), since this suggests a much sharper, lower peak, and a considerable fall by 2014?
Cheers,
Peter.
@Blue Peter
I am planning to write a post about exactly this in the first week of November. I hope you can bear some patience ;-)
Rembrandt
I will wait with anticipation. Thanks
Peter.
blue Peter, the answer is, at least partly, allready in the post from Rembrandt above.
There are around 600 fields in my database versus around 250 in Chris Skrebowski's, because he did not include smaller fields, hence the term megaprojects.
Wikipedia don't look at the very small fields. Still, there are uncertainties. It appears that many new recent projects don't give the flow rates as promised (as also observed by Simmons) and many show delays. If the plateau could last until about 2014 depends also on the production from giant fields (best case, middle (high, low) case, and worse case scenario). In theory, if all the future projects deliver what they promise and with best case giant field production (and all the 'new' giant Irak fields coming on stream within 5-7 years), the plateau production could go on a few years beyond 2014. IMO for this to happen there are too many if's.
Cheap oil prices in the 80's & 90's led to exhuberant lending/borrowing, figuring cheap energy would support that much debt to be paid off in the future. Now the cheap oil is gone, it's no wonder the numbers don't add up to pay it down.
It feels like the economy got hit in the gut and is still on one knee, trying to get enough credit available to get things moving again and 'get some legs'. What I've noticed is the small cap stocks have stopped going up appreciably, but the blue chip stocks are accounting for the recent rise in the Dow. Along with this, is the willingness of the banks to lend to blue chips but not much to small caps, small businesses or individuals. I suppose there needs to be hope that the blue chips will pull everything else up, but many analysts predict an anemic economy through 2010. That's over a year to wait for things to start to pick up, and another year of oil depletion headed towards higher prices, sticking it to the economy again.
Sometimes graphs/figures are vague, but these were great. My favorites are 1 & 9.
I read this summary of the conference with interest. If I understood the conclusion correctly and put it into simplest terms it is basically:
Something has to give. Either energy consumption must drop, or world production/GDP must drop, or debt/money supply must drop, though we are not sure which.
Seems to me regardless of which scenario proves to be the correct one, we will have to get by with less.
Hello Rembrandt,
Thxs for the ASPO Conf. summation, much appreciated.
In terms of buttressing support for the 'sharkfin theory'; when we potentially could really start to come down off the current crude plateau at an even faster decline pace due to decreasing net energy, cascading blowbacks, plus ELM induced perturbations:
It would be fascinating to know if total resources devoted to water & water treatment will grow at a much faster pace than the total resources devoted to just crude & natgas. My hunch is that it will, especially as global pop. is still growing, and that it could be an 'unknown unknown' that could really bite us in the butt postPeak unless we can somehow gather much hydro-graphic global info very quickly for summation & analysis.
As usual, my standard disclaimer for true expertise in what follows. Hopefully, the TopTODers or expert others can further flog this dog:
The global supply chains for crude & natgas are basically a one way or unidirectional operation: get it out of the ground, move it to market, burn it to a toxic gas, then the subsequent atmospheric release into the commons.
Not so with freshwater. It is basic to the Circle of Life, therefore bi-directional flow is essential. But even this can be limited [as many TOD postings suggest].
For example, the Mideast fields have generally been blessed with low elevations above sealevel, plus strong natural aquifer waterdrives. IMO, it would be fascinating if ARAMCO, ADNOC, Kuwaiti Oil, other NOCs would release hydro-graphic details that show whether this massive natural water volume at high pressures is expected to continue for decades ahead, or if like most aquifers around the world--these will start to flowrate and/or pressure deplete necessitating ever more massive surface seawater importation far inland for secondary injection techniques, plus much more surface infrastructure to separate the crude stain from the massive brinewater flows as the Oil/Water Cut is inevitably doomed to rise in the years ahead...
If memory serves: I have posted a weblink before where 'tunnel bores' through the bottom tarmat in Ghawar were done to help increase natural aquifer flowrates to more precisely target discrete crude pockets that were earlier bypassed by waterfront override. I wonder how many might have turned out to be 'dry holes'; the predicted flowrate and pressure was insufficient [or soon will be?], thus forcing ARAMCO to install additional surface water-injection infrastructure to help extract these smaller target areas.
Just as the Ogalalla aquifer can only handle so many wells pumping water before everyone has to start re-drilling their wells ever deeper, there may be a similar limit to oilfield aquifers if tunnel boring becomes a common technique to try and boost crude recovery versus the massive energy & expense of imported water injection.
[without doing the research, and just using rough WAG approximations]:
Ghawar is currently extracting 5 million bbl/d of crude, but with 10 million bbl/d of imported surface injection, plus maybe another 20 million bbl/d of FREE natural aquifer pressure-drive. So they are essentially water-handling 30 million bbl/d for the energy cost of 10 million bbl/day. How much would their ERoEI and cost structure change if they had to fully pay for the full bi-directional flow energy requirement of 30 million bbl/day of imported surface water?
If this aquifer depletion trend becomes a common occurrence in many advanced-age crude reservoirs, then ERoEI or the Net Energy Cliff advances to prominence just that much sooner; ie the sharkfin.
Okay gang--feel free to further elaborate or refute this FF possibility. Remember, we are also seeing further growth in ESPs and jetpumps; the modern, hidden version of the old, surface-working nodding horsehead pump. All these multi-billions of water barrels take energy to move and treat-->we must account for both the uphill & downhill flowrates over distance.
Additional thought, but again a WAG: my hunch is that the ratio is 20:1 or more of miles installed yearly for deeper water-wells, pumping aquifer freshwater uphill for people [plus the subsequent sewage treatment], desalination/movement, and irrigation pipelines for crops versus miles installed for more oil & natgas wells, injection-pipelines, and FF-water processing treatment.
In summary: IMO, the fast-crash sharkfin is Highly Possible in the highly vital competing race for energy + H2O. Remember: We are evolved to sit in the dark, but we cannot do dehydration or starvation.
Suggestion-->to gain a greater energetic-grasp of what I am writing in this posting: Please hand-carry two five-gallon water jugs up a one mile long, 1,000 foot elevation-gain upslope, then return home again with the full jugs, to more fully and bi-directionally physically and mentally condition your TOD reply.
EDIT: some slight changes for clarification and readability.
Bob Shaw in Phx,Az Are Humans Smarter than Yeast?
Toto,
Water is unappreciated liquid gold, no doubt about it.Personally being in a situation where it is not plentiful would scare me into moving immediately.
I can take no credit for being where I am-my forebearers settled here generations back but they did choose well.
If or maybe I should say when tshtf it may well be impossible for some cities and towns in very dry areas to maintain and power thier very expensive water infrastructure-meaning the residents will become a new class of Okies fleeing the depression and the drought.
A few million busted Arizonians, New Mexicans, and Californians mixed in with a sprinkling of folks from Utah and Colorado will really play hob with the economy-all that real estate to be written off , all those people to be supported in the modern American version of refugee camps-probably half of them will wind up in FEMA trailer parks and the other half in hotels on an indefinite basis.......
I understand very well the power of home, and if I had grown up in the desert or near desert country doubtless I would have loved it as well as anyone, and stay there.
But a far as making a rational decision as to selecting a place to live-It's hard to imagine a worse handicap in a powered down climate shifting world.What chance does Las Vegas have if the airlines are shut down?Just what does LA have to offer the rest of us in terms of real physical goods?
About the only thing I can see in favor is that visitors would likely be few and far between-which might not be a bad thing.If tsreally htf here I expect there may be very serious problems with uninvited guest.
Hi Mac,
I've wondered about this for years as I visited Arizonia, California, etc on business trips: what would life be like in those places if thier water supply was diminished?
I live on the shore of Lake Michigan next to a couple of nice rivers and plenty of ground water. Sure, we have cold winters with lots of ice and snow. But, I bet I could survive a cold winter with fuel shortages easier than a southwest desert person could survive a summer with little water.
Toto, Just a comment on the shark-fin "theory". I have yet to find any real reference to this analysis. AFAIK, there is no real model here or any graph with parameterized data. It seems to be just a hand-wavy prediction of what may happen.
If you do find a complete analysis on the shark-fin theory, tell me about it please. I had written something up once to try to duplicate that kind of curve, but that was just me guessing at what the shape actually is. You see, shark fins have many shapes and I don't know what species of shark this is even referring to.

Do a google search on "shark fin" and these are the first two images I see:
and
How odd. Is reading shark fins like reading tea-leaves?
Dunno see my response to your longer post. If I'm right then the reported numbers are fraudulent.
My best guess however is fin number 1 but a bit flatter at the top overlapping fin 2 on the way down.
No doubt at all about the potential for a long tail in production same as most peak oil graphs show.
Hmm hey maybe like this :)
Of course your being a bit disingenuous since I've stated many many times I've got nothing to add over
what Ivanhoe explained.
More sharkfin curves here.
http://hubbert.mines.edu/news/Ivanhoe_00-1.pdf
Look here the link I've know you read his papers.
http://www.hubbertpeak.com/Ivanhoe/
I've got nothing to really add over what Ivanhoe did. The fit is easy enough.
And I've told you this several times this is not the first time you rejected Ivanhoes work
and for the same reasons he hand drew his curve.
My adjustments have a lot more to do with money then with the curve itself.
My question is why and how we did it and this leads to some overall fairly small adjustments for "fraud".
These are inflated reserves and over and understatements of production sufficient in magnitude to cause problems esp with the data but nothing that materially changes Ivanhoe's work.
How we did it was a combination of technological enhancements and financial engineering rigged markets and outright fraud. Surprisingly similar to the .com bubble where all the same games where played.
Why we did it ?
A few people became filthy rich and powerful again surprisingly similar to the .com bubble or computer bubble in general.
Both industries have the same mix of real technical breakthroughs and ugly money games. Perhaps even the same players at the highest levels who knows. Certainly the information about the .com bubbles and other games in the computer industry are better documented and you can read about all the things that happen when you mix large sums of money and technology. My conclusion is simply that the oil patch is the big daddy of these sorts of games. With defense, airplanes and computers as envious stepchildren of the big boy.
Now back to the curve this means of course that the dip in production in the 1980's was no where near as deep as the public production numbers indicate a and of course Americans did not suddenly get super energy efficient like we think we did. We can quit patting ourselves on the bank on all the oil we saved in tht 1980's we didn't do near what we thought we did. And of course demand was far more resilient to the price shock then most people realize.
And we probably did not get the uptick that Ivanhoe drew in by hand either. And last but not least of course its not a sharp point but a curve when production falls off but thats completely dependent on the exact timing of local factors.
Economic state from the price increases during the flattening period detailed time the last new fields are brought on line etc etc right now my best guess is we curved over the top over a period of about two years starting somewhere in 2007 and over by late 2008 to perhaps early 2009 dropping about 4mbd of production or so over that period maybe as high as 6mbd.
Now as best I can tell if the concept is right we are losing 500kbd - 1mbd every month with my best guess actually 500kbd but dunno for sure enough for things to get ugly over the next several months.
But these are small corrections really there only importance is they are closely related to the creation of the financial system that supported this production model. The diversions of fairly small amounts of oil revenue to the top have large financial implications as it creates power money. This power money can then bootstrap the financial model needed for it to feed and grow.
Certainly plenty of error in the data to hide the flows esp if they are as I said fraudulent anyway you only need to redirect the revenue of about 5% of oil production over a period of decades to create a concentration of wealth and power that cannot be destroyed. Obviously this means our financial system and oil production are for all practical purposes siamese twins its completely interrelated.
Of course if this is true then obviously if oil production is crashing our financial system not only won't survive the crash it literally can't.
And last but not least it also says you will never ever figure out oil production using oil production numbers alone.
Its hopeless. The financial feedback with oil has same large direct connections. One of my other posts I said it was the financial curve pulling oil well maybe a better way is to say its both curves interacting with each other.
The hot oil flows that I argue used to exist are not only a direct connection but also the way the system bootstrapped itself.
Eventually in the end Americans became nothing but consumers and our consumption of oil and plastic junk from wall mart and cars and paper houses was used as a tool to create wealth at the top.
We are just a bunch of addicts adroitly managed to extract as much wealth out of as possible with the oil addiction forming the basic flow. The reasons are all on the money side but the money is directly from the oil addiction.
Pretty impressive since effectively they convinced a bunch of heroin junkies to do useful work for free.
Of course they had to keep extending their credit lines along the way but thats what happens when your dealing with junkies. Of course the even cooler thing is when the game eventually fell apart like it had too is they stuffed all the debt into the junkies collective call the government and did not even lose on that side.
Impressive but hopefully nothing else like oil exists that can allow this to happen again.
Regardless you have to put the oil and money together until you do you can never generate a shark fin production profile the corrupt oil data is simply not enough.
Now to my knowledge Ivanhoe never really discussed economics or financial issues however its my understanding he was fairly wealthy and given his positions he was a industry insider. So I have to assume they he also have a financial model he was using even though he never explicitly detailed it. If anyone finds something he wrote on finance I'd love to here about it or even anecdotal views from someone that knew him. Obviously my own model is fairly damming so if he was following the same thoughts I could readily see where he would choose to not write them down.
The nature of the model itself demands that there is and external influence at work geologic constrains simply cannot create this sort of curve i.e if it was pure geology then it would be some sort of fairly symmetric curve. You absolutely have to have the financial engineering to push the system. And of course thats why you never can solve it looking only at oil production flows so I know he left something out and from my own conclusions like I said you can see why he might. Whats interesting is Hubbert himself also has alternative financial model he supported.
http://www.financialsense.com/fsu/editorials/quigley/2007/0612.html
One has to imagine Ivanhoe also looked at the issue and about the "coupling".
I don't see that I've done anything different from what both Hubbert and Ivanhoe accomplished.
Outside of trying to understand the why and how of this coupled oil/money system plus technology.
I'd argue neither tried to create a more explicit understanding of this.
I'll be damned heres export land in all its glory.
http://hubbert.mines.edu/news/Ivanhoe-Riva_00-4.pdf
They even scooped Westexas !
Well almost he does not tie the consumption to just exporters but the third world in general.
Fair enough but I'd say the total of exports not going to the US is the more relevant number
it does not matter so much if its the population of the exporters or China.
Good thing I never claimed to be doing original work (I focused on the topic because of Matt Simmons' work), but what is so incredible about the Net Export situation is that the math is so obvious, but also so widely overlooked.
I don't see Ivanhoe doing the math, it is just empirical observation on his part. WT and Khebab sat down and did the math, which makes it quantifiable.
That gets me back to the original point about the shark-fin. We have no idea whether Ivanhoe's "shark-fin" extrapolation is some sort of artist's rendering or not. Does he even call it a shark-fin, or even point that cusp out? It is clearly hand-drawn, as were many of the figures during that era. In these kinds of settings it was very typical for an engineer or scientist to hand off their data to the graphics department who would then recreate the charts. The problem is that you could get back some creative renderings because the graphics guys have no idea of the details or how the graph came about. Their only goal was to make it look good, and they would use French curves or whatever to get the job done. The cusp at the peak could be due to artistic license, for all we know.
So apart from a single hand-drawn sketch of a peak, we have the shark-fin theory. This theory is as thin as gruel. Without any kind of math behind it, it is not IMO a theory proposed by Ivanhoe at all. At least WT's ELM has been fully fleshed out through unambiguous graphs, meticulous math, and many matches to empirical data. That is the way to do things.
I sent you our ASPO presentation, along with some notes I made. There were three key topics: (1) ELM & Net Export Math; (2) Case Histories and (3) Projections for the (2005) top five.
I think that the key contribution we made to the Net Export Math discussion is the the (ELM based) observation that there are three key characteristics associated with net export declines: (1) The Net Export decline rate tends to exceed the production decline rate; (2) The Net Export decline rate tends to accelerate with time and (3) As implied by #2, Net Export declines tend to be front-end loaded, with the bulk of post-peak cumulative net oil exports being shipped early in the decline phase.
One of the more interesting slides in our presentation is the observed rates of change in production, consumption and net oil exports for 20 current net oil exporters, as of 2008, and three former net oil exporters (Slide #19). If there was ever a case of the export data hiding in plain sight, this is it. The data are taken directly off the EIA website.
Thanks WT, I always appreciate well thought out arguments.
Regarding Slide #19, there are several variables, but the key factor which determines where an exporter falls along the Net Export continuum is how many years it has been since a production peak. And inevitably, as time goes on, exporters that had shown increasing production hit a production peak and join the countries in the Near Term decline phase, and exporters that were in the Near Term decline phase join the countries in the Intermediate decline phase, and exporters that were in the Intermediate decline phase join the countries in the Terminal decline phase--and then move into net importer status.
Incidentally, one my pet peeves, which you will appreciate, is that critics of the ELM generally make qualitative arguments against a quantitative model i.e., the ELM is wrong, or at least exaggerated, because exporting countries will cut their consumption. I ran into this when I confronted the POD (Peak Oil Debunked) People on JD's website. I finally challenged them to provide a single example of an exporting country, showing a production decline, that had cut their domestic consumption enough to pull their net export decline rate above their production decline rate. I am still waiting.
westexas, the POD people are probably thinking that 'export land' is going down when world oilproduction goes 'off the cliff' and the worldeconomy hits a depression. This could cause the (or at least some major) oil-producers to use less oil.
The math is pretty straight forward. In order to keep the net export decline rate at the same level as the production decline rate, consumption has to fall at the same rate that production declines. If the rate of decline in consumption is less than the production decline rate, then the net export decline rate will exceed the production decline rate.
In order to maintain a constant level of net oil exports, given an ongoing production decline, the rate of decline in consumption has to be huge. Assuming 2 mbpd of production at peak, with consumption of one mbpd, and a 5%/year production decline rate, consumption would have to fall from one mbpd to 0.21 mbpd in 10 years, a consumption decline rate of 15.6%/year.
No financial system can tolerate this for long even well balanced steady state economies would fail fairly quickly.
The chances of this being done to any large degree over a long time are small.
With that said there is a variant which is agreesive substitution of NG and coal if avialable for oil as production declines. This is exactly what the US did not to longer after it peaked. As a net importer it had good reason to but still its sound. As far as I can tell this same optimization of oil usage internally has been going on for some time in exporting countries.
However all this does is flatten the rate of increase in oil consumption at best almost flat. And generally its not even attempted till after production declines are obvious.
Of course what this means if its correct is that most produces are in decline and have mitigated internal consumption as much as possible to allow exports to remain relatively high. From now on out any further drop in production will be taken entirely out of exports and there is no more room to manage internal consumption short of collapse prone contraction.
This of course is a sort of hard export land model since it implies that exports drops are initially mitigated and only really take off after a regions peak production is well in the past and substitution of coal and NG are maximized.
I believe Britain followed this model. In looking at Indonesia I think they actually did also but fudged internal oil consumption higher to hide overall production drops for a time. I've looked at several countries and given that all oil producers seem to have reasonable NG production that all seem to have followed this model.
One thing thats been reported and is dubious is non-linear increases in both coal-NG production and oil. The single exception might be China which is one of the fastest growing diversified economies not only in the world but probably ever. Given that the rest of the economies that claim similar growth rates don't come close the the depth and breath of China their claims are highly suspect esp given they tend to be oil producers that show obvious declines not long afterwards.
westexas, memmel, thanks for the clarifying answers. Obvious is that when the oilproduction plateau ends, hard times in a lot of countries will follow. NG needs change of infrastructure (assuming there is enough to increase production) and CTL needs a lot of time to ramp up.
memmel, a possibility is a transition to EV's.
Web
let me weigh in here. I have never spoken to Memmel so I don't know what is in his noggin, but I can generally visualize what he is trying to say. The economy was fueled by energy gain and as it dropped below say 25:1 (4% of GDP very roughly) it was replaced by debt. Debt can't generate energy but it can move consumption (production) forward in time as it keeps prices higher and economic growth moving forward in absence of other limiters. When debt becomes too high to service the world economy has a significant retracement to non-debt trend - how much or how fast is anyones guess. In an environment of economic reckoning, a large % of what were previously considered reserves will no longer be economical -hence global oil production might look more like a shark fin - individual fields might have positive skew while the SUM of all individual fields might exhibit negative skew (sharkfin) due to change in what is deemed affordable (recoverable) after the economic rebalance takes place. Bill Gross, manager of world's largest bond fund, echoed my theme today that asset prices have been overinflated for decades. More recognition of fiat disconnect will result in less of the discovery area being actually producible is the hypothesis...
People here (and elsewhere) discussing these topics have a large variety of skillsets. It is POSSIBLE for me to spend a week or two creating graphs and equations to illustrate this concept to you - perhaps memmel could as well. Speaking for myself, I have far too much on my plate and I suss things out (especially in todays environment) at the margin, adding to heuristics that have served me well to date - I clearly don't have all the answers - but the preceding paragraph should be enough for anyone with interest to attach some assumptions and model what it might look like. I can't as yet prove the debt hypothesis, though a pretty solid conclusion can be intuited by looking at similar credit busts in previous centuries. We each are adding to this debate in our own way - I appreciate you keeping language and statements honest. As I've always said, if all this could be easily provable or even demonstrable, we would be in a different place - the key is to get the analysis in the ballpark and hand it off to specialists to refine.
Heres a starting question. If the world in 2014 can only afford $40 oil, how much area under the discovery curve gets revised? Given that answer, what shape would the production curve start to resemble? I can visualize this scenario - not predicting it with certainty, and it is on the to-do list - but if I spent the hours to refine for public consumption each of my ideas I would only get 10% of them finished. Again - thanks for your contributions. Tally forth.
You are losing me here Nate. Memmel finally admitted elsewhere in this thread that he got the shark-fin model from an Ivanhoe paper from some years back. I doubt that Ivanhoe had this sophisticated an explanation for the negative skew on one chart of peak that he drew. I really doubt that he considered debt replacing oil as a fuel for the economy.
The problem is that we are trying to put words in Memmel's mouth where (half the time?) he doesn't know what he is articulating. He essentially said that in so many words in this thread! Perhaps his mental model is that if you throw enough mud at the wall something will stick. How is that for a heuristic?
I suggest that you offer Memmel a chance to write a formal post that can be referenced as the de facto model for shark-fin. Otherwise, this theory inhabits the wishy-washy world of vague statements and half-hearted comments that get retracted whenever someone presses the issue.
BTW, I have my own interpretation of the shark-fin shape based on my futile hope of understanding what Memmel was trying to say. Look at the sudden collapse in oil production during the 70's and 80's. That dropped as a negative skew before recovering so that was a mini-shark-fin. I also spent some time drawing up charts since Memmel apparently can't and they are listed in the following TOD comment area:
http://www.theoildrum.com/node/5258#comment-489050
This is all quantifiable if someone else wants to lift a finger.
Effectively what I'm trying to say Nate.
The problem is of course how in the heck to you connect economics to production of oil ?
You have the well known feedback of petrodollar recyling where Americans overpay for oil and producers by US treasuries.
A similar game is played with china.
For all intents and purposes it boils down to give me the oil now and I will pay you later out of the growth resulting from using the oil today.
My one observation is this requires a premium be paid on the front side to of course also allow aggressive investment to support the higher oil consumption needed later.
You can't reject economic factors another post on this thread WHT suggest this.
I feel like I can readily see how economic factors and oil production is related in a qualitative way but...
We have no way it seems to relate debt back to a barrel of oil extracted.
Take the shale NG plays as and example what was the role of easy credit in the production profile ?
And its worse since its not just money but also technological advances since it made no sense to poor money into the shale until technical hurdles where overcome. Its a synergistic cocktail.
Qualitatively its easy enough to understand however actually reducing X amount of money/debt to produce Y amount of NG or oil or any other physical output is difficult to do in a quantitative manner.
And of course in the case of shale NG the rapid increase in production eventually helped cause a price collapse helped along I suspect by the overall economic contraction. So boom, bust or bubble economic forces are at play.
Whats missing is some sort of conversion factor that ties the two together without it your left unable to construct a quantitative model.
And of course all debt is not created equal as and example someone that took a loan out on a home in 1950 was likely to pay it off while of course loans taken out at the height of the housing bubble are unlikely to ever be repaid.
And of course the amount of growth from a given amount of debt declines over time but is that economics or is it oil ?
And you have inflation rate ...
Regardless the fiat currency itself is probably not the right unit its too unstable it seems to me you have to convert to something else that a better representation of the relationship between resources, production, real wealth and future obligations that can be met and those that can't.
But thats suggesting you rewrite economics so you can use it to understand resources. Probably needs to be done but not exactly something you want to do to connect economics and oil.
I have to go to London so unfortunately I'll have to break off and do some real work in preparation.
But the very first step is to see if you can show the economy or demand was driven such that it was fairly price insensitive to oil. This does not mean of course that higher prices did not "hurt" the economy but that expanding debt played a key role in being able to handle the higher prices and still grow. As long as nominal growth was possible and actually paying was deferred via expanding debt then oil extraction was driven by the economic model.
Thats the first step.
Next is buy how much give me a number :)
Like I said gotta go but thanks for your input and tying in economic factors is awful as our economic model is a joke.
You have a system created based on a implausibility of infinite growth driving real economic production arghh.
But at the end of the day money and power have real world effects and cannot be ignored :(
Economics to first order have nothing to do with the mechanics oil depletion, unless you want to say that human greed is part of economics. As long as a driving force of greed is around and there are enough people willing to prospect for oil at different rates, that is the way the global depletion curve will play out. It's the same mistake that all mainstream economists have made and it is why no real progress is being made in depletion analysis. Economics is the second-order effect that gets applied after the basic model is formulated. No academic in any economics department would ever have gotten grant money by making that assertion; yet I can get away with it because I am not beholden to the bankrupt sunk-costs of mainstream economics.
Once again I have no idea what you are talking about. On the one hand, we have basic probability & statistics that people complain that they can't understand, and then we have meaningless drivel like this that people nod their head in agreement over because it has no substance.
One more thing it should be put in this thread to ensure its recorded.
After all the dust settles it turns out that for all these almost crazy economic games to work you need a real driver thats creating real wealth.
For the housing bubble for instance after everything is said and done it turns out that the real driver was the ready availability of cheap Mexican labor willing to build homes the could never afford ( until the end :)
The large discount on Mexican labor is what actually created the wealth.
Now for oil obviously there has to be something similar if we have a driven economic system at the bottom there has to be a basic reason. And this is not just technology but something even more basic that provides this differential to drive the whole house of cards.
Surprisingly enough it seems that simple well workovers and field maintenance is probably the base driver not that fancy horizontal wells don't play a role. But using the housing bubble concept horizontals are like securitization important but not the core source of wealth.
So the housing bubble was possible because of cheap Mexican labor and as far as I can tell well workovers seem to be the key needed to support aggressive extraction of oil.
Its very important because no matter what games are played somewhere in the system something has to provide a way to create real wealth of the bubble never forms or collapses rapidly. And it seems that its often something really mundane and generally overlooked.
Speaking of the ASPO Conference, does anyone have any problems logging into aspo.tv to view the conference videos? I heard the videos were available online, so I registered to view them, but I haven't been able to login to aspo.tv with the email and password I used in the registration. I tried contacting the people who organized the online registration, but haven't received a reply, by both email and phone.
Any help would be appreciated.
Update: Never mind, it's working now.
Here's an interesting cross connection: how the US Federal research budget points up our society's continued expansion of energy using overhead costs as we head for running out of affordable energy sources... as you're discussing.
This is from the DotEarth post on the subject The energy quest begins, from the view of pointing out how little (non-military) federal energy investment there continues to be. I picked up on the "other foot dropping" in terms how much investment in adding new energy uses there is... commenting:
Much of the health expenditure is probably cancer related. I suggest a new "War on Cancer" on a macroeconomic level which would entail massive new funding for renewables, low-energy design and population/consumption control. The green segment of the bars would grow and perhaps save the future budgets for space, health and general science. The new approach could even include some radiation therapy, the peaceful reactor kind, not the neutron bomb kind.
It's interesting to note the sharp increase in energy spending in the late 70's (Carter years?) followed by the drop off in the early 80's (Reagan years?).
I'm a new user to the site and I'd just like to thank those who do all the heavy lifting to maintain it. This is my first comment although I've been aware of the site for about 3 years and have been following ever more closely since $140 oil and my retirement in April '08. I've been reading all the postings and the entire comment stream on and off for the last 4-6 months.
As I'm a civil engineer who worked for gummint most of my life, I find the site very (if sometimes a bit too) informative. A co-worker exposed me to PO about 4 years ago and I became a knowledge seeker after attending a lecture on PO presented by the NY state geologist about 3 years ago. It was attention grabing as well as extremely informative without the "we're all going to die" spin of some web sites. There was some hint , however, of that being a low level of probability outcome.
While almost any outcome is possible, the probability of any particular outcome varies enormously. My search is for information that will help me determine the most probable outcome(s). In attempting to predict the future, the probability of any outcome obviously varies with the assumptions. On one end you've got the fast crash/bus hits the bridge abutment at 100mph scenario and towards the other end there is the scenario in the Rocky Mountain Institute's "Winning the Oil Endgame" publication, what I would call the stay on the road, ease off the accelerator and coast to a stop scenario. I think (hope?) the RMI possibility is the more probable.
I'm sure some may think that's right on the edge of or well into Shreck's Swamp, but until we get more firm data points I'll keep on working for that (more insulation, install some PV, buy an EV, get a plot in the Community Garden, etc).
Thanks again for an informative and interesting web site.
There has to be a "faster" crash involved for China and developing nations than the first option outlined by the author. Therefore I`d vote for the gloomier second or third scenarios.
Why?
Just look at the Tokyo Auto Show this week. Exhibitor are down by half since this number peaked in 1995! Attendees also down by about half. New car sales in Japan peaked in 1991 at 7 million and this year will be about half that, or less.
Many young Japanese would be embarrassed to have their friends see them driving a car or even getting into one.
Yet cars were all the rage here back in the 70s and 80s...even in the 60s too, probably, although there weren`t that many of them (sound familiar???)
The cycle from auto boom to auto fatigue can be a long drawn out but solid affair, as in the case of the Americans who have had a long lasting marriage (about 100 years!) to cars that is only now showing signs of fraying, with auto sales waaaay down from their peak. Or if industrialization occurred later, this cycle can be shorter and shallower, as in the case of Japan (about 40 years from auto boom to auto bust).
Or it can be horrendously short, as in the case of China. A very dramatic rise, followed by a dramatic fall. Why, as the Chinese view the overseas petroleum-based economic tragedies playing out, do these smart people not realize that the same fate awaits them too? This year the Beijing auto show was "huge", so "popular"; it could have been NYC in 1955 or Tokyo in 1995. But the script has only one denouement, only one possible finale. Why do they willingly play out the farce when the outcome is a foregone conclusion???
Intresting you bring this up. Cars are still very much only for the rich in China. If things get tight then they probably will simply remain a luxury symbol. And assuming China holds together I'm confident they could actually create any needed post peak transportation network. Probably powered primarly with coal fired plants of course but they could.
And if they thought it worthwhile they could even put in infrastructure for some sort of EV solution.
Right now in China its the image of catching up with the US thats important and counting cars is a very big part of that image. If things change then I see no reason why China might lose its car craziness fast. (Except of course for the rich)
In this respect China is simply not even close to the US. Now can they do it and keep everything together ? Dunno about that China has other issues many centuries if not thousands of years in the making any one of them could prove very problematic. But thats actually a general problem outside of the America's ancient history turns out to be not all that ancient in Asia the scars run very deep and people don't forget.
Cars are not just for the rich in China any more. They're becoming an upper middle class commodity. That is why automobile sales in China will exceed those in the U.S. this year (11 million versus 10 million).
Fuel economy standards are much higher in China, but still there is going to be an enormous demand for fuel, and the Chinese middle class will be competing against the American middle class for feedstock.
Fortunately, the Chinese government is proceeding with a project to electrify 20,000 km of Chinese railroads, which will mitigate fuel demand somewhat. Unfortunately, the U.S. government is proceeding with nothing better than wishful thinking.
Note that the Chinese car sales represent a far higher net increase in the number of cars, since the scrappage rate is so much higher in the US. I assume it's almost zero in China.
I dug for that no hard numbers but no China's scrappage is far from zero.
They seem to have had the equivilent of cash for clunkers for sometime.
I can't find any info on what happens to the sizable fleet of used government cars.
Knowing China I suspect that most used cars are exported privately by Government officials :)
Seriously though there is simply little info on the scrappage rate or even turnover rate.
Yes, Chinese car sales mostly represent sales to people who have never owned a car before, while US sales mostly represent replacements for cars which are being scrapped.
There is a huge market in China for cars among the people who have recently moved from being peasants to middle-class workers, and this is going to increase dramatically as the Chinese middle class expands. In the not too distant future, the number of middle-class people in China is going to exceed the number in the U.S. and Europe COMBINED.
This is going to result in a huge increase in fuel sales in future, and is going to represent a major source of new demand for oil. I.O.W. demand is going to exceed supply by a considerable margin.
Or, as I like to tell people, don't buy a car with more than four cylinders because you aren't going to be able to afford to keep a V8 SUV running. It's going to be a choice between driving and eating.
The Chinese seem to be planning for this kind of world (e.g. buying up all the world's available oil reserves and e.g. buying up all the available farmland in Africa), but I think it's going to be a complete shock for most Americans (and many Europeans).
Maybe the Chinese leadership is supporting the auto industry to maintain it's own security and support, politically.
Maybe they have already figured out that an auto manufacturing infrastructure and the people capital(skills and professional expertise) can be diverted to other industrial output such as farm machinery while still selling some autos domestically and overseas.
Maybe since they are not yet auto dependent they are planning on building out thier country in such a way that nearly all auto trips will be short ones,that the autos will never be driven the way they are in the US.In a country with a culture of frugality and roads are essentially "cowpaths" maybe the cars will be driven only enought hat the typical driver needs on ly a gallon or two of fuel per week .
Maybe they think they can manufacture that much from coal.
The only thing you can be sure of is that they have a plan, and that they are patient-it is a long term plan.
I was thinking about this article today, from the standpoint that it seems to be pointing to 2014 as D day for a post peak decline that will somehow be more apparent than what has already occurred. One poster pointed out that peak oil always seems to be 5 years down the road and I agree with that person's assessment.
I disagree with the idea that the ecnomic hardships of peak oil or post peak oil are in the future. In my opinion peak oil initiated in 2005, and what has followed has been a series of events that is the result of having hit peak, but at times it hasn't been obvious because its happening in slow motion.
At first oil production plateaued and prices kept rising until it hit 147 in July 08, and then the bottom fell out, with mass defaults on mortgages and bankrupt businesses and individuals. All that's occurred since then are these desperate attempts by govt's borrowing from each other to maintain BAU for a little while longer, hoping that somehow it will all put itself back together again.
False. It won't come back together because what put it together in the first place is gone; cheap oil.
Since my post has been completely ignored like I don't really know what I'm talking about, here is some added information to make my case from a likely source; TOD today:
SA never exceeded production in 2005. And the world oil production numbers indicate that it stopped increasing in that year. Note, stopped increasing. Even though the world was demanding more cheap oil, it was not available, so the price increased over the next few years. Sound familiar?
If the oil exporting countries like SA could have pumped more in 05-08 then why didn't they take advantage of the higher oil prices?
Fact is, per this article they couldn't, which means oil production hit a wall, a peak from which it has plateaued ever since. If there had been more oil available to pump then the world would now be using 92-98 mbd. Ipso facto peak oil occurred in 2005. It did not occur in July 08, because it had already plateaued for 3 years by the time July 08 came around. July 08 simply represents post peak price to that point in time.
I rest my case. We the above jury find for Perk Oil. Congratulations! Thank you.
I had to print the above post out and take it home to read it more carefully last night. FWIW, my take is that all three scenarios offer good sensible predictions and I wouldn't rule out the possibility that all three might actually be playing out in sequence. Scenario #1 might be happening right now as a consequence of the massive government stimuli that have been injected into the world economies; China seems to be getting the most bang for the buck. Then scenario #2 could very well follow closely as governmental stimuli have to end and the Far East faces the inevitable squeeze of having much poorer export customers. Then scenario #3 kicks in as the global economy finally faces the music of the unresolveable debt burden (especially here in the U.S.) and the destruction of the dollar as the global reserve currency.
But I'm no expert:)
I witnesses this site for some time - there are many god and iteressting point here.
But some issues are not adressed.
1) The OP will happen sone and yes, this will be a major issue - especially for the US, as they are energy-wasting in the worst manner!
2) The conclussion that cheap oil will no longer be available soon means there is not enough energy is simply false - the sun is burning 564 million metric tons hydrogen to 560 million ton nitogen every second - 4 million tons are converted to pure energy (heat) in every second. I know there are some storage problems but thats not the core! It's all about technology.
3) There will be collapse - maybe, maybe not, but I think the former has a higher possibility because possibilities are all somebody can predict, but the reason is not the world is running out of oil and especially not overpopulationen, the true anser is that its underpopulation of smart people and thats the biggest prob! The smarter the people are, the lesser children they have, the dumper the more - almost worlwide. That was never the case before in the human history on a large scale. Take this and look further another 1 or 2 generations and you know collapse will be very likely to occur in the midtherm future. I guess it will start when some issues came together - around 2015 to 20020 - the aging baby-boomer in the west retiring, nothing to replace them, more debt everywhere, oil and cheap energy running out and the dump even more in absolute numbers!
http://en.wikipedia.org/wiki/Heritability_of_IQ
PS: Please stop the cryings things like - people destroy our beautiful and nice nature - thats true, but in the large scale that doesen't even matter - in about 800 to 1000 million years the average temperature on this pale blue dot will rise over 300K and therefor all higher life will be gone because the sun is than mature - long after ghawar is mature for sure :-) Things are much bigger than some barrels (or liters) of crude and some wood transformed to streets and then to wood again and later melting in the mantle...
Thanks dare. I knew some of my points were Ok but not as if they were god-like.
(Just a friendly tease)
And I do very much like your "underpopulation of smart people" view. I think I'll officially steal that line.
Your point on solar use potential is of course in the back of the minds of all who have some hope of our civilization emerging on the other side of the apparent bottleneck we seem to be upon.
From here
The total solar energy absorbed by Earth's atmosphere, oceans and land masses is approximately 3,850,000 exajoules (EJ) per year.In 2002, this was more energy in one hour than the world used in one year.Photosynthesis captures approximately 3,000 EJ per year in biomass. The amount of solar energy reaching the surface of the planet is so vast that in one year it is about twice as much as will ever be obtained from all of the Earth's non-renewable resources of coal, oil, natural gas, and mined uranium combined
This certainly allows for a tad of growth in our energy use over time. But bottlenecks (I am including the waist in an hourglass as a type of bottleneck) can have an infinite number of sizes and shapes and of course there is the possibility of a stopper getting stuck at the top end (the sun's life cycle certainly looks to be a stopper for life's 'progress' on earth).
If someone with a better handle on math than me would take the 122 petawatts our planet's system is absorbing every second and monetize it using LAs 2008 average kilowatt hour price and show that number next to the total $ value of all currency at work in the world it would give some idea of how small a part of our system we really are. But some small parts can really bugger things up in complex systems.
'Smart people' is a loaded term, Voltaire handled that subject rather wittily in 'Candide' :-) and in that spirit I will go out and shovel the driveway, looks like winter has finally arrived in interior AK. In a couple more weeks the ice on the Beaufort will be completely shorefast, only a month or three later than the thirty year average.
Not true. The actual correlation is: the more highly educated people are* and the more economic opportunities there are for women** the fewer children they have. (This generally tends to assume easily available contraceptive devices, as well.)
(* I.e. the more people delay "adulthood" by extending the time they spend preparing for being independent economic agents, the longer they tend to wait to have dependents of their own. This is also typically associated with higher costs of living, and therefore also higher costs of raising children.)
(** This means that the women are less reliant on their spouses for survival, and thus they have more autonomy and more power in the relationship to decline sex with men who don't want to wear condoms or who demand their women bear them many children.)
This article point to debt and the problems with trying to pay that down - well, we just passes 12 trillion in debt. Here is a link to confirm: http://zfacts.com/p/461.html
On a different front; global warming, look at this link graph of ice extent in the Arctic. http://nsidc.org/data/seaice_index/images/daily_images/N_timeseries.png
The upper line is the average for 1979-2000 then the much lower line is shown for 2007's massive meltdown, then above that is the melt and refreeze line for this year, 2009. Look at 2009 as it moves to the right on the re-freeze route, it is just about to merge or maybe even go lower than the refreeze line for 2007.
I'm thinking this may become a major story in the next few weeks, as it shows that even in a year with less melt, it doesn't necessarily refreeze as much ice. This may be due to an overall reduction in old ice.
@ Rockman
This was not a special critique or something else , i just want to say that the OP does not announce anything. That does not mean that anything depeends not on each other - what it shurely does. I'm not a geologist, so the most people here understand mutch more of the PO than i do. But i understand some other things or try to understand them.
@ Luke
Your shurely right. I don't want to especially show the potential of solar energie or something else, i just want to point out that we are small and fragile! And nothing what we actually are doing has mutch effect in the long run! Like you pointed out really god even the small amount of the suns energy which reaches the earth in 150 million metric km ditance (or around 100 million miles) is by far more than we consume...
I think if we do not grow much bigger (in quantity and quality) over the long run we will diappair. The entropy in a closed system is raising constantly and deadly...
@ Adrynian
Not true. This is the common politicial correct expresion, but that does not make it true. It is exact the other way around.
First, you are right to some point, the higer educated the woman are and the higher the opportunities (and the opportunity-costs for childbearing) are, the later they get children, but also the lesser childs they get, especially outside the US!
The other thing is that there is a strong correlation between IQ (or betther the general factor of intelligence g added the storage capabillity of the brain; meamns fluid + cristalline intelligence) of the biologic parents and the childreen, and that does exclude "education" to some point. That does neither mean education hase no influence - witch it shurely has - nor does it suggest that the "social background" has no influence. But it means that the heritability of cognitive skills is relalatively high (with R² 0.3 to 0.7).
And because of that the education-level is also - to some point - a consequnce of the genetic determinined cognitive skills, and not mainly(!!!) the other way around. In fact it is a bi-directional game influencing each other. And there is much literature that shows clearly (watch my link and the given references) a negative correlation beetween cognitive skills and fertillity. How high these correlation or the heriability of the cognitive skills is doesen't matter in the long run, as long as you acept there is a correlation to some degree. In the science there is absolute no dipute any longer that the cognitive skills are to some degree heritable, how big the influence of the heritability is compared to other factors (like social background) is disputet, but that does not matter in the long run, because every generation has to some point a new chance, new teachers and new bock, and perhaps even a new homeland, but you cant escape your gene.
I personally think that your gene gives you a corridor or a limit in/to which you can act, like the ORR in a field. If you try very very hard you may eventually reach 90% of your maximum or even more, say IQ 108 if you are allowed getting 120 max. Another guy can reach 140 but doesen'r try really hard, so he only reach 75% of his potential, so he reaches only 105 - but with mutch less effort. So both, heritability and other factors mather, but the herability matters mutch more than we actually think or allow us to admit because of political correctness.
The alternative is the political correct myth, that everybody is an empty sheet when born. So that means when the math-professor girl with the math professor man have no childreen, and for them a girl and a boy, who where never abble to even finish the easy US public shool have 4 childreen, than we make 2 of these 4 to math-professors. That would never ever work!
Dare
I was pretty sure you had some real meat with which to replace 'smart people'
:-)
I still hope someone has easy enough access to the numbers to monetize the solar input our planet absorbs every second and set it next to the best guess of the total dollar value of all the money at work in the world at a given second (money sitting or being saved needs to be considered working, I just used 'at work' for lack of my knowing better term). I expect the latter would be a tiny number in comparison to the former but I could well be wrong.
Your only reference was a link to an explanation of IQ. Try as I might, I could find nothing in there relating IQ to family size. Please provide further references.
I believe that was in the first sentence I wrote, although considering the explanation I added to that point, I suppose I can see why you might have been confused. However, this merely reinforces my argument that education, rather than intelligence, is the relevant variable.
Really? So smart people in the developing world achieve a higher educational level on average than stupid people in developed countries? That's the first I've heard of it... And here I thought it was dependent on government commitment to providing low-cost public education and financial assistance for post-secondary studies... smart people in poverty having difficulty affording it, otherwise. You assume - rather than prove - that there is meritocracy in the educational level people achieve, but this is usually so only in countries committed to it - predominantly industrialized democracies that can both afford and demand it.
Furthermore, as a university graduate and someone who has spent plenty of time socializing with post-grads, I can honestly tell you that the people who get degrees aren't always the people with the highest IQs. Rather, they are usually the people most motivated and dedicated to their work - not surprisingly - which means that a highly driven person with a modest IQ is more likely to stick with it and get the PhD than the very smart person who doesn't really give a shit.
I believe the term you're looking for is "blank slate," which refers to John Watson & B.F. Skinner's work on behaviourism.
Watson is noted as saying:
I don't know anyone who actually believes this anymore. (You see, my bachelor's degree is in cognitive science, so I spent a great deal of time learning about various theories of cognition and how nature and nurture interact.) Behaviouralism was basically killed by a combination of Chomsky's arguments for the innateness of verbal language acquisition in children, and also experiments that came out of a paper by two of Skinner's students, Keller & Marian Breland, titled "The Misbehavior of Organisms."
Arguing that greater education and female empowerment have by far the largest effects on birth rates does not make me an advocate of "nurture-only" theories in which humans are blank slates. Nor does it mean I am a slave to the "politically correct" position. Rather, it means I have accepted the empirically determined correlations that appear to be relevant to this topic and the arguments attempting to explain them. Another way to look at it is to consider that beliefs are influenced by experience, and therefore beliefs about the benefits of large family size are influenced by changing material conditions. Furthermore, the actual family sizes are influenced by the beliefs people hold about them, as well as the relative power - to manifest their preferred outcome - of the various people involved in making the decision. IQ does not appear to be very relevant to the discussion, except perhaps as one of the many factors that contribute to education.
Finally, as for environment having little to do with IQ, I refer you to your own reference:
Clearly, environment does play an important role in IQ - along with genetics - not that this really has anything to do with what I was trying to say earlier. If you absolutely insist on discussing genetic influences, you would do well to complement it with a look into epigenetic influences on the expression of genes. A worthwhile popular introduction to the topic is Discover Magazine's DNA is Not Destiny, by Watters, Ethan; November 2006, Vol. 27 Issue 11, p. 32-75. Basically, gene expression can be turned on or off by epigenetic protein markers present on the DNA; these can be influenced by, notably, diet, among other things. In other words, environmental conditions affected by, say, social status can potentially influence the expression of one's DNA.
Covered the bases pretty well Adrynian, and Dare was so nice to me. This Oil Drum Europe and I'm guessing Dare would be far more comfortable discussing all this in a language other than English (something I am not at all capable of doing).
The genetic angle is tricky to figure right now. If times get really tough in a big, big way it won't be. Those whose genes give them the best immune systems will be passing on a whole lot more genes than anyone else, regardless of IQ. Lets hope we really are smart enough to keep that at bay until we can maneuver our systems into a far more sustainable configuration.
@ Luke H
So...
First solar-constant is on average 1367 W/m², the earth-diameter is on average 12735 km, so the sun-affected area is in the medium ~ 0,5x10exp9 km² or 0,5x10exp15 m².
So you get around a constant 0,7x10exp18 W sun power for the earth.
Given a prive of 10 cent per kWh and an (unrealistic) efficiency-ration of 100% you would earn around 70 trillion dollar per hour or only 7 trillion when you suggest an efficiency of 10% :-)
I guess the fed has some work to doo printing some money
@ Adrynian
First I'm not shure if you get it right what i meant, because I never suggest genetics tetermine anything or are determining fertillity alone. But as you might guess this is not my mother-tongue and i've never lifed in an english speaking country...
What I would suggest is that the cognitive skills of a person are to some degree heriatable and the fertillity of people with high cognitive skills is significant lower than that of people with lower cognitive skills and that will cause some trouble in the long run.
Cognitive skills are something more than fluid intelligece alone (wich means IQ), as you point it out - and i sayed it also - a person how does not try hard my reach not much, even though he has a high "IQ-potential". Than there is the storage-cababillity of the brain (the critaline-intelligence), which is not linked direct to the IQ (but some degree to brain-volume / number of cortex-neurones, white and grey matter) and so on.
But the core is that:
1) Environmental influences, influences of nutrition, upbringing, social background and so on are very large, but there influence is smaller in developed countries than in developing ones, so i totally agree to you here.
2) In an developed society there are negative correlation beetween IQ and Fertilitty to some extend. And it is clearly shown that that the higer the IQ of the parants, the higer the IQ of the childreen. It is even not importand if this is from heritability of cognitive skills - at least to some degree (which I personlly think it is) - or if this is only a consequence that social background, learning attitutes and nutrition is commited from the parent to the childreen. (see also end of flynn-effect)
3) In the medium-long run (depend on how you define this) this is in my opion the biggest threat for the human society, bigger than the OP and anything else.
http://en.wikipedia.org/wiki/Fertility_and_intelligence
http://en.wikipedia.org/wiki/Dysgenics
http://www.sciencedirect.com/science?_ob=ArticleURL&_udi=B6W4M-4NH6N8N-1...
http://www.sciencedirect.com/science?_ob=ArticleURL&_udi=B6V9F-3YB56P1-2...
http://cat.inist.fr/?aModele=afficheN&cpsidt=20889455
http://mangans.blogspot.com/2009/01/iq-and-fertility.html
I could extend this list...
This is true, i never sayed another thing, the so called environmental-influences on fertillity and cognitive skills in developing countries are much larger than then influence of heritability, thats shurely right, but in developed countries this is not the case to some extend, and most of the world exept subsaharian-africa is devoloping to some degree...
Put a "high-potential" in a black chamber a he will never get smart, thats right for shure!
I read several reflections on this study and it does not prove me wrong, it says that your genetics gives you a frame, and in this frame you can act, and also the frame can be rebuilt in your life to some degree, so the genetics are chancing all your life. But it does actually not suggest that the genetics mean nothing or even more than the commen actuall "feeling" is. This is also your opion to some degree if i get it right.
I have a personell opinion that your cognitive skills does not sayes to much (but something to some degree, you ned a basis, for example to get rich you must not be very intelligent but you need at least say IQ 100 or so, with an IQ of 70 your are not capable of getting rich exept mayby camble) about your outcoming in society.
But the sociaty and the tecnological forthcomming depends heavy on a small number of very smart peole - like Einstein, John von Neumann, ... - and because of that i suggest that we will collapse in the long run not becuse of PO or something else but because of dysgenteic effects and the "lacke of the smart"...
Thank you for the good conversation so fare, i do not disagree with the most points, but i think that some things in these topic are at least "underestimated", thank you.
Dare,
Thanks for doing those calculations. You inspired me to be a little less lazy. From the article I cited earlier (that links works now too) the earth's system actually absorbs about 122 petawatts. CA kwh go for about $.15 overall average. That breaks down to $.000000042/wattsecond or a mere $5,124,000,000 worth of insolation a second (valuing 100% of it at CA electricity prices) Putting the world M3 money supply at $512,000,000,000,000 (it was estimated at about $450 trillion in mid 2007) the world could afford to pay for about 100,000 seconds (about 28 hours) without creating any more money. That is a little more cash on hand than I thought we had, maybe the printing press need to cool down some.
Some more on the topic - especially on the heritability of the IQ or cognitive skills...
http://redalyc.uaemex.mx/redalyc/pdf/727/72719123.pdf
http://www.springerlink.com/content/u63636877l373r8p/fulltext.pdf
http://www.apa.org/journals/features/rev1082346.pdf
http://www.ingentaconnect.com/content/bpl/psci/2003/00000014/00000006/ar...
and also some opposite - or relativising - views
http://cscs.umich.edu/~crshalizi/weblog/520.html
http://delong.typepad.com/egregious_moderation/2007/07/cosma-shalizi-a.html
ethan.camp.googlepages.com/The_Heritability_of_IQ.pdf
http://www.nyu.edu/gsas/dept/philo/faculty/block/papers/Heritability.html
This is special in my opinion
http://www.gnxp.com/MT2/archives/000973.html
It shows clear:
If the environmental conditions are bad, then the influence of nutrition, accessibility of books and education and much more of these extern factors are fare more - or at least more important - than the heritability for the outcomming of the cognitive skills of a person. That also explaines the well-known flynn-effect
http://en.wikipedia.org/wiki/Flynn_effect
But if the environmental contitions have reached some limits (nutrition is general good, child-mortality very low, basic education and books general avaible) the heritability becomes more and more important (more and more people reach at least 80%-90% of their maximume gentically determined cognitive skills, so you could not longer dominate the genetic-frame by better education or nutrition...).
In my opinion you could not deny the heribilaty of cognitive skills to some degree, because otherwise you must suggest that you can make an scientist out of an ape (because genetics differ us from them) - but some may suggest if you raise an ape in an middle-class white family he will then be capapple of finishing high-shool :-) LOL
You could discuss this further, but i think the impacts of these topic are much greater than their "room" in the public, say like PO 10 years ago :-)
Thank you for the clarification. I think I understand you better now.
If I'm parsing you correctly then your main concern is that in developed countries - given that we both believe environmental influences are the primary determinants of fertility in developing countries - if fertility is negatively correlated with IQ then we can expect to see an overall decline in the IQ of the population over time due to (1) the relatively larger family sizes of lower IQ individuals and (2) the general heritability of IQ.
Or, to put it slightly differently, better nutrition and greater educational opportunities have enabled a larger proportion of the population in developed countries to "rise to the upper region of [their intellectual] reaction range" where "the reaction range for a genetically influenced trait is the range of possibilities - the upper and lower limits - that the genetic code allows" (Psychology: Frontiers and Applications, Passer & Smith, p. 351). Furthermore, the more of their potential they achieve, the more educational and economic success they should tend to have, on average.
However, these same people - call them group (A) - will also tend to have fewer children than those who either (B) have a lower reaction range - and therefore tend to be less educated and have fewer economic opportunities on average - or (C) have not achieved their genetic potential - because of the negative impacts of environmental influences and/or personality characteristics that living in a developed country hasn't helped them overcome. This should, over time, result in a reduction in the average reaction range of members of that population as people with a lower reaction range - i.e. group (B) - will on average tend to have more offspring than group (A). Group (C) may actually offset this trend to some degree because they will tend to have more children than group (A) and those childrens' reaction ranges will be higher than their parents' achievements would otherwise suggest. In that respect I tend to disagree with your claim that:
Someone born with a better reaction range, but in a poor social environment, is one more person who is waiting to benefit from the Flynn Effect. Furthermore, there is still plenty of social inequality in Western democracies - and it's currently growing - that waits to be addressed, meaning there are still plenty of people in group (C) who await a change in social conditions to enable them, or their offspring, to move into group (A). The African-American population of USA, and the First Nations population of Canada spring to mind, for example.
However, I take your point that over time this trend is problematic for the intellectual reaction range of a population. All I can say to assuage your concern is there are almost certainly other factors selecting for intelligence so the trend should prove to be self-limiting eventually. Consider the same way that various natural selection pressures limit the sexual selection favouring, for example, bigger antlers in caribou and moose, shinier and more colourful male birds, etc. Intelligence has been of incredible benefit to our species, so I doubt that we will turn our species into morons solely by providing more educational and economic opportunities to our best and brightest.
Of course, this argument isn't what you started with:
I think you've basically retracted the "almost worldwide" bit at this point, so I'm content to leave that be. The part about the real reason for collapse being not about oil but the underpopulation of smart people is reminiscent of Thomas Homer-Dixon's argument in The Ingenuity Gap that successfully addressing the challenges humans are facing requires bringing the best and brightest minds to bear on the problem - on the assumption that doing so will provide us with a solution that will enable us to continue more or less with Business As Usual. Let us ignore, for a moment, the "Limits to Growth" argument that societies that put off various limits successfully enough to grow exponentially for a time inevitably seem to run into several at once, thereby overwhelming their ability to cope and/or "solve" the problem(s).
If improving ingenuity really were the way forward, the potential IQ problem - and hence "the ingenuity gap" - in the developed world is insignificant compared to getting the developing world populations up to their full potential. The population of the developing world is an order of magnitude larger than that of the developed world, meaning that if they had access to better nutrition and education they should produce an order of magnitude more scientists, engineers, and - even better - geniuses to solve the problem for us - maybe more, considering that they presumably haven't already had a few generations of selection against their intellectual potential.
However, I think the consensus on TOD at this point is that we know a variety of things that we could do to address peak oil and the collapse that may follow - for example, localizing economies and decentralizing power, building out renewable energy capacity, moving away from fossil fuel powered transportation and distribution systems, reinventing our financial system to enable productive investments in the face of declining economic activity, addressing the fossil fuel dependence of our food production and distribution, emotionally disinvesting ourselves of expectations for ever higher standards of living and ever more gadgetry, etc.
The problem, however, has more to do with vested interests in the status quo, the general ignorance of the problem - or ambivalence towards it - in the population at large, and political "leaders" with attention deficit disorder who can't focus on anything but the most recent polling statistics - when they're not selling themselves to the highest bidder. In such a context, proactively addressing the issue isn't really on the radar, regardless of how many smart people we have working on it. As has so often been said here on TOD, the problem is [largely] political, not technical.
Thats right - i totally agree. But the problem is that we actually do not know if the group (C) outdrives the decline of the cognitive skills because of low fertillity trends in group (A), at least in the developed world. Recent studies finding the end of the flynn-effect and even a decline in some western populations (for example Danish soliers or UK shoolkids) suggest that this may not be the case. But i totally agree we do not know for sure because we need further research, which is not done at all. And i personally think the problem is getting worse in the long run.
This is also true, and i agree that i exaggeraded my conclusions in my first post. The better statement would be that i suggest that because larger parts of the world are developing (e. g. China or Asia in general), and so at least the accessibility to education via books and the internet is growing worldwide, the trends of a possible decline of the genotypic cognitive skills - with at the same time ongoing increasing phenotypic cognitive skills because of better nutrition and others (flynn) - is growing or better gaining moment which maybe a big problem in the long run, shurely not in the short run. But its right this (cognitive skills and their integenerational development) is a very multi-criterial problem which need much further research.
Another (not profed and i think not easy profable) point of me is that society depends much on a relatively small number of "supersmart", how will not even be rich (Einstein or Schrödinger where never really rich and Stephen Hawking isn't soo rich today). And some studies suggest that the "flynn-gains" of the average IQ (I don't like it, because cognitive skills are shurely more than IQ, but it's not easy to adress this) - numbers came heavily from the lower half of the Gaussian distribution, that means that today there are far less mental-retarded than in former times because of better nutrition abd anything else. But the number of the "supersmart" may have grown only slightly and may now actually erode, at least in developed countries, which will be in the very long run the much greater threat on society then the PO, but of course in the short-medium run PO is the bigger problem.
Thats right of course - i have the same opinion on the topic. The world energy-use can be supportet by an area of around 400 squaremiles using solar-thermal powerplants in the sahara-desert (with actual tecnology), usind nothing other. The main problem is the storage of the energy but that is also not insoluble, of course the price of energy maybe higher to some degree but actually it is very very low and that leads to much energy-wasting today.
Good points :)
Thanks for the engaging discussion!
The population of super smart may have another issue, brought on by the supersmart themselves. The knowledge base is increasing at an astounding rate. New fields that didn't even exist a few years ago draw their share of the best and brightest. As these fields grow, specialize and diverge the supersmart in each field become more and more isolated from those in other disciplines. They live in a rapidly expanding universe of knowledge where all the points are moving farther from each other.
This may be of more import than is readily perceived. A James Watson might not even meet a Francis Crik today. That would be a great loss. But this is quite the fabric we make up, and the web does move information far and fast. Who knows what sort of fabulous connections might be formed, are forming or may have been formed already, or what brilliant new roads to understanding might emerge from them...