| Thoughts from Alcatraz | The Oil Drum: Europe | The Future of Nuclear Energy: Facts and Fiction - Part II: What is known about Secondary Uranium Resources? |
Oilwatch Monthly August 2009
Posted by Rembrandt on August 17, 2009 - 10:12am in The Oil Drum: Europe
The August 2009 edition of Oilwatch Monthly can be downloaded at this weblink (PDF, 1.3 MB, 33 pp).
The Oilwatch Monthly is a newsletter that is available free of charge with the latest data on oil supply, demand, oil stocks, spare capacity and exports. Readers who want to receive the Oilwatch Monthly in their e-mail box each month can subscribe at this weblink, by filling in their first name, last name, email address and selecting Oilwatch Monthly in the mailing list box. To finalize your subscription push the 'inschrijven' button below the form.
A summary and latest graphics below the fold.
Latest Developments:
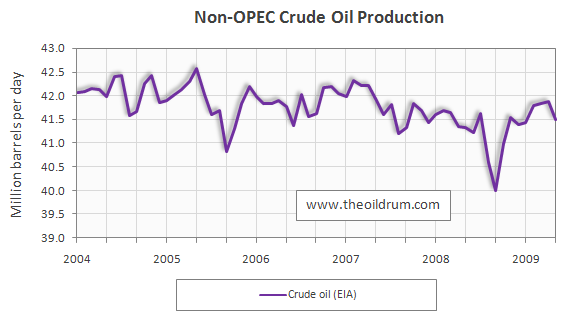
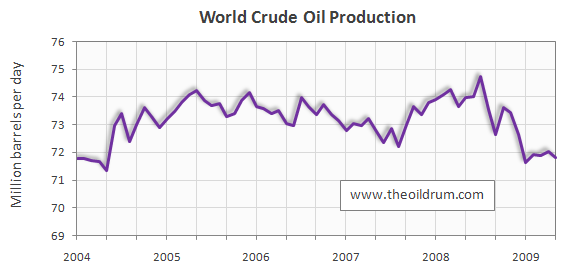
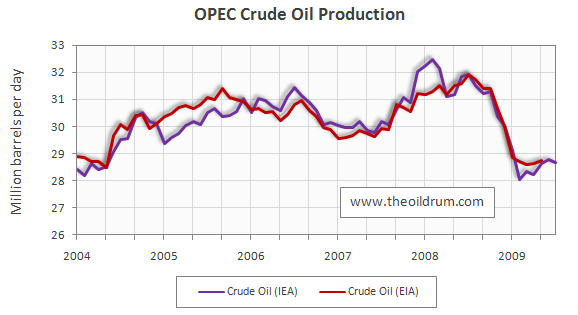
1) Conventional crude production - Latest figures from the Energy Information Administration (EIA) show that crude oil production including lease condensates decreased by 236,000 b/d from April to May 2009, resulting in total production of crude oil including lease condensates of 71.80 million b/d. The all time high production record of crude oil stands at 74.74 million b/d reached in July 2008.
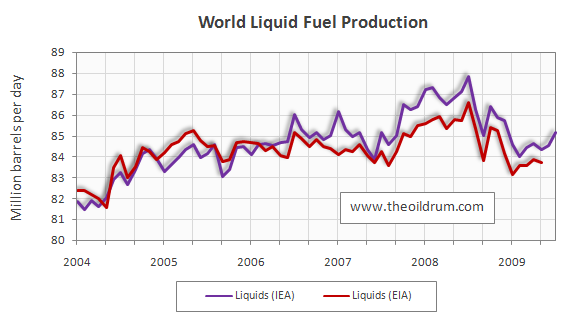
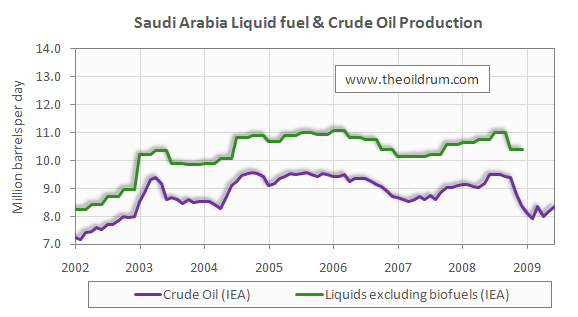
2) Total liquid fuel production - In July 2009 world production of all liquid fuels increased by 580,000 barrels per day from June according to the latest fgures of the International Energy Agency (IEA), resulting in total world liquid fuels production of 85.15 million b/d. Liquids production for June 2009 was revised upwards from 84.16 to 84.57 million b/d. Average global liquid fuels production in 2009 up to July was 84.54 million b/d versus 86.6 and 85.32 million b/d in respectively 2008 and 2007.
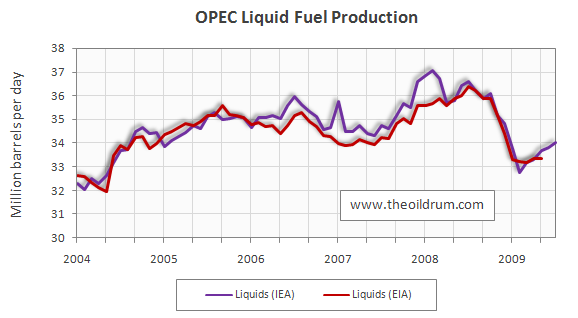
3) OPEC Production - Total liquid fuels production in OPEC countries increased by 200,000 b/d from June to July to a level of 34.00 million b/d. Average liquid fuels production in 2009 up to July was 33.49 million b/d, versus 36.09 and 35.02 million b/d in respectively 2008 and 2007. All time high production of OPEC liquid fuels stands at 36.58 million b/d reached in July 2008. Total crude oil production excluding lease condensates of the OPEC cartel decreased by 110,000 b/d to a level of 28.64 million b/d, from June to July 2009, according to the latest available estimate of the IEA. Average crude oil production in 2009 up to July was 28.53 million b/d, versus 31.43 and 30.37 million b/d in 2008 and 2007 respectively.
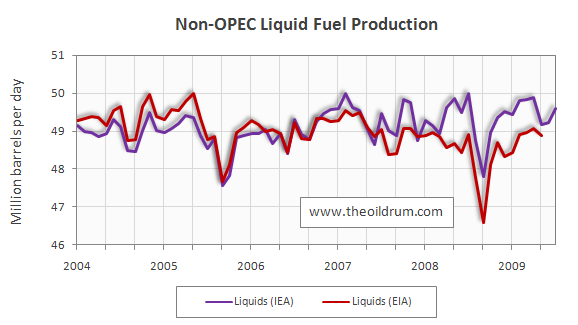
4) Non-OPEC Production - Total liquid fuels production excluding biofuels in Non-OPEC countries increased by 370,000 b/d from June to July 2009, resulting in a production level of 49.60 million b/d according to the International Energy Agency. Average liquid fuels production in 2009 up to July was 49.56 million b/d, versus 49.32 and 49.34 million b/d in respectively 2008 and 2007. Total Non-OPEC crude oil production excluding lease condensates decreased by 367,000 b/d to a level of 41.50 million b/d, from April to May 2009, according to the latest available estimate of the EIA. Average crude oil production in 2009 up to May was 41.68 million b/d, versus 41.32 and 41.80 million b/d in 2008 and 2007 respectively.
5) OECD Oil Consumption - Oil consumption in OECD countries decreased by 879,000 b/d from April to May to a level of 42.30 million b/d. Average OECD oil consumption in 2009 up to May was 44.09 million b/d, versus 46.10 and 47.68 million b/d in 2008 and 2007 respectively.
6) Chinese & Indian liquids demand - Oil consumption in China increased by 137,000 b/d from April to May to a level of 7.54 million b/d. Average oil consumption in China in 2009 up to May was 6.98 million b/d, versus 6.92 and 7.29 million b/d in 2008 and 2007 respectively. Oil consumption in India decreased by 121,000 b/d to a level of 2.82 million b/d. Average oil consumption in India in 2009 up to May was 2.92 million b/d, versus 2.60 and 2.43 million b/d in 2008 and 2007 respectively.
8) OPEC spare capacity - According to the International Energy Agency total effective spare capacity (excluding Iraq, Venezuela and Nigeria) in July 2009 increased to 5.30 million from 5.13 million b/d in July. The IEA estimates Saudi Arabia currently capable of producing an additional 3.3 million b/d within 90 days, the United Arab Emirates 0.58 million b/d, Angola 0.4 million b/d, Iran 0.22 million b/d, Libya 0.23 million b/d, Qatar 0.13 million b/d, and the other remaining countries 0.44 million b/d.
Total OPEC spare production capacity in July 2009 remained stable at 4.44 million from June according to the Energy Information Administration. Of total spare capacity 2.50 million b/d is estimated to come from Saudi Arabia, 0.24 million b/d from Qatar, 0.28 million b/d from Angola, 0.30 million b/d from Kuwait, 0.30 million b/d from the United Arab Emirates, 0.10 million b/d from Iran, and 0.72 million b/d from other countries.
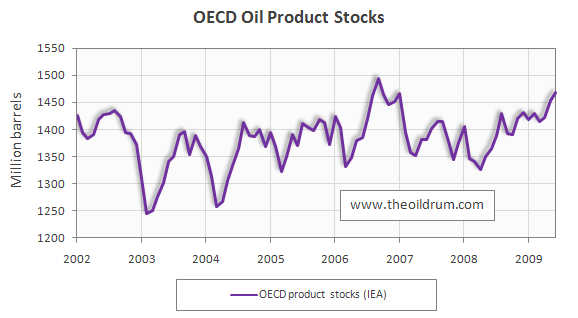
9) OECD oil stocks - Industrial inventories of crude oil in the OECD in June 2009 decreased to a level of 988 million from 990 million barrels in May according to the latest IEA statistics. Current OECD crude oil stocks are 31 million barrels higher than the five year average of 957 million barrels. Industrial product stocks in the OECD in June 2009 increased to 1467 million from 1451 million barrels in May, according to the latest IEA Statistics. Current OECD product stocks are 72 million barrels higher than the five year average of 1395 million barrels.
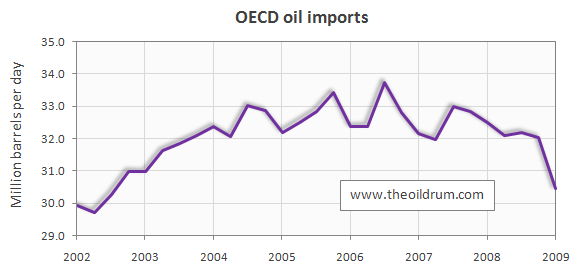
10) OECD oil imports - Oil imports in the group of OECD countries decreased by 1.60 million b/d from 4th qrt. 2008 to 1st qrt. 2009 to a level of 30.43 million b/d. Average oil import in OECD countries in 2008 was 32.19 million b/d, versus 32.47 and 32.7 million b/d in 2007 and 2006 respectively.

Personnel
Editors
Contributors
Peak Oil Primers
Archives
- November 2010 (3)
- October 2010 (6)
- September 2010 (4)
- August 2010 (7)
- July 2010 (6)
- June 2010 (7)
- May 2010 (2)
- April 2010 (8)
- March 2010 (4)
- February 2010 (6)
- January 2010 (3)
- December 2009 (5)
- November 2009 (8)
- October 2009 (12)
- September 2009 (6)
- August 2009 (5)
- July 2009 (11)
- June 2009 (8)
- May 2009 (16)
- April 2009 (10)
- March 2009 (7)
- February 2009 (10)
- January 2009 (15)
- December 2008 (9)
- November 2008 (9)
- October 2008 (9)
- September 2008 (13)
- August 2008 (10)
- July 2008 (14)
- June 2008 (23)
- May 2008 (16)
- April 2008 (12)
- March 2008 (16)
- February 2008 (9)
- January 2008 (13)
- December 2007 (13)
- November 2007 (16)
- October 2007 (22)
- September 2007 (8)
- August 2007 (9)
- July 2007 (16)
- June 2007 (8)
- May 2007 (7)
- April 2007 (7)
- March 2007 (10)
- February 2007 (10)
- January 2007 (12)
- December 2006 (9)
- November 2006 (15)
- October 2006 (4)
- September 2006 (5)
- August 2006 (5)
- July 2006 (9)
- June 2006 (5)
- May 2006 (10)
- April 2006 (9)
- March 2006 (13)
Vital Trivia
License

This work is licensed under a Creative Commons Attribution-Share Alike 3.0 United States License.
Rembrandt,
Thanks for an exceptionally informative group of graphs. I encourage everyone to look at the other graphs in the Oilwatch Monthly PDF. There are some very nice graphs there as well.
From the Oil Watch Monthly PDF, I found it interesting to see how oil demand dropped off at different times around the world.
According to Jodi, oil demand for the US dropped off, starting about early 2008.
But demand in both Europe and Japan dropped off at least a year earlier--which is related to why at least some economists (such as Jeff Rubin) think that the recession started elsewhere than the US.
Demand in India continues to charge ahead:
Demand in China dropped sharply after the Olympics last year. It has rebounded, but not to the trajectory one would have expected based on prior demand growth.
Strictly speaking according to EIA data product supplied for the US peaked in Aug 2005. This coincides with a coincident peak in imports:
Operative refinery capacity continues to expand, however, one factor in why refineries are in such dire straits at the moment:
The decline seen in the 12 month MA shows up in this graph of gasoline supplied:
Does the JODI data account for biofuels? The US has compensated for decreasing imports with ethanol, both produced and imported; exactly how this is accounted for in the overall product supplied figures I'm not certain about. Part of the EIA definition of Finished Motor Gasoline is:
Doubt that would leave volume out of the figures provided, but thought I'd bring it up.
Comparisons between these graphs will be skewed without numeric analysis - just eyeballing can lead one astray as each is scaled differently. As I mentioned above, increased production of ethanol has allowed the US to reduce the need to import and refine crude oil. Ethanol cushioning the impact of the price spike is something I'd like to see analyzed further - including how much of a factor it is in various other nations' fuel supply.
Could the early falls in consumption have been triggered by something other than a latent recession or high prices? Like mandatory efficiency standards, carbon trading or green consumption trends? The reason I ask is that consumption seems to have been declining as early as 2004 in France, Germany, Italy and Japan. But others like the UK and Spain show a later decline beginning around 2006 which is more easily attributable to price rises.
Actually, the oil price run-up began much earlier than most people remember--2003 and onward, so the earlier drop does make sense. This is a graph Rune Likvern did, from this post.
Rembrandt, excellent analysis and presentation of the IEA, JODI and other data as usual. Thanks!
Chart 7 (World Production in BTUs) is an interesting chart showing that world liquids production currently contains less energy on a gross basis than in 2005.
A deeper analysis of this chart could be revealing.
In chart 7 the BTU content of "crude oil" is fixed at "a barrel of crude oil contains around 5.8 million British Thermal Units".
However, this assumes that the BTU content of "crude oil" has not been changing. The global average produced oil barrel is becoming lighter at one end with additional NGLs (containing less energy but requiring less to process) and heavier at the other end with oil sands and other heavy oil production (containing more energy but requiring more to process). Do these offset?
An interesting chart would be the average API gravity of the global average produced liquid barrel on a gross and net (net of processing losses) basis. This could be a level of precision which is not available in any dataset at the moment (maybe it is). It would be a great addition to your monthly analysis as a support to Chart 7.
@Buster Cagney (17 aug,4:14pm)
Thank you Buster I am always glad that this effort is a useful one. I did some work in the past on the change in sulfur content and API gravity of different crude blends across the globe. The data is not comprehensive enough though to state anything about the energy content as a consequence of this change (next to the indirect costs of drilling which is not taken into account in the BTU content). My conclusion based on several sources which did keep track of the average API gravity of global average produced liquid barrel (gross I think) was that the sulfur content and gravity in the coming 5-10 years will not change that much after the recent change to more heavier/sourer crudes, so your hypotheses that the different sources of new production offset eachother seems to be true. I don't have access to this data anymore (from PIRA/CERA) though and it is only updated once a year so this makes it difficult to add it into the oilwatch.
If you send me an email at contact @ peakoil.nl I can send you more information about this subject.
Ditto - random typo in the PDF version:
Page 9 - above graph of US Oil consumption:
'Oil consumption in the US decreased by 214,000 b/d from April to'
-- should be 21,400,right?
edit: Belay that - I'm such a dolt (I was looking at the decline from about 2005, which was about 21.4 MILLION b/d, rather than reading what was actually written. [ sigh] Sorry.)
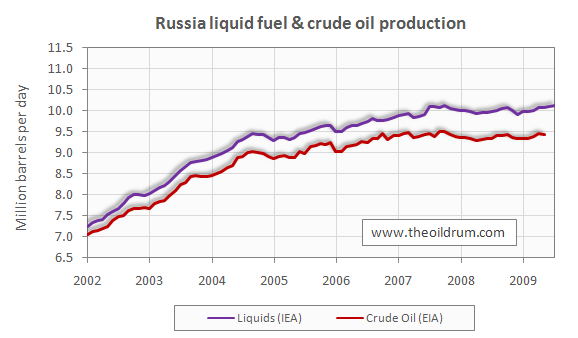
I wait for these postings every month. Data is worth a lot more than speculation. It appears that there has been a peak 2-3 years ago in imports, non-OPEC production, etc. The curves for Saudi and Russian production appear to be flattening though still increasing over the last five years. Whether or not we are looking at the final peak in world liquids production still requires more data points. However, the probability that we have approached a final peak is higher than it has ever been. This, of course, is not a definitive statement and is obviously and perhaps trivially true, but it is as close to the data as I can come. However, I prefer making such statements to definitive declarations which are later proved false.
Other than being necessary, which I agree with, pure unadorned data does not give you much by the way of fundamental understanding. It also comes late in the cycle. So we still need first principles models to allow us to plan ahead for the data that might be forthcoming.
Definitive declarations in the context of a model that you believe in are OK, but w/o that backing it becomes sketchy speculation. For example, all the AGW climate data that has been collected is indecipherable w/o a model.
@WHT 17 aug, 6:57pm
Agreed, we need three things 1) good and up to date data, 2) models that give a bigger understanding 3) expert insights that can be validated with data as well as models
I have got to say, if you take the 12 month rolling averages, Daniel Yergin's "undulating plateau" is a very credible explanation over the past five years.
Looks more like business as usual. No frightening or shocking revelations here.
Can anyone extract any new or important trends?
IMO you misunderstood Yergin's predictions. Re business as usual, there hasn't been too many undulating plateaus of any length since black gold was first discovered-Yergin has predicted this plateau will last almost forever (and he had it starting at a far higher level in the future).
In the not-too-distant future, a five year rolling average of the crude oil graph will show a graph that looks like a classic Hubbert's curve with the peak at mid 2006. That is unless things really fall off a cliff or mega-projects kick in big time.
Thanks for this. I think that the new format and graphics are considerably improved. Instant powerpoint slides! The trends are fascinating, including the plot of European demand/price posted in the comments.
@Bill.Harbert August 17, 3:04 PM
Glad that the new format is working out for you.
Matt Mushalik asked me to post some graphs he made, using his "incremental production" approach that looks at only recent increases or decreases in production by country, not their overall level. He takes what I think of as the "top" piece of the graph for each country, and adds it together. For example, this is the US contribution (graph made a while back) that would be added when he totals production:
This graph of OPEC incremental production using current EIA crude oil data shows that Saudi Arabia continues to be the big source of production cuts (since the yellow Saudi layer is thinner recently). Venezuela has also been reducing reducing production--but this may be related to its financial problems.
The graph below (1d) puts the countries that Matt considers to be "growing countries" at the bottom. If one looks at all of the greenish countries, from China on down, on a combined basis, it is clear that this "growing group" is not growing very much--certainly not enough to offset big declines elsewhere. Russia in particular is quite flat.
Graph 1c (below) puts the declining countries (orange and red countries) at the bottom. This group has been, and continues to decline, by much more than the green increasing group is increasing. Saudi Arabia (yellow) might even be considered in this group.
There are a number of highly variable countries that affect production as well. Iraq at the top of the chart has been helping hold world production up.
Does anybody have any concern that the EIA or IEA will fudge data when the numbers start to drop sharply and irreversibly?
Will the true supply situation only be knowable by observing price, then shortage/govt. intervention in markets?
The US EIA has specific data integrity requirements:
"The Administrator shall not be required to obtain the approval of any other officer or employee of the Department in connection with the collection or analysis of any information; nor shall the Administrator be required, prior to publication, to obtain the approval of any other officer or employee of the United States with respect to the substance of any statistical or forecasting technical reports which he has prepared in accordance with law."
Source: http://tonto.eia.doe.gov/abouteia/eia_independence.cfm
The above is legalese and doesn't appear to preclude the EIA from changing the data to suit its view, so long as the EIA changes the data independently without influence from other parts of the government.
I don't know what the penalties (if any) would be for the EIA to independently and intentionally misrepresent data.
Well, as Denninger points out, laws and charters for government agencies rarely include "or else". Hence when, for instance, banks are allowed to run for 2 or more years at negative capitalization, despite laws requiring the FDIC to seize them if they do so, no one goes to jail - even when their eventual failure costs taxpayers tens of billions of dollars that would have been avoided had the law been followed.
I seriously doubt that if Obama's chief of staff phones up the EIA head and says hey, stop panicking the sheep, that he'll be ignored.
You should call or email the EIA and ask what penalties are there, if any, to stop them from misrepresenting the data. They are usually quite friendly and helpful.
It would be interesting if TOD sent the EIA and IEA a list of questions. The answers could be put online as a post.
The question of how data integrity can be ensured without penalties could be one of the questions.
Here's the reddit links for this post (we appreciate your helping us spread our work around, both in this post and any of our other work--if you want to submit something yourself to another site, etc., that isn't already here--feel free, just leave it as a reply to this comment, please so folks can find it.):
http://www.reddit.com/r/business/comments/9berh/oilwatch_monthly_august_...
http://www.reddit.com/r/energy/comments/9berb/oilwatch_monthly_august_2009/
http://www.reddit.com/r/environment/comments/9berc/oilwatch_monthly_augu...
http://www.reddit.com/r/collapse/comments/9bere/oilwatch_monthly_august_...
http://digg.com/environment/Oilwatch_Monthly_August_2009
Find us on twitter:
http://twitter.com/theoildrum
http://friendfeed.com/theoildrum
Find us on facebook and linkedin as well:
http://www.facebook.com/group.php?gid=14778313964
http://www.linkedin.com/groups?gid=138274&trk=hb_side_g
Thanks again. Feel free to submit things yourself using the share this button on our articles as well to places like stumbleupon, metafilter, or other link farms yourself--we appreciate it!
Hello TODers,
Thxs Rembrandt! Regarding the graph up above in the keypost, [Figure 7 - OECD oil imports from 1st quarter 2002 to 4th quarter 2008], if a person draws two simple trendlines based upon the peak: you get a steep upslope, then a steep downslope.
It will be interesting to see if this radical departure in direction continues in the years ahead for the OECD. According to J. Brown's [TODer Westexas] ELM and Duncan's Olduvai Re-Equalizing Theories: this import shrinking is exactly what they predict [IMO, with Duncan expecting the US imports to shrink the fastest as our BOE/capita continues to decline from the '73 Peak of 62.09].
For any TOD newbies:
http://www.theoildrum.com/node/5419
---------------------------
Olduvai Theory: Toward Re-Equalizing the World Standard of Living - Richard Duncan
---------------------------
http://en.wikipedia.org/wiki/Export_Land_Model
--------------------
The Export Land Model [ELM], or Export-Land Model, refers to work done by Dallas geologist Jeffrey Brown, building on the work of others, and discussed widely on The Oil Drum.[1] It models the decline in oil exports that result when an exporting nation experiences both a peak in oil production and an increase in domestic oil consumption. In such cases, exports decline at a far faster rate than the decline in oil production alone.
-----------------------
Bob Shaw in Phx,Az Are Humans Smarter than Yeast?
I would agree--Figure 7 looks much like what we would expect if OECD imports have peaked and are now in decline.
Thxs for the reply. Please see my posting near the bottom of today's DB on OPEC tarmat extraction research [last dregs of the crude barrel?].
I was looking at OPEC spare capacity between mid 2008 and early 2009 Saudi spare capacity increased by over 3 mbpd. During this period Saudi prodcution decreased by around 1 mbpd. Is there something I am missing or is it another instance of OPEC numbers beomg unreliable. Personally I think the "real" spare capacity is quite a bit less than the official 4-7 mbpd probably around 2 mbpd.
Easy - they've brought on 2.075 mb/d of new production for '08/'09 - at least on paper. Rest is shut in capacity.
I agree with you in suspecting OPEC spare capacity is significantly overestimated by both the EIA and IEA. We will not know the real amount until supply and demand collide again making the price rise while production stagnates or declines.
Rembrandt, as always your report is the highlight of TOD
thank you
a couple of key numbers:
OPEC consumption rate of growth over the past 5 years has averaged 6% and still continues in 09 (fig 17) Most of Westtexas' ELM model assumptions are based on either flat or 2% growth by the exporting country, so 6% growth is off the charts
OECD consumption decline (fig 20) is -5.38 MBD from the high of 47.68 in 2007 to the current 42.3 MBD. and OECD appears that the decline continues (this is actually a good proxy for overall economic activity or lack thereof)
so its really OPEC vs the OECD. will OECD decline continue at a rate that will allow OPEC to grow their internal consumption, and reduce total exports, and not affect global price?
at what point will the rate of OECD consumption decline flatten? i.e. what is the OECD base minimum usage number, and when do we hit it? is OECD factory utilization flat yet or still declining? is the consumer fully dead yet, or can they take a few more hits?
i think when OECD hits that base, prices will spike dramatically. or as one analyst said, we will have a "swift and violent price recovery"
I have now looked at 21 current and former net oil exporters (I added a few more countries after looking at Matt's export chart). In any case, some total liquids production & net export rates of change over the referenced time frames follow (EIA). The recurring pattern is pretty obvious.
The numbers for "Export Land," which would be classified as a Former Net Oil Exporter, would be -5%/year (production decline rate) & -27%/year (net export decline rate), over an 8 year period.
Four Former Net Oil Exporters
Production & Net Export Increases/Declines Per Year, Over the Referenced Time Frame, Are Respectively Shown (EIA, Total Liquids)
China (1985-1992)
+1.8%/year (Prod.) & -16.9%/year (Net Oil Exports)
Indonesia (1996-2003)
-3.9%/year & -28.9%/year
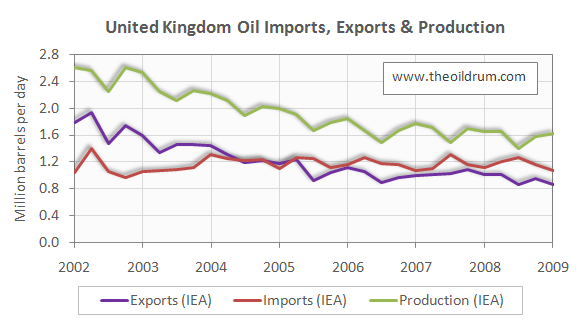
UK (1999-2005)
-7.8%/year & -55.7%/year
Egypt (1999-2006)
-3.8%/year & -37.1%/year
17 Net Oil Exporters Showing Production Declines
Production & Net Export Declines Per Year, Over the Referenced Time Frame, Are Respectively Shown (EIA, Total Liquids)
Saudi Arabia (2005-2008)
-1.0%/year (Prod.) & -2.7%/year (Net Oil Exports)
Russia (2007-2008)
-0.9%year & -2.4%/year
Norway (2001-2008)
-4.7%/year & -5.1%/year
Iran (2005-2008)
-0.5%/year & -3.4%/year
Nigeria (2005-2008)
-6.4%/year & -6.9%/year
Venezuela (1997-2008)
-2.6%/year & -4.5%/year
Mexico (2004-2008)
-4.7%/year & -13.5%/year
Colombia (1999-2008)
-3.6%/year & -8.3%/year
Oman (2000-2008)
-3.1%/year & -4.4%/year
Malaysia (2004-2008)
-4.2%/year & -16.8%/year
Syria (1996-2008)
-2.4%/year & -5.5%/year
Vietnam (2004-2008)
-3.5%/year & -46.0%/year
Denmark (2004-2008)
-7.6%/year & -16.4%/year
Yemen (2001-2008)
-5.4%/year & -11.5%/year
Ecuador (2005-2008)
-1.7%/year & -4.4%/year
Gabon (1997-2008)
-3.7%/year & -3.8%/year
Equatorial Guinea (2005-2008)*
-1.45%/year & -1.46%/year
*Equatorial Guinea, which has almost no domestic consumption, comes closest to having the production decline rate = the net export decline rate.
Thanks, WT.
So would you agree with polytropos (Greek epithet of Odysseus meaning "man of many wiles") that things are panning out even worse than your model predicted? If so, how much worse?
As noted below, the model is used to explain "Net Export Math." The net export decline rate for a given exporter is a function of three factors, but the key point about all 21 examples is that so far every country, especially with any real consumption, shows a net export decline rate in excess of the production decline rate.
Sam has done some detailed mathematical modeling of the top five net oil exporters--Saudi Arabia; Russia; Norway; Iran and the UAE--which account for about half of world net oil exports, and the 2006-2008 data points fell between his middle case and best case. His outlook is that the top five will collectively approach zero net oil exports in the 2030 to 2035 time frame. His best case is that they will have shipped half of their post-2005 CNOE (cumulative net oil exports) by the end of 2015 (only 10 years after 2005), with the remainder being shipped over the next 20 years or so.
Perhaps there won't be enough new auto production to justify exporting to them. Or we'll embargo same. Or we'll send teams of engineers to build PV plants so they can wean themselves off fuel oil and NG for electrical production.
"Someone’s laughing, Lord, kumbaya
Someone’s laughing, Lord, kumbaya
Someone’s laughing, Lord, kumbaya
O Lord, kumbaya"
Dude,
I guess they sing that song at every kind of touchy feely youth group meeting in the entire English speaking world.
If anybody is interested I posted some thoughts today on the future of the auto here in the US in a near dead thread (three days old) and thus out of the way,under the natural gas reserves article.
@Polytropos 17 Aug, 6:57pm
I think the important factor here is whether OPEC economies can continue to grow (and so their oil consumption) if the economic situation continues to deteriorate due to a much more severe oil shock (or financial system shock). It could be that the feedback effect on their economies because of the worsening climate in OECD economies (or BRIC countries maybe also) leads to lower oil consumption there as well, much like a couple of months ago. If that is the case the ELM becomes too pessimistic because it does not take into account feedback loops through the economic system. I do not have the answer at the moment although I do expect to investigate this in the near to mid term future.
West Texas
could you post the full formula for ELM? I'd like to play around with it
what I want to do is treat all of OPEC as a single country, with the following variations in assumptions in the data:
C/P = 20% or 30%
RCC = 6%
Decline rate = 5% or decline rate = 3%
the closest I came in your previous posts was
(3) C/P = 25%, RCC = +2.5%/year; Net Exports go to zero in 19 years, with an 18 year decline rate of -22%/year
just as the north sea and Texas have a large number of fields which smooth out in aggregate, OPEC probably will too
thanks
Bill
The ELM is just a simple model. I proposed it to help me understand Net Export Math. My assumptions were: (1) Consumption = 50% of production at final peak; (2) Production decline rate of -5%/year and (3) Consumption rate of increase of +2.5%/year. Of these three factors, consumption as a percentage of production at final peak has the biggest impact on how fast the net exporter approaches zero net oil exports, assuming a production decline. Of course, you have to use exponential/natural log functions. BTW, you can use the Rule of 72 to do some easy, quick What If's, e.g., at a -5%/year production decline rate, with no increase in consumption, production in Export Land would equal consumption in 14 years (72 divided by 5). At a +6%/year rate of increase in consumption, Saudi consumption would double every 12 years, hitting about 9 mbpd around 2030.
Three observations, based on the model: (1) The net export decline rate tends to exceed the production decline rate (see 21 examples above); (2) The net export decline rate tends to accelerate with time (see four former net oil exporters, all four showed an accelerating net export decline rate) and (3) The bulk of post peak cumulative net oil exports (CNOE) are shipped early in the decline phase, e.g., Indonesia shipped 44% of post-peak CNOE only two years after their final production peak in 1996.
To illustrate:
http://www.businessweek.com/ap/financialnews/D99L6U903.htm
Note that you also have to figure in the imports of refined products, but Mexico's post-peak (post-2004) numbers are actually quite close to the ELM. Here are the production peak + four year numbers for the ELM (consumption = 50% of production at final peak) and for Mexico (consumption = 52% of production at final peak):
ELM
Production Decline Rate: -5%/year
Consumption: +2.5%/year
Net Export Decline Rate: -15.9%/year*
Mexico (EIA)
Production Decline Rate: -4.7%/year
Consumption: +1.3%/year
Net Export Decline Rate: -13.5%/year
*If "Export Land's" post-peak consumption rate of increase was the same as Mexico's, +1.3%/year, their net export decline rate would have been -13.4%/year.
Note that Mexico's production decline rate, year over year, in 2005 was -1.7%/year, with a net export decline rate of -7.6%/year, and their 2008 year over year production decline rate was -9.4%/year, with a -24.4%/year net export decline rate--otherwise known as an accelerating net export decline rate.
The comparable year over year numbers for the ELM were -5%/year (prod.) and -13.3%/year (net exports) for Year One and -5%/year and -18.9%/year for Year Four.
Here's a chart I just cooked up - always trying to find novel ways of looking at these matters.
Mexico's consumption is shown as negative on the Y axis; notice how it grows apace even when production is flat, and how the net available is unmistakably going down. This leaves out much of the picture, of course, but if anything Mexico's reliance on importing product will just exacerbate their problems.
And of course you can look at regions instead of countries; this is the percentage change year-to-year in consumption for the various macro areas listed in the BP Review:
The balance sheet is tipped almost wholly into the positive when you look at it from this angle. In fact about the only years where the drops in consumption were ahead of the gains were 1975 and 1980, just eyeballing my chart - I don't really think it's necessary to actually check the numbers, however.
I'm wondering about the following problem that I'll call the Import Land Model:
What if Mexico or some other country that has peaked eventually starts to import oil, so much oil that they use a quarter of all the oil in the world and 44% of refined gasoline even though their population is a very small fraction of world population. What would such a scenario mean for the rest of the world? What if a number of countries took this route?
The economies of countries that export crude oil tend to be dependent on the revenue from the sales. As their exports approach zero and switch to imports their economies suffer causing demand destruction preventing them from becoming huge importers.
Sorry if I was too cryptic here.
What I was describing was the export/import history of the US. And yes, our economy is suffering and will suffer more, but it took a good long while after our peak.
The main point is that US use (which is mostly stupid misuse on ridiculously larger cars...) dwarfs any pain that any single exporter could cause.
As important as ELM is, we shouldn't forget that the US is a huge part of the global problem.
Unless, of course, the main problem is how "our oil ended up under their sand."
Hi there,
I have something going through my mind about spare capacity. Perhaps, a basic enquiry. If many of the big producers had a considerable spare capacity from 2003 to 2008, why there was no significant increase in crude production throughout that time? I assume since there was a huge global economic growth during this span of time so it was necessary this crude oil increment. What are the reason/s that could make hard the use of this spare capacity?
Thank you for your help.
It is hard to use spare capacity that does not exist. Between 2005 and the middle of 2008, OPEC appeared to have little if any effective spare capacity. OPEC had "stated" (based on their statements) spare capacity, which was shown not to be true as they were unable to increase production in the face of rocketing prices.
Good comments! Over the past few days, I have been re-reading Ghawar related keyposts + postings back in 2007 around the date of my discovery of the ARAMCO oil-sat graphic [April 6, 2007 4:51 AM]:
http://www.theoildrum.com/node/2437
As most here know: the TopTODers generated much material and discussion from my discovery posting, especially SS, Euan, and F_F. I believe Euan, in another posting during this 2007 timeframe, said his estimation was that Ghawar was losing a layer roughly every 21 months. Recall that crude was much cheaper in 2007 than in July 2008. I think it would be fascinating if, taking the info we have now in 2009: try to re-extrapolate this 2004 graphic to what it might look like in 2009 or 2010.
To be fair, Saudi oil Minister Al-Naimi repeatedly said that he did not understand the run-up in prices, because the Saudis did not have refiners knocking on the door begging for more oil - quite the contrary.
So the Minister did not see any reason to use the Saudi "spare capacity," assuming that it does exist.
It could be that the Saudi production is related to "wet barrel" demand, and the price is related to "paper barrel" demand. There have been several articles in the mainstream media detailing the huge growth in oil futures trading over the 1999-2008 period.
I'm sure that he is correct. There was less demand for oil at higher oil prices, versus lower prices. What we know, based on EIA data, is that as US oil prices rose from $57 in 2005 to $100 in 2008 (average annual), the Saudis exported less oil. If they had maintained their 2005 net export rate they would have (net) exported 10.0 Gb from 2006 to 2008 inclusive. They actually (net) exported 9.1 Gb.
Westtexas,
Now we are GETTING SOMEWHERE in regard to finding out for sure whether the speculators /traders were responsible for most of the price run up if you can answer couple of questions.
How much of the saudi production from 2005 to 2008 was contracted ahead at fixed orices that were honored?How much did they sell on the spot market?
In other words how much of the gravy was captured by the traders/speculators and how much of it wound up in the pockets of the producers?Both OPEC and others?
And does any one have any real idea what portion of the trading and speculating are done by people also seriously involved in the in the producing and refining sectors?
Of course these questions may be,probably are impossible to answer?
Hi Mac,
I'm also trying to understand the real issues with so-called speculation. Was it a 5% factor in the $147 price or was it a 60% factor as some folks claim?
As I now understand (and still looking for enlightenment) there are several variations of "speculation". The most common is simply from companies trying to lock in prices several months ahead so that they can operate their business with some cost stability. At the other extreme are hedge fund types of players that are "betting" on derivatives that are far removed from productive use of oil but can exert pressure on prices.
But, it also seems that this view is a bit simplistic. Small retail investors cannot (as I understand) move prices by either long or short positions - they just don't have enough clout even in the aggregate - regardless of how much "speculation" they have in their hearts. Real price manipulation requires really big bucks and a very deliberate and well planned operation (enough money to overcome normal supply and demand pricing). First, a massive amount of money to bid the prices up and then, a insighter driven timing strategy to short the commodity. And, finally a repurchase at fire sale prices. This is a highly criminal scenario - a scenario, if actually revealed and documented, would have profound consequences.
Lots of people believe in this type of conspiracy and yet I'm not aware of any legal action against and person or group for doing this.
As I said, I'm far from being an expert on this subject. But, it comes up all the time as the "reason" for the $147 price. Of course, the follow-on then is to craft some kind of government regulation to prevent this criminal activity. I'm all for more regulation of certain financial activities but I also would like to know if a given regulation is really addressing an actual understanding of a problem. In this case, if 95% of the problem was a level of demand that reduced spare capacity to a marginal level, then regulation of "speculation" would be misguided. Instead we should craft regulations designed to encourage efficiency and conservation.
The current bull market in oil prices really started in 1999, as oil prices rose at about +20%/year as prices rose from $14 in 1998 to $100 in 2008. The fastest annual rate of increase was 2000, not 2008.
Regarding the increase in US annual oil prices from $57 in 2005 to $100 in 2008, IMO the primary driver was importers bidding for declining net oil exports, relative to the 2005 rate. I suspect that the decline in net oil exports will outpace the decline in demand next year, resulting in 2010 average annual prices exceeding the 2009 price, as the bidding war for declining net oil exports resumes.
US average annual oil prices (vertical scale) versus top five net oil exports (horizontal scale):
Texas,Dave,
Everything you guys say makes sense to me.WTyour net exports per day graph seems to say every thing that needs to be said about the rising prices.This is the first clearcut data I have seen that can explain the oil price run up in a single graph by relying on freshman year econ.
Now I have but one real question left.Who pocketed the windfall money,the producers or the speculators/traders?
Or did a dozen different middle men plus the tax man split it?
It would seem that so much money would show up loud and clear on someone's books.We're not talking about a few kilos of cocaine,this is the kind of money that really ought to be expressed in scientific notation.
Assuming no hedging, the producers received the proceeds from the sale of oil as oil prices rose at about +20%/year from 1998 to 2008. Regarding the paper market, one's profits, or losses, would be a function of the trades that one made.
Note that many US natural gas (NG) producers are benefitting from speculators who took the opposite sides of the trade regarding NG prices. This was also true for oil producers as oil prices started weakening last year. A friend of mine in Midland locked in $100 for oil until July of this year.
WT,
Your "assuming no hedging" also makes perfect sense,but it leaves YET ANOTHER QUESTION (entering my second childhood ?!).Obviously anyone,producer user)or who contracts ahead at a time of steadily rising prices either gains or loses unless the offsetting paper trade is made.
If KSA contracts sales ahead for a year w/o hedging the sale,and honors the contract,they lose the gravy.If they contract and do hedge,they STILL lose the rising prices gravy,but they are protected on the downside.Real users are in he same boat-a hedge can gaurantee thier cost of supply at the risk of losing out on FALLING PRICES.
So how far ahead can you hedge in oil,and who owns the LIONS SHARE of the contracts?
It has always seemed to me that it would be impossible for a bunch of mangy hyena bankers /brokers/SPECULATORS to steal VERY MUCH of the oil elephant from a pride of lions opec/multinationals/smaller producers with thier own distribution,etc.
But even though this has been my gut feeling,I have been uncertain until now because SO MANY apparenty knowledgeable/aothoratative people seem to believe the hyenas have been eating a LOT of elephant.
Not many peasants or outcasts living in the briars and weeds have ever managed to steal very much from their overlords.
Obviously we now live in a world where most commentators knowledgeable or not are willing to say just about anything(so long as it can't be clearly and immediately disproven to thier discredit)that advances thier agenda .And if oil were as plentiful as agendas ,it would be free except for the costs of delivery.
I'm no expert at futures markets, but it is my understanding that it is a zero sum game, with the winners offset by the losers, with the "house" getting a cut of each transaction. So, by definition, if a producer is hedging, someone is on the opposite side of that trade.
A natural pair of offsetting hedgers would be Southwest Airlines and an oil producer. Of course a third group would be speculators who are neither large refined product consumers nor oil producers.
Hi,
This is one great post. Yes, it makes a lot of sense to me too. If the things go right, it will be a good knowledge earning.
__________________
golf clubs custom built & online custom fit golf clubs
Westexas
Feedback loops, if I take Rembrandt's earlier point, can modify historical trends?
'The Saudis' have it seems 2 opportunities for gain:
1) where 'they' achieve maximized net revenue from exported oil, which results in some useful trickle-down needed to underpin an increasingly expensive population,
2) where they make 'cheap'(?) oil products available within SA itself. The latter (2) has been an increasing trend historically, apparently.
Increasing per unit Revenue from exports has taken a hike from 2000, with a spike last year. A third feed-back loop might be identified (3), the cost of continuing forward investment in oil production and/or oil product processing, and this depends on current and assumed later revenue streams.
Can we identify where the balance of incentives is (has been) or will be? SA needs customers for exports in order to keep a satisfactory 'profit margin' and revenue stream. Will 'cheap home-fuel' for among other things electricity production and de-salination, continue to trump the need for revenue acquisition from customers?
If anything, I suspect that feedback loops will tend to make the ELM effect worse, as many exporters see rising cash flow from oil export sales, despite declining volumes, at least in what I call Phase One of the decline (in Phase Two, the cash flow from export sales fall, as higher oil prices are no longer sufficient to offset the decline in volume). And contrary to what many of us expected, many developing countries have shown rising oil consumption in response to oil prices rising at +20%/year from 1998 to 2008, even as US oil consumption in 2008 fell back to our 1999 level. This does not bode well for oil consumption in developing oil exporting countries.
In any case, what I found fascinating is that 20 oil exporters that showed production declines showed the same pattern--the net export decline rate exceeded the production decline rate. And China, with increasing production, showed an accelerating net export decline rate, as they headed toward net importer status.
Other possible explanations of why OPEC's listed spare capacity was not utilized:
1. It could have been heavy crude while there were insufficient refineries to handle it, or the seller put too high of a price on it.
2. It could have been sour crude which no one wanted or had the ability to refine.
3. I have read somewhere here on TOD that Saudi Arabia manages their oilfields by periodically shutting down (resting) some of their oil wells which increase the total amount of oil that can be extracted. The potential flow rates from the resting wells may be included in the spare capacity.
I'm looking for a "Peak Oil for Dummies" type of presentation. Something that really presents a strong convincing argument in 10 minutes or less if in video form. Or with lots of pretty graphs if in blog form.
Here's a list of video's to get you started.
If you are looking for lots of detailed graphs & discussion:
Gail's Peak Oil Overview and Sam's Peak Oil Update [both found in the clickable section of the top banner of TOD]:
http://www.theoildrum.com/tag/overview
http://www.theoildrum.com/tag/update
For a total 'newbie', IMO, Matt Savinar's LATOC front page is pretty good, too:
http://lifeaftertheoilcrash.net/Index.html
------------------------
Are we 'running out"? I thought there was forty years of the stuff left...
------------------------