| Alcatraz: the TOD-ASPO gathering | The Oil Drum: Europe | High altitude wind power: an era of abundance? |
Encircling the peak of world oil production - an evaluation
Posted by Euan Mearns on July 6, 2009 - 10:02am in The Oil Drum: Europe

In a recent post Nate brought to our attention the work of Richard Duncan and Walter Youngquist published in 1999 in a paper called Encircling the Peak of World Oil Production. In 2007 I performed a simple analysis of the reliability of their forecasts for 26 countries (out of 42 country forecasts that were published) that were checked against what had actually come to pass as documented in the BP statistical review of world energy. The results are shown above. The sum of the differences is -7 years which on average is -0.3 years per country.
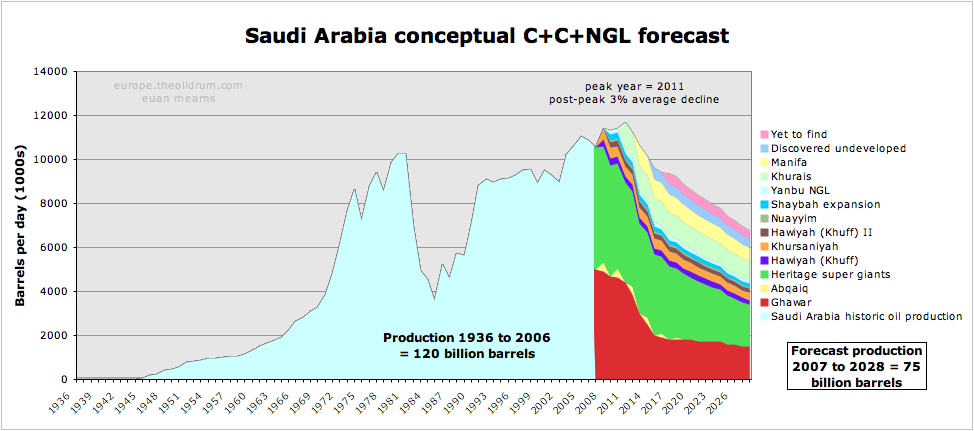
At the ASPO conference in Houston, October 2007, I gave a presentation on Saudi Oil reserves and a production forecast that was born out of several posts by Stuart Staniford, myself and others which are linked at the end of this article. In my talk (which can be found here on the ASPO server) I presented the forecast shown below and afterwards an elderly gentleman who I did not know at that time, was keen to show me a paper that he and Richard Duncan had published some 8 years earlier that was titled "Encircling the peak of World Oil Production". The gentleman, who I would later learn was Walter Youngquist wanted to show me that their forecast for peak Saudi oil production was 2011, the same date which I had determined from a rather different approach.
On my way home, sitting on the plane sipping the first of many G&Ts I read the paper and realised that the reliability of Duncan and Younquist's forecasts could be tested. Eight years had passed since their forecasts were made and it was possible to verify their forecasts with what had actually come to pass. I just happened to have a copy of the 2007 BP statistical review on my lap top and so I set to work.
Duncan and Youngquist list 42 countries representing 98% of global production in Table 1. Of those, 8 countries were already past peak at the time the paper was written and a further 5 countries were forecast to peak some time after 2007 (the year I first looked at this data), those being Brazil, Iraq, Kuwait, Saudi Arabia and the UAE. A further 3 countries are not listed by BP leaving a group of 26 countries that were forecast to peak between 1999 and 2007. I have just updated this exercise using the 2009 statistical review.
I compared Duncan and Youngquists's forecast date with actual peak dates for individual countries. The distribution of these differences are shown in the chart up top. Once I had sorted the data I realised the most significant point was the rough normal distribution and that countries that had been "overestimated" were balanced by countries where an "underestimate" had been made. Summing the differences yields a value of -7 years when averaged for the 26 countries yields -0.3 years or - 4 months per country forecast. Weighting the countries for annual production reduces this bias further. This is a remarkable achievement. Their methodology is as follows:
The software ("tool") used for the conclusions expressed in this paper, we have termed the "World Oil Forecasting Program" which consists of two distinct, stand-alone models for each nation.
The Numeric Forecasting Model
The first model ("N model") is quantitative, using production data and mathematics on a translated coordinate system to produce an intermediate "helper" forecast for each nation. This, the so-called "guide" forecast ("G forecast"), is a purely mechanical prediction of future production. In some examples, the G forecast can provide useful information about the shape of future oil production by providing a lower boundary on the estimated ultimate recovery (EUR) and the probable shape of the future production curve. However, in other circumstances, it is not useful, as in the situation of the OPEC production quota-limited countries. The N model produces the G forecast, the best forecast we are able to make based solely on historic production data, and mathematics. Data are from British Petroleum (1968-1997) and Campbell (1991). Details are in Duncan (1996).
The guide forecast is just one of many items of information that may be used in the second model portion of the World Oil Forecasting Program.
The Heuristic Forecasting Model
By definition, "heuristic" denotes a method of solving a problem for which no algorithm exists. It involves trial and error, as in iteration. In this discussion heuristic knowledge indicates "soft," "qualitative," or "judgmental" knowledge. Although judgmental knowledge is lacking in the Numeric model, it is crucial for oil forecasting in the heuristic model ("H model"). The H model provides the user with a powerful interface for oil forecasting, chief of which is a three-curve graph for each nation with years 1960 to 2040 on the x axis, and production on the y axis (Fig. 1. Curve 1 shows the historic data from 1960 through 1996 —a crucial reference for forecasting. Curve 2 shows the guide forecast (previously discussed) and is useful as the lower bound curve. Curves 1 and 2 are important forecasting aids, but they are only the beginning.
Curve 3 also displays the historic data from 1960 through 1996, but this time the data serve as a base for a new and better forecast 1997 through 2040. A so-called graphical input device (GID) makes it easy to enter and run different trial forecasts. After each trial run, a different estimated ultimate recovery (EUR) value is displayed so, after making several runs, the user can select an upper-bound curve for each nation. Thus, now confined by lower and upper curves, and further modified by judgmental input, the user extends the most recent production trend seamlessly into the curve extending through the year 2040, providing what we termed the "judgmental" forecast (J forecast) of future oil production, one nation at a time. Details of the heuristic model are in Duncan (1997).
In our 42-nation study, we also have grouped the nations into seven regions (Figs. 2-8 and Table 2), and made a world summary (Fig. 1 and Table 1), which are the output of the heuristic model."
Anyone who has ever attempted to forecast oil or gas production will know that the minute the forecast is published you think of something you missed or a better way to do it. It is not an easy task working with numerous, often poorly constrained variables. Duncan and Younquist did make some mistakes, notably Qatar where I imagine they underestimated natural gas liquid production from the North Field and Tunisia where they anticipated a second peak in 2009, that did materialise in 2007 but failed to exceed the earlier peak of 1980. The important thing is that the errors are not biased.
To the 5 countries forecast to peak beyond 2008 that are listed above we have to add Angola, Qatar and China which set records in 2008 and which may yet have a future peak date This on-going uncertainty is not incorporated in the analysis of Duncan and Younquist's forecasts where the difference recorded is that between their forecast dates and 2008.
Duncan and Youngquist forecast that world oil production would peak at 30.64 Gb/ annum in 2007 translating to 83.95 mmbpd. According to BP, 2007 production was 81.44 mmbpd that was exceeded by 81.82 mmbpd in 2008. It is of course premature to call 2008 as peak year although I am increasingly skeptical that the 2008 production will ever be exceed. If Duncan and Youngquist's unbiased accuracy follows through to Brazil and the 4 big gulf producers - Iraq, Kuwait, Saudi Arabia and the UAE, then this will underpin their 2007 peak oil forecast, reinforcing the view that 2008 saw the passing of peak oil.
Duncan and Younquist told us 10 years ago that peak oil will be buried in a bumpy plateau and that a number of years must pass before it will be evident from declining production that peak has indeed passed. The exact timing is unimportant. The important thing is the knowledge that we are within the plateau and that some scientists do understand the above and below ground factors leading to peak and that their warnings of decline past peak and its consequences should not be ignored.
For new readers, here is a list of Oil Drum Articles on Saudi Arabia and Ghawar as of August 2007.
by Stuart Staniford
- Saudi Arabia and Gas Prices
- Depletion Levels in Ghawar
- The Status of North Ghawar
- Further Saudi Arabia Discussions
- Water in the Gas Tank
- A Nosedive Toward the Desert
- Saudi Arabian oil declines 8% in 2006
by Euan Mearns
- Ghawar reserves update and revisions (1)
- GHAWAR: an estimate of remaining oil reserves and production decline (Part 2 - results)
- GHAWAR: an estimate of remaining oil reserves and production decline (Part 1 - background and methodology)
- Saudi production laid bare
- Saudi Arabia and that $1000 bet
by Heading Out
- Simple mathematics - The Saudi reserves, GOSPs and water injection
- Of Oil Supply trains and a thought on Ain Dar
by Ace
Personnel
Editors
Contributors
Peak Oil Primers
Archives
- November 2010 (3)
- October 2010 (6)
- September 2010 (4)
- August 2010 (7)
- July 2010 (6)
- June 2010 (7)
- May 2010 (2)
- April 2010 (8)
- March 2010 (4)
- February 2010 (6)
- January 2010 (3)
- December 2009 (5)
- November 2009 (8)
- October 2009 (12)
- September 2009 (6)
- August 2009 (5)
- July 2009 (11)
- June 2009 (8)
- May 2009 (16)
- April 2009 (10)
- March 2009 (7)
- February 2009 (10)
- January 2009 (15)
- December 2008 (9)
- November 2008 (9)
- October 2008 (9)
- September 2008 (13)
- August 2008 (10)
- July 2008 (14)
- June 2008 (23)
- May 2008 (16)
- April 2008 (12)
- March 2008 (16)
- February 2008 (9)
- January 2008 (13)
- December 2007 (13)
- November 2007 (16)
- October 2007 (22)
- September 2007 (8)
- August 2007 (9)
- July 2007 (16)
- June 2007 (8)
- May 2007 (7)
- April 2007 (7)
- March 2007 (10)
- February 2007 (10)
- January 2007 (12)
- December 2006 (9)
- November 2006 (15)
- October 2006 (4)
- September 2006 (5)
- August 2006 (5)
- July 2006 (9)
- June 2006 (5)
- May 2006 (10)
- April 2006 (9)
- March 2006 (13)
Vital Trivia
License

This work is licensed under a Creative Commons Attribution-Share Alike 3.0 United States License.
Is there a way to see what IEA/EIA/CERA were forecasting for those countries/world for 2007-8 back in 1998-9?
Impressed how close they got with heuristics. The general problem with heuristics is that if you are right, no one can understand why the algorithm worked; yet if you are wrong, no one can understand why the algorithm failed.
reminds me of Efficient Markets hypothesis. The finance professors claimed that markets were semi-strong form efficient, but couldn't explain why some managers made 20%+ per annum both in and out of sample - 'skill' exists but there are few ways to differentiate it from luck (in the short term).
(Note: I am 100% certain that high alpha, long term, market algorithms exist - as to oil forecasts I am not sure, other than to say that conventional methods are all based on faulty assumptions, among them: perfect substitutes, marginal price predicts scarcity, exponential growth, dollar vs natural resource pricing, exclusion of externalities, etc.)
They did it the old-fashioned way. They stole it.
Which fits in with most economic models, which have little basis in theory.
On the other hand, a real theory like Dispersive Discovery stems from significant first-principles considerations. This uses what I consider a novel mathematical formulation which has much broader generality to disordered systems.
http://mobjectivist.blogspot.com/2009/06/dispersive-transport.html
The real problem with all these deterministic formulations that Duncan and many economists use is that they don't consider the long-tails of disorder.
The key to theory is that the theory can be tested in a controlled environment. Unfortunately, we lack an oil depletion control to truly test out the real theories, so it comes down to a matter of who has the most convincing argument or whose intuition you trust the most.
I disagree. Pattern recognition of market behavior shows leptokurtic (to the left) distributions when humans act in large groups. There ARE long tails of disorder in the markets, which create great opportunities for some (and this concept backtests all the way to when tick data began - up markets down markets etc). Small moves are mean reverting and large moves tend to persist - this is based on a consistent, first principle prevalence in humans for emotion to dominate rationality in the short run in situations that aggregate collective behaviour (financial markets are perfect proving ground). This is too short term to be based on any fundamental economic theory - which in long term those are all faulty anyhow -this is more based on human behavior. Oil is similar -which is why I disagree with your dismissal of Verhulst equation being applied to oil - 20th century humanity has behaved like a superorganism, and many more aspects than just geology at work. Unfortunately, Mr. Duncan is not responding to my emails at moment (I can understand why) otherwise I would ask him for a more detailed explanation of his heuristic model.
A few more comments a) he and I have our real names out here and you don't, so that is a problem in itself (any 'model' attached to an anonymous person has no personal reputation risk or accountability -i.e. if dispersive discovery turned out to be totally false, you could create a new login ZebBubbleMicroscope and design an anti-dispersive loglet model - no one would know it was same person). b)side note - dispersive discovery has an embedded error in that the small fields found early on were found by accident (we weren't looking for them, c)people with the best models are unlikely to share them with the public, unless it is a 'gift' or some marketing trap. (I've seen far more of latter). All Euan was trying to do here is what any good analyst would attempt - a paper, with data and predictions was made 10 years ago and he wanted to see the results and residuals. His brief essay above is only one data point in any case. Not like Duncan predicted the end of world or anything....;-)
Here we agree. And I trust Duncan/Campbell/Laherrere, etc. more than IEA/EIA or anyone with an economist at helm. (But I trust my own heuristics overlayed on other peoples heuristics even more.)Just to be clear, there will NEVER be a model to test oil depletion that is acceptably sound until it is much too late to do anything about its conclusions. That is achilles heel of science - it works great when it has decades to percolate, hypothesize, test, retest, repeat, etc. but when events change fast we are going to, in very real ways, make decisions using heuristics. This is the way it has always been and I don't see any indications of it changing.
Don't get me wrong WHT - you are brilliant mathematician and provide insight to an important aspect of our problem - modeling depletion -but sometimes everything of salience, even with oil, can't be parsed into math. We now have demand/environment/credit/non-energy input/social equity issues overlayed on top of geology, forever...very tough to model without huge error bands.
The key to outperforming in the "markets" is all about taking a lot of bets and making sure that you cut loses. You have spent some of your professional life in this arena...............so have I. The markets are anything but science in my experienced opinion. Ride winners and cut losers.
I have a base philosophy that I teach young traders and it is simple.
Most trades don't work. This could be applied to most things in this life.
This indeed may be the case but if it is it will be because OPEC has everyone in the dark concerning their ability to increase production. Non-OPEC currently produces about 58% of the world's oil and they have clearly peaked, though that is not obvious to everyone. Non-OPEC, C+C, peaked in 2004 and the average production last year was 773,000 barrels per day below the 2004 average. There was a slight surge in non-OPEC production in February and March of this year, brought on primarily by Azerbaijan fixing their gas leak problems and new production from the US Gulf of Mexico.
However US production has dropped by over 200,000 bpd in the last few weeks and Norway, in May, produced less oil than in any month since well before they peaked in 2001. The downward non-OPEC trend, interrupted slightly in February and March, has clearly continued though in March, the peak so far month this year, was still 666,000 barrels per day below the previous high non-OPEC month of December 2003.
I believe that in less than one year it will be obvious to everyone except the most deranged cornucopians that non-OPEC oil production has peaked. That will leave only OPEC to cast doubt on whether or not the world has peaked.
Note: All the above figures are crude + condensate only.
Ron P.
Ron- I am in general agreement with you. I also am quite sure that if you are correct, that the 'deranged cornucopians' will NOT admit to non-OPEC peak supply because it will be due to peak demand, or Iran, or those pesky kids, whatever.... I often wonder at what point (how many years after data show peak) reasonable people would agree that, in fact, a region, world, etc. has peaked? Because mathematically the future is always ahead of you. I don't know when people finally admitted that US peaked in 1970 - and probably still some don't think that is case..
(I wonder how many in oil industry know that world onshore oil production peaked in 1982? I didn't know that until this year)
I predict that Newt Gingrich will run for President in the upcoming cycle, and a key part of his platform will be his plan to guide US oil production back to the previous highs. He will use two arguments. First, he'll explain that the decline in US oil production was a multi-decade policy failure in which we "outsourced our oil demand along with everything else." He'll make a broader point that across the globe many production profiles are the result of policy, not geology. If he's feeling especially frisky, he may even use examples like Russia, or even Nigeria and Venezuela. His second argument will be a deployment of an argumentum ad ignorantiam strategy. He will cite USGS total OOIP estimates for "everything within our control." He will then go on to jackhammer away at the idea that we "just don't know how much we'll discover, once we start." My guess is that, bar an Orlovian Slope of Dysfunction outcome fully in play, two years from now, that this strategy will play quite well with the public. After all, argumentum ad ignorantiam was already used to great success in the rationale for the Iraq War vis a vis "Saddam's WMD".
Newt will understand also that he won't be proven incorrect, even while in office, given extraction timelines. That is of course holy grail stuff in political math: being able to sell that which you you will only be expected to partially deliver.
I'm very excited about the 2012 election. In the background I expect MX exports to be pretty close to zero, for total North American crude oil production to have fallen well below 10 Mb/day, and for a discussion of selected peaks in other countries to be underway. That will be a fertile environment for political "sales." Especially when you consider that the current administration has decided to solve the liquid fuels problem via a massive new investment in car companies, roads, cars, and biofuels and also by addressing emissions from the power grid. Fun times.
G
Nate -- A few (management mostly) in the industry have always understood the declining status of the big picture of US declining reserves. I can promise that the vast majority at the technical level have had little interest in the exact numbers. I can include myself in that group for the most part. Not that we don't understand the production base but we just didn't and still don't care. You can imagine that if you were tasked with finding new oil/NG reserves for the last 25 years or so it would pretty difficult to escape the obvious. Easily 90% of us are focused on the small game...the day to day effort. Not that we don't understand the big picture but it has no bearing to us on the immediate goal: add reserves in a cost effective manner.
One somewhat annoying set of comments on TOD regards what "the industry knows", what the "industry does", what the "industry conspires", what the "industry is planning", etc, etc. The "industry" doesn't engage in any of these activities. The industry doesn't do anything. I understand it's convenient to use such collective terminology in our conversation but it tends to grossly misrepresent what I witness daily. It's no different then when someone characterizes TOD as a group that thinks this way or believes one way or the other. At worse such usage offers a basis for positions which are far from realistic. The simplest example is the focus on the press releases of the management of public oil companies. Many here understand the true purpose of those statements: say whatever is legal in order to pump up enthusiasm for the company's stock. It is not to educate folks on the real nature of PO. Unfortunately, many folks believe these words represent what the "industry thinks or believes". Such beliefs only cloud the discussions. I do appreciate the skeptical attitude many view the statement from industry insiders. Some are, at best, misleading while others are outright dishonest. But lumping us all together as the "industry" will cause the loss of valuable insight. Not a really serious rant but something to bear in mind as we forward and are increasing bombarded by what the “industry” has to say.
Understood.
In the end it is about how wide a lens one uses - people in 'the industry' use a very narrow lens - they are paid to.
Summer maintenance of aging infrastructure.
People will "agree" when shortages appear, sans reasonable explanation from pols etc. Your average Tom Dick and Harry doesn't care about the decline in LSC - they don't know what it is, or what it portends; if they do they feel assured that the oil companies are on the job, even though they have a vague disgust for them. On the other wing of the political spectrum people believe Al Gore's promises that we can simply replace all FF usage in 10 years if pushed/so inclined. This is all crude mythologizing instead of anything approaching reasonable analysis, and it's all we'll get right up to the end.
On declines: I found this article in the January 2002 edition of the AAPG's Explorer bulletin, by Steven A. Pfiefer, a Merril Lynch analyst: 2002 Outlook Brighter Interesting chart of natural decline rates - eyeballing it the median appears close to 9%, just as the IEA concluded last year.
I don't think there will ever exist broad consensus that peak oil is real. Consensus is not rational - it is manufactured to suit temporary propaganda needs of elites. A rational understanding of peak oil does not serve these needs. It is instead necessary for scapegoats to appear, so the anger of the masses can be efficiently turned against whoever can be destroyed for profit.
There is currently consensus among Republicans that America's energy problems are solved by drilling for oil in off-limits areas of America. This is of course ludicrous - American oil production peaked almost 40 years ago, and the off-limits areas contain only a year or two of supply at best, according to the USGS. Republicans are scapegoating enviro-whack-a-doos, who supposedly wrote these oil laws that stop America from being energy-independent? despite the fact that environmentalists have little power or money?
This consensus is clearly nonsense, and that is the intention. A nonsense consensus enables elites to exploit people and resources efficiently, because the facts of the matter can't even enter a debate.
Let's not single out the Republicans. Obama plans to install anti-missile defenses in Poland over objections from Russia, and claims that they are to defend Europe from Iran and North Korea.
The multi-billion dollar news industry never challenges this utter nonsense, and neither do Republicans. This is because it is not their job to investigate or challenge anything of importance.
Nay, nay, there are quite a few people who will never agree, as they will always find a "reasonable explanation".
Take for example the current financial crisis, which serves as a perfect "reasonable explanation" for the current oil output decline (although some, including the German federal bank Bundesbank realized that the crisis was triggered by the high oil price) - so just don't worry.
Perhaps you should read more of the the "bible of energy", as the IEA calls its World Energy 0utlook, to see that there will always be a "reasonable explanation" for shortages or high prices.
If people don't eat they aren't hungry enough.
Although the average decline of the data displayed in the AAPG's Explorer bulletin may be in line with current IEA data I am puzzled by a few data, for example the graph shows only 4% decline in Mexico, which is much less than the current GOM decline. Has this changed so much meanwhile or have the AAPG data turned out to be wrong?
Mexican production increased 5.69%
for 2003, vs. -9.05% for 2008; obviously at the time their fields were exhibiting anything but strong decline. For that matter at this stage even with Cantarell keeling over the overall field decline rate is less, and Cantarell's sharp drop was brought on by the EOR program coupled with bad management/lack of investment, factors which are in theory independent of natural decline, if I understand these terms correctly.
You could assay what Mexico's overall field decline rate is using the Pemex/SIE data: SIE :: Sistema de Información Energética. Incidentally, since translation tools don't work on this site, for those who can't read Spanish here is what you need to navigate to the field data:
>Información Estadística
>HIDROCARBUROS
>Petróleo crudo
>Producci¥n de petr¥leo crudo en campos seleccionados
="Production of petrleo crude in selected fields"
Actually only the most recent 3 months are available here - is there another section with archival data, or has someone been collating it?
Following is a link to my January, 2006 missive on the top three net oil exporters, which accounted for about 40% of total world net oil exports in 2005. This missive really marked the start of my collaboration with Sam Foucher.
While I think that 2005 was probably the final Saudi production peak, I could of course be wrong, but it looks increasingly likely that their net exports will never again exceed their 2005 rate of 9.1 mbpd (their 2008 rate was 8.4 mbpd, EIA Total Liquids).
http://www.theoildrum.com/story/2006/1/27/14471/5832
Hubbert Linearizaton Analysis of the Top Three Net Oil Exporters (January, 2006)
Annual net oil exports by the 2005 top three net oil exporters, Saudi Arabia, Russia, Norway (EIA, Gb):
2002: 5.57
2003: 6.28
2004: 6.61
2005: 6.80
2006: 6.57
2007 6.35
2008: 6.40
Note that if the top three had maintained their 2002 to 2005 rate of increase in net exports out to 2008, they would have (net) exported 8.3 Gb in 2008, versus their actual rate of 6.4.
In any case, these net export declines are very much front-end loaded, with the bulk of net exports being shipped early in the decline phase. For example, using 1996 as the final production peak for Indonesia, their net exports in 1998 were only down by 9% from the 1996 rate (and up over their 1997 rate), but by the end of 1998 they had shipped 44% of post-1996 cumulative net oil exports.
Based on Sam's modeling, the (2005) top three net oil exporters have probably shipped 20% to 25% of their post-2005 cumulative net oil exports in only three years (2006-2008, inclusive).
Thanks for reminding us that all this discussion about THE date of peak oil is just so much intellectual masturbation. Peak oil is not a single event, but a series of related events including but not limited to: declining production, declining exports, declining quality, declining investment...
Peak oil will be remembered as having occurred in and about the beginning of the third millennium of the common era.
I'm way more interested in the real body of the work. What's the decline rate. Even the EIA was "trial ballooning" 8 to 9 percent a year. [Selected fields, selected this and that, yeah, where some were clearly double that.]
Yeah, the date matters some. 8 or 9 percent starting in 2005 or 2009 or 2020 is/will be quite different. Me, I'm sticking with fall 2005 as the meaningful peak. Production seems to have been held on a plateau since then. Now, hold your breath and jump.
The decline rate is way more interesting than the point of peak oil.
cfm in Gray, ME
And sometimes its not reaching the goal or the objective that is interesting, but the journey.
I like to get an understanding but Duncan's non-rigorous and shoot-from-the-hip projections precludes that from happening. It almost seems like Duncan dashed out his oil depletion heuristics to get to his Oduvai analysis. I am much more interested in the former than the latter.
I think finances and distrust of other countries will have a big impact on the downslope. I don't expect it to look much like what one would expect from geology. I think July 2008 will be a fairly distinct marker as to the start, but there will probably be another big marker as finances deteriorate.
Absolutely. And I do not believe the global bell will be symmetrical, the downslope mirroring the ascent. The net energy curve is below the gross, and not symmetrical. Accelerated production in order to get an adequate IRR on increasingly expensive to develop fields also skews the bell. Hoarding and ELM come into play. Geopolitics and economics are also shaping the downslope. All in all, modelling the descent is going to be a lot trickier than modelling the ascent.
URR is not (just) what's in the ground, but what we can get out under the conditions prevailing. In the ascent one can safely predict more or less steady progress in ability to extract. But the descent could be very chaotic because the unwinding of the global economy could be chaotic. I don't think will get as much of the second trillion out as we think.
Hello Davebygolly,
Yep, I generally agree with your posting, but I think my 'Rogue Wave Theory' will make the FF-downslope Shark-fin even more problematic and time-condensed:
http://www.theoildrum.com/node/5482/512259
On semi-vacation rental house hunting so not much time.
But I'd like to add I think that we are now starting to see feedback loops effecting feedback loops starting to emerge. Thus second order effects are now growing.
We have the primary depletion and the economic responses as first order responses but these set up feedback loops at the social and political economic levels etc. These secondary and hard to define loops are now starting to interact with each other in complex ways. I.e rough waveish events become ever more probable.
This is just starting of course but we should see it build over the coming months with supposed above ground factors starting to come into play. And I say supposed because if you simply assumed plenty of cheap oil then none of them would be causing positive feedbacks to build. I think a lot of people miss that its the response to events which is driven by the underlying fundamental situation which is more important than the particular event itself.
And history buff knows wars are almost always started for the most inane reasons Pearl Harbor is the exception not the rule. But its the climate or system state if you will that allows events to act as triggers. We are going to start seeing a lot of triggers getting pulled over the next several months then years. What we don't know is the size of the bullet or explosion or what have you that results from this constant triggering. We can suspect that the trigger that actually initiates events and goes down in history will probably be something stupid but what will be missed are the repeated misfires if you will going on right now.
I doubt that wars are started for "inane reasons."
Fear of inadequate oil supply is real, not inane.
As any history buff knows, the ground leading up to war is carefully tilled by the elites, using whatever means of mass communication they have available and they deploy many "triggers". When war finally is ignited, the most proximal trigger (the Maine, Pearl Harbor, Gulf of Tonquin) is of course the one that is remembered as the "cause" of the war.
Amen.
Thats what I meant :)
The "reason" is not the real one the real ones that allow war to ignite are numerous and often span centuries. The match often purported to be the "cause" is just the match.
For Japan and the US for example colonial rivalry in the Pacific coupled with the weakening of the European powers from WWI played a big role in the eventual start of WWII.
This is important because the intrinsic relationship between Japan/China/Korea is historically unstable and regardless of current circumstances eventually this structural instability will assert itself esp with China and Japan now competing for oil. Everyone focuses on the US and misses the deep resource issues faced by these three nations. With the growing overcapacity in manufacturing the real problems of too many people and not enough resources will come to a head.
I think the decline will start, and outside TOD no one will pay attention, just another economic indicator.
The day everyone will pay attention will be the day a post peak major oil exporter stops exporting because they are looking out for their own country's future growth, and the cut in exports clearly drops supply below demand.
When gas has to be rationed, with no relief in site, it will be evident to everybody.
IMO there is plenty of oil in the world and producers will invest to produce it if it is profitable, the important variable is the ever increasing price of profitable production .
It is the demand that consumers can afford at the profitable price that causes world or country peaking - if we have no idea what the future price will be we can't possibly predict future demand and producers can't predict how much to invest to avoid making a loss or how much risk to take.
An individual oil well peaks due to geology, a field, country or the world peaks due to the amount of investment - since only profitable investment is acceptable.
The only statistics I trust are the price of petrol and my income - all other data like URR and monthly flows looks to be highly suspect and thus almost useless to get any meaningful information about the timing of peak flows, I think this is deliberately obscure.
I know how much I have to pay for gasoline - but even this the deceitful UK Government manages to fudge - in 1999 tax on petrol was around 83% of the price, in 2009 it's only 71%.
No wonder most UK people don't believe in peak oil since they don't look at the actual price of crude - according to the 'pound in their pocket' petrol has more or less been on a plateau for nearly 10 years now - so now I'm not surprised UK demand has been level for the same period - all is becoming clear, we are being 'manipulated'!
Now let me get this straight, individual oil well peak because of geology but lots of individual oil wells peak for different reasons altogether. I guess geology is not important if enough money is involved. Or it is the amount of wells that cancels out geology?
The US peaked in 1970 and has declined ever since in spite of massive amounts investment. It would have been very profitable for US production to have continued upward, yet that did not happen. And it did not happen because of geology.
The North Sea peaked in 1999 at 5,948,000 barrels per day. Last year, the year of the highest oil prices in history, the North Sea produced 3,881,000 barrels per day or 2,067,000 barrels per day less. More money simply could not squeeze more oil from under the North Sea in spite of record profits for every barrel that was produced.
Xeroid, your theory just makes no sense whatsoever.
Ron P.
Sorry, in my haste I missed out a vital word - the TIMING of the peak. It's the sum total investment in thousands of wells (at different flow rates and states of depletion) that causes world production to peak at any particular moment.
It is the timing of any world peak flow (whether it is the final peak or not it doesn't matter) that is of importance to me. The only guide we have to it's imminence is a rapidly escalating price, you can't reliably predict world peak any other way as there are too many variables.
Peaking of any non-renwable commodity, not just oil, is an undeniable fact it is not a theory. The rate at, and the timing of, the peak of extracting the oil in total is all about above ground human technology developments and investment decisions.
There is a huge risky delay of 5 years or more between last years prices (which have contributed to a fall in demand from a peak) and any extra flow rates caused by them from places like the North Sea.
It's clearly not possible to tell if this is the final peak or not, but it would be wise to assume it is.
Yes and no xeroid. Yes, if there is money to be made by drilling, above and beyond the cost of drilling, there will be more drilling. The big point of peak oil, this article indirectly though, is at what point can world production keep up with demand? If oil has indeed already peaked, then production will not keep up with demand and the price will skyrocket. The wheels will come off the need to transport anything and everything to keep the economy floating, and we will become localized in our purchases and crop production.
Also keep in mind, that the economy, national or international, has always relied on growth to maintain fiscal health. With depleting oil resources, economies will contract, which is recession and as depletion sharpens downward, it will lead to depression.
"It ain't necessarily so" to quote Sporting Life from Porgy and Bess. Low oil production combined with high prices knock the economy for a loop then prices plunge instead of skyrocketing. That is exactly what happened last year. Of course there were also other causes that caused the economy to crash, but oil prices were a major factor.
The point is that there is a point where the price of oil causes the economy to crash. People are laid off, less products are produced, and then the price of oil crashes also. Only, of course, to rise again but only to the point where it prevents the economy from recovering, then it can rise no further because of negative feedback. As prices go higher they pull down the economy driving them back down again.
Ron P.
Yes, but depletion marches on even with prices much less...we are not materially using less oil than a year ago.
A very keen observation. This allows us to apply perturbations to the models we have to show how depletion will play out in the near term. Most of the rather large perturbations in the 70's and early 80's were caused by huge efficiencies and waster-reducing measures we instituted. We no longer have this low-hanging fruit available to us, and we see a smaller adjustment than most people would imagine to occur.
WHT wrote:
We no longer have this low-hanging fruit available to us, and we see a smaller adjustment than most people would imagine to occur.
1. which "we"?
2. if we == North america, i call bullshit. The europeans use much less per capita than N.america, and they have perfectly reasonable lives filed with fun and colour. N.America could easily cut its consumption in half and still have a "first world" lifestyle.
i just spent most of june in a town in Switzerland where cars are banned, and all travel is on foot or by electric minibus (powered by hydro dam). I think there is LOTS of low-hanging fruit N. america can do to reduce their oil consumption.
Examples of low-hanging fruit from the 60's
-- spraying huge amounts of oil on roads and parking lots to keep down dust
-- heaters used in open air configurations
-- generally treating oil as if was water from the tap
You won't see this kind of reduction again. I agree that second-order reductions can be made. Yet, any reduction will be compensated via excess usage by China and other places.
WebHT,
We may not see as big a reduction in absolute MJ's but when your are already efficient, just a few MJ savings can be a large % in energy reduction. So new low hanging fruit will appear as fast as you pick them off(they will just be smaller).
Should see some. I am just trying to rationalize the huge negative shocks we saw the last time around. These were around -40%.
Can we duplicate this?
Looking at the last month that the EIA has for "Total Products Supplied", or better described as total petroleum products consumed, we find that in April we used 1,344,000 barrels or 6.8 percent less than April of last year and 2,065,000 barrels or 10 percent less less than April of two years ago.
So you are wrong in your assessment. We are materially using a lot less oil than we did a year ago. Yes depletion marches ever on but the higher the price of oil the less of the stuff we consume.
And the same is true for the rest of the world. Oil production is down 3 million barrels per day since last July so that has to mean the world is materially using 3 million barrels per day less.
U.S. Product Supplied of Crude Oil and Petroleum Products
Ron P.
This might have something to do with it as well...
U.S. Civilian Unemployment Rate
Past Trend Present Value & Future Projection
Percent Unemployed Seasonally Adjusted.
Hello Ron,
There has been stock builds of petroleum within OECD during the recent months which roughly amounts to 0,5 Mb/d. Further some stock build in China (strategic reserves).... and then there is the stories of tankers used for storage of crude oil and petroleum products.
Together this suggests that consumption is down by roughly an additional 1 Mb/d........so far.
I did not mean to nitpick. Honestly!
- Rune
I clearly define "materially" different than you, Ron, no?
Looked at another way, the drop in production you cite would have pushed off the date of peak by how long? Perhaps a couple years, maybe four on the outside? (Assuming the recent 1.6% yearly growth rate, if my memory serves.)
I'm interested in the bigger picture, and a few years is not material to me when considering the decline of our oil-fueled civilization, but I have no problem if it is material to you.
I have no idea how you define "materially". But I guess you are saying that we can use less oil but still not be using less oil materially. I really don't understand that but I will not argue with you.
I don't think the drop in production will delay the peak any amount. I will be extremely shocked if it was not 2008. At any rate the plateau was 2005 thru 2008.
Ron P.
It looks a bit like that may be happening again as we type.
Echoing Ron's point, there is a limit to what the world economy in its current configuration can afford to pay for oil as discussed here:
http://europe.theoildrum.com/node/5495
The only way prices can go higher (IMHO) is through dramatic shift in energy efficiency - producing more €£$ per joule consumed.
Euan,
I did some calculations on US data provided on EIA web site, regarding the assumption that other energy prices move with oil.In 1996( oil price of $20/barrel, typical of most of 1990's), refined oil products were retailed for 265Billion with total energy costing 657Billion or 8.2% of GDP( gasoline and diesel retailed for $1.50/gallon; 177Billion gallons)
In 2008, when average oil cost was $96/boe(lower than WTI or Brent av price), gasoline and diesel retailed for 660Billion(av 3.45/gallon) and all energy costs were 1370Billion (EIA figures) or 9.7% of GDP.
So although oil prices went up X5( x2 in real prices) the refining margins were less, so gasoline and diesel didn't rise as much and other energy prices did not increase as fast so the actual additional energy cost to the economy was not very great(1.5%).
The price spike of >$140/boe was of short duration, similar to 1990 Iraq Invasion of Kuwait price. What was different in 2008 was the sub-prime financial crisis, not energy prices crashing the economy.
You may be correct that when energy >14% of GDP the economy will contract but we would need oil prices of >$200/boe for that to happen.
Hello Neil1947,
Since we had or last exchange of opinions I have been running through the data from EIA, BEA and US Census Bureau.
I found total US end user energy expenditures in 2008 to be close to $1 500 billion (nominal, some uncertainties with respect to end user prices of kerosene, asphalt, road oil, lubricants, waxes etc.) which is in the region of the number you arrived at).
Total US GDP in 2008 according to BEA; $14 264 billion (nominal).
I think there are few who claims that there is a one to one relation between changes in crude oil prices and changes in other energy prices (gasoline, diesel, nat gas or electricity (which represents coal, nuclear, hydro , approx. 1/3 of US nat gas, renewables).
Through this analysis I found some interesting features, total US end user expenditures on energy grew at an average annual rate of around 14 %!!!! between 2003 and 2008.
Surely, this growth in energy prices eroded growth in the economy exclusive of energy.
Energy’s portion of US GDP reached approximately 10,5 % in 2008, petroleum’s portion reached 6,7 % of GDP. US composite crude oil price used $94,73/bbl for 2008.
Using chained 2000 dollars I found that in 2008 US GDP grew, but growth happened only in energy, i.e. using chained 2000 dollars GDP exclusive of energy did not grow from 2007 to 2008.
The decline in the economy happened late in 2008 (Q4 according to data from BEA) and if US crude crude oil prices had remained at $130-140 from July and through the rest of 2008 it would have resulted in a faster contraction of US GDP exclusive of energy.
I find your claim that the US economy now is ready to handle $200/bbl crude oil interesting.
Are you long crude oil or energy companies involved in extraction of crude oil?
I am of the opinion that how high oil prices the US economy now can tolerate must be seen in conjunction with; how the rest of the economy fares, how total expenditures on petroleum develops (i.e. a much lower consumption will certainly be able to absorb much higher crude oil prices, but how will US GDP develop in such a scenario?) and the development in total end user expenditures on other energy.
Taking this a bit further I found that US economy (based upon Q12009 data and annualized) would not grow at an oil price of around $60/bbl (using weighted nominal 2009 crude oil prices). This is however dependent on how the rest of the US economy fares and how total end user expenditures on, petroleum nat gas and electricity develops for the rest of 2009.
Again Neil1947, I wish you could be more specific than the quote above suggests.
At present crude oil prices around $70/bbl, gasoline sales/consumption stalls.
What do you think will happen at $200/bbl crude oil?
If energy reaches 14 % of US GDP, how will GDP exclusive of energy fare?
- Rune
Don't all energy expenditures somehow eventually have to be paid by worker wages, including bonuses? If this is the case, the $1.5 billion should really be compared to a much lower amount--wages including bonuses.
It seems to me that ultimately any purchase of energy is paid for by
1. Direct purchases by a wage earner
2. Purchases by a governmental agency, using taxes from an individual or business--but ultimately a wage earner must have paid the taxes, or bought goods from the business, so it could pay the taxes.
3. Purchases by someone on welfare or on social security. Someone must have earned wages, so they could pay taxes, so there would be these transfer payments.
4. Purchases by a business. But ultimately, there must be some chain of purchases, down to a wage earner, that justify this business staying in business.
There are perhaps a few other small categories. One that comes to mind is equity withdrawn from home appreciation. This could act to fuel this cycle, as could funds withdrawn from savings accounts, or money made through capital gains. If funds from these sources disappear, though, funds available for energy purchases would go down.
I am not sure how to collapse down GDP to the amount really fueling it, and thus available for energy purchases, but you get the idea that it would seem to be much less than the full GDP amount.
Gail,
I agree with your points.
Problem is that finding the “true” GDP requires a lot more research and number crunching, that is why I refer to official GDP numbers because this results in using a platform most people can relate to.
I have tried to do adjust GDP estimates with MEWs (Mortgage Equity Withdrawals) which boosted the economies (not only in USA, but also with several OECD members). MEW’s does not result from the creation of any real value, but is simply the result of increased home prices, which allowed some owners to make withdrawals (homes acting as ATMs), which thereafter was fed into the economy through various transactions (home improvement, autos, boats, cabins, plasma screens, PCs, plastic surgery, beauty care etc.).
The other factor to consider is how is down payment of debt accounted for when GDP is estimated.
One of the things I came to think about was that MEWs might also have been used as collaterals that thus acted as further leveraging. All of these elements created “consumption on steroids”, and made GDP numbers grow faster than the real underlaying factors would have allowed.
One of the effects from this may now be witnessed as consumers pay down debt (which is a different thing from saving!) and thus reduce spending/consumption and in my opinion this will not help GDP grow.
- Rune
Gail, you misread Rune. What he wrote was:
Though he did not put a comma after the 1 I am sure that is what he meant because that is the only figure that makes any sense. That is 1.5 trillion! 1.5 billion would be only $5 per capita while 1.5 trillion would be $5,000 per capita or $20,000 for a family of four. Though only about half that would be an increase as they were paying about half that before the rise in prices. Nevertheless that is very significant and would dramatically change their consumption habits. And mostly it would likely cut back on their consumption of energy.
Ron P.
I wrote $1.5 billion, but I was thinking $1.5 trillion. (Should have gone to bed around then.)
"Compensation of Employees" from here is only about $8 trillion per year.
Thx Gail.
If we now add in prices on purchased goods and services and decucts income from exports of goods and services we get a step closer.
A big portion in GDP is profits for companies and debt servicing (even I do not see how this is counted in the GDP equation).
Then there is DEBT which gets you an economy on steroids.
- Rune
Ron,
You are right, there is no comma. I wrote $1 500 billion or $1,5 Trillion for total US end user expenditures on energy in 2008.
Industrial consumers roughly consume 30 – 35 % of the energy. Industrial users normally obtain lower prices (wholesale) than the average household does.
Total amount (nominal values) spent on energy in US (at end user level) nearly doubled from 2003 to 2008.
Total end user expenditures on nat gas and electricity grew with 40 % from 2003 to 2008 (not volume adjusted). There may of course be regional differences.
- Rune
Rune,
Thanks for the reply. What I said was that if total energy increased to 14% of GDP the economy would contract. If we were at 9.7%(EIA figures )or 10.5%(your figure) with $94 boe oil and oil is 2/3 of total energy ( that seems a bit high) oil could double in price without retail prices doubling so total energy would be <14% of GDP.
Note that oil increased from $20/boe to $94/boe but total $$ energy didn't increase by X4.4 . Not sure why you would used chained dollars if we are talking about % of GDP in nominal dollars for both years? But if using chained dollars need to consider that energy(MJ)/$GDP has been declining 1-2% per year, although the price/MJ in real$ may have been increasing.
Of course an increase in oil price to $140 or $200/boe is going to reduce oil consumption and encourage more switching from heating oil to NG and electricity. The big change will be the uptake of hydrids and electric vehicles using 50%to 75% or less fuel than the average 25mpg, but this will take time.
Why would you consider non- energy part of GDP? If oil consumption drops and prices increase, the GDP remains the same, unless money is spent on for example more expensive HEV's, then GDP may increase.
'What do you think will happen at $200/bbl crude oil?"
If the rise is gradual( in real$) people in US will do what is done in EU, continue to use gasoline at $10/gallon, if the economy has recovered from 2008/9 recession this will reduce GDP growth slightly, people will drive more but use less fuel.If other energy prices also rise so energy accounts for >14% of GDP I would expect to see GDP decline.
Are you long crude oil or energy companies involved in extraction of crude oil?
I have a small share ownership in a company involved in crude oil, one in LNG and one involved in wind power. They seem to be making money with oil prices at $60/boe, why were you asking? I am not hoping for $200/boe oil prices(in real $) but think they will occur if oil supplies decline and other energy prices remain stable. Whether I live long enough to see oil supplies declining and $200/boe oil is another matter.
"The decline in the economy happened late in 2008 (Q4 according to data from BEA) and if US crude crude oil prices had remained at $130-140 from July and through the rest of 2008 it would have resulted in a faster contraction of US GDP exclusive of energy."
I would agree that oil remaining at $140/boe would have reduced GDP further than it would have been, but the big even was mid Sept 2008( Lehman Brothers defaulting on derivatives) just look at LIBOR rates which had recovered in mid 2008 even with oil at $140 but then increased x500% even as oil prices declined. This is when consumer financing, was essentially frozen. I believe it would have happened in US and Iceland and Ireland even with oil at $30/boe for all of 2008.
Neil1947,
Again, I had hoped you could be more specific.
Are you referring to US GDP as of 2008?
If so, and using 2008 GDP numbers for US, the economy exclusive of energy would have contracted by an estimated additional 4 % using your numbers.
This would have been huge!
Can you give a link to your EIA figure?
My figures are based upon EIA data for petroleum (the reason I use the word petroleum is that this refers to refined products (like gasoline, diesel, kerosene, heating oil, residual fuel oil etc.) at average US end user/retail prices. This goes also for nat gas and electricity.
I estimated total US expenditures for petroleum to have been around $960 Billion in 2008, with a composite oil price of $94/bbl.
For 2003 with a composite nominal oil price of just above $28/bbl I have estimated the total US petroleum expenditures at end user level to have been around $410 billion (nominal) figures.
In other words a 3,4 X (from 2003 to 2008 and nominal figures) increase in crude oil prices resulted in a 2,3 X increase in total US end user expenditures. Figures have not been ajusted for volume changes and US petroleum consumption was 0,2 Gb lower in 2008 than in 2003.
I estimated total US expenditures for nat gas for residential, commercial and industrial users in 2008 to have been $167 billion.
I estimated total US expenditures for electricity (inclusive nat gas used for electricity generation) for all users in 2008 to have been around $365 billion.
That should bring total US expenditures at end user level to around $1 500 billion, which amounts to around 10,5 % of 2008 US GDP which by BEA has been estimated to $14 264 billion (2008).
Could you now please share with me and the other readers how you arrived to your numbers?
That is exactly what I described above!
Because using chained dollars makes it possible to compare the real development in GDP and costs.
Again this is the reason for using chained dollars.
Total US energy expenditures grew with an average of 14 % annually between 2003 and 2008.
Yes, specific energy costs ($/MJ or $/kWh) grew strongly in real (and of course nominal terms) terms between 2003 and 2008. So far in 2009 end user electricity prices also grows faster than GDP.
That depends on the price developments on nat gas and electricity.
Chances are you are going to become disappointed by the pace this transition will take place
It may be. How will consumers now afford more expensive purchases as unemployment grows, furloughs is much in use, consumers are focused on debt down payments?
Further there needs to be developed an infrastructure for your HEVs.
I advise you to check out the definition for GDP and the real state of the present US economy.
????????
Gasoline sales are now stalling in USA with oil at around $70/bbl or an average gasoline price of $2,60/gal.
The reason I ask is that I get a feeling that some reads TOD to find ideas about investments, or get good analysis/informed opinions on growth in energy prices based upon projections on supplies and demand.
Consensus seems to be;
“Peak Oil” = Dramatic oil price increases.
I think these people are going to be disappointed. Big time!!
For the near term (i.e. towards 2014) I expect average oil prices to grow from around $50/bbl in 2009 towards $60 +/bbl in 2014. This is based on my evaluation that OECD economies cannot handle higher prices if they are to see some economic growth again.
We are now entering unchartered territory and anything could happen, but I doubt we will see $200/bbl oil (at an annual average and in today’s dollars) for perhaps a decade, if ever.
I certainly wish you a long and good life.
It would have been a matter of time.
However I have no doubt that the growth in energy prices added to the financial strains and brought the debt crisis forward in time.
- Rune
Rune, thanks for this post. I am saving the link and expect to use it several times in the future. Every time some wag talks about peak oil sending prices through the roof I will simply post the link and tell to "read this then get back to me."
Last year I too expected prices to continue higher and higher. I wuz wrong! And in hindsight it seems quite obvious why I was wrong. I find it simply amazing that others still cannot see something so clearly obvious.
Oh well, thanks again anyway,
Ron P.
Ron,
Thx a lot and you are welcome.
I have more in the pipeline for TOD on GDP and energy.
My comments above is mostly based on research for future post(s) on these relations.
- Rune
me too
Rune,
These are the sites I used, one table has a summary for 2008 of $1375Billion for all fuels( can't find it now, but I calculated a similar value from separate data )
http://tonto.eia.doe.gov/dnav/pet/pet_cons_psup_dc_nus_mbbl_a.htm
http://www.eia.doe.gov/emeu/aer/contents.html
http://www.eia.doe.gov/overview_hd.html
For 1996: 177Billion gal of gasoline and distillate(av $1.5/gal)=265B plus 50B residual fuels estimate (av $1/gal)(total $315Billion); NG 16,000,000 Mcf at $6.34 =$101Billion; Electricity 3,100,000GWh at 6.5c/kWh=$200Billion for a total of 616Billion/8Trillion GDP= 7.7%GDP.
For 2008: 191Billion gal gasoline plus distillate, at $3.45/gal/ and 61Billion gal JF, chemical, NGL,asphalt, at estimate of $2.50/gal=807Billion petroleum; NG 14,700,000 Mcf at $13.60=200Billion; electricity 3,720,000 GWh at 9.9cents/kWh=370Billion for a total energy of$1377 Billion /14.2 trillion GDP =9.7%GDP
If we assume that the US economy only grows by 1% per year for next 10 years and oil price rises to $200/boe ( real price in $2008), but petroleum consumption declines by 1.9% per year(20%total for decade) while other energy increases by 1% per year, we would have 15.6 Trillion GDP,220Billion NG, 407Billion electricity and $1291 petroleum(2x807x0.8) for a total energy of 11.6%GDP.
I think these are reasonable consumption and growth rate values but with higher prices for petroleum or more progress with improved CAFE and EV's may see greater reductions in gasoline use.
Neil1947
There may be a difference because in the uk 70% of the price of fuel is put back into the system by taxation. We are currently paying just over £1.00/litre of which £0.70 goes back into our economy. With current ICE cars we pay ~ 7 pence per mile taxation, which is about £8000/car/year in the uk. With electric cars, which are tax subsidised, we will pay less than 1 pence per mile. The goverment will be very much out of pocket (£8000*30,000000 cars is a lot of cash). Taxation on electric vehicles = 7 pence per mile will come and they won't be cheap to run either. We live in interesting times!
Partypooper,
Good point about tax, in US taxes come to only about 20% of retail price. The point I was trying to make is that $10/gallon is not a ridiculously high price that people will not pay. The 14% of GDP number is what the US economy experienced for total energy prices in 1980, not adjusting for tax, but tax structure in US is similar in 2008 as in 1980. The difference is that total energy costs were about 10% of GDP in 2008. In time we would expect fuel economy to rise as it did after 1980, so that total energy as %GDP would decline, even if real oil prices stayed high.
Your comments about taxing electric vehicles will be a problem of a successful transition post-peak oil, not too onerous after all people are paying 7pence /mile now, the alternative of still using oil may be 70pence /mile. The economy will be making additional savings by not re-building refineries, no transport of fuels, longer lasting vehicles lower non-fuel running costs, lighter vehicles less road damage.
Neil,
While we are there, let me share another observation with you.
Back in 1979/1980 energy’s part of US GDP as the recession back then started was 15 - 16 % (IIRC).
Now we see economic growth respond as energy’s portion reaches 10 - 12 % of GDP. During 1997 - 2003 energy’s portion of US GDP remained in the area of 7 % or below.
It has been generally accepted that through the years economic use of energy has improved.
This improvement in economic use of energy (efficiency gains) may also be the reason why GDP now responds at lower levels of energy’s portion (of GDP).
- Rune
Rune,
You have a good point about an economy being more or less sensitive to energy prices over time. I would agree that if total energy is <7%GDP it doesn't seem to be an issue, but other things can cause recessions besides energy prices. The question about 2008 is what was the shock that caused the recession. A range of commodities spiked in 2008, oil, steel, copper, but had been rising for several years. House prices in US spiked earlier but the big drop was happening during 2008. High interest rates were at peak considerably earlier. I have a sense that 2008 will not be remembered for $147 oil, but for sub-prime mortgages.
It could be that some of the GDP is so called "phantom GDP" or it may be that if people have more mortgage debt, they are more sensitive to oil price rises, or perhaps people commute greater distances to work, so are more sensitive to oil price rises than NG or electricity( ie they can turn down heat or A/C but still have to drive the same miles).
One thing is an economy with say 50% vehicles PHEV will provide a very big cushion against future oil shocks, because with a little effort people will be able to greatly reduce gasoline use( charging at work, more short trips), while if oil is less expensive they may not bother about using gasoline for a little more convenience. It would be similar if we had a large fleet of duel CNG/gasoline vehicles, just as with NG and electricity heating, some switching is possible.
Niel,
Ten dollars a gallon in the US is enough to push probably millions of com muters over the economic edge- most or all of those who must drive many miles a day in thirsty vehicles.Quite a lot of them have no realistic chance of either moving closer to work or trading cars for something easier on fuel either,given the fact that they are "upside down" on thier loans.
oldfarmerermac,
A quick internet search in US shows many Toyota Prius's for sale (model year 2001-2) for about $5,000. I am sure there are many less expensive older vehicles for sale that have high (>30mpg). A new Yaris is <$12,000, it's not going to pull the boat or trailer or carry the local football team but its good enough to get to and from work with $10/gallon gasoline. There is no excuse to be driving gas guzzlers, they cost their owners and the nation, too much, even at $3/gallon gasoline.
Sure a X4 price increase in a few months would cause great damage, but over 10 years, people will have time to replace those expensive SUV's with less expensive high mpg vehicles. The proof is that Europeans drive with prices approaching $10/gallon, and many have lower incomes. It's a matter of priorities, even in the deepest recession for 80 years people are still buying millions of new vehicles in US, just less than in last 10-20 years.
I'm still having trouble understanding their methodology. There are more details about the "N" forecast in an earlier paper:
http://www.systemdynamics.org/conferences/1996/proceed/papers/dunca141.pdf
It's seems to be a mix of Hubbert linearization and a polynomial extrapolation.
Sam - Duncan is a Systems Engineer and Youngquist is a geologist. A quick look at the paper you link to suggests they are following a methodology similar to that employed by Jean Laherrère who builds discovery cycles into his forecasts.
The "unique" thing about D&Y's approach is incorporating the "heuristic":
I will not pretend to understand any of this but draw some consolation from the fact that after several weeks of work the forecast I produced for Saudi matched theirs. This is the time scale of effort required to produce reliable forecasts.
For a couple of years now I have been heavily influenced by your post applying loglets to production stats (which is a way of analysing underlying cycles - is it not?) from which an estimation of peak 2012±3 years seemed reasonable. It's not worth discussing bumps on a plateau - quite often when you climb a mountain in Scotland you don't know where the top is.
Recommended reading:
http://www.theoildrum.com/story/2006/9/3/113719/7594
Duncan uses these variants in his analysis:
The D-model is a parametric differential form of the Logistic. I think Duncan puts it in this form because the Stella program he uses is a data-flow solver, which can solve coupled equations quite readly.
Duncan's main figure in that earlier paper appears to be an HL plot graphed so that it is not scaled by the cumulative. It then ends up looking like an "upside-down" parabola (and not a straight-line characteristic of HL).
dQ/Dt = Q*(1-Q)
He then makes what he thinks is a significant point in picking the origin of this curve correctly. I think that is where his qualitative intuition takes over.
I've been playing with BP's Energy Charting gizmo and its really easy to use.
Middle East oil reserves went from 684.3 Gb in 1998 to 754.1 Gb(due to Iran and Qatar--offshore?) They produce 26 Gb/a.
OPEC went from 800 Gb to 960 Gb with increases in Iran of 40Gb, Libya 20, Qatar 20, Nigeria 15 and Venezuela 25 Gb.
All kinds of interesting stuff in it.
What is really shocking is the growth in natural gas (+57%)and electricity consumption(+66%), not oil(+33%).
Could we be focusing too much on oil at TOD?
I agree that electricity and natural gas are both part of our energy future - we are gradually incorporating more analyses relating to them in posts.
Euan,
How about analyzing the reliability of this forecast by Richard Duncan from 2001:
It's amazing how you TODers always bury this data point and pretend it doesn't exist.
JD - I suggest you read this and then invite you to revise your comment:
Olduvai revisited 2008
The main point about Duncan's "Olduvai" theory is that declining fossil fuel (FF) production combined with growing global population will result in declining energy availability from FF per capita going forward.
Whilst I don't necessarily agree with all the details of Duncan's Olduvai "forecasts" I firmly believe that the basic framework is correct.
Whether or not alternative energy sources and energy efficiency savings may plug the gap left by FF energy decline is the biggest question confronting Mankind today.
Euan
Euan,
You are treading softly around Duncan's Olduvai theory. He is very clear that the prediction is a "crash" of per capita energy consumption, due to a decline in oil and NG supply. I can't see a good explanation as to why wind, nuclear and solar energy will not replace FF over the next 50 years and why coal production is going 'crash' by 2012 or earlier. The rolling blackouts by 2008 theory was based on NG running out, to be fair to Duncan he did not foreseen shale gas or coal seam methane. Just as he couldn't have anticipated wind energy now producing 2% of US electricity and wind and solar growing at 30-50% per year.
His theory needs to be revised not because oil is not on track to decline, but because of other energy developments,and higher efficiency of energy use.
Neil - Luis and I are going to revisit Olduvai again, this time targeting publication in peer reviewed literature. I do believe in the resilience and adaptability of Humans and appreciate that energy efficiency and alternative energy sources may compensate for FF decline. I'm also acutely aware of the uncertainties in FF forecasts. The question is to what extent efficiencies and alternative substitution can fill the gap.
Euan,
I re-read your and Luis's "Olduvai Revisited" and you seemed to be more positive in that article.
I look forward to seeing your new article.
One important issue to fill the gap of oil is that EROEI of delivered energy from oil is very low, due to refining distribution losses and especially the low ICE efficiency. Thus, a kWh produced at a wind turbine or nuclear reactor, is going to be able to replace about 10kWh of crude oil energy(1600kWh/barrel)by the time its refined and used in transport. Thus to replace the 160 EJ /year of oil does not require a ridiculously large amount of electric energy. NG is already used very efficiently so will be much harder to replace, and in my opinion, peak NG is a bigger issue than peak oil.
Fortunately, energy efficiency of electricity use by A/C, refrigerators, hot water heat pumps, lights has improved and we are only just starting to benefit from this better technology, so intensity (energy/GDP) should continue to decline probably at higher than the 1.3% rate of last 40 years.
The other big trend is population is aging almost everywhere, a larger proportion of population will not be employed, not commuting to work or working part-time( usually locally). Retired people have more time to travel by mass-transit and will travel less, probably consume less by changing technology at a slower pace.
For a theory to be scientific, it has to be falsifiable. So what will convince you that Duncan is wrong? If in the year 2017 lights are still on and trucks are still rolling to the supermarket and 20% of our electricity comes from the wind & the sun, will you admit Duncan is wrong?
Suyog
suyog,
Because Duncan is defining standard of living in terms of boe/capita( ie BTU/capita) by his definition even if all of the 40EJ the US consumes per year is replaced by 8EJ of electrical energy( electric vehicles) and the 8EJ of electrical energy generated by burning 24EJ of coal is replaced by wind, solar or nuclear, and people have similar goods, services and mobility the consumption of energy( on a BTU basis ) will have declined from 95EJ to 47EJ so by Duncan's reasoning the economy is crashing( ie a 50% reduction in energy /capita).
Like many studies of oil, the relatively low EROEI for the extraction, refining and distribution of gasoline an diesel and the very low efficiency of ICE vehicles, means that only about 10% of the crude oil BTU's have to be replaced by electric energy to have the same work outcomes.
A good example is this article that claims the energy used to refine crude oil into gasoline and diesel could completely replace oil used in vehicle transport without any additional energy consumption.
http://evworld.com/article.cfm?storyid=1715
I look upon wind as a “fuel saver” which depends on built infrastructure to function and some form of subsidizing to become attractive for investors.
With the credit/debt crisis/unwind, financing some of these projects will become nothing but a true challenge.
Wind Turbine Orders Off By 50 % For The Year
Rune,
When orders were backed-up two years ahead, a 50% drop in orders is not too significant especially if this is in $$ amounts as the linked article shows price drops of 18%; so that may be a 32% drop in orders(MW basis) or just a drop in long dated orders.
Also a pause may be expected in US, waiting for clarification on the stimulus package rules. quote:
"This means in 2010, when credit thaws, and stimulus packages take hold, we can expect the wind market to expand significantly."
I would note that 1st Q 2009, 2800MW was completed in the US, in the middle of a severe downturn, 100% higher than same period in 2008. Also note that 3,300MW is presently under construction.
In UK, 300MW completed in Q1 2009, and 2,800 MW under construction, while in Australia 600 MW completed in 2008, 550MW under construction, and some large projects just approved.
New financing for wind power still seems to be occurring, 2010 will tell if new construction declines or expands.
Presently wind is definitely a fuel saver( coal or NG) but not really connected to the price of oil.
Hello Neil,
I think making a comaprison between Q1 2009 and Q1 2008, may now lead to a little premature results.
Those completed in Q1 2009 were probably ordered long before the economy hit the “wall”.
I agree.
- Rune
Neil1947,
You(and many others) are positively dotty on the subject of electric transport.
A car going 40 mpg on gasoline covers 1 mile at a rate of
.85 kwh per mile; 1 gal/40 miles x 115000 Btu/3.4 Btu per kwh=.85 kwh/mi. Adding in the efficiency of gasoline production and distribution at 80%, that works out to 1.056 kwh(energy)/mi.
The old EV-1 got .37 kwh(electricity) per mile.
http://en.wikipedia.org/wiki/Fuel_efficiency_in_transportation
But then you must convert fossil fuel(30%) into the grid electricity, and suddenly you're up to 1.23 kwh(energy) per mile.
It's possible that future EVs might increase their efficiency slightly but as electricity users they will certainly will draw down fossil fuels just as fast.
The best hope for EVs is that they can be somehow implemented in specialty markets along with renewables(Socal, Iceland, Israel). I expect electrified mass transit will be about as efficient as diesel mass transit(locomotives in the US are motor-generators).
Majorian,
Why not compare the Toyota RAV4 and the RAv4 Ev, virtually identical vehicles. The ICE version gets 31mpg, it takes about 10kWh of electricity or NG to refine a gallon gasoline(130MJ) plus refinery losses and distribution losses( 15MJ each), for a total of 66MJ plus 130MJ=206MJ/gallon, or 6.6MJ/mile.
The RAV4EV has a 35kWh battery and a range 120-150 miles, lets take the 120 mile range, =0.34kWh/mile. So the RAV4EV uses 0.34x3.6MJ/mile=1.2MJ/mile about 1/5 th the energy.
"But then you must convert fossil fuel(30%) into the grid electricity, and suddenly you're up to 1.23 kwh(energy) per mile."
Electricity generated from wind, hydro or nuclear accounts for 30% of US electricity(3.6MJ/kWh), 20% is from NG(7.3MJ/kWh) and 50% from coal(10MJ/kWh) for an average of 7.4MJ/kWh so the RAV4EV uses 0.34kWh x7.4MJ= 2.5MJ/mile compared to ICE vehicle 8MJ/mile(adding the extra energy from electricity and NG used in refining).
http://www.evworld.com/article.cfm?storyid=1347
If we use a Tesler roadster( 240mile/50kWh) = 0.2kWh/milex7.4MJ= 1.4MJ/mile or a Chevy Volt 40miles/8kWh= 0.2kWh/mile =1.4MJ/mile, compared with the average mileage of new vehicles( 27mpg) we have X6 time more energy used by ICE vehicles.
As coal fired electricity is replaced by wind , solar and nuclear the every savings of EV's will be x3 greater, ie 1/10th the energy.
In fact each gallon of gasoline uses as much electricity or NG energy as an EV traveling that same 31 miles .
Perhaps you can now see why some of us are positively enthusiastic about PHEV and EV's replacing existing ICE vehicles.
Neil you need to be careful. You tend to quote the worst for the ICE and the best for the electric to further exaggerate the argument in favour of electric. Top Gear flattened the Tesla in 40 miles, yes they thrashed it, but equally 240miles is the best you will get and not necessarily typical. Many modern diesels will do 12 miles/litre at 70mph which is about 800 Wh/mile. At 56 mph my old clapped out diesel does 70mpg or about 650 Wh/mile. In the 1980's the first direct injection diesels could do 100mpg, at about 30 mph! The system with which we live (Gaia ?) won't tolerate wishful thinking. Electric cars may be 2 or perhaps 3 times more effective at converting battery energy into miles travelled, and also have very generous tax subsidies attached in favour for their use. The London congestion charge exemption alone is worth £6,000. Why electric vehicles don't cause congestion is something I have yet to grasp.
Partypooper,
The best comparison is the Toyota RAV4 and RAV4-EV. I used the lower value of 120miles range. Agree that EV's now are expensive, but none are mass produced in millions as they will be after 2012.
Because of limited range, and battery costs EV's will be more aerodynamic, lighter and recover the maximum from regenerative braking so they will be considerable better than today's average fleet. I expect future ICE vehicles to also improve on today's vehicles. I don't see this as wishful thinking, wishful thinking is believing a new 20mpg ICE SUV is going to give 20 years of happy motoring.
Neil,
We come from different lands so we probably have different experiences, but in the uk smaller cars, particularly diesels predominate over SUV's and the Prius is not a common site in the UK (its not in the top ten best selling cars either). I am no promoter of SUV's and have always driven relatively economical cars myself.
The one point I make in my two post above is that electric cars will have to be taxed to create revenue equivalent to the current levy on ICE vehicles.
To illustrate my point, my electricity cost is about 11p/Kwhr of which 5% I think is VAT. This equates to about 2 pence/mile. The tax recovery is therefore negligible. At an equivalent 7p/mile tax, electricity would have to cost about 45p/Kwhr (Calculation is assuming 200 Whr/mile which is a generally quoted figure). For a litre of diesel you get 10 kWhrs for £1.00 and waste perhaps 8 of the 10 due to engine inefficiency. So taking taxation into account the cost of running an electric won't be much different to that of an ICE, even if they convert 4 times as much energy into road miles.
Regenative braking won't do much good in open road driving. I'm not sure about weight, it does not seem to make any noticable difference whether I drive my car with one person (me obviously) or fully laden going on holiday. Frontal area and aerodynamics are probably more important.
Partypooper,
I did have a gas guzzler but replaced it a few years ago.
I think it will be very difficult to tax the electricity as a fuel tax, perhaps other methods are required such as congestion taxes, vehicle tax. Not to worry it's going to be years before ICE are all off the road, its a bit like worrying about cigarette taxes declining, the last few will still be a minority easy to tax to the hilt to get them to stop.
Governments can always return to taxing income or having toll roads.
Most driving miles are in city traffic where regenerative braking improves economy and EV's are going to have good aerodynamics to give good highway range.
In terms of fuel efficiency nuclear is exactly the same as fossil fuel at 30% and will be depleted exactly the same way unless something like fusion comes along.
Imagine a solar powered train running for 12 hours and then stopped for twelve hours, what is its practical efficiency? Terrible! 12 hours have been wasted.
A 10 gallon tank of gasoline contains 334 kwh of potential energy and in a 40 mpg car that's 400 miles.
The battery of a Chevy volt which has 111 kw motor contains just 16 kwh of potential energy of which 8 kwh is usable good for 40 miles. There is only so much work(tasks) that can be accomplished on 8 kwh.
Another example is pumped storage. The US has 22 GW of pumped storage capacity but it holds only ~8Twh(400 hours worth of energy).
majorian,
You usually have more imagination, why a solar power train, what's wrong with an electric grid train, using wind, solar, nuclear energy? As in Europe(TGV)
A 10 gallon tank of gasoline contains 334 kwh of potential energy and in a 40 mpg car that's 400 miles.
That's why a Chevy Volt has a 6gallon? gas tank to give it an additional 300miles after the first 40 miles on electric. Most trips are less than 40 miles so most of the time it will be running on electric only.
There is only so much work(tasks) that can be accomplished on 8 kwh.
The Chevy Volt can only do one, go 40miles per trip again and again and again.
Another example is pumped storage. The US has 22 GW of pumped storage capacity but it holds only ~8Twh(400 hours worth of energy).
Considering that peak loads are usually just a few hours duration 400 h is a long time. The US also has an additional 50GW non-pumped hydro that can be used for peak demand, and can draw on 50GW hydro from Canada on hot summers when not much is being used in Canada for heating.
Duncan calls his models heuristics. Therefore he has no theory to falsify. Heuristics either follow the empirical data or they don't.
Theory never gets in the way.
Even when Duncan goes beyond heuristics, his "D" model for example, this still doesn't cut it, as he bases his "theoretical trajectory" on a variation of the Verhulst equation, which essentially gives a Logistic curve. But that in fact is a heuristic unless you can back it up by some fundamental reasoning.
Duncan may in fact be right in his projections but don't credit it to any scientific theory based on first-principles.
Ah JD..JD: how are we suppose to respond to your postings?
You just love to taser us, but offer no valid analysis of your own to counter the hard work of others. Recall that I earlier found the Aramco Ghawar oil-sat graphic after many, many hours of googling around--have you been googling regularly like me trying to find any more key info on FFs or other Elemental vital resources that we all could use to improve future energy & other resource forecasts? Or do you just scan websites merely looking for your next taser victim?
After doing a Peakoil Shoutout to ignite a Synaptic Wildfire, why don't you research this possible idea:
-----------------------------
The FFs IOCs & NOCs & Natgas producers are increasingly being geologically forced to flowrates of sour crude and sour natgas. Perhaps they should mutually agree to gradually [quickly?] ramp the S-price until they are selling their recovered [S]ulfur at 5X [10X !?!] the price of a ton of crude by severely restricting postPeak S-flowrates.
------------------------------
Recall that roughly: 7 barrels = one ton of crude. At $147/barrel last July '08, some S was selling near $1,000/ton in certain markets [see my prior postings]. 7 X $147 = $1,029==> I don't think the FF companies have soon forgotten how much these S-sales boosted their bottom line...
Since I am not skilled in data analysis, perhaps you or some other TODer could put their skills to work on recovered-[S]ulfur forecasts, and how much should be future hoarded [restrict S-flowrate now] so future generations can continue to eat; what Asimov Foundation Strategy of Predictive Collapse and Directed Decline best flowrate move us to Optimal Overshoot Decline?
I don't have the funds to buy the Very Expensive Proprietary S-reports, but my guess is that these people are very aware of Asimov's List [P is #1, S is #2...] and how I/O-NPKS->food surpluses->job specialization->civilization. Recall how much S is needed to beneficiate P into finished fert-products; pretty difficult to get #1 without #2!!!
Remember: we can substitute labor for FFs, but there are NO SUBSTITUTES for NPKS and other trace Elements for photosynthesis!
For example [refer to my earlier postings on Canpotex, Belaruskali, and Phosphate Group]: what Webb/Pomerene-type restricted flowrate volume and elevated pricing structure for postpeak recovered-S maximizes FF-producers' revenues and profits plus the revenues and profits of the I-NPKS producers too, but at the same time forces a fast ramp to full-on O-NPK recycling for everyone else?
In short: if you are not hugging a bag of postPeak I-NPKS==>you should damn well be hugging your locally sourced postPeak bag of O-NPKS.
I think selling S for just the shipping cost, or even much less than that [See prior post on Japan & Korea recently dumping S in China] does not serve the long term goals of civilization as we go postPeak. This is tantamount to wildebeests never naturally running from hyenas as long as possible, but instead, with no chase at all, merely flopping down and exposing their soft organs instead:
http://www.youtube.com/watch?v=TeuN7YAvdwc&feature=PlayList&p=752BD07017...
-----------------
Hyenas eat wildebeest alive. [3:38]
-----------------
Please remember this video everytime you eat belly-sourced bacon and belly-sourced chicken eggs with your orange juice..ah, the three 'low-hanging fruits' for breakfast.
"She comes down from Yellow Mountain.."
http://www.flickr.com/photos/gord99/280466011/
http://farm1.static.flickr.com/100/309830112_23d066a567.jpg
-----------------------------
"Joy, beautiful spark of the gods,
Daughter of Elysium,
Touched with fire, to the portal,
Of thy radiant shrine, we come.
Your sweet magic frees all others,
Held in Custom's rigid rings.
All men on earth become brothers,
In the haven of your wings."--Schiller
---------------------
If XOM, BP, ARAMCO, et al sold S for a high price: it would provide immediate cash flow for further E & P; they wouldn't need to sell future debt [bonds] to finance their operations.
Imagine if ARAMCO, OPEC, Russia, etc, never sold any crude until the S was recovered first. This is no different than the Natgas companies do now, as the hydrogen sulfide is too corrosive and too toxic to send through their very long pipelines.
I would sure hate to be a country reliant upon S-imports, N-imports, P-imports, K-imports for my national food security as S is used to make many different I-NPK finished products [not to mention being critical for most industrial processes, too].
Gee, aren't the USA and other countries dead-headed exactly into this situation if one recalls my prior postings on USGS I-NPKS info and UN FAO info? IMO, the ONLY rational response to this situation is to ramp O-NPK ASAP.
Would it be better overall for civilization if the IOCs, NOCs, etc, made most of their income from S as opposed to hydrocarbons? If one fully considers the likely ramifications: it would greatly speed up the required Paradigm Shift, Kunstlerization, Permaculture, etc.
Would you buy eggs without yolks [see photos above again]? Meringue is much less nutritious. I hope more TODers will consider S as roughly equivalent to Melange [Dune's Spice].
http://news.yahoo.com/s/mcclatchy/20090705/sc_mcclatchy/3266069
---------------
Sandstorms plague Iraq and are getting worse
---------------
Bob Shaw in Phx,Az Are Humans Smarter than Yeast?
Another reason why FF-producers might want to get much higher pricing for their recovered-S?
http://business.maktoob.com/20090000007007/ADNOC_Conoco_JV_cost_to_hit_$12_bln/Article.htm
------------------------------
ADNOC, Conoco JV cost to hit $12 bln
Abu Dhabi National Oil Co (ADNOC) and ConocoPhillips may see their budget on the Shah sour gas field development rise by up to 20 percent to $12 billion due to the complexity of implementing the project's liquid sulfur pipeline, people familiar with the plans say...
-----------------------------
Selling S very cheaply is no way to recover the costs of big finance projects like this,IMO.
http://cruonline.crugroup.com/Default.aspx?tabid=483
------------------------------
2 Jul | SULPHUR: Adnoc July price at $35/mt FOB; more Q3 prices settled
More Q3 contracts are now being concluded for deliveries to China and India, while the persistent bearish trend is reflected ...
-----------------------------
EDIT: I bet the poor bean-counters on this project are now gobbling lots of TUMS trying to offset the rising Acid Reflux [S]yndrome..
Damn.I spent a little bit of time measuring my offensiveness, trying to make sure that I really nailed the bastard for his self-serving whiteness.
cfm in Gray, ME
Attention Gail and other lead editors,
Hi Guys,
Peak oil is arguably becoming old hat. In 2005, I enjoyed the realisation that the EIA was fiddling the forecast figures and editing the IEA pronouncements and I am even mildly intrigued that people posting on this site hold to the old dogma that Canadian oil sands are "dirty" - even after the efforts of the in-situ firms to recycle water, asphaltenes (for power, steam and hydrogen) etc. Many of the fiddlers have changed their tune in response to peak oil reality.... Even so, many of the researchers find it hard to switch to new lines of thought. Most of us don't do pure research and we rely on the opinions of others and that can be our undoing.
I have really enjoyed the info and stats after watching the peak oil action on your site for several years (I hope I can continue to do so) but "I think you folk should also get out more".
I reckon we are past peak now and my attention has lately more and more been taken up with following numerous developments that demonstrate how the ingenuity of mankind is being brought to bear to deal with the post peak challenges.
After all, if even the US government has changed tack, why can't you?
Steven Chu (of DOE fame) is really doing some interesting things to stimulate the greater capacity/capability for the national electricity grid and this is an avenue that you folk should take a gander at. Just ask how and why he is doing this? What does he know that we/you don't? I am intrigued by what has been set in motion and this is deserving of analysis. I am looking further.
For example try going into the blogs on www.theeestory.com , stick with the techie posts and try following what is being attempted using barium titanate ultracapacitor high density energy storage. The holy grail of energy storage perhaps. Check out what www.zenncars.com are trying to achieve using the EESU.
Of course everyone is trying to figure out whether the EESU is for real or not, but the action is now hotting up with Chinese researchers on the blogs trying to reverse engineer EEStor's patents. Also with Lockheed Martin taking up patents for military use and NASA looking at the EESU for energy storage in space.
So you may disagree with me, but arguably the interesting stuff is no longer proving why the peak is past but what mankind is going to do about it. Who is changing the game, rather than who is keeping score.
Are Richard Heinberg and Jim Kunstler right in their dire predictions? Or are we able to look forward to a brighter future with all the energy we need to power a future of growth and prosperity? Will guys like Dick Weir and Ian Clifford be our new heroes?
Disclosure of interest. There are multiple lines of development that I am following, but only two I am investing in. The fate of the EESU just happens to be one.
I accept the lessons of the past - I am now betting on the future.
**I am not responding for TOD.**
All the things you mention are discussed here regularly. The Campfire is for solutions discussions, but nobody is submitting much.
Perhaps you could.
Cheers
We do keep changing what we are writing about.
I expect that there will be more electrically related posts in the future.
If there are particular technologies that you are interested in, we can try to get guest posts. The problems that many of them have are (1) dependency on rare metals, which are likely not to be available in the future, (2) long development times, and (3) cost.
If guest authors have insights on new technologies, and can talk about the above issues, that would be helpful.
Edit: Also, check out Ugo's post today, on a new technology.
The definition of a concern troll.
BTW, How is the leakage of those capacitors progressing?
As the Aussies would say - don't knock it until you have checked it cobber :-)
I have provided some links but obviously not the motivation to check them. So I hope I can do that in this post.
I enjoy looking through the "renewable energy" articles but without effective storage mechanisms many are "pie in the sky" in terms of their relevance to post peak solutions - and as Gail has pointed out, the rare earths and shortage of appropriate metals provide limitations there. 800 million ICE cars adds up to a humungous lot of resources.
I don't think of myself as a troll. I happily enjoy the posts on this site and reckon I have learned a lot from them, but feel that the emerging technologies are not only hotting up but also the governmental redirection of effort to cope with the reality of peak oil is worthy of note. My concern expressed as "I think you folk should get out more" (mea culpa), was a cry for the editors to do more to identify posts and information streams about solutions to our dependence on oil that are technically focused in areas such as energy storage. I am intrigued by Toyota's plans involving NimH out of preference for Lithium ion - but go further. After all, don't you wonder why Obama's men are less interested in locking up the world's supplies of oil than Mr Greenspan thinks the elite were when the USA invaded Iraq? Nothing has been done to block or inhibit China's pursuit of long term access to oil. WHY?
I reckon, all of us on TOD and Peakoil have been following China's activities with amazement. But perhaps I am wrong? Yet the intro to the new US energy bill says Chu's efforts on the grid are likened to a new Manhattan project. You tell me - isn't something of a watershed happening? Look at the billion dollar prizes they are offering in the bill.
I cannot vouch for the veracity of claims made for the EESU on the sites I have given you, but if you had followed the links you would find a group of people aiming to launch an electrical energy storage unit with such spectacular performance that assertions by those worried about the future probably don't figure any more.
Forgive my lack of accuracy but off the top of my head I think what the sites variously claim is...
Energy storage for the EESU that promises negligible leakage, non toxic and readily available materials are one thing, but to also carry the promise of ten times the energy density and one tenth of the weight of lead acid batteries adds to the spice.
Then we have the teaser of half of the cost and the ability to almost cycle forever and I start to wonder whether there really is a "Santa Claus".
Zenn MC say they plan to launch a pure EV that will do 120kms/hr for 400kms and then recharge in 3-5 minutes. Won't that make the ICE obsolete?
But the cheap, light, 52 kwhr BaTiO3 ultracapacitor EESU is the teaser. Can they deliver it?
I don't suggest that this issue and the blogs that debate the use of ultracapacitors for high density energy storage are completely on point with this site's aims and objectives. But given what I see as a huge change of US Government direction due to the efforts of Messrs Obama, Chu et al on the one hand and the proximity (we are told) of this break through in energy storage on the other, I reckon the POTENTIAL energy implications are ginormous.
Regrettably, (like Winnie the Pooh) I am a bear of very little brain and it would need more electro-physicists to enter the debate and compare the relevance of the phenoma and science (that even I cannot ignore), with the implications of post peak oil supplies.
Hopefully a wise Christopher Robin is to be found to pick up where my challenge leaves off.
Or else we can just wait and see whether the EESU is revealed in the CityZenn car by Christmas. If it is, then I warn you, our lives may never be the same.
Please Gail et al, try investing a couple of hours in the two links I gave and then post your rebuttal :-)
ei - I think you make some good points. We are to some extent saddled by our past intent and the expertise of volunteer staff we have on board.
Your comments about renewable energy and energy storage are spot on and that's an area we should be looking into.
Thanks Euan,
There is always good stuff on this site (including today's features) and I look forward to more on storage and renewables in the debate.
EI: I don't follow too much that happens here (I'm only responding to you because of a note via mail), but some of us have paid attention to EESTOR. I can also tell you that EESTOR isn't the only game in town; there are multiple demonstrated technologies out there which are good enough to shove the ICE into the background for ground transportation power. We don't need to replace it, just make it the second choice and knock it down to a fraction of the total energy supply. It doesn't matter if this is barium titanate supercaps, some lithium-ion chemistry, Firefly Energy's 3D² or a return to the "proton polymer battery" which was announced some time ago and just as quickly vanished; one is all it takes.
I awake this morning to find 8 comments deleted on the thread. The first point is that I didn't delete any of them, though I'm quite happy for my co-editors to have done so. But I find it strange that a simple post analysing predictions made about peak oil over 10 years ago should generate so much "venom". The comments were deleted in order to keep the thread on topic and civil and I am therefore wary of responding at all.
I agree that the methodology is opaque. This can produce two different types of response:
1. The methodology is opaque and this undermines completely the conclusions of the paper. Not only that it undermines everything the authors have ever written.
2. The conclusions of the paper are broadly accurate - hell we need to find out more about the methodology.
The authors left an open invitation for other workers to use their Program - but that was 10 years ago and back then both were already quite old. I will nevertheless write Walter Youngquist to see if he can provide more insight to the methodology employed.
Is Richard Duncan that old? I would bet he is in his 60's.
Several years ago I did try running his program and downloaded a free version of Stella. I didn't get much anywhere, perhaps partly because Stella may have been hampered by resource limits :)
Inscrutability is not a plus in this domain.
It seems like someone told me Walter Youngquist is 87. I met him, and that would seem about right.
That must have been over a year ago.
Lacking expertise in statistics I just read and think about most of the posts dealing with these decline rates.
But one thing that bothers me is that there must be statistical "marginal barrel of oil" that can be easily done without just as you can do without the last marginal beer or hour of free time or whatever without too much pain.
Living in one of the poorer areas of the US I see plenty of marginal barrels abandoned already-there are lots of 4x4 trucks,ski boats,and hot cars for sale cheap.
Small fuel efficient cars that are old enough to have been five hundred dollar clunkers two or three years ago are now that much older and have morphed into thousand dollar cars "that will get you to work."
So "demand destruction "is easy enough to understand,eccept for this one point:
Every barrel not burnt raises the PROPORTION of the remaining barrels that goes to support critical infrastructure and ESSENTIAL economic activity,from food production and delivery to keeping the refrigerator on that keeps your food edible.
When does demand destruction run into the "uttery essential" wall?
My guess is "sooner than most would think",given the many positive feedback loops that will develop as economic activity declines-these loops having of course undesirable effects in nearly all cases in my estimation.
For instance income from lost jobs,and the tax revenue from those jobs,will decline much faster than savings can grow from carpooling.
And regardless of who controls the congress and the white house,there will be riots in the strees long before we get to the point that most people are eating on food stamps.We are not the same people we were in the nineteenthirties,and we will throw purple faced hold our breath tantrums as a people just as fast as any two year old when the time is ripe.
Is anyone here working on hypothetical energy survival budgets for the next five years or so?
I don't see how we could really make much progress converting our transport system to natural gas in any less time,or make any other large scale "doable now"near term changes any quicker.
And if the riots start before we can adjust,the fig leaves of democracy,stability,etc,used to dress our armies in the middle east may necessarily be abandoned for straight up BDU.
In the ELM concept (showing in real world data), in post peak exporter nations the domestic market is 100% satisfied and the export market takes the full supply drop, thus importers struggle to afford all the oil they need with severe economic consequences for them.
I suspect that a similar model applies in all importing nations suffering declining ELM supply post world peak - certain categories of domestic demand will get 100% of all they need (military, emergency vehicles, air force one and agriculture come to mind) and Joe Public's % of demand gets to take the whole supply shortfall - a sort of ELM2. Do you think Joe is going to be happy about that?
Well there is also a secondary ELM in finished products don't forget oil has to be refined. The refineries are not evenly distributed and differ significantly in how they work and the oil they can handle. Thus we actually have a double ELM.
Oil ELM from oil exporting nations and Product ELM from refining/finished product exporting nations.
Although the exact situation is not clear we can expect that the finished product ELM situation will amplify the oil ELM with at first oil exporting countries satisfying local demand or getting the lions share of finished product exports. Then the refining nations getting all the oil they need with the nations dependent on finished product imports left in a precarious situation.
Whats really interesting of course is that the US happens to be completely dependent on gasoline imports at the current demand levels.