Oilwatch Monthly June 2009
Posted by Rembrandt on June 16, 2009 - 10:07am in The Oil Drum: Europe
The June 2009 edition of Oilwatch Monthly can be downloaded at this weblink (PDF, 2.0 MB, 28 pp).

The Oilwatch Monthly is a newsletter that is available free of charge with the latest data on oil supply, demand, oil stocks, spare capacity and exports. Readers who want to receive the Oilwatch Monthly in their e-mail box each month can subscribe at this weblink, by filling in their first name, last name, email adress and selecting Oilwatch Monthly in the mailing list box. To finalize your subscription push the 'inschrijven' button below the form.
A summary and latest graphics below the fold.
Latest Developments:
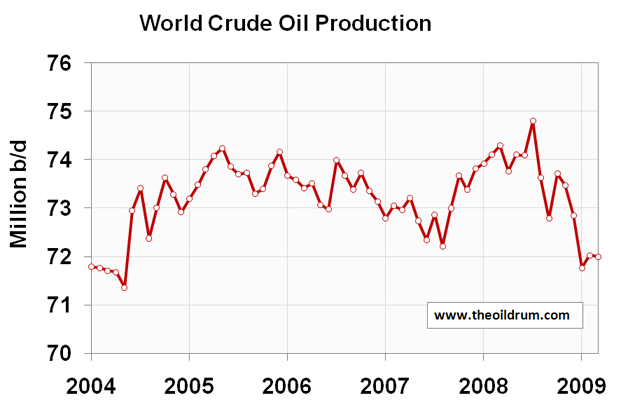
1) Conventional crude production - Latest available figures from the Energy Information Administration (EIA) show that crude oil production including lease condensates decreased by 34,000 b/d from February to March 2009, resulting in a total production of crude oil including lease condensates of 72.00 million barrels per day. The all time high production record of crude oil stands at 74.80 million b/d reached in July 2008.
2) Total liquids production - In May 2009 world production of total liquids decreased by 220,000 barrels per day from April according to the latest figures of the International Energy Agency (IEA), resulting in total world liquids production of 83.67 million b/d.
Average global production in 2009 up to May was 84.13 million b/d. In 2008 and 2007 an average of respectively 86.59 and 85.41 million b/d was produced. The US Energy Information Administration (EIA) in their International Petroleum Monthly puts average global 2008 production at 85.46 million b/d and average 2007 production at 84.43 million b/d.
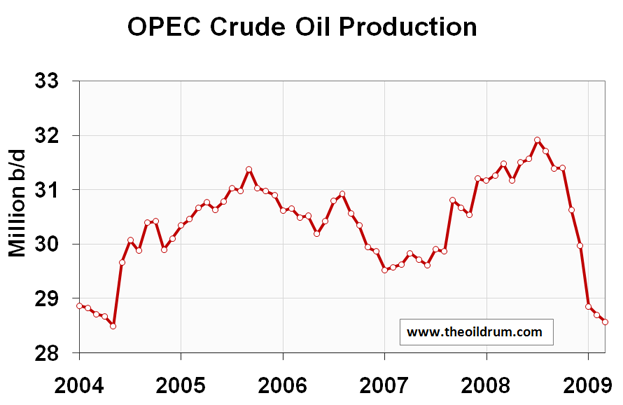
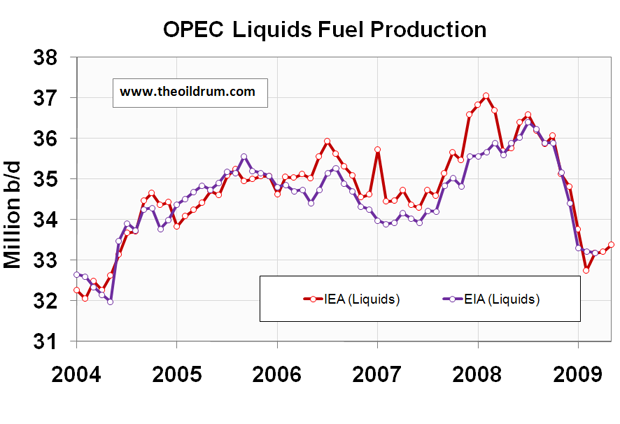
3) OPEC Production - Total crude oil production excluding lease condensates of the OPEC cartel increased by 170,000 b/d to a level of 28.39 million b/d, from April to May 2009, according to the latest available estimate of the IEA. OPEC natural gas liquids production remained stable from April to May at a level of 4.99 million b/d. Average total liquids production in OPEC countries in 2009 up to May was 33.25 million b/d, versus 36.09 million b/d in 2008, and 35.02 million b/d in 2007.
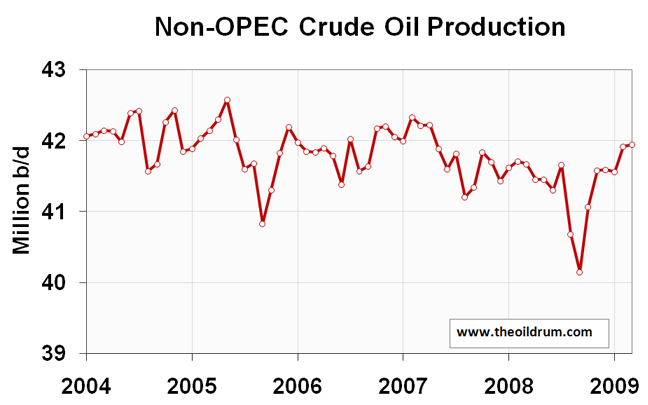
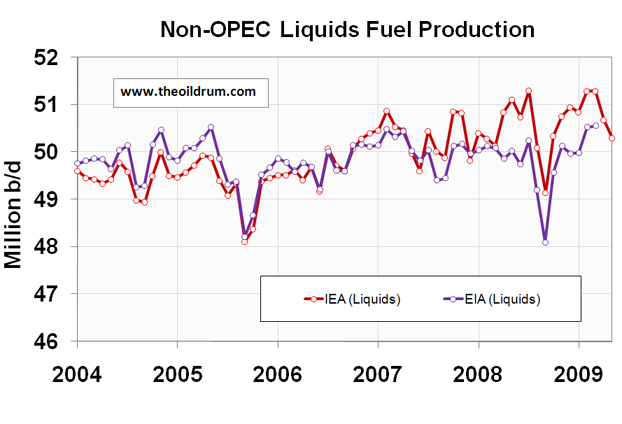
4) Non-OPEC Production - Total crude oil production including lease condensates of non-OPEC increased by 26,000 b/d from February to March 2009 to a level of 41.95 million b/d, according to the latest available estimate of the EIA. Average crude oil production of non-OPEC in 2008 was 41.31 million b/d, versus 41.80 million b/d in 2007 and 41.87 million b/d in 2006. Total non-OPEC liquids production decreased by 390,000 b/d to a level of 50.29 million b/d from April to May 2009, according to the latest figures of the IEA. Average total liquids production of non-OPEC up to May 2009 was 50.87 million b/d, versus 50.5 million b/d in 2008, and 50.41 million b/d in 2007.
5) OECD liquids demand - No update from previous month
6) Chinese & Indian liquids demand - No update from previous month
8) OPEC spare capacity - Total OPEC spare production capacity increased to 4.34 million b/d in May 2009 from a level of 4.32 million b/d in April according to the Energy Information Administration. Of total spare capacity 2.65 million b/d is estimated to come from Saudi Arabia, 0.24 million b/d from Qatar, 0.33 million b/d from Angola, 0.30 million b/d from Kuwait, 0.30 million b/d from the United Arabic Emirates, 0.10 million b/d from Iran, and 0.42 million b/d from other countries.
According to the International Energy Agency total effective spare capacity (excluding Iraq, Venezuela and Nigeria) decreased to 4.96 million b/d in May 2009 from a level of 5.13 million b/d in April. The IEA estimates Saudi Arabia to be capable of producing an additional 2.95 million b/d within 90 days, the United Arab Emirates 0.60 million b/d, Angola 0.36 million b/d, Iran 0.28 million b/d, Libya 0.23 million b/d, Qatar 0.14 million b/d, and the other remaining countries 0.40 million b/d.
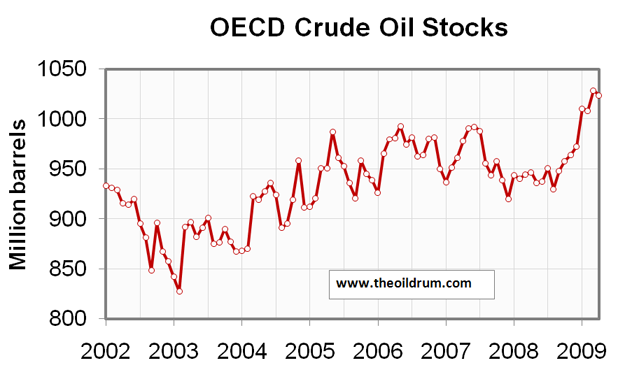
9) OECD oil stocks - Industrial inventories of crude oil in the OECD in April 2009 decreased to a level of 1024 million barrels from 1029 million barrels in March 2009 according to latest IEA statistics. Total industrial product stocks in the OECD were 1434 million barrels in April 2009, an increase of 13 million barrels from March. Total product stocks are slightly higher than the five year average of 1390 million barrels.
Personnel
Editors
Contributors
Peak Oil Primers
Archives
- November 2010 (3)
- October 2010 (6)
- September 2010 (4)
- August 2010 (7)
- July 2010 (6)
- June 2010 (7)
- May 2010 (2)
- April 2010 (8)
- March 2010 (4)
- February 2010 (6)
- January 2010 (3)
- December 2009 (5)
- November 2009 (8)
- October 2009 (12)
- September 2009 (6)
- August 2009 (5)
- July 2009 (11)
- June 2009 (8)
- May 2009 (16)
- April 2009 (10)
- March 2009 (7)
- February 2009 (10)
- January 2009 (15)
- December 2008 (9)
- November 2008 (9)
- October 2008 (9)
- September 2008 (13)
- August 2008 (10)
- July 2008 (14)
- June 2008 (23)
- May 2008 (16)
- April 2008 (12)
- March 2008 (16)
- February 2008 (9)
- January 2008 (13)
- December 2007 (13)
- November 2007 (16)
- October 2007 (22)
- September 2007 (8)
- August 2007 (9)
- July 2007 (16)
- June 2007 (8)
- May 2007 (7)
- April 2007 (7)
- March 2007 (10)
- February 2007 (10)
- January 2007 (12)
- December 2006 (9)
- November 2006 (15)
- October 2006 (4)
- September 2006 (5)
- August 2006 (5)
- July 2006 (9)
- June 2006 (5)
- May 2006 (10)
- April 2006 (9)
- March 2006 (13)
Vital Trivia
License

This work is licensed under a Creative Commons Attribution-Share Alike 3.0 United States License.
Rembrandt,
Thanks again for your efforts producing a quality 28 page report including 129 charts!
From your Chart 112, do you think that Canada's crude oil production, including oil sands, has passed peak in Aug 2007?
According to the EIA, Canada's crude, condensate and oil sands production in 2007 was 2.616 mbd; 2008, 2.596 mbd; and 2009 YTD Mar, 2.642 mbd. The peak month so far is Aug 2007 at 2.795 mbd.
http://www.eia.doe.gov/emeu/ipsr/t11a.xls
Colin Campbell's forecast, from his Dec 2004 newsletter, is shown in the chart below. He shows a peak of just over 3 mbd in about 2020. However, the delays and suspensions of oil sands projects might mean that the peak passed in Aug 2007.
http://www.energiekrise.de/e/aspo_news/aspo/newsletter048.pdf
The June 2009 report from the Canadian Association of Petroleum Producers shows a forecast of over 4 mbd by 2025 but if further oil sands growth does not occur then Canadian oil production may struggle to exceed 3 mbd.
http://www.capp.ca/getdoc.aspx?DocId=152951
Here's a few forecast charts updated for last week's energy reports from the EIA, IEA and OPEC.
Assuming that a slight demand growth occurs, the long term oil price trend remains upward shown by the dashed green line below.
The largest part of world liquids supply is crude, condensate and oil sands production. The Jun 2009 estimate is 71.3 mbd which has increased slightly from the previous estimate because OPEC has increased production slightly.
A significant part of world crude, condensate and oil sands production comes from about 90 non OPEC countries. These countries are not subject to production quotas and although oil prices more than tripled from 2003 to mid 2008, production declined at about 0.2 mbd per year. Cumulative declines from Russia, the North Sea and Mexico will be a key factor in accelerating the non OPEC production decline rate to an estimated 1.4 mbd per year starting from Dec 2008.
The production declines in the above two charts are supported by the downward trend in capacity additions to 2012 based on data from http://en.wikipedia.org/wiki/Oil_Megaprojects which has been updated for the recent IEA G8 report detailing 2.0 mbd of suspended project capacity and a further 4.2 mbd of project capacity delayed by at least 18 months.
http://www.g8energy2009.it/pdf/IEA_Paper_for%20G8-Impact_of_the_crisis_o...
Non OPEC capacity additions also show a downward trend to 2012.
For more information on world oil forecasts, please read my post last month
World Oil Production Forecast - Update May 2009
http://www.theoildrum.com/node/5395
Hello Rembrandt & Tony [ACE],
As usual, my thxs to both of you for this important work.
Ace, in reference to basically horizontal black line of the "adjusted EIA AEO 2009 forecast" in your second Non-OPEC C&C chart: do you know if the EIA includes the Wiki-Megaprojects info in their analysis and forecast, or do they have their own in-house version?
You would think the forecasted 2009-2012 discrepancy between your downward trend and their flatline would be much narrower for such a short 3-year period ahead. Eyeballing about [EIA 41.5, ACE 36.0] for roughly a 5.0+ million barrels/day gap in 2012. It will be fascinating to see how this plays out going forward.
Even if the EIA just extended the less-sloping, historical, dotted red trend line forward: it still appears that they might be 500,000 to 750,000 barrels/day too high. IMO, they should have made some allowance for some hurricanes or other event, or a bad economic or political trend, to 'glitch' their forecast downward so that it more closely resembles your future trend. My feeble two cents.
Bob Shaw in Phx,Az Are Humans Smarter than Yeast?
Bob,
I believe that the EIA has their own project list which is supplied by IHS(CERA). IHS use low decline rates for the existing production base.
That 5 mbd gap in 2012 between my forecast and the EIA AEO 2009 is large. However, the EIA has some optimistic forecasts. For example, liquids production from the US is forecast to increase from 8.49 mbd in 2008 to 8.91 mbd in 2010. The Former Soviet Union and Eastern Europe is forecast to increase from 12.76 mbd in 2008 to 13.09 mbd in 2010.
http://tonto.eia.doe.gov/cfapps/STEO_Query/steotables.cfm?tableNumber=29...
My models use a combination of decline rates, extraction rates and remaining recoverable reserves to forecast for each non OPEC country. All the non OPEC forecasts are aggregated to produce a total forecast.
Another way to forecast is to apply a decline rate of about 6%/yr to existing conventional non OPEC crude and condensate production of 40 mbd. That means that 2.4 mbd of production additions are needed just to remain at 40 mbd. My non OPEC capacity addition chart shows about 1.7 mbd capacity for 2009. This capacity has to be discounted by about 20% to estimate the annualised production additions from the projects to give about 1.4 mbd non OPEC production additions for 2009.
That's 1 mbd less than the required 2.4 mbd so that means a 1 mbd production decline for 2009 assuming no unplanned maintenance, hurricane outages, terrorist attacks on oil infrastructure or any other supply interrupting events.
I'm sure that the future non OPEC production will be closer to my forecast than to the EIA's.
Tony
Thxs for the reply, and I agree that your forecast will probably predict future production more accurately than the EIA forecast. They should hire you to help steer them straight, LOL! :)
"Rockdoc123" at peakoil.com says part of the IHS staff keeps tabs on new projects, compiling data in exhaustive detail, as you might expect. This of course isn't available for free like the Wiki.
What is the typical time line for a project's discovery/development, anyway? Tupi is taking 4 years, is that par for the course, or could project startups be announced this year that will see first oil in 2011? This is something I can't recall seeing analyzed here. The impact of new semi subs and drillships should be taken into account as well.
As you probably suspect Dude there’s a wide range depending on specifics. Here’s a time line that wouldn’t be the fastest but it many cases this would be a quick development program. Discovery logged 1 Jan Year 1. Before any detailed planning for facilities and additional wells at least one confirmation well will be drilled. The CF well might be drilled in the next few months but given how rigs are scheduled it would likely be a year before its spudded. So on 1 Jan Year 2 CF is spudded. Well logged in 6 months confirming pay. To confirm reservoir deliverability tests must be conducted. So 1 Jan Year 3 tests begin. Add 4 months for tests. So 1 June Year 3 begin design of production facilities. So 1 Jan Year 4 design complete and bids let (this would be really fast). So 1 June Year 5 production facilities completed (very fast track). So 1 Nov Year 5 facilities set on location. During Years 3 and 4 the development wells might have been drilled subsea and temporarily abandoned. Assume a total of 4 wells. So by 1 Jan Year 6 developed wells tied into production facilities. So by 1 June Year 6 wells are completed and begin producing (again, this was done very quickly by normal standards).
Bottom line: 4 or 5 years wouldn’t be a surprise. Maybe a year quicker but maybe it might take an extra 2 years. Again, just one possible timeline.
Thanks ROCK - figured you might chime in. Analysis of past project timelines would make for a juicy article, including a chart with Kashagan as your outlier. Or kerogen. How long has that been "delayed" now, 120 years?
Actually parsing the 2006 Discoveries List from IHS I can't find any correspondence in the Wiki Megaprojects. Perhaps some of these are halfway through your timeline and will surprise us soon with fresh production?
For our (Brown & Foucher) update to the top five net oil exporters paper, we are planning to look at cumulative remaining net oil exports versus annual export rates. A rough outline follows:
15 Gallons of Fuel in the Tank
Assume a car gets 20 miles per gallon, with a 15 gallon tank, and we embark on a five hour trip at 60 mph, using 3 gallons per hour. So we have five segments of one hour each.
(A)= Percentage of remaining fuel used in each one hour segment. (B) = Fuel used in each segment (always 3 gallons in this example). (C) = Remaining fuel in the tank at the start of each one hour segment. A = (B/C) X 100.
So, for the five segments we have:
(1) 20% = 3/15
(2) 25% = 3/12
(3) 33% = 3/9
(4) 50% = 3/6
(5) 100% = 3/3
We are of course out of fuel at the end of segment five, when we use 100% of remaining fuel in the tank. Note that the depletion rate increases with time.
Indonesia
Based on EIA data, from 1997 to 2003 (their last year of positive net oil exports), Indonesia (net) exported 1.148 Gb, a little over a billion barrels of oil, or 1,148 mb. So, their remaining cumulative net oil exports at the end of 1996 were 1,148 mb. We can of course very simply calculate the remaining cumulative net oil exports at the start of each year (C), and calculate the percentage of remaining cumulative net oil exports shipped in a given year (A), by dividing annual net oil exports (B) by (C) (X 100). The data look like this:
End of 1996/Start of 1997: 1,148 mb in "Net oil export fuel tank"
1997: 21% = 243/1,148
1998: 29% = 259/905
1999: 34% = 221/646
2000: 42% 180/425
2001: 53% = 130/245
2002: 68% = 78/115
2003: 100% = 37/37
2004: Net Oil Importer
Indonesia's net export fuel tank, based on annual data, was empty as of the end of 2003. Note that the depletion rate increased with time.
Top Five Net Oil Exporters (Saudi, Rus., Nor., Iran, UAE)
Based on EIA data, the 2006 to 2008 cumulative net oil exports from the top five fell between Sam's middle case and best case. If we average his middle case and best case projections for post-2005 cumulative net oil exports, we get 117 Gb. The EIA shows the following for annual net exports from the top five (2005 was about 8.8 Gb):
2006: 8.5 Gb
2007: 8.0
2008: 8.2
Using 117 Gb for post-2005 cumulative net oil exports for the top five, the percentage numbers would look like this:
2006: 7.2% = 8.5/117
2007: 7.4% = 8.0/108.5
2008: 8.2% = 8.2/100.5
2009: 8.7% = 8.0/92.3*
*Estimated for 2009
At the end of 2009, based on the above numbers and based on 117 Gb, the top five will have shipped about 28% of post-2005 cumulative net oil exports.
All of this is somewhat analogous to starting off with a full tank of gas and driving until you run out of gas. At the start of the trip, the tank is 100% full. At the end of the trip, the tank is 100% empty, but the point is that even as the volume of net oil exports shipped tends to decline, it appears that the percentage of remaining cumulative net oil exports shipped per year, i.e., the net export depletion rate, tends to increase with time.
The amount actually exported differed from year-to-year thus:
-16
38
41
50
52
Not a very wide band. This perhaps ties in with my question about project timelines - this would be a slow enough rate of decline of exports to send a signal to procure new supplies. If you'll pardon me putting on my economist hat...
We have a globe full of drivers wanting to use that 3 gallons, too. Perhaps another metaphor might suggest itself. When do you calculate that will become an inevitable point of contention? 70s oil shocks suggest only about 2 mb/d will suffice to have populaces glowering.
The numerator in each example is the volume of fuel used or oil exported. Which example are you referencing?
Indonesia, as listed above. The decline in volume was linear, it's only from the perspective of "remaining cumulative net oil exports" that the decline grows like you suggest. This was what JD was griping about on his blog. Anybody with half a brain (declining exponentially even) could read the writing on the wall, of course.
On the subject of framing, how about classing the global decline rate as a massive collection of "negaprojects"? Kudos to Amory Lovins, of course. And me. Heard it here first.
In 2000, note that Indonesia was shipping one percent of remaining net oil exports about every nine days. Based on Sam's modeling, the top five are currently shipping one percent of remaining net oil exports about every 45 days.
When you put it that way it sounds really morbid - like discussing what percentage of beats remaining in your life your heart pumped out for the day...
Thanks for the replies Jeff, great work you and Sam do. Trying to get a handle on what this year will be like, posting stuff in the peakoil.com Weekly US Petroleum and NG Supply Reports 2009 thread off and on, looking for little bolts from the blue that might let us know what the rest of the year will be like - maybe another price spike in the works? That would make for one apocalyptic October in the finance world.
The June trend for price has already exceeded your expectations, I think:
Added a bar line for $75 USD. $68.37 June average so far.
Yes, thanks, Rembrandt.
And especially thanks for putting the crude oil charts toward the top (we are not, after all, "The Liquids Drum"). They are dramatic. How much of the drop in OPEC production is really voluntary, do you think?
All of it.
So we should expect to see new production highs once price ramps up enough?
And in related news, the Texas Railroad Commission confirmed that due to market conditions, they were continuing their 37 year policy of voluntary production cuts.
But seriously, the point that we are going to stress in our update to our top five net exporters paper is that depletion marches on, regardless of flow rates, and the volume of oil that exporters will ship is very much front end loaded, e.g., Indonesia went from final production peak to net importer status in eight years. But in just the initial two year decline period, they shipped 44% of their post-1996 cumulative net oil exports, shipping one percent of post-1996 cumulative net oil exports about every 17 days in this initial two year period, even as they showed a year over year increase in net exports in 1998, versus 1997.
Sam's modeling suggests that the top five net oil exporters are currently shipping one percent of their remaining cumulative net oil exports about every 45 days or so.
And consider three of four largest sources of imported oil for the US--Canada, Venezuela, and Mexico. Their combined net oil exports fell from 5.3 mbpd in 1998 to 4.0 mbpd in 2008. By the end of this year, I estimate that Mexico will probably have shipped about 90% of their post-2004 cumulative net oil exports.
If your right and I'm right then net exports are ....
I don't see any sense in doing this calculation.
Net exports are falling off a cliff. This actually fits what I think I'm seeing production and exports are changing so rapidly the world can't even collect the data fast enough.
For example world oil production is supposedly down only a little over 2mbd yet we have crashed our economy and in less than a year oil is back over 70 a barrel. The fact that none of our data points are actually self consistent indicates that the underlying real situation is changing faster than the information can be collated.
Not to mention and extreme reluctance to actually tell the truth about your current production status.
You fellows might enjoy these graphs of US Product exports I just cooked up:
US Products Exported - well, the top 4 anyway:
Total Products - I mean it this time - by Destination:
Crazy big shipments to Mexico last year. Bring on that refinery yield, Señor!
Original Post.
I Can't see the right side data
Which data can't you see? Can you describe the problem a little more fully?
Depending upon what browser you use: Use "view", or "zoom out", etc, in your browser toolbar to resize the page so the right side in now visible.
fantastic report
what we really need is an equivalent report for Nat Gas
.pdf isn't loading for me. "They want to deliver vast amounts of information over the Internet. And again, the Internet is not something that you just dump something on. It's not a big truck. It's a series of tubes." - Alaska Senator/convicted felon Ted Stevens.
I understand the server that it is on is temporarily down. Please try again later.
Now it's working. " The Internet is just a world passing around notes in a classroom." - Jon Stewart
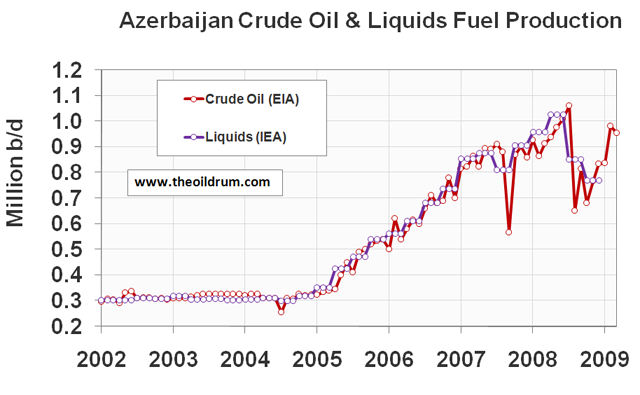
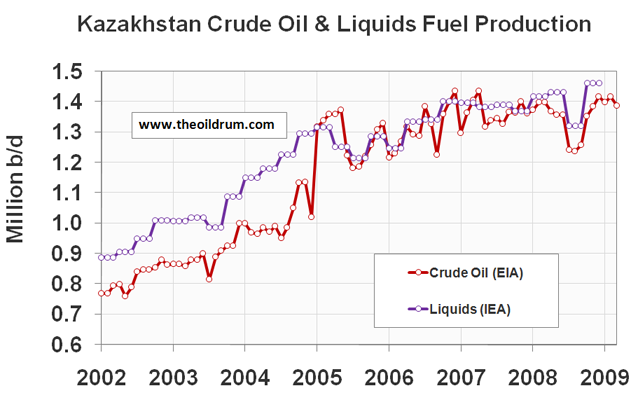
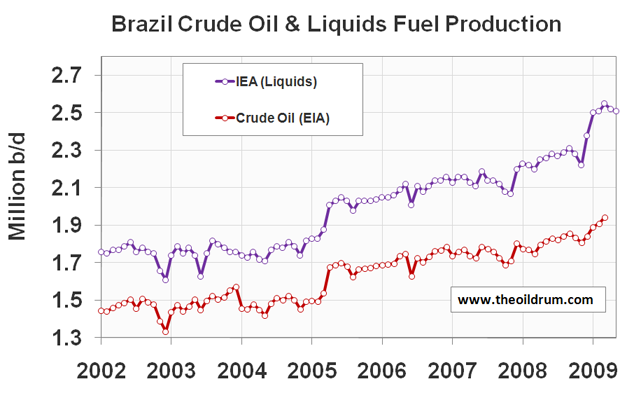
Brazil liquids at Canada levels is an eye opener-it implies that ethanol properly sourced has a bright future.
Ethanol production in Brazil is not being properly sourced because they are consuming stored up resources as they destroy rain forest. Also working conditions are atrocious: The High Price of Clean, Cheap Ethanol, Spiegel Online, January 22, 2009.
Does anyone else see anything strange in Charts 69, 70? These charts are for Yemen. In chart 69 it looks like production peaked in 2000-2003 at 0.45 mbpd decreasing to 0.33 mbpd in 2007. Chart 70 for Yemen has a plateau between 0.70-0.80 mbpd for 2005-2009.
Thanks Rembrandt! Your PDF is spectacular. Recommended.
Huge drop in the consumption of oil!
Actually, based on total liquids, the average so far of 09 (84.13 mbd) vs. the average consumed for 07 & 08 (86 mbd) is only down 2.17%. For all the banter about demand destruction, it seems like a small percentage drop. I wonder if some other factor besides reduced consumption was the cause of the big drop off in price. Maybe it was more like the world economy suddenly dropped like a stone, that scared oil investors away?
Or maybe, at 73-74 mbd, the marginal barrel has a very high cost/price.
I posted this here since I think its more relevant to this thread.
http://www.theoildrum.com/node/5499#comment-511506
http://www.tsl.uu.se/uhdsg/Publications/MDRM_article.pdf
I think one problem with this approach is for long lived fields redeveloped using advancing technology the real R/P ratio is probably a lot lower then most people estimate.
In a sense older fields get pulled forward in time with R declining and P increasing until they hit the techical maximum.
Think of it like the reverse of refinancing a home loan you have paid down for ten years for a new 30 year loan. You get a lower payment but your pay off moved out 10 more years as the loan term restarts.
So as fields are redeveloped your effectively resetting the R/P ratio to the maximum of the ability of the technology at that time.
Couple this with discovery going well into the past and the dominate factor in future production is redevelopment of existing production using newer technology.
What this tends to do is effectively bring the start production dates of fields closer together in time if you treat redevelopment as a sort of restart of production. In a sense as the region ages its production profile approaches that of one giant field.
The US in a sense dodged the bullet on this by allowing private individuals to develop marginally productive and often financially negative oil resources. We often develop oil resources that eventually turn out to be net money losers. Same with NG for that matter. As and example California's gold production is still not zero even though its over 100 years since the first gold rush.
Also in the US you have ever more marginal production sold to smaller player willing to work them for marginal and in many cases no net profit. This works well in the US as the smaller players often tap newer technology that would the larger players where unwilling to use on the smaller field. In effect in the US what you get is a field depleted at a fairly fixed technical level till well after alternative approaches are viable just not cost effective for the larger firms. So far in the US this system has managed to allow a slow decline but if you dig its more correct to see it as one that actually delays implementation of technology advances in many fields the exact opposite of my thesis for the world. The North Sea which is a tougher environment is also starting to follow this pattern with smaller players finding it profitable to redevelop fields played out at a certain technical level. Its not clear that this will be as successful in the North Sea as it was in the more benign US environment.
Going back out to the world which is in general not positioned to do basially mom and pop extraction what you see are more sweeping redevelopment of larger fields to get production up. The poster child is of course Cantarell.
I'm arguing that world oil production actually has approached the R/P(min)
So R/P(min) for a region ==> R/P(min) for the fields.
If you look on page 14 you see a nice indication that asymetric decline is possible.
With my approach a slow regional decline as a region ages is not a good thing.
This is demonstrated on page 15 :)
Given my assertions then one would expect global production to effectively follow field production which is a long platuae period to 70% depletion then a steep drop. Given overall world production is heavily influenced by political events and financial factors until right at the end its much better to consider global production capacity not actual production values. Indeed world production capacity has held remarkably constant for about 30 years. If demand and political issues where correct the world could have readily produced at its current rate at any point in time in the last 30-35 years. Above ground factors serve to delay the onset of peak but also work to allow more advanced technology to be used when they are resolved.
However even for the US one day the party ends - the recent high oil prices revitalized the US oil industry and the spurt of redevelopment effectively reset the US clock on last time.
The sort of maximum R/P is fairly well known and its about 10 i.e reserves are depleted in ten years.
Also on a field level production generally declines when your 70% depleted. This suggests that the world
is 70% depleted of reserves accessible with our current financial and technical models. Given that technology
is now well advanced we would expect that it is now a limiting factor.
Looking at the world production graph in my opinion we hit R/P 10 for the world in 2003-2004.
This implies rapid decline 6-7 years later. If we have another massive wave of redevelopment then it will reset the R/P clock back to 10 but at I estimate 70-50% of our current production. I don't think this last wave is relevant for our civilization and probably improbable for political and financial reasons.
Certainly more reserves exist but your on a treadmill at the global level I seriously doubt you get the fairly smooth decline you have seen in the US with R/P staying at 10 for so long instead your now in the field case.
The US itself should also finally be toast.
Whats funny is on page 20 of the paper they test my assertion i.e that a R/P of proved or running R/P of 10 equations to a R/P fixed of 70 and they get EXACTLY what I'm suggesting i.e production collapses immediately.
However I prefer to explain it as 1250-1500GB of what I call fast oil or good oil. This is the amount of oil we know came from valid original discoveries not questionable reserve expansion.
It gives the same anwser i.e R=1250 R/P(min)=30 ==> R=1248 R/P(min) = 70 + 800GB R/P(min) 30
Thus the mistake they are making are there are really to major post peak periods then end of "fast" oil and high production rates which hits with a bang collapsing production and technically but politically questionable extraction of the remaining 500-800GB of marginal and very expensive oil bearing formation I'd not call them reserves in the real sense.
Theres my prediction basically that Red line :)
memmel -- Excellent point about the micro-operators resisting new technology. My project to horizontally redevelop a coastal Texas play with over a billion bbls of residual oil runs into exactly that problem. These operators can't afford the wells but are also generally unwilling to sublease their acreage for fear the effort could harm their existing cash flow...cash flow that's paying the mortgage and the truck note. A few fields are still owned by large independents but they resist for a similar reason: they're worried about liability should my effort cause problems. Thus the most logical approach is to buy a field. But the little guys won't sell at anything close to a reasonable price because many properties function almost like an annuity. And the big guys don't want to spend time dealing with you. And they often have large (perhaps inflated) booked reserves for a field and don’t want to loose the paper barrels.
But I've proved that I could go into a field making 250 bopd and within one year ramp that up to over 2000 bopd. And in three years perhaps as high as 20,000 bopd. Picture me the poster child for frustration.
Everyone assumes that the US was produced at its maximum production rate this is unproved and if you dig you realize its highly unlikely. Production in the US works to maintain cash flow. We are effectively the slum lords of the oil producing world delaying until the last minute investment.
You know this ROCKMAN in fact everyone in the US oil industry is aware of this. By being conservative on the time axis the US in aggregate has been conservative in its oil production. It does not matter all that much if you use horizontal wells if you delay making the investment for 5 years. For that five year period your not maximizing production. You can replicate that across the entire US.
This makes sense because the US is an early declining region it has to compete with regions with much cheaper production costs thus it delays maximizing production as long as possible to cover development costs.
The same for that matter for Russia.
In general the rest of the world does not do this the political situation is relatively unstable investments are large and the future profits unknown thus maximizing production and thus maximizing immediate cash flow is paramount. In general the oil technology companies are forced to go long and wait to recover their investment its not amortized with costs front loaded. Obviously you want maximum flow rates asap.
Its not surprising that the financial model controls the production model.
You can still use methods like HL or the shock model as I mention below and even use the method I link in the paper to predict future production but I'll repeat you cannot aggregate production history across radical changes in extraction technology. In your particular example its simply wrong to aggregate in anyway the production history of this field pre horizontal development and when/if you finally get them to go horizontal.
And I hate to say this but to be honest they are actually making the right decision if they are willing to set aside a porting of their current revenue for future horizontal development. What they should do is save money and go horizontal when the oil column reaches the point that horizontal is still viable but verticals are not.
I'd argue you would not want me tagging along to your customer meetings :)
I get your point memmel but I didn't offer the details for sake of space. The water level has long ago reached the perfs in these wells. In fact decades ago. The stranded oil lies between the current porducers and will never be recovered by those wells. If all these fields were plugged off tomorrow the potential for increased production would still be there 100 years from now. The vert wells are only making 5 or 10 bopd at a 97%+ water cut. The details are very interesting (for production geeks) but would bore folks here into a coma.
I like your "slum lord" comment. Hadn't thought in those terms but it's quit accurate on a number of levels.
Let me say this is an excellent post, even if I'm not the most qualified to assess it fully.
As your argument is a tad difficult to follow for me (my lack of understanding, not yours), I will try to rephrase it:
1. Assuming the best available technology R/P for mature developed fields is lower than many assume at any
2. This reality should be reflected in a lower R/P(min) assumption (as per the MDRM model in the paper mentioned)
3. One can treat mature developed fields as 'new, but constrained' fields at the beginning of each year by rolling their development time forward to the start of the year (and perhaps new recovery tech) and recalculating R/P.
4. The more aggressive the reset of R/P due to application of the new technology and pushing the fields, the lower the final aggregate recovery sum from the field
5. Combine this with what we know about likelihood of new (undeveloped) reserves, then the likelihood is for harder pushing as the time goes by - assuming demand stays the same or continues to increase
6. All in all, the decline portion of the production curve for a field (and subsequently for the world as a whole) is likely to turn asymmetrically worse by each year (due to all the above assumptions 1-5)
Did I get any of your argument right at all?
I've been thinking about this myself, based on the fine thinking of others here, so it may be that I'm reading my (others') ideas into yours.
Please clarify/shoot this down.
Exactly !
Basically every time you seriously redevelop a field with new technology your effectively dealing with a new field.
See ROCKMAN's comment :)
We have done this over the last several years most often with horizontal wells.
The problem is that this discovery time is tied to when a new technology is ready to be widely deployed.
Thus it brings all the fields where it is used forward in time to a new effective discovery date thats effectively
a delta. The original discovery date and production say from the original horizontal wells is no longer important.
You get the same effect if you produce under natural pressure then later do secondary pressure maintenance.
You get this amazing result that the future production curve depends on how the field was produced :)
Its simply not correct to mix the production history of a field across extensive redevelopment periods.
If you think about it this makes a lot of sense the production curves are radically different and you need to connect them together piecewise its wrong to aggregate.
By aggregating what your doing is placing way way to much weight on the early production history when oil was plentiful a lot of your production is obviously from oil that was far easier to produce than today.
And this is where I'm also in violent disagreement with the oil industry when they redevelop a old field more often than not the bump up its reserve estimate. So not only are they producing a field faster they are also claiming more reserves. This can be seen in the flat US R/P ratio. Which I don't believe but the truth comes only when you hit the last technology dispersion. Think of it as a shock model with dispersion of technology serving to reset the discovery clock to a new lower reserve base in a piecewise fashion with a almost delta discovery model.
Current article link below about comments from James Mulva, CEO of Conoco Phillips, regarding the dangers of regulating carbon, which he says will reduce investment, and in turn dangerously reduce supply.
http://news.yahoo.com/s/afp/20090617/pl_afp/useconomyenergywarmingoil
"Washington's apparent belief that we can choose between renewable energy and fossil fuels is mistaken," he said.
What a paradox we find ourselves in. If we restrict fossil fuel usage to reduce our carbon footprint, we slow the economy and reduce incentives to invest, which will reduce supply and cause harm to the economy. If we use as much fossil fuels as we want, we may cause climate change to spin out of control.
"A find mess you've gotten us into Ollie!"
Backed into a corner, from which there is no clear or easy path out.
Conoco Phillips' new strategy is to blame the effects of peak oil on attempts to reduce fossil carbon emissions. This argument will fool the sheeple.
Lumping people in as sheeple, just because an argument is not to your liking is simple name calling and serves no purpose. Fact is, he may have a point if indeed it reduces the incentives for exploration. My point was we are between a rock and a hard place due to the pros and cons of either using or not using fossil fuels.