Oilwatch Monthly February 2009
Posted by Rembrandt on February 17, 2009 - 10:24am in The Oil Drum: Europe
The February 2009 edition of Oilwatch Monthly can be downloaded at this weblink (PDF, 1.9 MB, 24 pp).

The Oilwatch Monthly is a newsletter that is available free of charge with the latest data on oil supply, demand, oil stocks, spare capacity and exports. Readers who want to receive the Oilwatch Monthly in their e-mail box each month can subscribe at this weblink, by filling in their first name, last name, email adress and selecting Oilwatch Monthly in the mailing list box. To finalize your subscription push the 'inschrijven' button below the form.
A summary and latest graphics below the fold.
Latest Developments:
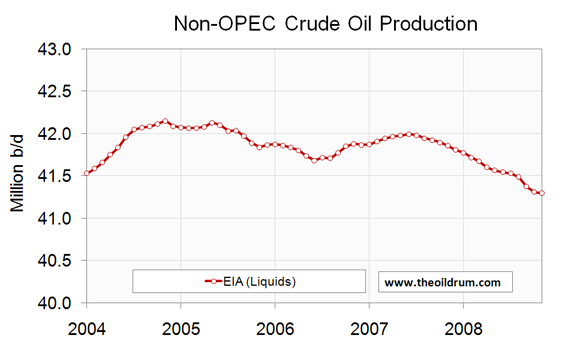
1) Conventional crude production - Latest available figures from the Energy Information Administration (EIA) show that crude oil production including lease condensates decreased by 445,000 b/d from October to November 2008, resulting in a total production of crude oil including lease condensates of 73.36 million barrels per day. The all time high production record of crude oil stands at 74.83 million b/d reached in July 2008.
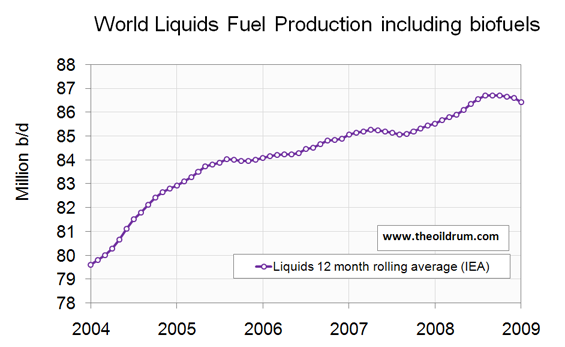
2) Total liquids production - In January 2009 world production of total liquids decreased by 520,000 barrels per day from December according to the latest figures of the International Energy Agency (IEA), resulting in total world liquids production of 85.17 million b/d.
Average global production in 2008 was 86.59 million b/d according to the IEA. In 2007 an average of 85.41 million b/d was produced. The US EIA in their International Petroleum Monthly puts average global 2007 production at 84.43 million b/d and average liquids production from January to November 2008 at 85.57 million b/d.
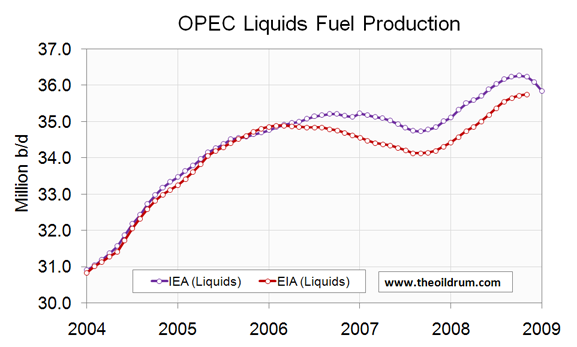
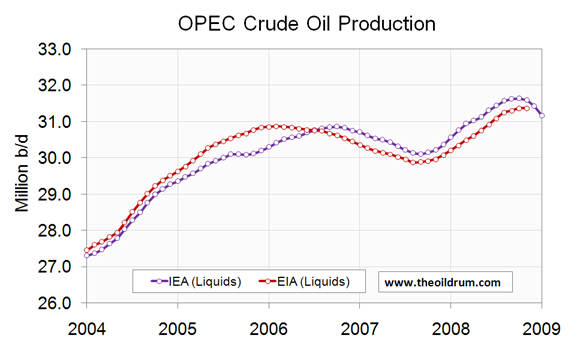
3) OPEC Production - From this month onward Indonesia is no longer counted as a member of OPEC in these statistics, as the country left the cartel at the end of 2008. Total crude oil production excluding lease condensates of the OPEC cartel decreased by 1.0 million b/d to a level of 29.03 million b/d, from December to January 2008, according to the latest available estimate of the IEA. OPEC natural gas liquids production decreased by 100,000 b/d from December to January to a level of 4.68 million b/d. Average total liquids production in OPEC countries in 2008 was 36.09 million b/d, versus 35.02 million b/d in 2007 and 35.13 million b/d in 2006.
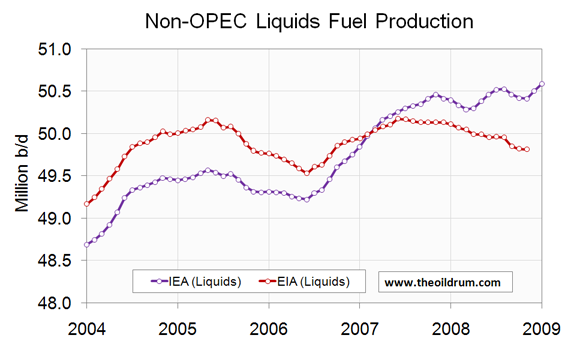
4) Non-OPEC Production - From this month onward, Indonesia is counted as a member of non-OPEC in these statistics, as the country left the OPEC cartel at the end of 2008. Total crude oil production including lease condensates of non-OPEC increased by 403,000 b/d from October to November 2008 to a level of 41.51 million b/d, according to the latest available estimate of the EIA. Average crude oil production of non-OPEC from January to November 2008 was 41.28 million b/d, versus 41.81 million b/d in 2007 and 41.87 million b/d in 2006. Total non-OPEC liquids production increased by 580,000 b/d to a level of 51.46 million b/d from December to January 2008, according to the latest figures of the IEA. Average total liquids production of non-OPEC in 2008 was 50.5 million b/d, versus 50.41 million b/d in 2007 and 49.76 million b/d in 2006.
5) OECD liquids demand - No new data since last Oilwatch Monthly
6) Chinese & Indian liquids demand - No new data since last Oilwatch Monthly
7) World Liquids exports - No new data since last Oilwatch Monthly
A selection of charts from this edition:
Personnel
Editors
Contributors
Peak Oil Primers
Archives
- November 2010 (3)
- October 2010 (6)
- September 2010 (4)
- August 2010 (7)
- July 2010 (6)
- June 2010 (7)
- May 2010 (2)
- April 2010 (8)
- March 2010 (4)
- February 2010 (6)
- January 2010 (3)
- December 2009 (5)
- November 2009 (8)
- October 2009 (12)
- September 2009 (6)
- August 2009 (5)
- July 2009 (11)
- June 2009 (8)
- May 2009 (16)
- April 2009 (10)
- March 2009 (7)
- February 2009 (10)
- January 2009 (15)
- December 2008 (9)
- November 2008 (9)
- October 2008 (9)
- September 2008 (13)
- August 2008 (10)
- July 2008 (14)
- June 2008 (23)
- May 2008 (16)
- April 2008 (12)
- March 2008 (16)
- February 2008 (9)
- January 2008 (13)
- December 2007 (13)
- November 2007 (16)
- October 2007 (22)
- September 2007 (8)
- August 2007 (9)
- July 2007 (16)
- June 2007 (8)
- May 2007 (7)
- April 2007 (7)
- March 2007 (10)
- February 2007 (10)
- January 2007 (12)
- December 2006 (9)
- November 2006 (15)
- October 2006 (4)
- September 2006 (5)
- August 2006 (5)
- July 2006 (9)
- June 2006 (5)
- May 2006 (10)
- April 2006 (9)
- March 2006 (13)
Vital Trivia
License

This work is licensed under a Creative Commons Attribution-Share Alike 3.0 United States License.
Rembrandt - thank you very much once again.
Figure 20 is intriguing showing non-OPEC production hitting a peak - is that an all time peak? Does this include or exclude Indonesia? We could really do to hear from the mega projects guys on the reasons for this mini-spike - Thunderhorse?
And as OPEC cuts just about compensate for the non-OPEC rise, the oil market looks remarkably unconcerned about global turmoil - with the exception that they are not now making enough money to keep the party going.
Can you say if planned OPEC cuts are now fully implemented.
Yes astounding! Non-OPEC production seems to have peaked as early as october 2004! After a 4 years effort to boost production under positive economcial conditions without reaching that level ever again, I suppose that was the all time peak.
Well Jeffery, You seem to have arrived ;-)
Too much honour calling me Jeffrey, I must humbly reject that. ;-)
I applied to join the fan club, but my application was rejected :(
@Euan
OPEC crude oil production decline from October 2008 (month first cut was announced) to January 2009 was 2.25 million b/d. Total cuts announced were 1.5 mb/d in October and 2.45 mb/d in December. So we still will see at least another 1 mb/d cut showing up in February.
Thxs Rembrandt,
I greatly appreciate the Fig. 1 graphic [12-month rolling average of world crude using EIA stats], as it makes the plateau easy to 'eyeball' for the casual observer.
It may also remove a lot of the 'statistical noise' in regards to the sum effect of all FF-consumers & traders & producers; i.e, this rolling graphic may be a better representation of the overall crude market 'actual consumptive sentiment' vis-a-vis supply.
What is interesting to first notice is the first rolling plateau peak of Dec. '06 then the downward production trend to Aug-Oct '07. It would only make sense for crude prices to strongly rise during this period of reduced crude production, but strong demand.
The next rolling phase, upward from Nov.'07 to Jul.'08, would thus seem to indicate generally rising supply and inventories; i.e, one would have expected 'an efficient market' to gradually start plateauing the price during this period [for example: no more than $100/bbl], yet what actually happened was that prices went up even more during this period to the $147/bbl peak of Jul.'08, then crashed to where we are now in the under $40/bbl range.
The last four rolling average dots of '08 [the last mini-plateau] would thus seem to indicate that $40/bbl has unreasonably swung too low in price to our hypothetical 'efficient market'. In your future updates, IF the rolling average crude supply trendline is now downward going forward: IMO, we should expect our 'efficient market' to start gradually ratcheting the crude price back up again.
If the market is truly not accurately informed [Not Efficient], then we may see prices remain too low for too long, then another short-duration superspike as the market quickly responds to late coming data.
Makes one wonder that if we had truly up-to-the-minute, truly accurate real supply & inventory data throughout the entire supply chain [i.e, no historical backward data revisions by the EIA, IEA, and OPEC weeks-to-months later]: perhaps this could help remove some, or most of this pricing volatility whipsaw-effect.
My feeble two cents, but I am interested in what others might think of the merits of this essay.
Bob Shaw in Phx,Az Are Humans Smarter than Yeast?
Unfortunately, the world wide recession means that demand destruction now bedevils oil production figures. So when we see falling production it's hard to know whether to credit supply or demand decline.
True, but the key point is that crude production stagnated, despite historically high nominal oil prices, and I think that almost all of the reductions in production due to lower demand started in the fourth quarter of 2008.
And going back to the Thirties, demand only fell one year, in 1930, rising thereafter. I suspect that 2009 is to the Greater Depression as 1930 was to the Great Depression.
Meanwhile, our middle case is that the top five net oil exporters--assuming a current net export rate of about 20 mbpd--are shipping about one percent of their remaining cumulative net oil exports every 50 days.
BTW, the "Peaks Happen" graph follows (Texas & North Sea peaks lined up with each other). Note that the sharp North Sea decline really didn't kick in until the fourth year after the peak. Mathematically, conventional crude oil reserves worldwide (based on logistic model) were about 50% depleted in 2005--the same stage of depletion the North Sea was at in 1999:
http://www.theoildrum.com/files/TexasAndNorthSea.png
What is significant about the Texas and North Sea peaks is that both regions were developed by private companies, using the best available technology, with virtually no restrictions on drilling--and the initial declines in both cases corresponded to generally rising oil prices. In other words, "Peaks Happen."
Incidentally, the East Texas Field was found in 1930, and the field was so prolific and drilling was so rapid that by the summer of 1931, the field was on track to account for close to one-fifth of world oil production, briefly dropping oil prices down to the 10¢ range, until the state finally managed to limit production. The US was a leading oil exporter in the Thirties, and the primary source of oil for the Allies in the Second World War. But consider the fact that by the time that a child born in 1930--when Dad Joiner found the East Texas Field--had graduated from high school in 1948, the US was a net oil importer, 22 years before US production peaked.
hello westexas,
everytime I see this I have trouble explaining it to others , I guees because I am just an old billy beer keg ( what joe six pack grew up to be :) ) .
"are shipping about one percent of their remaining cumulative net oil exports every 50 days."
is there another way to express this to make it more understandable to IQs 100 people . It is important that they realise that oil for exports is more important than they think.
cheers
Forbin
Our middle case is that the remaining post-2008 combined cumulative net oil exports from the top five are about 100 Gb (from mature basins). At 20 mbpd, they would net export 7.3 Gb in one year, which would be 7.3% of our middle case for remaining cumulative net oil exports. At this rate, they would be at zero net oil exports in 14 years (of course, the net export rate would decline).
Think of it as a fuel gauge. Let's assume that you have a 100 gallon fuel tank in a truck, and you are burning through 7 gallons per hour. Your fuel would be gone in about 14 hours at this rate.
Using this same analogy, the Indonesian "net export fuel tank" would have lasted about five years at their 1997 net export rate (they hit zero net exports in 8 years, as their net export rate slowed).
BTW, 7.3 Gb exceeds the entire recoverable reserves from the East Texas Field, the largest Lower 48 oil field, which was critically important to the Allies' victory in the Second World War.
thanks westexas ,
In the ELM models can we assume that the usage of the country's on oil for it population will actually increase (as can be predicted) but when less exported oil would suggest a lower economic activity for the rest of the world ( importing countries ) and therefore less goods traded with that country. The effect I would have thought would be a lower usage of oil by the exporter's own people as they are hit by economic slow down, still increasing but maybe not at the current extrapolation ?
This would imply that there would be more to export, although maybe not much more....
cheers,
Forbin
Forbin
Maybe WT will correct me but I think the underlying tenet behind the ELM is that oil wealth (ie the ability to export) is so fundamental to economies that this wealth is invariably shared with populace of the country, so they consume more especially as the 'cost' of the oil does not directly affect their balance of payments (is is an off cashflow item) . Much as a farmer will tend to consume some of their own produce.
I like you wonder if it the ELM takes into account the dominance of Oil in state revenues, ie will Mexico or Russia be able to follow the same pattern as their tax revenue is so linked to oil. This was certainly a problem in totalitarian states (Like Romania during Communism when they exported ALL their sunflower oil leaving none for the citizens)
The other factor to consider is not all internal consumption of an "export land" is personal use (we do tend to equate oil consumption with cars), KSA building an Aluminium Smelter, Desalination works, Chemical Plant etc, all consume oil but the 'value added' factor enhances the nation state revenue. Maybe the two uses (productive & lifestyle) compensate due to external correctors.
Neven
I really only proposed the ELM as a simple mathematical model to help me understand how fast net exports would decline given a single digit exponential decline rate and a single digit rate of increase in consumption. I was, and I remain, shocked at how fast net exports decline.
Given the fact that two countries with vastly different rates of increase in consumption--the UK and Indonesia--showed declines similar to the ELM suggests to me that most post-peak exporters are going to show similar declines. In the case of Indonesia, all of their net exports were shipped at average annual oil prices of less than $40.
And of course, if the rate of increase in consumption is high enough, net exports can go to zero, long before the exporting country's production peaks, e.g., the US.
Neven,
You make a good comment in your last paragraph. Why ship the oil some place else to make products? Why not create the industries that consume the raw material which will create jobs for your population and increase your GDP. It is a win win...
Don
Its the not in the interests of the US or other oil consuming nations that these energy-banana republics ever develop this capability. If they can themselves create the things we currently trade for their oil what would we trade, more packaged dodgy debt perhaps?
Nick.
How about "At current supply and consumption rates the oil available for export around the globe will be ZERO in 5000 days, or less than 14 years".
This where my opinion differs from the conventional TOD wisdom. Production in July 08 could NOT have been affected by the high prices. I know this because I know it takes years, if not decades, to find oil, drill holes, hook the holes up to pipes, and get the pipes flowing to a refinery. Thunderhorse took 20 years.
Although prices hit 100 on the first day last year, the price trended down for the next two months and the conventional MSM, EIA, and IEA were fighting over each other to say the spike in prices was over. By the time it started spiking to 147, there was absolutely no way new production could have been found and come online even if Ghawar II had been found underneath Cushion OK.
I don't believe adding the "even at high prices" proves any point due to the huge lags required to bring supply online. Otherwise, I agree with you completely. I'm just hoping to refine the argument.
Of course, from 1998 to 2008, oil prices went up at an average rate of about 20%/year, and prices rose 9 of the 10 years. The largest rate of increase was not 2008; it was 2000.
Trying to get ones head around a lot of data is always tricky but it might help to break it up into 3 major components, about which we can say different things;
1. Non-OPEC conventional oil. Still being produced without voluntary constraint and looks to have peaked with a decline rate likely to increase in the future. A major factor influencing this decline will come from a likely acceleration in the decline of Russian production going forwards.
2. OPEC conventional production. Probably fair to say that this is now at least 3mbpd below capacity - no way the speed of the recent decline should or could be attributed to other factors. Also likely that the higher production level is close to maximum possible given the lack of response at last years high prices. The biggest uncertainty in the whole peak oil story is over OPEC delcline rates going forward. As we don't know the true reserves or field depletion levels this is simply not currently knowable outside OPEC. However, from models on TOD and elsewhere, it may be that the extremes of various guesses only change the timing of OPEC peak production by a few years.
3. Unconventional production. Rising but eroei and costs higher than conventional.
Where does that leave us? Well, for conventional crude we may stay on a bumpy plateau until non-OPEC production has declined by more than the spare capacity in OPEC. If we take this to be 3mbpd and extrapolate the current non-OPEC trend then it looks about 3 years out. For unconventional I honestly have no idea but I can't imagine biofuels continuing to grow at the current rate without pretty dire consequneces. Heavy oil production may continue to grow but it will be slow for both 'size of tap' reasons and economics. Can NGL's continue to grow? Dunno but, again from what I've read, certainly not at the current rate. maybe plateau out a few years from now?
So overall looking at global conventional oil coming off plateau in 3 years time and all-liquids following a few short years later?
OK, maybe just stating a lot of the obvious here but helps to get my own thoughts down and open for critical comment!
TW
Key chart is the Non-OPEC crude.
Back down to pre- 2004 level of production.
That indicates that Non-OPEC is past peak.
If so, then OPEC will have to make up the declines in Non-OPEC.
May work for a while, but not long.
IMO you should assume OPEC has to serve it's own needs first (as already evidenced in the ELM data)... which means maximising profits ... not extra production for non-OPEC shortfalls ... and rapidly falling net exports!
True - Unless Non-OPEC invades OPEC and takes it all.
Certainly a nasty possibility Nowhere. A significant aspect of such potential will be an insufficient supply to meet the needs of all the non-OPECer's. Wonder who'll join who's side?
Yeah, just looking at the top graph of world crude, it looks like we are in the middle of a rolling, wavy plateau. One might think that we could have a number of waves still to come, especially given the mega-projects that are (were?) supposed to come on line in the next few years.
But the steady drop in non-OPEC after '04, even in the midst of sky-rocketing prices, shows that the world now hangs mostly by the one thread of OPEC production.
Unless someone has reason to believe that non-OPEC is set for a big comeback.
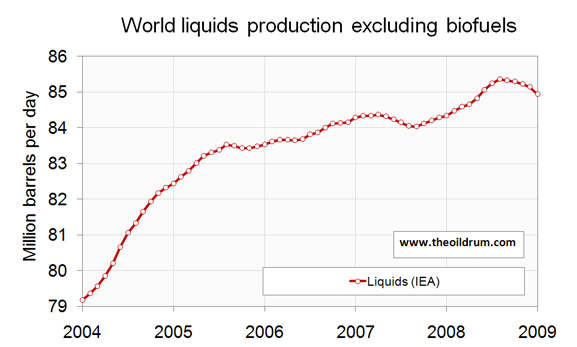
IMHO, we should not be posting "total fluids" charts. Don't they double count, since biofuels use equivalent amounts (at least) of oil in their production? Such charts would seem to serve no purpose other than to confuse the ill informed and give false hope to those willing to grasp at straws.
Just because certain official record keepers spew this non-sense doesn't mean we have to repeat it for them here. But I am more than willing to be corrected if my understanding is faulty here (though x can spare his breath/typing fingers).
I really appreciate using the averaged data. Production figures for any particular date or month are pretty meaningless for considering long-term trends and can be misleading if someone chooses to cherry-pick. Two-year rolling averages may give an even clearer sense of the larger picture.
"total fluids"...Don't they double count, since biofuels use equivalent amounts (at least) of oil in their production?"
No, for ethanol in the US liquid fuels only account for about 20% of energy content. About 60% is natural gas (or, increasingly, coal), for a total of 80% and an E-ROI of only roughly 1.25. You can argue that NG is a transportation fuel, but it's not counted in these charts as a liquid fuel.
We might be better off using the NG directly in vehicles but, of course, the best plan is just replacing liquid fueled vehicles with plug-ins and EV's.
OK, I don't want to spin this thread into yet another endless debate about EROEI of ethanol. But just for clarity, I assume you are just counting energy for the processing at the plant, not the growing of the corn, transportation of the grain...?
But we can certainly agree on your final sentence, though I would prioritize walking, biking and public transport wherever remotely reasonable to do so.
" I assume you are just counting energy for the processing at the plant, not the growing of the corn, transportation of the grain...?"
No, I believe that includes everything, according to Robert Rapier. I don't think there's significant oil consumption in the processing (distillation, etc). I think that diesel is the main liquid fuel input, for the kind of things you mentioned.
"would prioritize walking"
Walking can't replace light vehicles quickly. In the long run localization will help, but vehicles can be replaced 10x as fast as housing.
"biking"
Biking needs large infrastructural investments to be safe for any sustained distance and time. Further, exercise is certainly good for you, but renewably powered electric vehicles are much lower C02, due to the FF-intensivity of our food supply.
Electric bikes are probably the very lowest CO2 transportation. Bicycling purists tend to object to them - I guess it's due to excessive emphasis on exercise, and a lack of awareness of the CO2-related benefits of electricity vs food calories.
"public transport"
Sure, but that's slow. We need fast solutions for the majority of the problem.
That sounds very concern trollish. Of course my 90 year old grandmother won't be riding a bicycle anytime soon. What's with this antagonism towards bicycles and bicyclists?
"What's with this antagonism towards bicycles and bicyclists?"
I like bicycling - I've bicycled thousands of miles. I've also fallen, gotten hit by cars, and gotten injured on a scooter I was testing as a commuting alternative. Any dedicated US bicycler will tell you similar stories.
Bicycles just aren't a sensible large-scale solution in the US, until we invest quite a bit in separate lanes for them, and have a big cultural shift in our attitudes (just a couple of months ago the budget director for the City of Chicago resigned due to the public furor over a shower he installed to assist with things like bicycling). Even then, they won't be as safe as enclosed vehicles, or practical for many people - they don't have to be 90.
Also, it would be nice for people to understand that bicycling does consume energy, and that food calories aren't somehow free and low-CO2. Electricity as a source of transportation energy is underappreciated.
My point? That bicycling (or walking) isn't a major component of practical problem-solving for PO or climate change. It's certainly something we should push for, but it's not likely to be a big component any time soon.
" bicycling (or walking) isn't a major component of practical problem-solving for PO or climate change. "
Well, with attitudes like that, it probably won't be.
Bikes become much safer as cars become less prioritixed.
I agree that e-bikes can play an important roll, but surely they share all the problems you claim for bikes, and then some.
On housing versus cars, people move on average once every five years, last I looked. That has accelerated for a lot of folk who are losing their houses to mortgage scams, etc. We could move quite rapidly to much denser settlement patterns, especially with a bit of planning. People aren't buying cars of any kind very much now, so as much as I like the idea of moving to an electric vehilcle fleet, its not likely to happen soon. The average turn over time for the whole existing fleet of cars is about 17 years--probably longer now that folks don't have cash for brand new cars.
We just have to start education folks and pushing for policies that get more and more people out of their cars.
A year ago anyone in their right mind (mostly) would have told you you were crasy if you predicted that the major investment banks, the beating red heart of American capitalizm, would all be essentially nationalized or closed down in a few months.
"Impossible" things are happening daily now. Saying cars will rule forever or even for another year is just feeding into complacency, holding your mind and others' minds back from thinking about what the next thing could be. The big three are on the ropes. The rest of the industry isn't far behind.
Busses can be built and deployed quickly, so I'm not sure why you see mass transit as having to take so long to develop.
We're moving to a new paradigm, or a set of them. The question, to me, is whether we will be forced there by economic collapse, driven there by spiking oil prices and shortages if there is an economic recovery, or start to plan for a powerdown that could be "so soft and fluffy you'd think you were in a feather pillow."
The beating red heart of American fraud is far more accurate.
"with attitudes like that, it probably won't be."
Don't shoot at the messenger - that doesn't address what I said.
"Bikes become much safer as cars become less prioritixed."
True, but building the separate, protected lanes that are needed is a long-term project. At the moment, bike-lanes are a cruel joke.
"e-bikes can play an important roll, but surely they share all the problems you claim for bikes, and then some."
Sadly, they do, though they're much more accessible for the partially disabled, and people who can't arrive at work all sweaty. I just wanted to point to positive possibilities.
"people move on average once every five years"
I believe that's too high - I seem to remember seven. Also, keep in mind that statistic is dominated by a small minority of renters who move often - most people don't move that often. In any case, nobody's selling their home now if they can possibly avoid it.
"a lot of folk who are losing their houses to mortgage scams"
That's a small %.
"We could move quite rapidly to much denser settlement patterns"
Just because people are moving, doesn't mean more Transit Oriented Development is being built.
"People aren't buying cars of any kind very much now"
Construction is down to 500K homes per year, vs 10M light vehicles. We'll replace vehicles 10-20x faster.
"The average turn over time for the whole existing fleet of cars is about 17 years"
Until recently, cars less than 6 years old accounted for 50% of miles driven. New car sales have fallen less (-40%) than new homes (-60%).
"We just have to start education folks and pushing for policies that get more and more people out of their cars. "
A good idea, but most people don't commute long distances because they're in love with their car: that's the only way they can find affordable housing.
""Impossible" things are happening daily now."
Yes, an "impossible" destruction of the economy. It's much easier and faster to destroy things than to build them - that takes longer. Building a new housing arrangement for everyone will take quite a while - we don't have that much time.
"The big three are on the ropes. The rest of the industry isn't far behind"
Nah. Asian car makes are doing ok - they're not happy, but there's no sign of their failure. Toyota, for instance, is unhappy because they had a very small loss, for the first time in many years - that's not a big deal.
"Busses can be built and deployed quickly"
Buses use as much oil as the average car per passenger. They use more than a Prius, and 4x as much as a car-pooling Prius.
"We're moving to a new paradigm, or a set of them."
Yes, we're moving to renewably powered electricity. That will work quite well, and look a fair amount like life today. If we want to move to a different way of life, we'll have to make an explicit and separate decision to do so: PO and CC won't force the decision.
>bicycling (or walking) isn't a major component of practical problem-
>solving for PO or climate change.
Totally wrong. Cycling will be a lot safer because there won't be
nearly as many cars on the road. Dedicated bike lanes? Just use
one of the now-empty car lanes. Anti-bike attitudes? Attitudes will
change very quickly when the only alternatives are walking and staying
where you are.
Commuting with an electric bike can be powered with solar panels
costing under $1,000. Affordable, durable, zero oil required.
The Chinese have produced tens of millions of electric bicycles.
When we run out of oil, we will too.
"The Chinese have produced tens of millions of electric bicycles.
When we run out of oil, we will too."
Bikes are great, but we'll mostly use electric cars.
Have you noticed how terrible the aerodynamics of bikes are? A Prius with 4 people uses the same amount of energy per passenger (about 50 watts) as a bike, despite the weight of the vehicle - the car is just much more efficient, in addition to being safer and faster.
Are you sure 200 watts, less than a third of a horsepower, will propel a Prius ? I suggest you try and push one along the road, and race some one on a push bike.
"Are you sure 200 watts, less than a third of a horsepower, will propel a Prius ?"
Ah, good catch: I meant 200 watt hours per mile. As a wild guess, a Prius at 5MPH (and relatively low wind resistance) would need a little less than that - about 1 HP, or 750 watts, to maintain speed.
So, yeah, a bike is indeed more efficient. Does that make much difference? An EV would only use about 2,400 KWH's per year. That's the electricity supplied forever by .9 KW of wind capacity, which would cost about $1,800. One-time. That's not much.
I think I knew what you ment! The shit drag coeff. of push bikes is saved by two factors, most don't go that fast and the frontal area is low. Motor bikes on the other hand have very poor economy given their size and weight, which better confirms what you are saying.
"Motor bikes on the other hand have very poor economy given their size and weight"
Yeah, I was very disappointed to find out how miserably low motor-bike MPG is (40-85), given how small they are.
We've all seen the Union Pacific (Burlington Northern?) commercials. Paraphrased: We can move 100 gallons of ethanol 1200 miles (about the average trip, I'd guess) with One Gallon of Diesel.
X tells us he has about 5 gallons of Diesel on an Acre (450 gallons of ethanol.)
There is NO Diesel used in the refining. So what do we have? 2.1 gallons of Diesel for every 100 Gallons of Ethanol?
Now, it's a true "fact" that nat gas is used in the refining; but then, nat gas is, also, used in the refining of gasoline. Is it not? about 6,000 btus of nat gas is embedded in the fertilizer that's used to produce the corn;but I'm assuming we're talking, primarily, of liquids.
If not, I'm sure you would all trade the transport abilities of 6,000 btus of nat gas for the potential of 76,000 btus of ethanol, right? Especially, after Robert Rapier's post explaining how ethanol can deliver more "work" than gasoline when utilized in a proper engine.
Guys, I'm telling you; It's, almost, ten percent of our private transportation energy, already. You, really, need to understand a factor of that size. Jes Sayin.
how ethanol can deliver more "work" than gasoline when utilized in a proper engine.
Here a quote: “The EBDI engine project is a great example because it turns the gasoline-ethanol equation upside down. It has the performance of a diesel at the cost of a gasoline engine, and runs on ethanol, gasoline, or a blend of both.”
From:
http://www.autoguide.com/auto-news/2009/02/bentley-supercar-to-make-at-l...
As a practical matter, most ethanol is used at a 10% concentration or less in gasoline. How does a 10% mix affect MPG for most people? I've heard suggestions that it reduces MPG proportionately by the 30% factor mentioned, or 3% for the blend.
What have you seen?
Current gasoline engines make less effective use of ethanol than what will be possible in the future: see article. But the lower energy content of ethanol (as compared to gasoline) should not necessarily result in lower mileage. The energy content of gasoline for instance is also poorly utilized (=read: converted into propulsion power). So, it's more a question as to what energy-in can be converted into propulsion power.
High performance engines with pure (or close to it) ethanol is well proved, but high concentrations are going to be very inconvenient for mass distribution.
I'm curious about the effect of a 10% blend: what's the current effect on MPG, and what can be done to maximize it's MPG in a reasonably conventional engine?
Let me put a finer opint on the question: is jkissing right to suggest that ethanol should be discounted to 56% (80% liquid fuel surplus x 70% effective propulsion value)?
Mass distribution of high concentrations of ethanol is already being done for years in Brazil.
Current effect on MPG is variable. It's apparently not all that bad:
http://www.motortrend.com/features/newswire/33057/index.html
What reasonably (to some extent) can be done further is dynamically increase compression ratios.
"Mass distribution of high concentrations of ethanol is already being done for years in Brazil."
Per ( http://energyoutlook.blogspot.com/search?q=ethanol+corrosion ), it can be done, but it's not convenient: "One of the biggest issues refiners have with adding ethanol to gasoline is that it forces them to ship sub-par gasoline through the long-distance pipelines, and then blend in the ethanol at distribution terminals close to the final point of sale. That's because ethanol creates serious problems in petroleum product pipelines, including corrosion and product contamination. This is the main reason most refiners opted for MTBE when they could, because it had none of these drawbacks. Instead, ethanol is shipped via rail and road, meeting up with gasoline only at the terminal....need to add an extra tank and pump--and protect it all from water contamination...inventory congestion that has contributed to higher prices and sporadic product outages."
The article is encouraging.
http://www.fueleconomy.gov/feg/byfueltype.htm suggests a problem with E85 - what do you think?
I'm still curious about E10 - what have you seen?
About E10 I told you already.
Piping ethanol has been demonstrated as feasible: http://greeninc.blogs.nytimes.com/2008/10/17/houston-firm-crosses-ethano...
As far as a problem with E85, it might not be the problem with E85, but with the cars. Cars that can run on gasoline, like in your link, are most likely not the best equipped to handle E85.
"About E10 I told you already. "
The only specific thing was "dynamically increase compression ratios". Are there any vehicles on the road doing so? How hard would it be to do?
"Piping ethanol"
Here's a later article:
http://greeninc.blogs.nytimes.com/2008/12/10/an-ethanol-pipeline-begins-... . Seems encouraging, though there is a $118K/mile cost to retrofit the pipeline.
"Cars that can run on gasoline, like in your link, are most likely not the best equipped to handle E85."
Hmmm. That seems to suggest that "flex-fuel" isn't a good idea. Doesn't that limit a car a lot, if it's optimized to use ethanol, and can't use gasoline efficiently?
$118K/mile is peanuts compared to upgrading/building the electrical grid to accomodate windpower and electrical vehicles.
"Doesn't that limit a car a lot, if it's optimized to use ethanol, and can't use gasoline efficiently?" That's why we need "dynamic compression ratios" and perhaps other things as well. That's more than just "flex fuel".
"$118K/mile is peanuts"
That's encouraging, but it would be nice to have numbers. Any rough estimate as to how many miles of pipeline would need upgrading?
"That's why we need "dynamic compression ratios" and perhaps other things as well. "
Sounds good. Could you elaborate? Are there any vehicles on the road doing such things? If not, how hard would it be to add such features?
Nick, The DOE estimates a loss of about 1.5% using E10. It's about the worst mixture possible when using ethanol. With the modern engines currently in use, E30 is probably the best.
Saab did/does a good job with its biopower engines using a variable ratio turbo to boost the compression when ethanol is in be fuel. This gives a lot more power using e85, albeit at a substantial loss in fuel economy. The next step is incorporating a method of altering "Displacement." This will enable an engine to obtain excellent power with gasoline, and great mileage with ethanol. When operating with gasoline the displacement will be expanded, and compression lowered. With ethanol the displacement will be reduced, and compression raised. The Ford Ecoboost, and Chevy's new (I can't remember the letters, dangit) engines will be accomplishing this within a year.
Kinder Morgan is shipping ethanol through pipelines in Fl., now. It's, really, not that big a deal. Brazil ships quite a bit through pipelines, I believe. Anyway, one big advantage of ethanol is that most localities have a good feedstock for the process, thus reducing the necessity of shipping long distances in the future.
Hope this helps.
That helps. Now, could we find sources for the following? It would help when presenting this info in the future:
"The DOE estimates a loss of about 1.5% using E10."
" The Ford Ecoboost, and Chevy's new (I can't remember the letters, dangit) engines will be accomplishing this within a year."
"Union Pacific commercials....We can move 100 gallons of ethanol 1200 miles (about the average trip, I'd guess) with One Gallon of Diesel."
"X tells us he has about 5 gallons of Diesel on an Acre (450 gallons of ethanol.)"
Regardless of how much diesel goes into making ethanol, it is still wrong to simply add ethanol on top of crude and sum the total - it's apples and oranges. Ethanol has only 2/3 the energy, something that becomes quite clear when checking mileage. So, ignoring coal/NG but taking diesel input (20%) plus 1/3 reduction on account of less energy means that ethanol contributes at most 1/2 of its nominal output to useful liquid fuels. IMO all charts that include ethanol should cut that fuel volume in half.
Khursaniyah (AFK Ph 2) was due for last month. Google News yields one item, subscription only, suggesting the field has been further delayed:
Saudi Arabia gets tough on prices
IEA is showing a marked upswing for Brazil, in production of liquids - perhaps they're finally coming out of the doldrums.
If this plays out like it appears, as soon as any form of global economic recovery begins, supply issues will reappear out of nowhere, Nowhere. So, either economies keep contracting and petro prices are kept in check, or economies try to start growing and petro prices increase to put a lid on it all. A Catch-22 of serious proportion.
In terms of world production, provided refiners and producers have decent numbers, a plateau of half a decade to a decade provided supply is present is likely because of the pay back period required for refineries. For instance this $15 billion dollar ~600,000 refinery would take ~7 years to pay itself off at a crack spread of $10/bbl. Since no one knows exactly how demand, and as a result production, will behave, there are probably a couple more years to add given that uncertainty.
That's a pretty good analysis rofl. In conversations with the refinery guys the optimistic ones use about 7 years PO and the capital sources use around a 10 year PO. As you point out, it's all a matter of what price forecast you use. In volatile times most will go on the low side as a rule.
Thanks for the compliment! I've posted this a couple times IIRC and you're the first person to even respond to it.
It looks very clear to me that NON-OPEC has past its production peak and that we have started the declining part. But nothing is for certain for OPEC so far. I still stick to the idea that for the world production, we won't have a peak but a quasi plateau (with a few bumps) that will last for quite some time, the real question is then: how long the plateau will last ? 5 to 15 years (at the very best)my best guess...
One question
Does anyone has a Hubbert linearization plot for OPEC and NON-OPEC separately ?
Thanks in advance
I'm hoping someone at The Oil Drum can answer some questions for me. I have read that increasingly heavy sour crude is coming onto the market, in place of the more desirable light sweet. I have also read that refinery capacity for heavy sour crude is limited and that there aren't any plans to build any. I have several questions surrounding these points. Firstly, what refinery capacity (barrels per day and as a percentage of overall capacity, if these figures are available and meaningful) exists in Australia and Britain? I specify these 2 places as I live in Australia and have lived in Britain. Secondly, what are the costs involved in constructing such refinery capacity? How likely is it that the money can become available given the current world financial problems? Thirdly, do they need to be separate facilities, or can they be "bolted on" at existing light sweet refinery facilities? Fourthly, I was in Britain when the strike at Total's Lindsey Oil Refinery broke out. I read that the strike was due to manning of the construction of a new de-sulphurisation unit. I understand that heavy sour differs from light sweet in a number of important ways, but one feature is that heavy sour contains a lot more sulphur (I imagine that the "sour" refers to this higher proportion of sulphur - more sulphuric acid from emissions?). I would like to know if this de-sulphurisation unit is, or is likely to be being built to handle the increasing quantities of heavy sour crude coming onto the market, or are there sufficient quantities of sulphur in light sweet to make de-sulphurisation necessary? Are there government imposed requirements on cleaning up involved? My interest is not just that I'm a human and live in the west, and therefore as impacted as anyone by peak oil, but Husband works for one of the Big Majors, and I have been an oil expat in Britain and Sarawak for a number of years, with a large number of petroleum indsutry workers and their families amongst my personal friends. Strangely, the above were not the sort of issues we thrashed out around the BBQ on weekends!