| Advice to Pres. Obama (# 4): Go for Wind Power, Seriously | The Oil Drum: Europe | Energy Controversies Lecture Series, University of Aberdeen |
Oilwatch Monthly January 2009
Posted by Rembrandt on January 23, 2009 - 12:00pm in The Oil Drum: Europe
The January 2009 edition of Oilwatch Monthly can be downloaded at this weblink (PDF, 1.6 MB, 24 pp).
The Oilwatch Monthly is a newsletter that is available free of charge with the latest data on oil supply, demand, oil stocks, spare capacity and exports. Readers who want to receive the Oilwatch Monthly in their e-mail box each month can subscribe at this weblink, by filling in their first name, last name, email adress and selecting Oilwatch Monthly in the mailing list box. To finalize your subscription push the 'inschrijven' button below the form.
A summary and latest graphics below the fold.
Latest Developments:
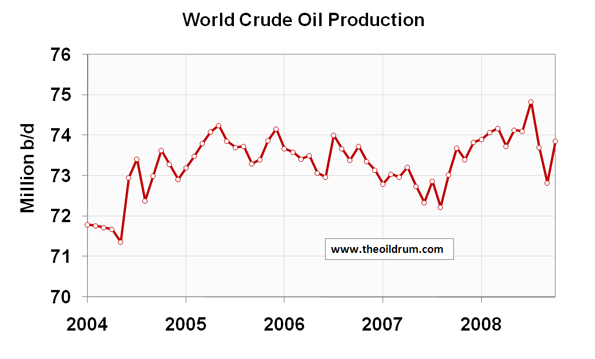
1) Conventional crude production - Latest available figures from the Energy Information Administration (EIA) show that crude oil production including lease condensates increased by 1.03 b/d from September to October. Resulting in a total production of crude oil including lease condensates of 73.86 million barrels per day. The all time high production record of crude oil now stands at 74.84 million b/d reached in July 2008.
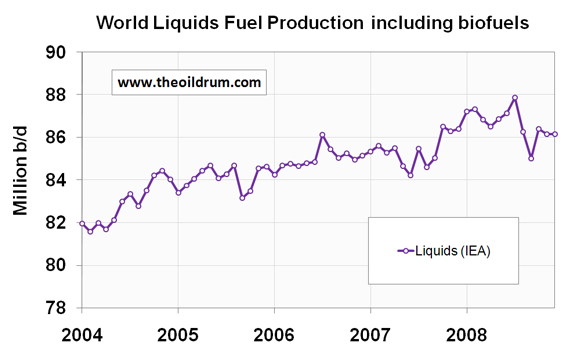
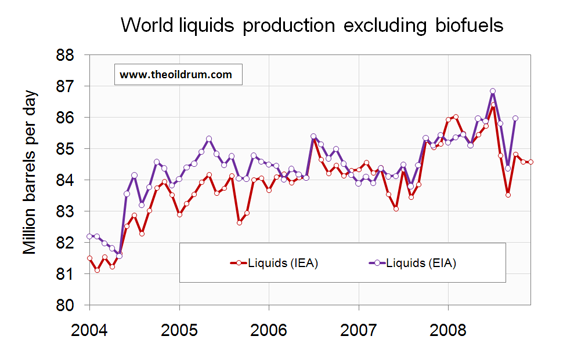
2) Total liquids production - In December 2008 world production of total liquids increased by 10,000 barrels per day from November according to the latest figures of the International Energy Agency (IEA). Resulting in total world liquids production of 86.17 million b/d.Average global production in 2008 was 86.65 million b/d according to the IEA. In 2007 an average of 85.41 million b/d was produced. The US Energy Information Administration (EIA) in their International Petroleum Monthly puts average global 2007 production at 84.43 million b/d and average liquids production from January to October 2008 at 85.60 million b/d.
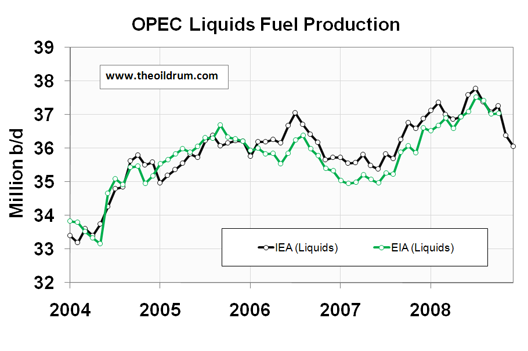
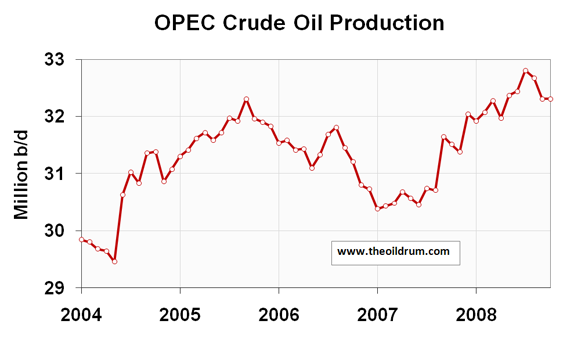
3) OPEC Production - Total crude oil production excluding lease condensates of the OPEC cartel decreased by 330,000 b/d to a level of 30.91 million b/d, from November to December 2008, according to the latest available estimate of the IEA. Natural Gas Liquids production remaind stabel at 5.14 million b/d from November to December 2008. Average total liquids production in OPEC countries in 2008 was 37.07 million b/d, versus 36.25 million b/d in 2007 and 35.83 million b/d in 2006.
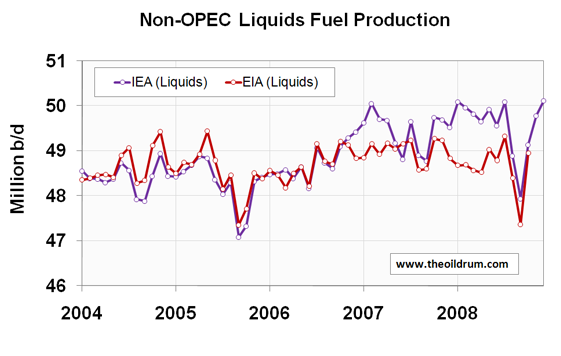
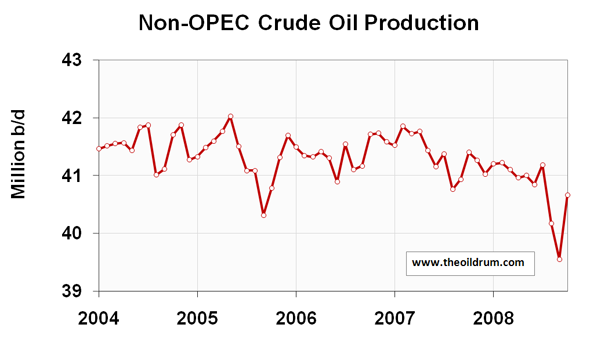
4) Non-OPEC Production - Total crude oil production including lease condensates of non-OPEC increased by 1.14 million b/d from September to October 2008 to a level of 40.67 million b/d, according to the latest available estimate of the EIA. Average crude oil production of Non-OPEC from January to October 2008 was 40.79 million b/d, versus 41.35 million b/d in 2007 and 41.39 million b/d in 2006. Total non-OPEC liquids production increased by 340,000 b/d to a level of 50.12 million b/d from November to December 2008, according to the latest figures of the IEA. Average total liquids production of non-OPEC in 2008 was 49.58 million b/d, versus 49.45 million b/d in 2007 and 48.75 million b/d in 2006.
5) OECD liquids demand - OECD Consumption in November 2008 was 45.84 million b/d, a decline of 2.95 million b/d year on year. Average consumption from January to November 2008 was 46.35 million b/d, which is 1.28 million b/d lower than consumption in the same period in 2007. The decline is mainly a result of a decrease in oil consumption in the United States. Consumption is 986,000 b/d lower on average in the US from January to November 2008 then in the same period last year. In comparison, Mexican and Canadian consumption are almost flat relative to 2007 consumption.
6) Chinese & Indian liquids demand - Chinese liquids consumption averaged 7.09 million b/d from January to November 2008 according to the JODI database. A decrease of 110,000 b/d versus average 2007 January to November consumption of 7.25 million b/d. In 2005 China consumed on average 6.27 million b/d, growing to 6.78 million b/d in 2006 and 7.29 million b/d in 2007. But growth was impacted since July 2008 . Liquids consumption in November was 986,000 b/d lower than in October. Consumption in India was 2.6 million b/d from January to November 2008, versus an average of 2.43 million b/d in 2007 and 2.29 million b/d in 2006.
7) World Liquids exports - From 2005 to 2006, worldwide liquids production increased by nearly 1 million b/d from 84.1 million b/d in 2005 to 85 million b/d in 2006 according to the IEA. The exports database, which uses the methodology outlined in the oilwatch monthly, shows that annual worldwide exports are roughly in the order of 46.3 million b/d, 47.5 million b/d, 47.4 and 47.3 million b/d in 2004, 2005, 2006 and 2007 respectively. From January to November 2008 the estimate suggests average world exports amounted to 47.37 million b/d.
A selection of charts from this edition:
Personnel
Editors
Contributors
Peak Oil Primers
Archives
- November 2010 (3)
- October 2010 (6)
- September 2010 (4)
- August 2010 (7)
- July 2010 (6)
- June 2010 (7)
- May 2010 (2)
- April 2010 (8)
- March 2010 (4)
- February 2010 (6)
- January 2010 (3)
- December 2009 (5)
- November 2009 (8)
- October 2009 (12)
- September 2009 (6)
- August 2009 (5)
- July 2009 (11)
- June 2009 (8)
- May 2009 (16)
- April 2009 (10)
- March 2009 (7)
- February 2009 (10)
- January 2009 (15)
- December 2008 (9)
- November 2008 (9)
- October 2008 (9)
- September 2008 (13)
- August 2008 (10)
- July 2008 (14)
- June 2008 (23)
- May 2008 (16)
- April 2008 (12)
- March 2008 (16)
- February 2008 (9)
- January 2008 (13)
- December 2007 (13)
- November 2007 (16)
- October 2007 (22)
- September 2007 (8)
- August 2007 (9)
- July 2007 (16)
- June 2007 (8)
- May 2007 (7)
- April 2007 (7)
- March 2007 (10)
- February 2007 (10)
- January 2007 (12)
- December 2006 (9)
- November 2006 (15)
- October 2006 (4)
- September 2006 (5)
- August 2006 (5)
- July 2006 (9)
- June 2006 (5)
- May 2006 (10)
- April 2006 (9)
- March 2006 (13)
Vital Trivia
License

This work is licensed under a Creative Commons Attribution-Share Alike 3.0 United States License.
Thanks for your great work. I'm not seeing any plateau or even a decline in production yet. Does even look like production is increasing, which would seem logical. Producers need more money so they increase production.
For the OPEC part, production driven by high prices would account for the 2008 growth. They're still seeing the rewards from several years of very heavy investment. The question for that market would be how long before the low prices drops investment, and then results in a step-down in production?
Non-OPEC is very worrying, though. Not only was there a plateau, but it's in the past and decline has been evident for a while, even with record prices to drive investment. Not much chance of ever recovering there, I'd say, with low prices especially.
Note that the graphs do not include any view of EROEI, or the shift to heavier crude grades.
A very important point - if we could graph such a thing it would make financial policies a bit clearer. Costs are undoubtedly coming down, but not as fast as revenues. But the data does exist on crude grades/% light sweet higher API, etc. I don't have link handy - anyone?
I'd like to see the numbers tabulated on a per capita basis too. What if there is more oil but less on a per-capita basis? Can one then say "production is keeping up"?
Then there needs to be some sort of Oil Gini - the oigini index - that measures the emergy distribution. My guess is that from a declining pie, the wealthy populations are getting disproporationally more and more.
Such meta-information won't change policy, that's set by the people at the controls. There isn't anyone else to take the controls - the controls are wrong. But it would help those of us trying to figure out what sort of controls we might need - local, local, local - to address scale, distribution and allocation.
cfm in Gray, ME pie sector 3.0719
I have submitted a paper to Nate that does just this in a very basic, but IMO critical, way. Global net per capita oil (C & C) is currently at about 4 barrels per person per year. That's down from its peak of about 5 around 1980. Peak net per capita is well behind us.
We built industrial society on an energy return of circa 100:1. We have been maintaining it until recently on a return of circa 10:1. We are now turning to sources with returns of near 1:1 (i.e. no net return). Ain't gonna work.
Cliffman, I'm looking forward to that. How far back did you run the numbers? Did you go back at least as far as it took to find Peak Oil per Person"? [POP] Just guessing, right around Apollo 13. "Houston, we have a problem."
Ain't gonna work, no. Another set of numbers that would be helpful at least anecdotally - what was "Barrels of Oil Equivalent per Person" [BOEP] of various societies at various times. Europe now is about half US I understand. US around 1960 about half of current. If society, culture and technology are all of a piece - though not necessarily uniquely so - one could solve decline rate and amount of work to replace infrastucture to find the set of True Paradigms Possible. ;^>
cfm in Gray, ME, channelling Harri Seldon.
clifman - sorry - i just can't keep up - please resend it to address on my profile. thanks
hi cliffman
I too would be interested to see your analysis. Looking quickly at the BP site it's interesting that the big drop in oil consumption per capita happened between 1979 and 1982, from 0.71 to 0.6 tonnes/person/year. 2007 was unchanged from 1982 at 0.6. For the same dates total energy consumption/capita/year was 1.55mtoe in 1979, 1.43mtoe in 1982 and 1.7mtoe in 2007.
2 immediate conclusions suggest themselves from this;
1. The big drop in oil consumption, on a per capita basis, occurred in the relatively short recessionary period 1979-1982. This probably represented genuine, irrecoverable, demand destruction (expressed/capita) and likely resulted from energy substitution, esp non-transport.
2. Since 1982 oil consumption/capita has remained remarkably steady against a backdrop of increasing total energy/capita. This suggests that oil demand may be far less elastic than back in 1979 - most of the easy substitution has happened.
TW
Figure 6 shows OPEC production rising steadily since third quarter of 2007 passing its mid 2005 (july 2005) level in third quarter of 2008.
Figure 7 shows NON-OPEC production declining since start of 2007 never reaching that level again until end of 2008. There is ofcourse a major decline then come-back near the end of 2008.
World crude oil production as shown in figure 5 is almost a balance between OPEC and NON-OPEC (I think each of them produce a half of their sum). I do see a plateau in world crude oil production since about third quarter 2007 (if we take average of production since then).
The fast rise in OPEC's crude oil production near mid 2008 is balanced by a close fall.
There seems still some potential in rise of liquid fuels' production.
On the basis of quantitive production data we can't clearly say that peak is near but on the basis of qualitative production data (all liquids are not equal, EROEI etc) we are near to peak in liquid fuel production if not passed it.
I agree. nice to see just data. draw your on conclusions. wonder how much of this went into storage?
Non Opec has clearly peaked.
US, Mexico, North Sea, even Russia seems to have peaked.
So then, OPEC, in particular two countries, Saudi Arabia and Iraq, are the two big unknowns.
Also, the notable thing is that these data sets are not complete or perfect, just an outline of what is going on.
What I see is a plateau.
hi tommy
IMO the all liquids graph is a bit misleading for 3 reasons;
1. It contains biofuels which are a disaster for many reasons and for which EROEI is probably not far from 1.
2. Non crude oil liquids contain a large fraction of NGL's which have only about 70% the volumetric energy content of crude. This component has been steadily rising as a fraction of total liquids.
3. EROEI of crude is likely falling as newer and smaller fields and unconventional oil take up an incresing fraction of the crude total.
Getting an exact number for 3 is tricky but if you take output numbers for May 2005 and compare with Oct 2008, ignore biofuels and allow for the 0.7 conversion factor for NGL's, then there is little difference in volumetric energy content (oct '08 is 0.3mbpd higher). The slightly higher figure for oct 08 is probably (personal gut-feel) wiped out by reduction in EROEI over the period.
The fairest overall conclusion is probably that liquids have been on a plateau since 2005. To appreciate this better you should really view the data without the false origin - i.e. plot on graph paper with 0mbpd as the Y-axis start point. It's then clear that the mom differences over last 4 years just constitute a noisy plateau.
On a different subject it looks as if any OPEC reduction from oct to dec 08 (-1.3mbpd) has been almost wiped out by an increase (+0.9mbpd) in non-OPEC production over the same period. No wonder the price has failed to rise over that period as the world recession deepens! And another piece of evidence IMO that the price will rise rapidly when/if economic recovery begins.
TW
I was confused by the date in the title :)
Fixed.
thewatcher, now you watch yourself! What you address here amounts to a scandal on TOD.
People might think my moniker "nopeak" is tendentious, (it was sarcastically selected) but nothing is so scabrous as TOD publishing the "all liquids" bullsh*t graph above-the-fold and pretending it comes even near to representing reality.
Per your first statement: "it contains biofuels." Indeed. This is called "double-counting." Pump some oil, count it as "liquids." Use the oil to grow some crops and use the crops to make some fuels, and count it as "liquids." No one on this site has ever shed any real light on this farrago of liquids, but there it is, above-the-fold, obfuscating the peak.
Per your second statement: "it contains NGLs." Yessum. None of this is made into motor gasoline or diesel or heating oil, and it comes from NATURAL GAS WELLS! not oil wells. This site is called The Oil Drum, but that never stopped them from obfuscating the peak ""oil"" with oodles and oodles of propane and butane.
Per your third statement: "EROEI is likely falling...." You get the award for Understatement of the Year. Let's all ignore the energy yield and pretend, with the stupendously positive "all liquids" graph above-the-fold, that a volumetric increase in "liquids" means one cussed thing.
I love you all. Now excuse me while I go makes some "liquids" on your legs.
nopeak
Please children, we are trying to keep this a "civil and professional place for discussion.
The other kids will get a bad impression if you continue......
nopeak,
Your post is unfair and inaccurate. You've been a member here for seven weeks. Perhaps you should go back and read every DrumBeat fromJan '07 to now. You will see you are way off.
Churlishness, even rudeness, has its place, but only in light of truth. You are not dealing in the realm of truth with your post.
Jeers
Deffeyes called Peak around Thanksgiving of 2005 based on conventional oil, if my memory is right. How does that play vs this report? If we're on a volatile plateau why dicker over one-half of one percent when the practical effect of peak oil goes back to 2005 (if not 1970ish).
Seems to me biofuels are NOT something that should be counted in "Peak Oil". Not unless one wants to go abiotic. Seems to me oil is oil not tarzans, not NGL, not soybeans.
cfm in Gray, ME
You are wrong. I've been reading here since the beginning. You have no basis to be so presumptuous about my readings history based merely on when I registered for this site!
I remember when the only "peak oil" sites were fromthewilderness, dieoff, and peakoil.com. By these lights, you on TOD are the johnny-come-latelys.
Funny how you and Citizen Anarchist, obsessed with the outraged tone of my post, don't address the source of the outrage. You claim "inaccuracy" and "lack of reality" and refute it NOWISE.
So tell me:
1. Does the volumetric "liquids" count employ DOUBLE-COUNTING, or not? Perpetually and ad infinitum TOD posts this graphic with a straight-face under the title "Oilwatch." A joke!
2. Does the NGL category smuggle in propane and butane from gas wells or not to obfuscate the oil picture? Hmmmm?
3. Is EROEI -- and especially per capita EROEI -- going over a cliff or not, as more and more SLUDGEY crap is "counted" as "oil" in the "liquids" category?
I call bullsh*t and will continue to call bullsh*t when I see it.
Volumetric liquids counts are bullsh*t.
Edit: BTW, there is a typo in the headline. "World liquids fuel production including biofuels" should read "World liquids fuel production including loaves and fishes."
You're exactly right, nopeak.
And so banished to the wilderness will be your prize,
like it has been the prize of Dirty Fucking Hippies since
Ronald "Trees Cause Pollution" Reagan.
EROEI is EVERYTHING.
And as I've been stating since Katrina when I came here
because of your excellent Hurricane coverage.
And your TOD reports on Thunderhorse which then disappeared after Katrina.
a blank spot between TH and March '06. And don't show me pics of
TH and Dennis damage.
AAMOF this might be the first post I read here:
#
#
The Oil Drum | Hurricane Katrina and Thunder Horse/Gulf Oil ...
Hurricane Katrina and Thunder Horse/Gulf Oil Production (Kat now potentially a Cat 4?) Posted by Prof. Goose on August 26, 2005 - 10:24am ...
www.theoildrum.com/story/2005/8/26/85755/4147 - 46k
As I said, then and now, every oil watershed/inflection point has been
accompanied by a major socio economic event to verify.
The severity matching the watershed's importance exactly.
Obama just ran out of time. Good Luck. Tick Tock.
mcgowanmc , nopeak, RIGHT - ERoEI is everything. It is everything to the cheeta chasing the gazelle. It is everything to us. ERoEI seldom counts human energy but as we move closer to an ERoEI of 1 suddenly it will become clear just as it is for subsistance farmers or hunter-gatherers. For example the ERoEI of cane ethanol is better than corn. Partly this is because the cane is burned after extracting the syrup to provide some of the energy of processing (in other words no crop residues go back to the soil so the ERoEI is being supplemented by soil depletion) and partly because the energy of the workers (food, housing, transportation) is not counted. A cane cutter is expected to cut about 3 tons or more of cane a day. If machinery was used to cut the cane the fuel for the machine would be counted. Thus in that way of accounting if we used virtual slave labor to harvest corn and didn't count the food we fed them we too could have a better ERoEI on corn ethanol.
If a solar panel factory had to pay its workers in electricity produced by some of the panels it made - had to dedicate a portion of them to "pay" its workers, it would lower the ERoEI of the panels. Of course a human's pay is more than the value of lighting and heating a house, so we would have to subtract from the ERoEI of solar some amount to run electric tractors to grow the food for the workers, etc etc etc.
What level of ERoEI we can live with and still have industrial civilization is debatable. I suspect we are getting very close. I am sure that solar and wind will NEVER have enough to sustain the world as we know it now.
All of the above are addressed time and again here at TOD. You also conflate TOD with being a monolithic entity when that obviously is not the case. There is dissension among the ranks, both among the staff and the general posting public.
You are not being truthful. You seem to have a bit of a thing going for EROEI (which is often discussed.) Understandable. But the post I responded to is edging into the fanatical. Perhaps it's warranted to push the EROEI concept. That is not the issue I raise. I am only saying being truthful is helpful to cogent discussion.
Anyway, just pointing it out. It's not my site, so it's not important to me whether you continue your tirade or not. You want to misrepresent? Go ahead. If TOD staff find it useful, perhaps they will respond.
(And, no, I'm not a lackey or boot licker here. I've had warnings and had posts deleted and have quite publicly called some of the main posts here rubbish.)
Cheers
One suggestion for counting ERoEI but first the problem.
Problem:
When calculating ERoEI we have to calculate ALL energies that we put in. This is the part which is making trouble. The other part of calculating the energy that we get out is easy and straight-forward. The problem in the first part is that we don't know to what extend we must go. It get really complicated when we try to estimate energy needed to employ one person for one month. Should we estimate energy used for entertainment (show biz etc)? What about the wastes (do the person really need a car to drive to work? etc)? Another problem is to what extend we must calculate the energy (energy going to Morocco's miner of phosphate rocks to make fertilizer to be used in rice farm in china that grow rice for the factory worker in china that made that dolls that the daughter of ceo of shell get for her birthday etc).
Solution
Subtract the energy used for hiring humans. Only calculate the energy going in producing objects (foods, cars, buildings, electricity etc) assuming that humans are doing it for free or that the work is done automatically. Ofcourse there are non-human energy consumptions in a factory and farm and even in services, things like fuels, electricity etc.
Once this is done and we have a database of estimated energy used in making each of the objects, estimate where employees are spending their incomes. People use their incomes for buying two basic things: goods and services. When a service is bought money is given to another human who use some part of it in buying goods and some part in buying services. As you move forward in the life of the money eventually all the money is spent in buying some kind of goods. Once you have a database of estimated non-human energy used in production of goods AND database of goods usually bought by the people you can have a better (though not exact) estimation of ERoEI.
Now about the wastes. To what level people can use their money more efficiently (do you really need that car to go to work? is it really necessary to go abroad on vacations every year?) would be answered differently by different people so we don't go in that discussion.
Wisdom, it is a problem (especially for first worlders) to know what to count when counting the energy of human input. In Brazil the wages are barely subsistence wages. They could just as well be paid in food, housing and cooking fuel as their wages would buy little else. For the sake of trying to count it I would use some measure of food calories for the worker and his family and the energy for basic housing and necessary transportation. When we get down to only having the really low ERoEI energy that is all that a worker is going to be able to get, just as in the past and in third world countries today.
The other problem with ERoEI is the ERoEI of the EI. Take solar, if your EI is oil it is still high enough to not affect your ERoEI but if you are trying to use solar to make solar you will need more EI than if you are using oil to build your solar panels (and run 18 wheelers and build roads etc).
Personally I think the "DOOMERS" see the world more clearly than the "POLLYANNAS" who seem regularly to miss the obvious problems with the "alternative" energies. I still have not seen a serious discussion on Electric dump trucks, earth movers, etc. The problem "doesn't exist" apparently because the Pollyannas don't want their hopeful world view shattered.
You seem to be miss reading the post to me. Its really important to understand what "the world" in general is counting as fuel.
Thank you for the post and all the work Rembrandt.
hi nopeak
Just a comment on NGL's. As I understand it (I'm sure you will correct me if I'm wrong ;-)) the bulk of these come from the gas caps above oil fields and so can technically be said to be associated with oil wells - but splitting hairs maybe.
Regarding motor fuel, it's not true to claim NGL's are of no use as there are now quite a few cars here (UK) that drive on LPG. My b-i-l has one and gets pretty impressive mpg out of it despite the lower energy content. So IMO it's fair to include NGL's in liquid fuels as long as allowance is made for lower volumetric energy content and whatever the EROEI is (anyone know this?)
TW
If we use the May, 2005 EIA crude production rate of 74.2 mbpd as the index month, and if we look at the average rate for four time periods: the last seven months of 2005, all of 2006, all of 2007 and the first 10 months of 2008 (subject to revision, generally downwards), the cumulative shortfall between what the world would have produced at the 5/05 rate and what we actually produced has increased to about 885 mb.
So, despite the vast increase in oil prices, the industry has failed to consistently match or exceed the 5/05 rate of 74.2 mbpd for any of the four cited time periods. I think that we were starting to see some voluntary reductions in production in October, but I believe that the year to date average for September was only 74 mbpd.
So, we see lower production in response to higher crude oil prices (through the summer of 2008). Where have we seen that before? Well, here are two regions that showed initial production declines in response to higher crude prices:
http://www.theoildrum.com/files/TexasAndNorthSea.png
Note that the North Sea, in 1999, was at about the same stage of depletion at which the world was at (regarding conventional production) in 2005, based on the HL (logistic) models. And the world crude production graph (2005-2008) looks a lot like the North Sea graph (1999-2002).
According to "Chart 33: EIA OPEC Spare Capacity Jan. 2003 - December 2008" OPEC spare crude oil capacity began increasing in July 2008 from 1.3 Mb/d to 3.2 Mb/d. I think some of this spare capacity is sour, but the recent increase is likely light sweet crude oil. The disruption in production caused by the fire in the BTC pipeline in Turkey, Russia's invasion of Georgia and the 2 hurricanes in the Gulf of Mexico causing the dip in production in August and September 2008 can not be attributed to peak oil. Those dips drag the 2008 average down. I suspect average crude oil production plus spare capacity increased in 2008 compared to the May 2005 rate of 74.2 Mb/d. Producers got it up a little bit in 2008 making last year the most recent peak year.
Even with a new peak year, world crude oil production is still on an extended plateau since 2005.
Thanks a lot westtexas from the behalf of all of your readers for the effort of collecting, analyzing and presenting highly useful and important information. You keep me coming back to TOD :).
Last seven months of 2005 + 2006 + 2007 + first ten months of 2008 = 214 + 365 + 365 + 304 = 1248 days. 885 mb/1248 days = 0.71 mb/day. A reduction of 0.96%, worthy enough to be valued?
Good point that decrease or plateau in production at time of high energy prices is a clear sign of peak production.
Thanks Rembrandt. You sure are a busy fellow. I have 'inschrijven'ed
A more accurate word would be 'ingeschreven' ;)
so some simple arithmatic
OECD decline 3 mbd
China decline 1 mbd
ROW wag decline 0.5 mbd
total 4.5 mbd decline from peak
lets say the depression is not really here yet, and decline continues... by how much?... could we get to total 6 mbd demand decline from peak?
(that would be 6/86 = 7% of world production. I actually like to take crude only so 6/74 = 8%)
so if decline starts at 4% of 74 in 09 = 71, and 6% of 71 in 10 = 67, we are down to 67 mbd production at end of 10, or a decline of 7
so whichever way you cut it, we will be into price increases in 10, regardless of the economy
... so where is the best farmland again?
Can't we also read a possible demand bottom into this little mini-plateau (last 3 points)? If demand is still falling, then there should be another good-sized drop in the near future? We wait.I personally don't think US demand will fall anymore until prices rise. I see little anecdotal evidence that it is lower than it was a few months ago.
Matt
Actually this is close to what I'm looking for.
In my opinion we are looking at a end of our civilization as we know it if the following occurs.
1.) Demand remains flat to slowly falling and oil prices stop falling.
2.) Demand continues its flat to slowly falling trend as prices increase.
3.) Ever increasing energy costs make it impossible to play financial games to escape our
debt bubble no matter what funny games we play with our fiat currencies more and more of our economy is devoted to energy/food security.
4.) Implosion.
This is the scenario I see if energy constraints result in the collapse of our civilization. We of course are facing a number of potentially civilization ending events
from global warming to world war so it need not be the one that takes us out but in my opinion if we get in this cycle its a death spiral we won't pull out. A strong move to renewable and alternative sources could allow a new civilization to rise even as the old one collapses but its not the same SUV/McMansion flagrant consumption society we have today and over time it would diverge significantly from our current one.
We can of course hope that a new society can emerge fast enough to replace our current one as one of the major killers we face finally take us down but ...
memmel.
So are you saying that if ALL oil based land vehicle transport was replaced by battery/electric vehicles(including EV SUV's) and people continued to use more energy but only say 10% of today's oil then; "we are looking at a end of our civilization as we know it "?
I can buy the argument that "civilization as we know it" depends of fairly large energy use( at least 4000 kWh/person/year) but not that oil use must continue to increase! Many would argue that civilization prior to major oil use( say 1908) was very similar to what we have now, except for the high levels of coal soot and horse manure. The SUV's of the day were the 4 or 6 horse powered coaches.
Memmel, if we somehow magically transformed ourselves to use 10% of the energy we use now, that would be "end of our civilization as we know it". Using less energy is a different type of civilization - 1) and 2) seem obvious. To us at least. Though not to most people, hence the resources that are being thrown at sunk investments. Is that what you mean by 3): that energy sector demands will claim ever larger portions of the economy and the remaining slice of the economy from which everything else comes will wither. That will lead to the 4) implosion where the wants - let alone the basic needs - of the global population are not being met. Is that what you write?
"New society", yes. At projected decline rates we have about 20 years to get to a point where we use 1/2^3 the energy we use now. [72/8 and some "above ground factors"].
What I'm really curious about is what kind of a world can we build in 20 years that uses 1/8 the energy of our current world? What would that look like? What would it take to ride such a downslope through changing cultures in generational time? Kunstler's "World Made by Hand" went to less than 1/8 - pretty much straight to solar income.
We don't consider enough the change in culture and society necessary to manage decline. More Wackenhut buses won't do it. They'll start blowing up.
cfm in Gray, ME
To respond to both you and Neil1947.
Your seeing what I'm seeing. To compare our future to the past as Neil is suggesting is wrong in 1907 we did not see the limits of growth. The limit then was more the bootstrapping process of application of rapid technological advance to "bettering" society.
In fact this technical growth has been growing explosively for at least 500 years. So until recently resource constraints where secondary or temporary ( solved by war ).
A technically advanced society thats required to limit itself to live sustainable is as different from our current civilization as say ancient china vs the modern US. I'd suggest that in reality we are talking about and almost alien civilization vs current moral norm.
And obvious example would be birth control. Our current religions where really formed in the middle ages when low population was a problem thus anti-birth control is and issue.
In fact I'd suggest although this may go against the grain of this web site that if this future civilization actually occurs that its constraints will be enforced more by new religious principles not scientific. These would permeate the culture.
Effectively this suggest that to succeed we may well have to develop new world religions that recognize the need for sustainable human development.
But on the same hand generally replacement of the major religions is a long bloody process that takes centuries. Thus if I'm right that success requires new religions then the flip side is that we can expect a long dark period as the last of the religious and moral infrastructure developed to support a culture of consumption is destroyed.
And please don't see this as and attack on God or other teachings of religion I'm talking about the business sides of religion and population control. This has nothing to do with the knowledge or viewpoints they teach but the daily life. And finally I'm using and expansive definition that includes lifestyle thats justified by the religion. I.e the wealthy "christian" countries that use the majority of the worlds resources are able to justify their lifestyle in the current religious matrix. So by religion I mean the construct not the belief.
Underlying all of this of course is probably the need to have a lot of property held in common and used sustainable. I can't see how our current concepts of private property can ensure long term sustainable use. Look at farming whats to prevent a farmer who is poor from destroying his land for a bit more short term money. This sustainable society would view the land as a common protected resource. The same even four housing which is energy intensive to build allowing it to decay because the owner is broke would not be good. And on the other end of course excessive accumulation of property in the hands of the few would also not be sustainable. Thus once can quickly see the real problem becomes even harder to solve since true sustainable living actually involves elimination of the poverty/wealthy split at least to the point that resources of community interest or the community itself is not hurt by how resources are used or cared for. I suggest that this communistic commons concept simply is not possible in our current social/religious/moral fabric. The transition cannot be done.
And last but not least this groovy communal society of tree huggers would have to out compete with other groups that chose the time tested royalty slavery route its questionable if this can happen. But it does suggest that although a society might form that uses resources in a sustainable manner its probably going to be closer to Sparta than Athens in its makeup. I don't think a lot of people have thought through the fact that given the current worlds population any sustainable culture would be forced to defend its commons against all kinds of alternative cultures most desperate for resources.
I really feel that most people alive today are like the Romans at the end of their civilization I'm sure none of them would have guessed that centuries of turmoil would follow the fall of Rome before a new civilization of comparable size finally emerged.
I could of course be wrong but I don't think so our core societies are morally corrupt and have insatiable demand for resources I just don't see a smooth conversion.
Could someone with access to that data please create an all time NON-OPEC crude oil and all liquids production graphs to complement the snapshots available here?
It seems to me that that graph shows the key moment, what with the unprecedented level of investment in oil exploration/production in 2006/2007/2008 which resulted in a drop in output.
I would like to present the two sets of graphs all by themselves to my City Council.
And just to be clear, this "Crude Oil" Production is pumped crude, so does not include tar sands, or other derived liquids?
Any assistance is much appreciated,
Chris
hi chris
Googling about a bit;
http://s3.amazonaws.com/priceofoil/PFCPeak_presentation.pdf
http://www.wtrg.com/prices.htm
http://www.mnforsustain.org/oil_duncan_and_youngquist_encircling_oil.htm
http://peakwatch.typepad.com/photos/uncategorized/2007/03/31/exxonmobil_...
Enjoy!
TW
Back in the day we used to do this all the time; here's a link to an old story:
http://www.theoildrum.com/story/2006/2/4/4015/39115
In any case, the growth over the past two years is such a small percentage increase in production for a vast percentage increase in price, it is blindingly obvious there is no slack in the system. I would like to see a 1900-2009 graph, as I think it would well prove the peak has arrived.
x
Rembrandt, probably the best energy publication in the world.
What this says to me, despite all the trauma, global demand for $40 "oil" is holding firm at 86 mmbpd.
Well stated.
I am readying an argument against someone that will say that the bad economy is doing us a favor in conserving oil (so to speak) so that when the recovery hits then we may surpass our previous peak once again. I don't believe this will happen according to the following argument.
If we have reached a peak in oil production, we can only maintain a plateau if we accelerate the extraction rate; this according to the oil shock model (and intuition). If on the other hand we reach a recessionary period (which all evidence points to), then we can expect concurrent decreases in oil production*. A negative shock caused by a recession will do two things to a projected oil shock model production curve. First, it will cause an immediate dip in extractive output, and secondly, if the shock continues, then the tail will broaden out.
If this depression extends for any length of time, then it become that much harder to reach the previous peak, even if the economy recovers. The inexorable loss of cumulative reserves during this recessionary period reduces any kind of springboard effect that a larger reserve would have provided. Only a huge acceleration in extractive pressure during an economic recovery could get us even close to a previous peak.
But wait a moment, didn’t that situation in fact happen in the late 1970’s with the peak deferred for a number of years? Yes, but consider that at that time, only the USA had hit a peak and the global reserves kept on increasing due to the latency of the production phases after the global discovery peak in the 1960’s. The springboard effect as demonstrated by the depressive shock in the oil shock model could occur then but not now. The bulk of the discoveries lie too far in the past to allow any real recovery.
The conservation of reserves is a canard as long as we continue to draw w/o new discoveries.
* We can make a convincing argument that peak oil in part may have caused the 2008+ recession.
Hello WHT,
IMO, that is an excellent analysis. For us to have any future springboard effect to significantly launch above the 2005 annual peak and/or the '04-'08 plateau: it would also require a meaningful shift to a larger percentage of global labor force to exploration, extraction, and production, plus much more funding, too. With all the rig layoffs and credit crisis problems, it looks like that is not happening anytime soon.
Like Matt Simmons says [from memory],"The oil industry is barely held together by the thin coat of paint on the rusting steel, and the old farts are retiring faster than the new kids are entering."
I'd think your right but perhaps a technical effect underlying this may play a big role.
A big reason for our undulating plateau up till now has been intensive infield drilling and exploitation of older known resources. Generally the biggest win was via expensive lateral wells. I suspect that this activity will cut back sharply. And closely related we will probably push our fields hard now esp the older ones that are profitable at 50 dollars a barrel. Thus for larger operators that have a mix of fields with different breakeven costs it makes sense to push the profitable ones as hard as possible vs the unprofitable wells.
This is of course our "easy oil". Given that we have evidence that our underlying average decline rate for existing fields was already climbing from 4% to 6% per year it will be interesting what the decline rate will be for 2009. I'd not be surprised to see it go to 10%.
Next one would assume that when prices go higher that the effort to invest will be lower and the move to pushing fields hard will continue. Thus one would expect the rate at which production declines will actually increase. This is offset like you say by a longer tail as the extraction rate is not increased via more new wells. However one would suspect that field damage is increase or the rate of stranded oil forming via coning of wells or other effects of pushing fields will increase. This lost oil will probably offset any fattened tail effect.
As and example one would expect given Russia and say Mexico's financial situation that we could easily see both the rate of production decline faster in these two countries and the longer term total recovery decline from field damage.
The Middle East is esp interesting since it has older fields with lower lifting costs mixed in with newer developments it will also be interesting to see if this situation develops in that region.
And finally since lifting costs are often higher for the heavier grades of oil we could easily be seeing a bit of a paradox developing. Countries may preferentially push their lighter higher quality fields to maximize profits and mothball the lower quality fields. This would over the short term lead to a bit of a increase in the light sweet oil available lowering the benchmark prices but leading to a increasing heavy/sour mix longer term.
I've been of the opinion that KSA would use this time to rest Ghawar and conserver its higher quality oil but we could just as easily see economic pressure result in cutback primarily for heavier grades. If OPEC is cheating in the sense that the producers are actually cutting back primarily in the heaviest grades then we should see oil prices remain soft even as the cutbacks are finally implemented. Given what we suspect about Ghawar I'm keenly interested in hearing any news about the quality of the production that Saudi Arabia has shut in recently. It would potentially tell us a lot.
This tells us little except overall they seem to be able to successfully pass on price increases of a few dollars. I don't see any obvious attempt to curtail Arab Light which
is what Ghawar produces.
http://saudioilproduction.blogspot.com/2008/01/saudi-aramco-raises-crude...
The point is that given the importance of Ghawar to overall world exports if light oil if it does go into serious decline this single field will have a huge effect on the shorter term oil markets.
We also have similar concepts with ultra-deep water etc in short we probably have at least 20 valid "micro shocks" that are occuring or can potentially occur over the coming months and years that just about ensure that peak production has been reached.
Add in export land EROI etc etc and its a pretty safe bet that we are now on the path to declining energy and that price will be determined by the supply/demand balance.
I can't image given the long list of micro shocks that are possible and the short list of positive shocks that we can expect the surplus of oil to remain for long.
Of course we could always continue on to a full blown depression of the next year or two but I'm still of the opinion that the biggest drop is being felt right now and although our economy probably won't recover the rate of decline will slow. For example on the demand side as housing prices fall back to sanity or even cheap by historical rent/mortgage payment ratios the velocity of housing purchases will begin to pick up a bit.
Historically unemployment is a lagging indicator of recessions and we have had a steep increase in unemployment and increases in corporate bankruptcies. As the weakest companies fold the remaining vendors tend to be more resilient as long as the financial system itself does not collapse. Or probably more correctly until it does.
So on the demand side I still see no reason why we won't see demand move to steady or slowly declining at least for a year or two this implies that peak oil should play a big role in the final collapse as financial games simply cannot overcome both the huge financial bubble and rising base energy costs. I'm pretty sure both effects are needed to finally take out the world economy.
Web,
I’ll offer a side bar to your analysis of oil development (or lack there off) during this downturn. It’s the collateral effect on our NG rates which had been increasing thanks to the hyper activity in the unconventional NG plays. You may recall that I consult for one of the biggest UNG players. Just saw our new drilling schedule. During the 1Q 2009 we’re dropping 15 of our 18 rigs in the UNG trends I deal with. That decision was made last year but it takes a while to pull the plug on ops. I haven’t seen numbers from other operators but I’m sure we’re not alone in the cut backs.
With the rapid decline rates most UNG wells experience it won’t take long for NG rates to start dropping significantly. And as you point out any re-ignition of the effort won’t happen as quickly as the cut backs. We may see a disconnect between economic activity and pricing: increasing NG prices in the face of continued demand destruction. An economic turn around might only aggregate that situation.
There might be some debate as to whether the recession increased the velocity of PO or not. But I suspect in the next 24 months or so we might have proof that the recession brought on PNG in the US.
Wow, daunting propects. With memmel predicting 10% rates when we turn the corner and 'the old farts' as Bob called them disappearing from the scene, it looks to be a chaotic recovery, if we can call it that.
True Web. We've all seen prediction that however the economy progresses in the next few years the term "recovery" just won't fit the process. Perhaps this is the real beginning of something similar to the plateaux phase of PO some describe. Granted it's been the financial meltdown leading the way but perhaps it serves well as a stand in for PO's full effect.
Just what we needed: a PO dry run.
What better example than the addition of Alaskan oil to U.S. production. Billions of barrels from Barrow gave us a nice hefty "bump" in the production curve, and served to make the tail a bit fatter, but it did absolutely nothing to reverse the overall decline already in evidence at that point. IIRC, it didn't even get us back to the all-time peak in U.S. production, never mind above it.
Shifiting our perspective for a moment, as always, I must remind people to look at the system as a whole. Resource consumption, pollution, growth in population, growth in industrial production, all of these factors are contributing to our ongoing global ecological overshoot. As the human race continues to hit hard biophysical limits then all of these factors will go into decline, if they haven't peaked already.
The only question in front of us now is can we manage that decline in a way that mitigates the pain, or will we allow it to be an all-out chaotic, brutal, and bloody collapse like so many other civilizations have done before us?
Cheers,
Jerry
Exactly Jerry.
And one can wonder what the economic implications are of EROEI approaching the point that it cannot sustain a society of our complexity.
The initial assumption is that prices would rise dramatically leading to demand destruction but I think that this is to simple.
The reason is a simple increase in prices would itself spur further investment in energy which actually increases the amount of energy consumed by the energy industry at the expense of society as a whole.
Instead it makes more sense to assume that a more complex interaction would be required then a simple linear increase in prices and simple price based demand destruction.
I'd suggest that a number of various scenarios are possible but on thing is clear if EROEI is declining then the society must ensure that investment in energy procurement that hurts the society is curtailed regardless of the price of energy. In other words the society has in my opinion to cause the remaining energy to be consumed for non-energy related needs at the expense of expanding low EROEI sources regardless of the price signal.
This conclusion is simply a result of thinking about EROEI and watching what has happened recently and indeed we find that exactly what has happened is that from now on out increasing prices will result in far less investment in energy because of a "fear" of another collapse. It even better than that because by causing the simple response of expanding the effort on extraction we get the situation that by the time a decision to extract is made previous high energy costs would have worked through society making extraction uneconomical. Thus this delay regardless of how its initiated is required to ensure that the signal the EROEI of our energy resources is no longer viable actually works at the economic level.
This suggest that the reasons for the wild price gyrations when a critical resource passes peak may be the EROEI cliff signal itself and its not a simple one.
The gyrations would continue until it becomes obvious that its no longer profitable to invest in expanding the energy supply at any price. The critical factor seems to be that the price gyrations themselves ensure that the price of extraction begins to lead the economic decision to extract. A simple linear increase in price simply cannot cause this lag it has to be chaotic.
This is of course a post mortem of recent events but it does suggest that we just went over the EROEI cliff at least for a society of our complexity. Less complex societies would hit the cliff at closer to 1:1 and indeed we have every indication that our current society is working to reduce its complexity and one would expect this to continue. So on the demand side we will see society become simpler and more impoverished to allow it to spend more on energy and this might allow some expansion in energy vs price.
So as we are now probably going down the EROEI cliff I'd expect us to see a fairly steady impoverishment and simplification of our society coupled with dwindling investments in energy with price no longer able to cause excessive investment in energy.
As I said the signal that EROEI gives at the economic level to ensure this is complex a collapse of the society with low prices is simply one way to signal the cliff has arrived.
I don't see its the only one. For example another approach is for higher energy prices to result in and attempt to inflate the currency to curtail the effect of higher energy costs on society this should result in production costs and affordability declining dramatically.
So energy costs and production costs would exceed the rate of inflation ensuring that both the ability to use energy and increase extraction decline.
I think thats the next EROEI signal we will see once deflation of existing debt no longer has a major impact on our economies. I'm not saying that we won't see continued debt deflation but attempts to inflate to prevent it should result in simply causing oil/commodities price inflation and declining wages actually declining faster than the inflation rate such that your peak real earnings or purchasing power should decline.
In fact I'd not be surprised to see the actual wages continue to decline in direct currency terms i.e we get inflation but the median salary drops from 40k to 30k even as printing causes commodities to skyrocket in price. My reasoning is that real demand destruction from increasing prices will happen on the next price spike and this will cause us to delay attempts to increase extraction as demand is obviously falling. The expectation is that a price collapse is imminent but it simply won't come instead society will simplify to work within the new high price/Lower EROEI regime.
In any case thats one solution the key is that the communication of the fact that our society has crossed over the EROEI is complex and its signal in society is complex not simple there is no clear and obvious signal except that in my opinion post EROEI cliff the only critical signal is that the system will align itself to ensure that continued investment in energy extraction is minimized to keep society itself from collapsing.
Endless variants of how society alters itself to accomplish this are possible.
All are probably not simple.
Prices can go up or society can change. The latter is much more likely, because a major change in prices and the proportion of society dedicated to energy "production" is a fundamental change in society/technology/culture. We are not going to get higher prices AND the same society.
cfm molting in Gray, ME
Correct.
The key is to understand that falling off the EROEI cliff is a complex process or at least the response is complex primarly because of the time lag between when embedded energy is replaced by more expensive sources and when energy becomes expensive. I.e the lag between when oil becomes expensive and when infrastructure built 20 years ago must be replaced.
Thats the intrinsic lag but you have it everywhere. For example for cars generally its not cost effective to replace a used paid off car with a new one simply to get marginally better gas mileage you need more incentive. Same often goes for making a home more energy efficient.
These calculations are of course flawed since they don't take into account increasing energy costs. In any case the key point is once the EROEI no longer is capable of sustaining a society of a given complexity the society has to reduce its energy footprint and this includes reducing its investment in energy production itself. We often use 1:1 as the point at which it no longer makes sense but I'm suggesting that energy investment is steadily reduced as EROEI declines.
This relentless force is interesting when you add in that pricing signal i.e high prices indicate the need for more effort to be put into expanding the resource base.
Somehow the situation has to work out such that society can ignore a high price signal and recognize that increasing the investment in energy is reducing the overall society complexity. This brings up a sort of corollary to the concept of maximum power i.e maximum power usage implies maximizing the complexity of the system.
Its interesting concepts such at WT ELP (Economize, Localize, Produce) work to minimize the complexity of the system and thus its energy requirements to sustain itself.
In general it seems that the simpler a society is the lower its energy footprint. EROEI/Maximum Power etc hint that real physical laws may exist that actually lead to this result.
But this says nothing about the price of energy or the precentage of the society devoted to procuring energy regardless of its simplicity in general however it seems that energy itself is expensive and procuring energy can take of to 50% of the time of the society in the case of simple agrarian societies. So again we see a sort of result that when energy procurement reaches say 25-50% then the society must become simple.
Right now for the US I'd say on average that energy takes 5-15% of our total work. This suggest for the overage to go to 25% or higher energy prices would have to climb to 2-4X our current price level. So extensive simplification of our society would occur as oil passed 200+ a barrel. Thus in my opinion we have yet to reach the point at which energy costs are leading to a relentless simplification.
Certainly they played are role in ending the insane growth we where seeing but thats not the same as this relentless simplification of society.
Whats really interesting is that this suggests that a move to electric rail does not ensure that we keep the same complexity of society as we have today. Although its difficult to prove we have a hint that a society centered on electric rail would have both and overall smaller energy footprint and lower complexity and thus lower overall consumption level of all types of goods.
Sort of explains why this route was rejected in the consumption oriented US.
Is there a 3,6 and/or 12-month "moving average" smoothing graphic of these production rates, together with a separate graphic showing the moving average "rate-of-change" (1st derivative)? Probably a 12-month moving average rate-of-change graphic would provide the best visual indicating the proximity of the global "tipping point". Updated monthly, this graphic, made as stark and simple as possible, should be plastered right up front on the TOD homepage. Otherwise it's like riding a roller coaster blind folded. You're just not getting your money's worth. This PeakOil HOWGOZIT would be particularly eye-catching for the casual, ambulance-chasing visitor and would encourage him/her to return regularly to see how it's REALLY going. If the editors have any desire to increase viewership, this is one excellent way to do it. A PEAK is all about a tipping point. Show the onset of the tipping point graphically, in real time (notionally, of course).