| Ukraine-Russia gas spat: some background and context | The Oil Drum: Europe | The Permanent Oil Crisis Conference in Amsterdam, January 21 & 22, 2009 |
Is Europe Running Low on Natural Gas?
Posted by Euan Mearns on January 4, 2009 - 11:08am in The Oil Drum: Europe
Recently, Rune Likvern wrote a post talking about the possibility of a natural gas shortage in the United Kingdom, possibly as soon as February or March 2009. Rune isn't the only one worried about the supply of gas in Europe and the UK. A little over a year ago, Euan Mearns wrote two posts about the European natural gas supply, the first called European Natural Gas and a follow-up addendum called Daddy, will the lights be on at Christmas? In this post, we combine the two posts and re-run them. Besides being relevant to the gas shortage issue, the posts also provide some additional background related to current Russian/Ukrainian dispute.
OECD European gas production looks set to peak in 2008. After that, falling production combined with rising demand will see OECD European gas imports wanting to rise from current 197 BCM per annum to 442 BCM per annum by 2020. Where will this gas come from and how will rising European imports affect N America and the rest of the world?
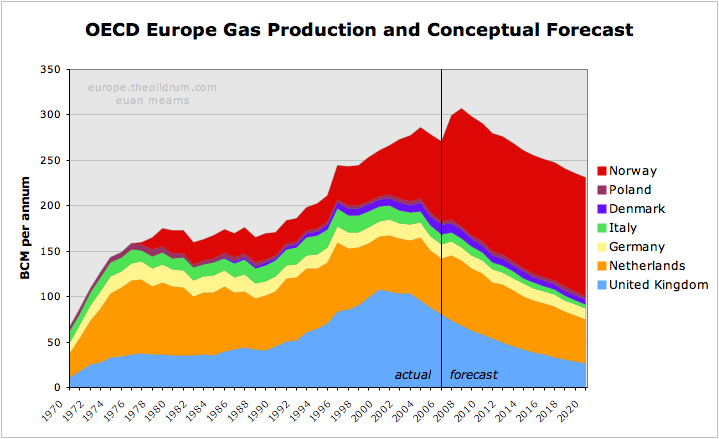
Figure 1 OECD Europe gas production and conceptual forecast. Click all charts to enlarge
Executive summary
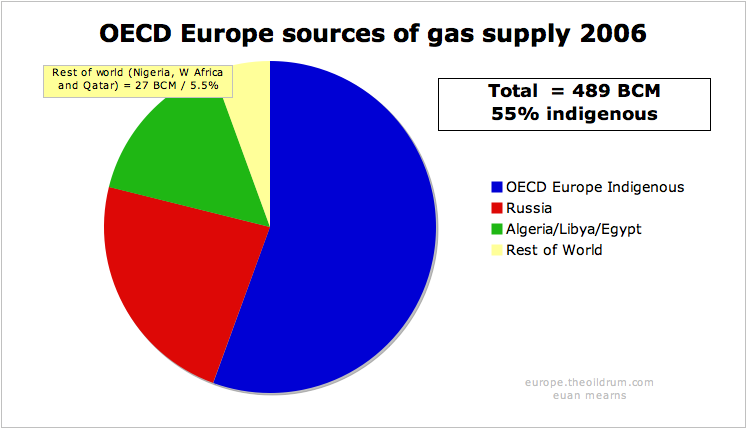
- As of 2006, OECD Europe produced 55% of its own natural gas with the majority of gas imports coming from Russia and Algeria.
- OECD Europe has three main gas producers - Norway, The UK and The Netherlands. Norwegian gas production is undergoing a major expansion, but this is forecast to halt at 130 BCM per annum next year for political resource conservation reasons. UK and Dutch gas production are in decline, and combined OECD Europe indigenous gas production looks set to peak in 2008.
- Gas consumption has been rising at 2.6% per annum since 1980 and there are a number of reasons to suggest that rising demand for gas will continue into the future unless it is checked by high price or shortages of supply.
- It is believed that Russia will do what she can to maintain gas exports to OECD Europe. But with their three biggest gas fields - Yamburg, Urengoy and Medvezhye - in decline, maintaining supplies from second tier assets will be a major challenge. In order to maintain supplies to the OECD Europe, supplies may have to be cut to other countries.
- Algeria, Egypt and Libya will all see expansion of gas production in the years ahead, but will also experience growth in indigenous consumption, especially in Egypt. Gas exports from these North African states are forecast to peak in 2015. They may provide an additional 33 BCM of exported gas to the European market.
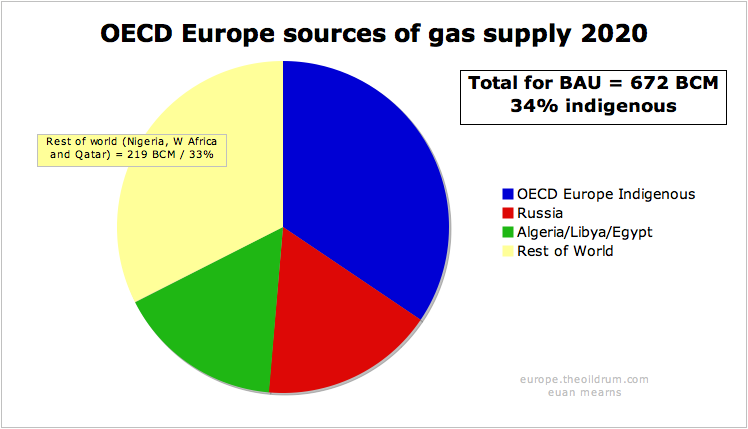
- OECD Europe gas imports are forecast to grow from current 197 BCM per annum to 442 BCM per annum by 2020 - if we see business as usual growth in demand and consumption. Where will this additional 245 BCM come from? Some may come from N Africa and some from West Africa and Qatar. It seems unlikely that an increase in imports on this scale will be possible and that high price and shortage will ration supply. This market driven outcome may hit the poorer nations hardest and one may suspect this may have a destabalising effect.
Introduction
This post will provide a production forecast for Europe's main gas producers (the UK, The Netherlands and Norway); it will examine existing import patterns in Europe's main gas consumers (Germany, Italy and France) and the ability of gas exporters to meet growing OECD European demand - Egypt, Libya, Algeria, and in particular Russia. This article was initiated as part of study of UK gas security. The UK faces rapidly falling gas production and an equally rapid expansion of imports and the key question for the UK is where will this gas come from? This will be dealt with in a separate post.
There are a number of ways to divide Europe for economic analysis. I have chosen to break out data for European states that are members of the OECD. This includes the important oil and gas producer Norway, which is not a member of the European Union (EU) but excludes the Baltic States, Romania and Bulgaria which are EU members but have not yet joined the OECD.

Figure 2 Map of the European Union.
Turkey is a member of the OECD but lies mainly outside of Europe and is not included in this study. Turkey is a major importer of gas, especially from Russia.
Data sources and gas units
Throughout this article I have used data from the 2007 BP Statistical Review of World Energy. I have also used billion cubic metres (BCM) as the standard unit for gas measurement. According to BP, 1 BCM is equivalent to:
35.3 billion cubic feet (BCF)
0.73 million tonnes of liquified natural gas (LNG)
36.0 trillion British Thermal Units (BTU)
6.29 million barrels oil equivalent (BOE)
Gas production forecast
OECD Europe gas production is dominated by three countries - the UK, The Netherlands and Norway, with lesser but significant quantities produced by Denmark, Italy, Poland and Germany.
Figure 3 OECD Europe gas production and conceptual forecast.
The UK
The changing face of gas production in the UK lies at the heart of Europe's emerging gas problem. In 2003, the UK was a net exporter of gas to Europe but with peak production in 2000 and production now falling at 8.7% per annum it had become a net importer by 2004. The challenge facing the UK gas industry will be the subject of a detailed post.
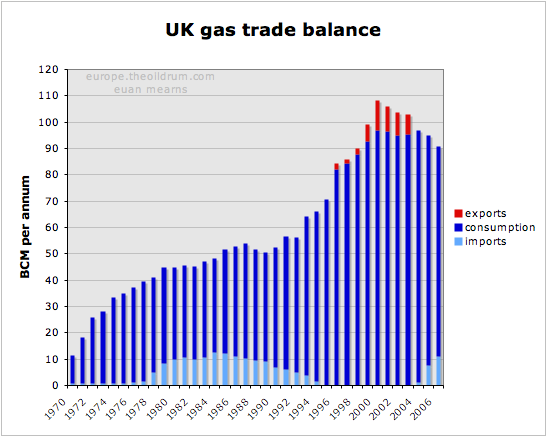
Figure 4 UK gas production and consumption history
The UK forecast is based simply on extrapolating the 8.7% decline to 2020 by which time production is forecast to be 26 BCM per annum. At peak in 2000, the UK produced 108 BCM per annum and in the space of 20 years the UK will have gone from net exporter to a major importer, being dependent upon imports of over 80 BCM per annum.
This view on decline of UK gas production is shared by the UK BERR (Department for Business and Enterprise Regulatory Reform - formerly the DTI). See for example Figure 5.2 in this report.
The Netherlands
The Netherlands is home to OECD Europe's largest gas field. Discovered before WWII, the full extent of the Slochteren Field did not become apparent until the post-war years. It was the discovery of this field in the Permian Rotliegendes sandstone that sparked the exploration for gas and then oil in the North Sea.

Figure 5 Europe's largest gas fields. Data for Slochteren from Rembrandt Koppelaar. Troll and Ormen Lange from the NPD.
Slochteren lies onshore in the Groningen area of northern Holland and dwarfs the giant Norwegian gas fields of Troll and Ormen Lange. Further fields were found around Slochteren in the on-shore and off-shore areas.
Slochteren was never produced flat out and the Dutch government has laterally set a production cap on the field. In the period 2006 to 2015 this cap is set at 425 BCM over the 10 year period. NAM (the Shell - Exxon operating consortium) can optimise production over this time frame but strictly within this overall limit. The production cap on Slochteren has resulted in a long drawn out production plateau analagous to that seen in the Saudi super giant oil fileds - a very enlightened production strategy on behalf of the Dutch government.
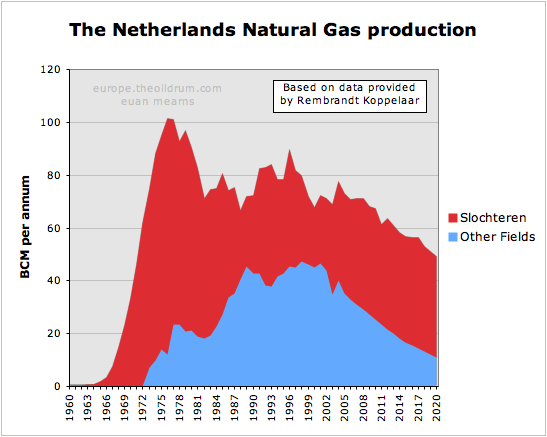
Figure 6 Dutch gas production and forecast based on data provided by Rembrandt Koppelaar. The smaller offshore fields are showing a decline similar to the UK. Note that the volumes here are substantially larger than quoted by BP (see Figure 7). Rembrandt suggested this could be due to adjustment by BP for the energy content of the gas.
The other fields were not subject to regulation and are now in decline in similar manner to the UK gas fields. According to Rembrandt, Slochteren will also begin to decline naturally after 2015 and the bottom line is that Dutch gas production is now in an irreversible decline phase.
The forecast for the Netherlands is based on data kindly supplied by Rembrandt. This has smaller fields declining at a similar rate to the UK, while Slochteren has a somewhat lower decline rate.
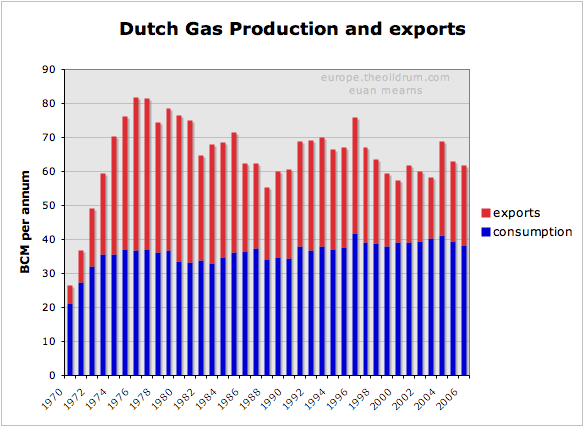
Figure 7 History of Dutch gas production and exports.
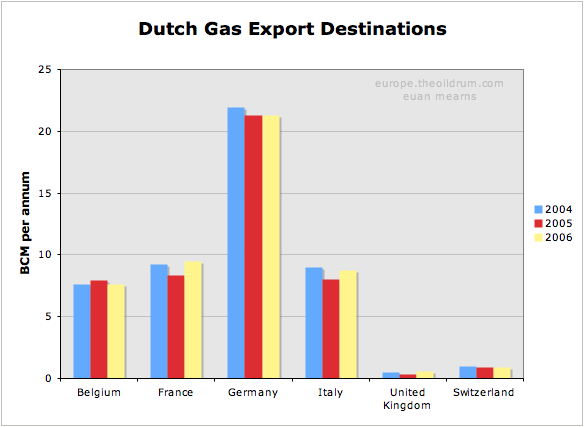
Figure 8 Destinations of Dutch gas exports. Note that the Dutch import gas from Russia and Norway for re-export.
It can be seen that Dutch gas exports have been declining irregularly since the late 1970s and that some day post 2020, the Dutch may become an importer of natural gas.
Norway
Norwegian gas production has expanded rapidly in recent years, mainly the result of the Troll Field development. This expansion is set to go on for another couple of years, but then I suspect the expansionary phase will come to a halt.
In 2006 Norway produced 87.6 BCM of gas. Since then the Langeled pipeline that connects the Ormen Lange Field to Easington in England (and also to continental Europe) has been completed. The capacity of Langeled is about 20 BCM per annum. Furthermore, the development of the Snøhvit Field in North Norway with an LNG train provides Norway with an additional 5.7 BCM capacity.
The Norwegian export pipeline system is reported to have a capacity of 120 BCM per annum. With domestic consumption running at 4.5 BCM and LNG production at 5.7 BCM, future Norwegian production is forecast to run at 130 BCM per annum.
With Europe becoming ever more thirsty for gas, there was a plan to expand production in the Troll Field by 20 BCM per annum. Most significantly, this consent was refused by the Norwegian parliament. Hence Norway is in a position of having ample reserves to sustain a short term production boost, but instead seems to be choosing the path of restrained production which will favour an extended plateau at lower than maximum possible production levels.
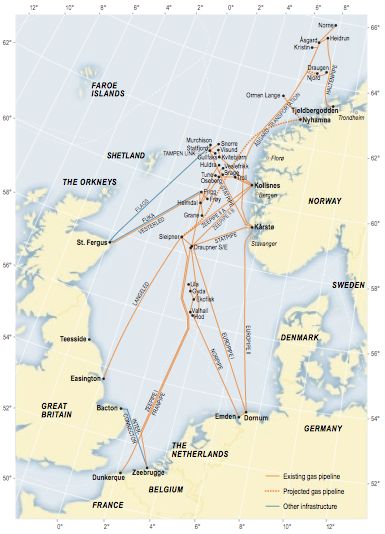
Figure 9 Norwegian gas infrastructure.
The map of the Norwegian gas pipeline export system shows where Norwegian gas enters the UK and Continental Europe. The UK imported gas from Norway during the 1970s and 1980s where gas from the Frigg Field was piped to Scotland via the Vesterled pipeline. Since then the UK has had no need for Norwegian gas - until recently where a massive expansion of import capacity has been built. The Vesterled pipeline is now connected to the Norwegian gas transmission network and has been one route into the UK for Norwegian gas in recent years. There are, however, two new pipeline systems. The already mentioned Langeled pipeline that connects the UK to Ormen Lange via the Sleipner hub. And the Tampen Link that connects Statfjord and other mature fields in the Tampen Spur area to the UK operated FLAGS pipeline system. FLAGS transports associated gas from the northern UK fields to St Fergus in Scotland and since that UK gas production is now in decline, the Tampen Link will fill that surplus capacity - for a while at least.
Five other pipelines make landfall in continental Europe at 4 import terminals. Three pipelines feed two terminals in North Germany. And one pipeline lands at Zeebrugge in Belgium and one at Dunkirk in France. These entry points are connected to a broader European gas transmission system which pipes Norwegian gas as far as Spain, Austria, the Czech Republic and Poland.
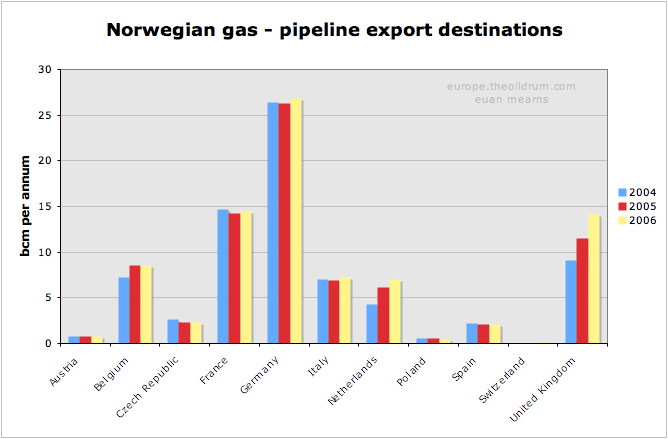
Figure 10 Export destinations for Norwegian gas. Up until 2006, all Norwegian exports were via pipelines to Europe. In 2007, Norway opened its first LNG train and it will be interesting to see where these LNG exports end up.
It can be seen that Germany is by far the largest importer of Norwegian gas, followed by France, Belgium, the UK and Italy. One curiosity in this data is that the Netherlands are shown as a net importer of Norwegian gas. I can but speculate that The Netherlands are importing Norwegian gas to meet export contracts whilst conserving their own gas reserves.
Demand and import patterns
Natural gas consumption within OECD Europe has grown on average at 2.6% per annum since 1980. Back in 1965, Europe consumed less than 25 BCM per annum and this grew to over 470 BCM per annum by 2005, fuelled by North Sea gas. Higher prices and shortage of Russian supply saw consumption fall in 2006.
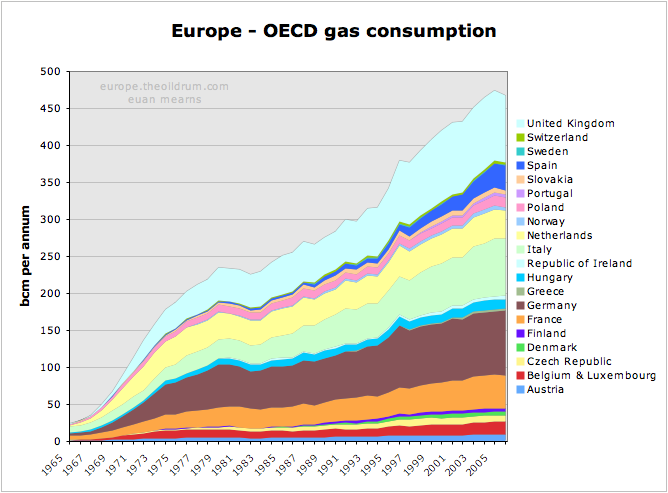
Figure 11 Forty years of gas binge in OECD Europe.
Where next for European Natural gas demand? Will the past trend continue, or will high price curtail demand? This is impossible to answer, but there are a number political, demographic and resource factors consistent with demand continuing to grow unchecked.
- Growing prosperity in former Eastern European states leading to growth in energy consumption.
- Migration from East to West placing greater strain on infrastructure and energy use in the West.
- Migration from Northern to Southern Europe leading to greater prosperity in the latter and ever increasing energy needs - see for example gas consumption data for Spain.
- Climate policies which as a quick fix continues to drive gas power generation forward as a more efficient and CO2 friendly means of generating electricity.
- Pending shortages in oil supplies may lead to substitution by natural gas in automobiles.
If demand for natural gas continues to grow then source of supply and the security of that source is highly relevant. The following section shows the main sources of supply for Europe's main consumers (excluding the UK). One thing all gas import strategies have in common is diversity of supply.
Germany
Germany has some significant and stable indigenous gas production, but is heavily dependent upon The Netherlands, Norway and Russia for pipeline imports. With Dutch gas production in decline, Germany will presumably be looking to increase supplies from elsewhere.
The cornerstone of the German strategy is the Baltic pipeline that will assure supplies of Russian gas direct to Germany that will by-pass former Soviet republics and East European states.
Without LNG, the German strategy seems constrained, since falling UK and Dutch production will place greater demand on Norwegian and Russian gas from several other states.
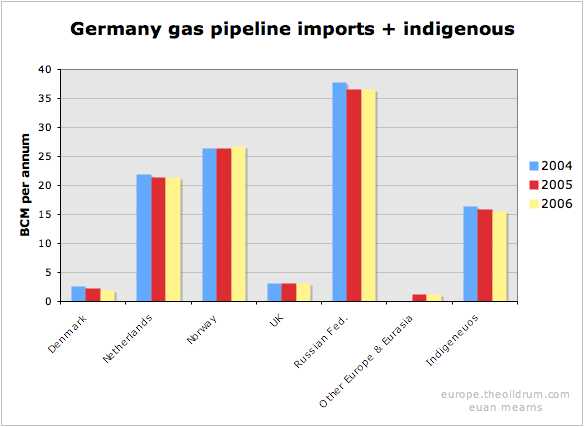
Figure 12 The import sources of gas to Germany.
France
France is unique among major European gas consumers with no indigenous gas production. France produces no oil and only a little coal - hence their reliance upon nuclear energy for power generation.
Like Germany, France relies heavily upon Dutch, Norwegian and Russian gas pipeline imports. France also has a mature LNG import trade with significant imports from north and west Africa.


Figures 13 & 14 The import sources of gas to France.
Italy
Italy has significant but falling indigenous gas production. It also has a highly diversified gas importation infrastructure born in part from its geographic location. Italy imports gas from Norway, The Netherlands and Russia but is also linked to Algeria and more recently Libya by pipeline.
Italy also imports small amounts of LNG, mainly from Algeria. Note how there were significant imports from Nigeria in 2004 - but then nothing. It seems these cargoes may have switched to France in 2005 / 06.
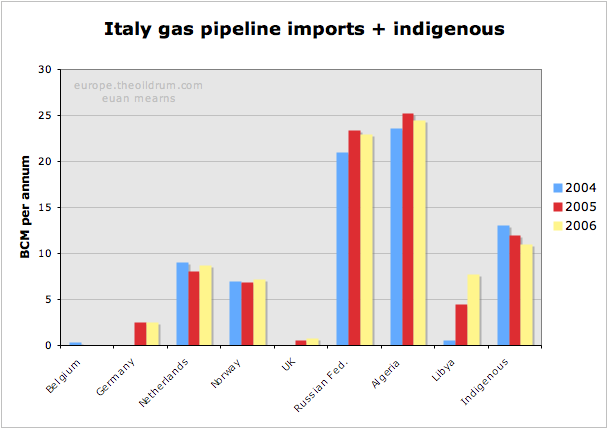

Figures 15 & 16 The import sources of gas to Italy.
Current and future sources of supply
The chart shows that Russia and Algeria are by far the most important sources of imported gas to OECD Europe. This raises the questions of whether or not these countries will be able to maintain or increase future supplies and if not, where will Europe's growing thirst for gas be met in the future?
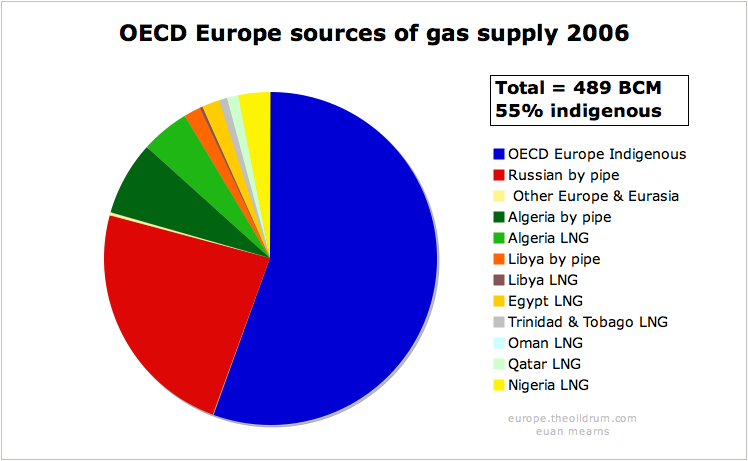
Figure 17 Sources of gas in OECD Europe in 2006.
Russia
Russian gas production had an interim peak in 1991, and with the fall of the Soviet Union went into decline for a number of years. Since 1997, production has begun to rise again and a new high was reached in 2006 of over 600 BCM per annum. The $60K question is where next for Russian gas production? This question is just as important as the future direction of Saudi oil production.

Figure 18 Russian gas production, consumption and exports.

Figure 19 Destinations of Russian gas exports
Russia exports less than one third of its gas production. The majority of exports are to OECD Europe, though a significant amount still goes to former republics. But the amount going to Ukraine, Belarus and Moldova is not documented in the BP statistics, and is presumably included with Russian consumption data. The structure of Russian gas production makes exports vulnerable to any down turn in production and / or increase in domestic consumption. Russian gas exports have been essentially static since 1990, and with the largest fields in decline (see below) it seems unlikely that Russia could at this stage raise production to meet the rising import requirements of OECD Europe.
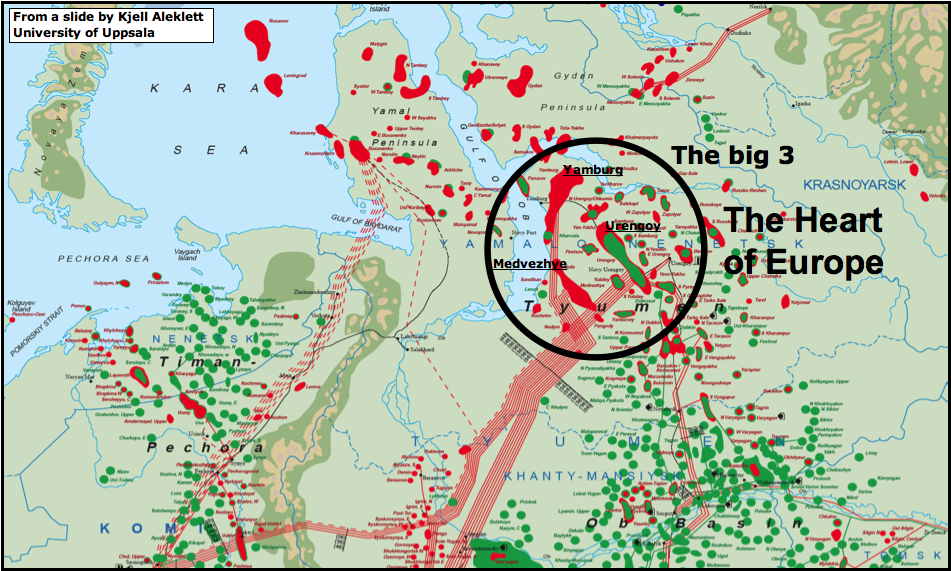
Figure 20 Map showing the west Siberian gas fields of Russia. The three giant fields of Yamburg, Urengoy and Medvezhye have historically provided the bulk of Russia's gas. All three are now in decline (see below). Much of Russia's remaining potential lies in this area, particularly on the Yamal peninsula, to the left of the circle. The map is borrowed from a presentation by Kjell Aleklett.
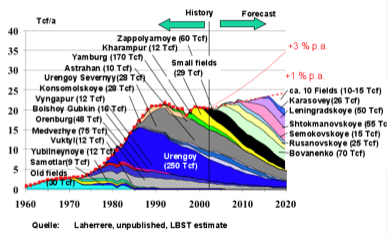
Figure 21 Russian gas production forecast by Jean Laherrere showing how second tier fields may compensate for decline in the three giants - Yamburg, Urengoy and Medvezhye.
Historically, more than 50% of Russian gas production has come from 3 giant fields - Urengoy, Yamburg and Medvezhye. This excellent chart (unpublished) from Laherrere shows that all three of these core producers are in decline. Since Russia has relied upon these three supergiants for core production they now have an inventory of second tier giant fields to develop that may compensate for the decline from The Big 3, as shown on Laherrere's chart.
The challenges for Gazprom are immense. Bovanenko lies on the Yamal peninsula below permafrost. It is at the end of proposed piplelines shown as dashed red lines on the map above. Shtockman lies out of helicopter range in the Barents Sea. Recent reports suggest that the Russians want to use a floating nuclear reactor to power the production platform.

Figure 22 Russian gas production scenarios by Jean Laherrere. WEO forecasts show rising consumption matching rising production with flat exports of around 200 BCM per annum.
This new chart from Laherrere 2007 shows a peak in Russian gas production about 8 years from now with unconstrained production which is unlikely to happen. Instead, constrained production as indicated by the slowly rising WEO 2006 forecast matched by rising consumption will give rise to relatively flat gas exports forward to 2020. So it seems likely that Russia will be able to maintain gas exports but will unlikely be able to increase exports to compensate for falling OECD Europe production.
A critical geo-political question, however, is how these exports are distributed in future? The Sakahlin projects will see East Siberian gas entering the Asian markets for the first time. Furthermore, the Baltic Gas Pipeline will witness a new prioritisation of gas energy security in Germany and western Europe.
The Baltic Gas Pipeline, which is under construction under a joint venture between Gazprom and German companies BASF and E.ON, will deliver 27.5 BCM per annum direct to Germany in the first instance with the option to rise to 55 BCM. All of OECD Europe's gas from Russia currently has to cross The Ukraine and then either Slovakia or Poland in order to reach the main destinations of Germany, Italy and France. As we saw in the winter of 2005 / 6, Russia struggled to meet all commitments given extreme cold weather at home and cut gas supplies to some unfavoured former Soviet enclaves. The spat with Ukraine at that time highlighted how dependent OECD Europe was on the goodwill of the Ukrainians and the Baltic Pipeline circumvents that problem, providing gas security to Germany at least.
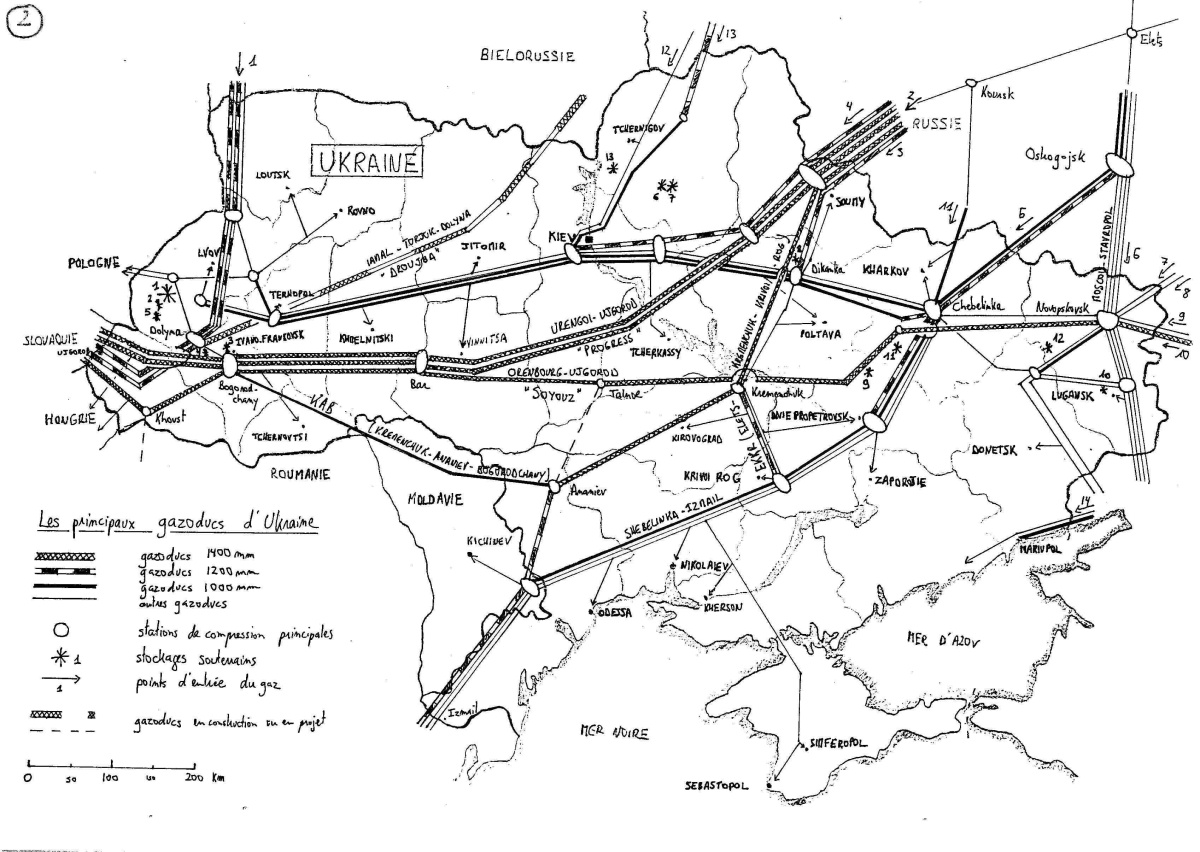
Figure 23 Map of pipelines in Ukraine that carry Russian gas to western Europe via Poland and Slovakia. From Ukraine vs Russia: Tales of pipelines and dependence by Jerome a Paris
The Baltic pipeline will be fed primarly by gas from a new field. The Yuzhno-Russkoye field, which recently started production, is located in the same area as Urengoy, is included in Laherrere's chart and is one of the new fields that will offset decline from The Big 3. This new export capacity, therefore, does not necessarily represent new productive capacity but merely a more secure route for Russian gas into the OECD.
OECD Europe currently receives 115 BCM per annum from Russia, so the Baltic pipeline may eventually secure almost half of those deliveries. However, should OECD Europe face gas shortages, it is those countries at the end of the pipeline that will still be most vulnerable. Some interesting negotiations may lie ahead.
In summary, it is exceedingly difficult to predict how reliable Russian gas exports to OECD Europe will be in future. It seems most likely that Russia will maintain current production levels of 600 BCM per annum until 2020. However, increasing domestic consumption, and exports to East Asia may see gas exports to the west declining. Germany will be in the strongest position to secure supplies. If the remaining supplies are rationed by ability to pay then some of the poorer eastern European states may suffer.
Algeria
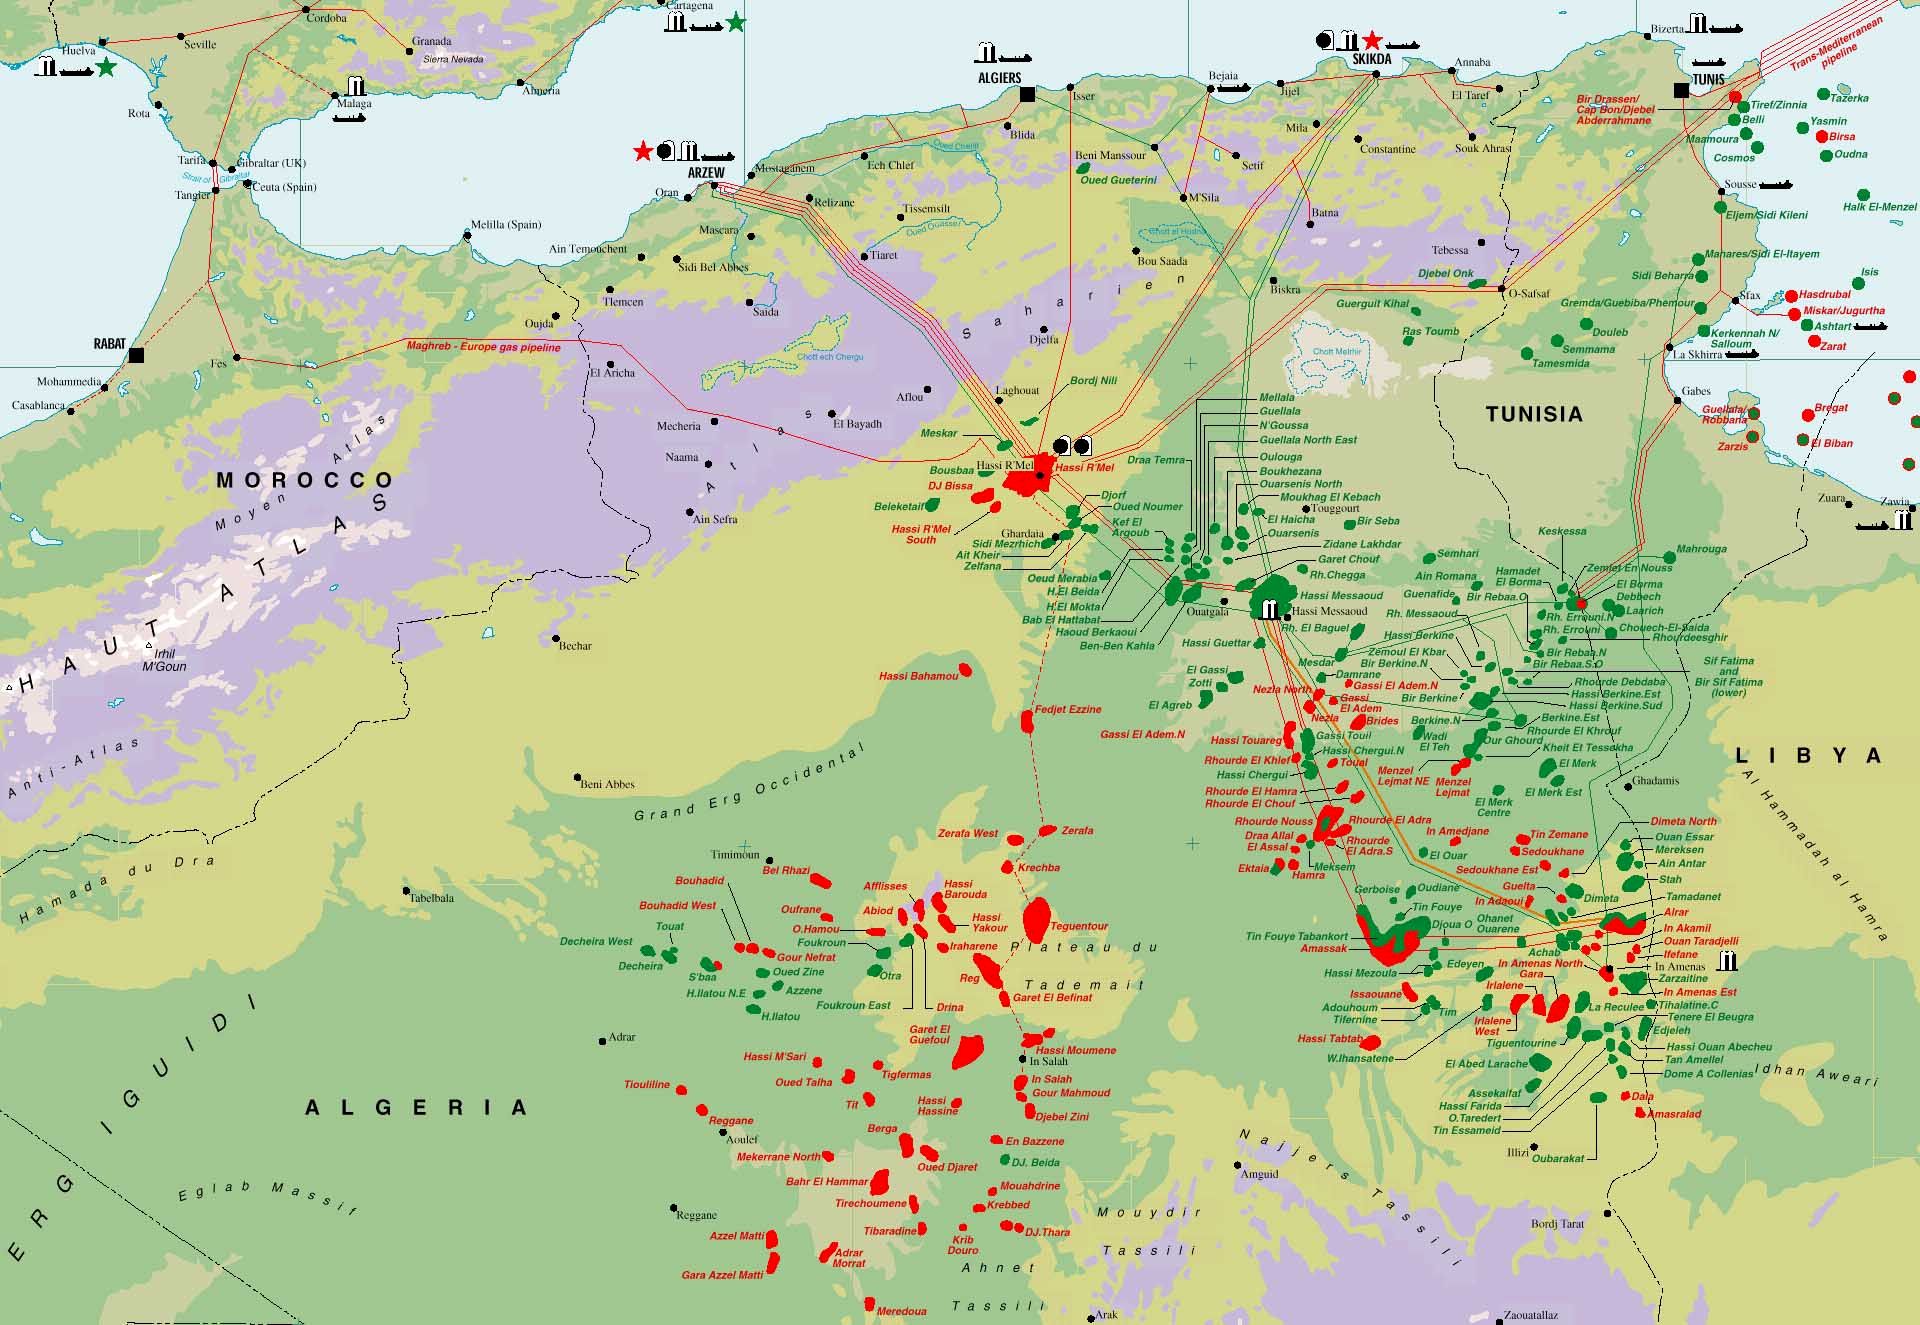
Figure 24 Map of oil and gas infrastructure in Algeria. Europe is fortunate to have gas rich North Africa lying off its southern shores.
According to the BP Statistical Review, Algeria has 4.5 TCM remaining gas reserves placing it number 8 in the world. Accordng to the analysis of Jean Laherrere, Algeria has 4TCM gas reserves remaining, which is in fair agreement with the BP figure. It is fortunate for Europe that Algeria lies close to the southern border of the continent allowing Algerian gas to be piped into Italy and Spain. There is also a significant trade in LNG between Algeria and Europe.
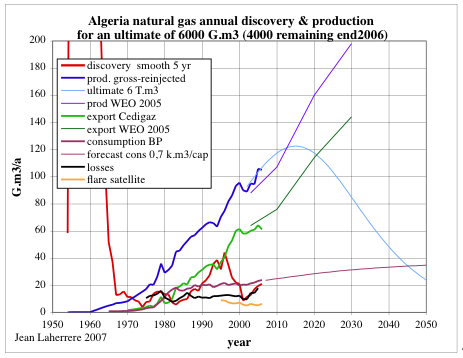
Figure 25 Discovery and production gas models for Algeria by Jean Laherrere.
Laherrere provides a more detailed picture of gas production than can be compiled from the BP data. The main difference is production reported gross of re-injected gas. An unconstrained production peak some 17 BCM per annum higher than today's production is shown around 2015.
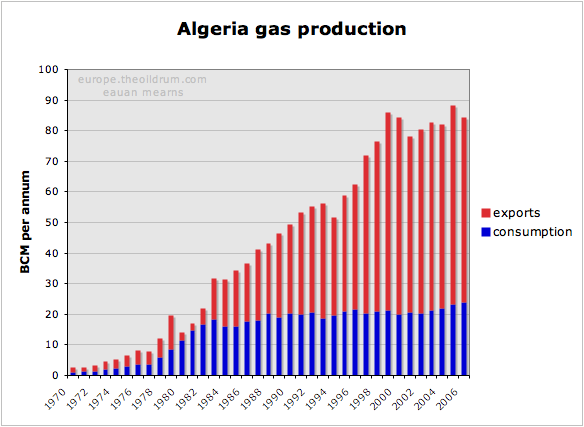
Figure 26 Algeria gas production, consumption and exports. Production and exports have not risen since 1999.
Algerian production grew steadily until 1999 but has since stagnated. There was a new discovery cycle during the 1990s and it is this that may provide impetus for some new production growth. Algerian consumptin is growing slowly and this will consume a portion of new production. New gas export capacity is estimated roughly to be 12 BCM per annum by 2012.
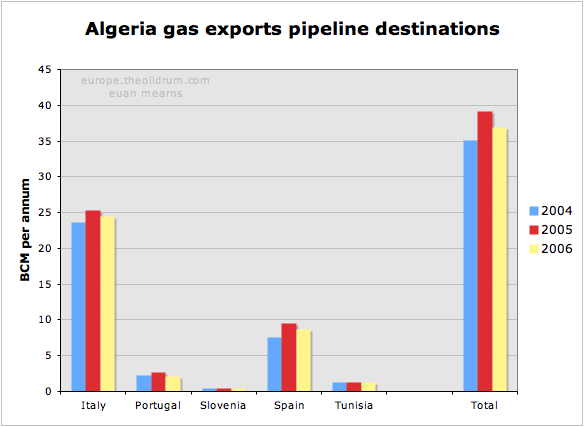
Figure 27 Destinations for Algerian pipeline gas exports.
Algeria exports about 37 BCM per annum by pipeline but is also active in LNG production with LNG exports of 25BCM in 2006. Most of the LNG was exported to Europe (and Turkey) with only small quantities going further afield. Europe is a short trip for an LNG tanker from North Africa, and in terms of tanker utilisation I suspect it will continue to be more profitable to deliver N African LNG to Europe than further afield.
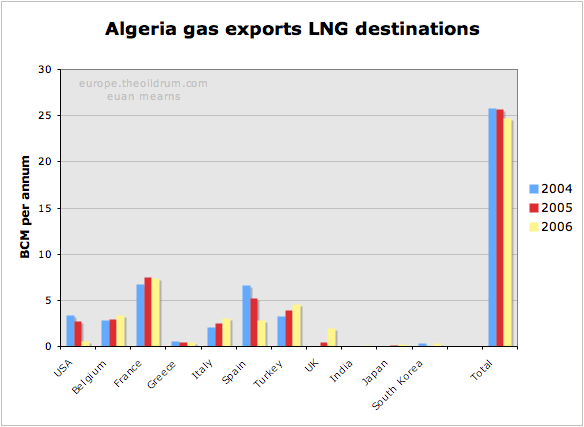
Figure 28 Destinations for Algerian LNG gas exports.
The IEA 2005 energy outlook had this to say:
Algeria is the third-largest exporter of natural gas in the world. Exports are expected to increase as pipeline and LNG projects are brought on line. Gas exports were 64 bcm in 2003 and are expected to climb to 76 bcm in 2010 and reach 144 bcm by 2030.
The IEA target for 2010 looks marginally optimistic and their target for 2030 is a reserves busting feat as indicated on Laherrere's chart (Figure 25).
Libya and Egypt
Both Libya and Egypt have seen rapid expansion of their gas production and exports in recent years. This is set to continue at a slower pace for a number of years according to these forecast models from Jean Laherrere. Growing population and domestic gas consumption in Egypt looks set to outstrip production growth and Egypt may cease to be a gas exporter beyond 2025.

Figure 29 Gas discovery and production models for Libya by Jean Laherrere.

Figure 30 Gas discovery and production models for Egypt by Jean Laherrere. In the export model (Figure 31) I have used the "slow" production model for Egypt.
Combining the three production models of Laherrere from Algeria, Egypt and Libya provides this picture of gas exports from N Africa peaking at around 120 BCM per annum in 2015. That represents a 33 BCM per annum growth from current export levels.
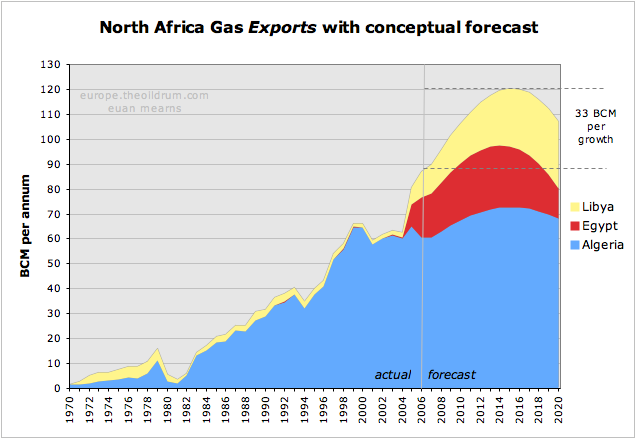
Figure 31 Gas export model for N Africa showing expansion of production and exports in the years ahead but with a conceptual export peak around 2015.
OECD Europe gas security
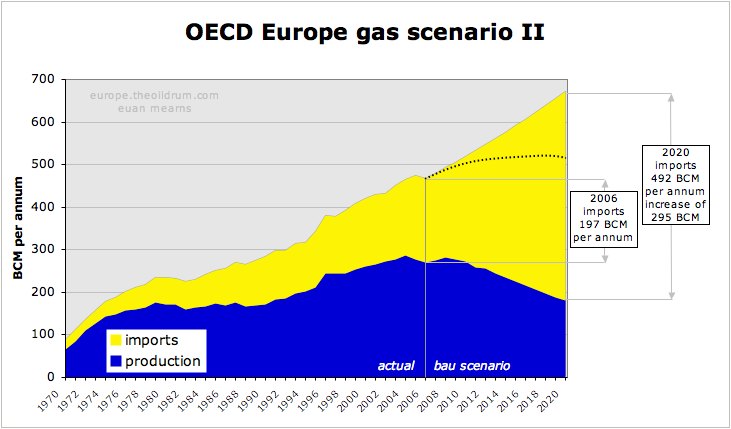
With OECD Europe indigenous gas production set to decline and good reasons for believing that demand for natural gas will continue to expand in the future, OECD Europe faces the prospect of importing ever larger amounts of gas (LNG) from ever more remote parts of the world. Current imports are running at 197 BCM per annum and the BAU scenario shown below shows imports burgeoning to 442 BCM by 2020. Where will this additional 245 BCM come from?
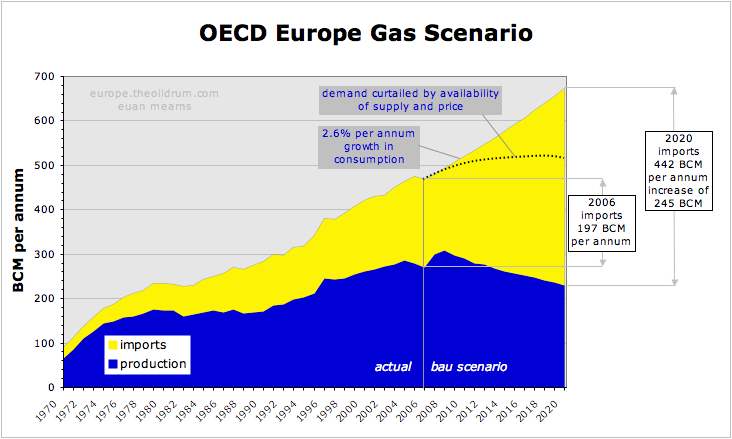
Figure 32 Gas scenarios for OECD Europe summarising the indigenous supply forecasts and demand forecasts from the preceding sections. With the BAU demand scenario, imports will need to grow from current 197 BCM per annum to projected 442 BCM per annum by 2020 - an increase of 245 BCM per annum. It is doubtful that this quantity of gas may be sourced from African and Middle East markets. It is therefore considered more likely that high price and supply shortages will curtail demand for gas. It is conceivable that conservation, more efficient energy use and substitution with alternative sources of electricity may fill the gap left by declining gas supplies.
This is near impossible to answer with certainty. My feeling is that Russia will strive to meet current commitments which will result in their gas exports neither increasing nor decreasing in the 2020 time frame. N Africa will see strong growth in production that will be offset by strong growth in their domestic consumption. Up to 33 BCM of new supply may come from N Africa and it seems reasonable to assume that the majority of that gas will come to Europe. That leaves 212 BCM to source from else where and will inevitably entail a massive expansion of LNG export and import infrastructure beyond that which already exists. In the period 2010 to 2020 Europe will face fierce competition for LNG supplies from the mature markets of Japan, South Korea and Taiwan and growing competition from new markets for LNG in the USA and most likely also in China.
In 2006, the total global LNG trade was 211 BCM and so we are talking about doubling that by 2020 to satisfy OECD European needs alone. The main sources of new supply will be West Africa (Nigeria), Qatar and Iran. Since Qatar has declared a moratorium on new LNG projects forward to 2011 it is a major challenge for these three countries alone to meet global demand growth.
Figures 33 & 34 The changing face of gas security in OECD Europe. With a BAU demand scenario, OECD Europe will face importing ever growing quantities of LNG from remote sources around the globe.
The crux of this whole issue is how growing demand for gas is managed. The UK, and other OECD governments seem intent on allowing market forces to determine the outcome. I would be the first to admit that the dynamics of supply and demand in the European gas trade has so many dimensions that trying to regulate and plan this trade is not simple. But on the other hand, allowing market forces, national economic strength, and price to determine who gets and who doesn't get the available energy may have disasterous and unforeseen outcomes. A scenario where the former Soviet Republics and then the east European states and perhaps Turkey are left in the cold whilst western Europe uses historic strengths to secure itself energy supplies may have unpleasant outcomes flowing from a newly destabilised former Soviet bloc. Energy poverty throughout the poorer parts of Western Europe may also have undesirable consequences for the warm middle and upper classes.
The main message of this post, therefore, is to call upon the politicians of the OECD in Europe to show some rare leadership, and to recognise that massive energy conservation, and expansion of sensible alternative energy schemes, offer a better alternative to the polarisation that is likely to result from allowing market forces to determine the outcome of energy decline.
Acknowledgement I am indebted to Jean Laherrere who upon my request sent his most recent work on gas resources in countries relevant to the European market. Many of the charts come from a paper titled "Etat des reserves de gaz des pays exportateurs vers l’Europe" presented at Club de Nice Energie et geopolitique 29 nov. - 1er dec. 2007.
Addendum: Daddy will the lights be on at Christmas?
... or is Europe running low on natural gas?
OECD Europe gas imports may grow by 295 BCM per annum by 2020. In the same time period, global LNG production is set to grow by 350 BCM per annum. So we Europeans should be OK, so long as the USA, Japan, China, South Korea, India and Taiwan are not planning to expand their LNG imports as well.

Edinburgh, the capital of Scotland, at Christmas. A wondrous site. And none of our politicians or the general public ever wonder where the energy comes from and how we will pay for it. Cutting CO2 emissions is a priority for all parties. Eliminating nuclear power is also high on the agenda. Confused? Our politicians certainly are. Visit Edinburgh while you can, it's one of Europe's finest cities.
This is a follow up to the post I had on European Gas last week. In the comments nrgyman2000 posted his forecast for Norwegian gas production that was somewhat more pessimistic than the assumptions I had made. The UK department of BERR also sent me some more reports with interesting data on Global LNG liquefaction and regasification capacity. SamuM posted a lengthy comment on Russian gas with 10 charts that is recommended reading. This post aims to pull this new information together and concludes that European gas and energy security is in a perilous situation.
Norwegian gas supplies
nrgyman2000 [Editor's Note: Now known as Rune Likvern] posted this forecast for Norwegian gas production to 2020. This forecast looks realistic and is based on official reserves estimates for Norwegian gas fields and estimated decline rates. In essence the giant Troll (in red) and Ormen Lange Fields (in white) show no decline in the forecast period since they are producing well within capacity and are facilities constrained. Other gas fields and associated gas from oil fields decline as reserves become exhausted.
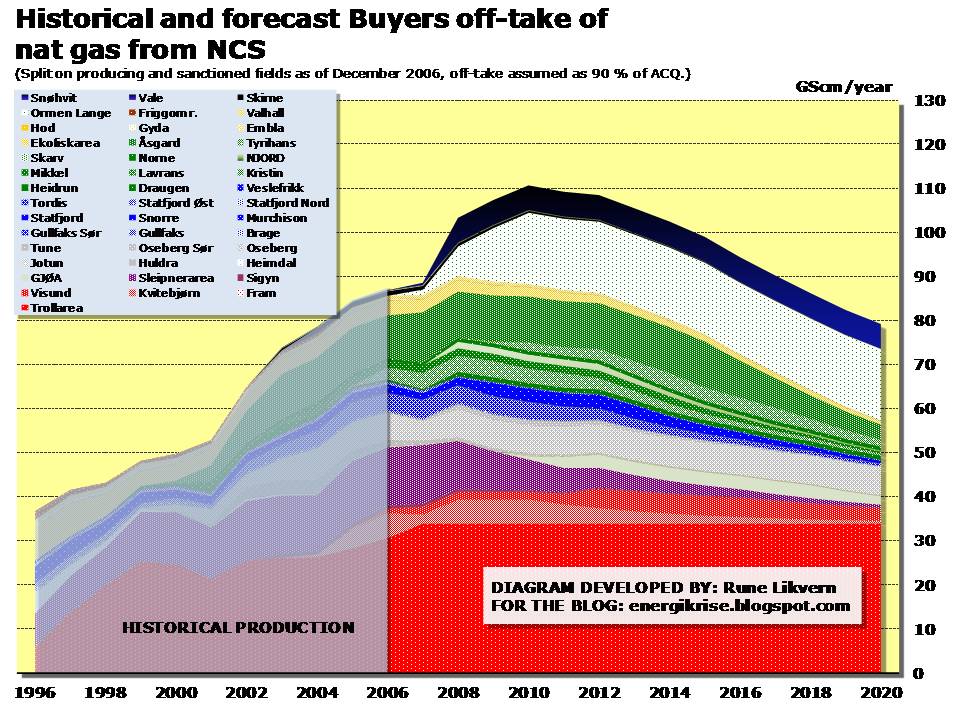
I sent this to the Norwegian Petroleum Directorate (NPD) and invited comment. As always the NPD were very obliging and sent me this link to this figure saying that this was the only official gas forecast from Norway for the last five years.
I need to point out that Norway does hold large gas reserves and could produce higher volumes but this is a political issue. The Norwegian government recently refused an application to expand gas production in the Troll Field by 20 BCM per annum - in the interest of maximising oil recovery from that field. A future expansion of Troll may well take place and new field discoveries and developments may further boost Norwegian production beyond the volumes forecast by nrgyman2000.
But in the absence of any firm commitments on behalf of Norway in this regard, Europe should be planning for reduced gas imports from Norway from 2010. Given the energy predicament that Europe finds itself in, it would be helpful if the Norwegian government provided some clearer guidance as to their future gas export potential and intention. It would be a sensible strategy for Norway to impose energy rationing upon Europe and in so doing instill best practice in energy consumption, lay the ground work for sustainable energy use and lower the vast amounts of CO2 that Norway exports to the rest of the world every year.
Russian gas exports
In an excellent comment, SamuM posted this chart attributed to Aleksandr Ananenkov, Deputy CEO of Gazprom. The chart seems to come from this presentation by Vladimir Milov in Budapest in September 2007, on the Nabucco pipeline proposal. I've uploaded this presentation on the TOD server and it can be downloaded here.
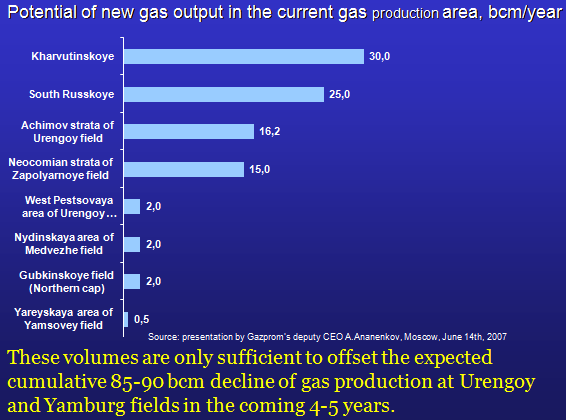
This chart tends to confirm the contention I made in my European Gas post, which was that new field development in Russia would be sufficient to offset declines in the years ahead, but no more.
A revised view of OECD Europe's gas import growth
Taking into account the information posted by SamuM reinforces my view that Russia will maintain but will struggle to increase gas exports to OECD Europe in the years ahead. And taking into account the Norwegian gas forecast of nrgyman2000 suggests that Europe's indigenous production may be lower than I previously assumed. The revised forecast shows an increase in OECD gas imports of 295 BCM per annum to 2020 if consumption follows historic trends. Where will this gas come from?
For good measure I have made a similar chart for OECD Europe oil imports. Anyone wondering why world oil prices have gone up and are still rising need look no further than this chart. Where next for the oil price?

Liquefied natural gas - LNG
The UK government department for Business Enterprise and Regulatory Reform (BERR) have sent me reports on gas amounting to thousands of pages in recent weeks. More on that when I post on UK gas early in 2008. However, two tables from this report (large pdf) by Global Insight caught my eye. I have often heard that global LNG import capacity far exceeds export capacity and these tables seem to verify this contention.
The first of these tables (Exhibit 3) details how the global LNG trade is expected to develop in the period to 2025. Focus on Case A which is an optimistic scenario. At present there is 250 BCM liquefaction capacity (400-150) and 510 BCM regasification capacity (800-290). Note that liquefaction capacity equates to export capacity and regasification equates to import capacity. So, globally there is double the import capacity than export capacity for LNG.

By 2020, the timeframe for most forecasts, liquefaction capacity is forecast to grow to 600 BCM per annum and regasification capacity will grow to 1000 BCM per annum. The imbalance is redressed slightly but import capacity will still exceed export capacity by a factor of 1.7. It seems like there will be many disappointed importers and in a competitive LNG market the stage looks set for gas prices to escalate.
The other highly significant feature of these data is that they give an indication of how the international gas market will grow in the years ahead. Global Insight appear to forecast growth of 350 BCM per annum. Comparing this with the forecast growth in OECD Europe imports of 295 BCM per annum shows that Europe alone will likely have the appetite to consume most of the new global LNG supply in the period to 2020. What about the USA, Japan, China, India, South Korea, and Taiwan?
This discrepancy is so large I wrote to BERR inviting comment but have not received a satisfactory response as to how 350 BCM new global LNG export capacity is to be shared around the OECD and India and China?
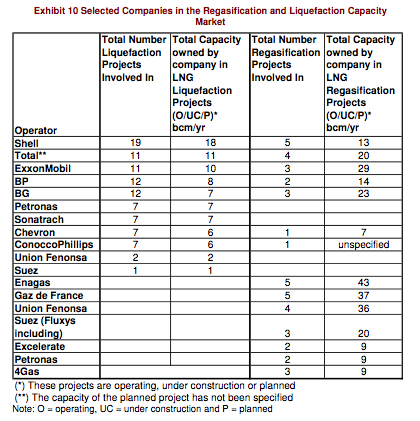
Looking at the strategies of the International Oil Companies (IOC's) there is a similar picture (Exhibit 10). At present they have built 83 BCM of liquefaction capacity and 269 BCM of regasification capacity. I find this quite extraordinary that companies will happily invest in import infrastructure for non-existent product. The UK gas strategy will rely heavily upon LNG imports and there is a headlong rush to build import facilities.
Is it just me, or does anyone else sense the presence of an elephant?
Conclusion
Daddy, will the lights be on at Christmas? Most probably yes in the UK, though it is worth noting that with cold weather across continental Europe, UK gas spot prices have been running about double this year compared to last. With governments intent on pursuing market regulation of the energy sector we must wait for prices to get so high that this kills demand (the elderly freezing to death) and inflation kills our debt laden economy.
Next year I'd quite like to see the UK government commission studies on foreign gas supplies that goes beyond building import facilities and assuming the gas will be there to fill them. I'd also like to see the Norwegian government publish a clear statement of intent on their future gas production potential and strategy. It is no longer satisfactory to have national governments cite IEA reports that are built upon the incredible efforts of the United States Geological Survey.
Personnel
Editors
Contributors
Peak Oil Primers
Archives
- November 2010 (3)
- October 2010 (6)
- September 2010 (4)
- August 2010 (7)
- July 2010 (6)
- June 2010 (7)
- May 2010 (2)
- April 2010 (8)
- March 2010 (4)
- February 2010 (6)
- January 2010 (3)
- December 2009 (5)
- November 2009 (8)
- October 2009 (12)
- September 2009 (6)
- August 2009 (5)
- July 2009 (11)
- June 2009 (8)
- May 2009 (16)
- April 2009 (10)
- March 2009 (7)
- February 2009 (10)
- January 2009 (15)
- December 2008 (9)
- November 2008 (9)
- October 2008 (9)
- September 2008 (13)
- August 2008 (10)
- July 2008 (14)
- June 2008 (23)
- May 2008 (16)
- April 2008 (12)
- March 2008 (16)
- February 2008 (9)
- January 2008 (13)
- December 2007 (13)
- November 2007 (16)
- October 2007 (22)
- September 2007 (8)
- August 2007 (9)
- July 2007 (16)
- June 2007 (8)
- May 2007 (7)
- April 2007 (7)
- March 2007 (10)
- February 2007 (10)
- January 2007 (12)
- December 2006 (9)
- November 2006 (15)
- October 2006 (4)
- September 2006 (5)
- August 2006 (5)
- July 2006 (9)
- June 2006 (5)
- May 2006 (10)
- April 2006 (9)
- March 2006 (13)
Vital Trivia
License

This work is licensed under a Creative Commons Attribution-Share Alike 3.0 United States License.
It doesn't look good. Regardless of Jerome a P's views on Russian gas I think the trustworthiness of that source must now be under a cloud. I recall the excitement of the gas fired communal CHP experiments in the UK (Woking?) which now seem premature. Apart from lower Africa the Southern Hemisphere seems to have a lot of probable deepwater gas and coal seam methane, some of which will go into LNG. North Asian customers will take the lot however.
I haven't yet read through this long pdf
http://www.sgc.se/Rapporter/Resources/seminar_screen.pdf
on biomass gasification and methanation as a source of bio-syngas. It is potentially much more abundant than methane from fermentation but both could be injected into the gas network, as could hydrocarbon gases made with nuclear heat. It could be a lot cheaper in the end to learn to use less gas period. Passive heating, microwave cooking and semi-organic farming for starters.
In the UK something like 11 out of 16 million houses with cavity walls are uninsulated. Assuming an average saving of 6000kwh gas per property insulated there is 6bcm of efficiency savings from one initiative(minus a little in reverence of Jevons). A lot of work for unemployed construction workers aswell.
Not certain what the state of play is with loft insulation. I bet the average is less than 150mm.
Nick2W
Lots of numbers on this in the appendix of this 2008 report from the Building Research Establishment on Fuel Poverty prepared for the Committee on Climate Change:
http://hmccc.s3.amazonaws.com/pdf/The%20effect%20of%20the%20CCC's%20proposed%20carbon%20budgets%20on%20fuel%20poverty%20(BRE).pdf
The Committee have been prepared to use a 'high high' future gas price of 90p/therm.
Should they have used an even higher one?
BobE
Bob - my view on energy price evolution has been dented by events of 2008. Energy bills will rise to consume an ever greater share of our disposable incomes, but this rise will likely be slow and steady.
It would be interesting to know what an average price of 90p / therm would mean for gas and electricity bills. This likely means a winter peak spot price approaching 200 p / therm (wild guess) since much of our gas is still supplied on contract at low rates.
At some point, individuals will choose to share accommodation - 2 people sharing a 2 bedroom flat - shock horror - and this will almost halve utility energy expenditure for those doing so - maybe they even share a car - and before you know it they get married and have kids and the emerging solution becomes part of a new problem.
Euan,
Indeed. I have thirty years of gas and electricity bills for my flat, and two can live for the same energy as one (but the gas/electricity mix seems to change).
I think some of the lavish 'aspirational' home design has to be binned. The Motorola Home of the Future 1962 looks a pig to heat, the TV is too small and I hate to think what would happen if you fell out of bed. I hope they didn't build any.
http://www.plan59.com/decor/decor073.htm
BobE
If you don't like the Motorola House you can choose from among these models.
http://www.n55.dk/NEWS/AUG_News.html
Hi Bob
Given where the British 'Peso' is heading relative to the Euro I suspect so given that more and more of our gas will have to be paid for with hard currency in the coming years.
Nick
Well, I'm only optimistic about Russia's ability and willingness to honor the contracts it has entered into, not anything more (and gas importers seem to agree, given their eagerness to lock in such long term contracts.
One major potential source of upside is energy efficiency improvements inside Russia, in particular in its power sector, which is the biggest user of gas right now, and is woefully inefficient. The optimistic version sees Russia switch to better gas-burning technology, thereby releasing gas for export; a slightly more scary scenario (from other perspectives like climate change) is a major switch of power generation to coal, with a similar release of gas for export.
Euan,
For such a detailed post you conclusion;
"With governments intent on pursuing market regulation of the energy sector we must wait for prices to get so high that this kills demand (the elderly freezing to death) and inflation kills our debt laden economy."
seems a bit gloomy. We have historical examples of gas shortages in the past being handled by rationing, conservation, substitution without large numbers of elderly freezing to death. Inflation seems to be the lesser evil right now.
Neil maybe you're right. But it is a fact that by allowing high price to kill demand it is the poorest and most vulnerable who switch off the heat and who can least afford to insulate. I think you might also find that the elderly did freeze to death in the past - just not well reported. We have an aged population living increasingly alone in poor quality houses.
Both posts were written in 2007 and inflation just killed our debt laden economy. Agreed that deflation is now in charge for a while - but with Gordie and Allie throwing money at the economy like pixie dust I still expect full blooded inflation to win the day. if it doesn't then we are witnessing the end of capitalism as we know it.
I live in Hungary, and here we are encountering a situation just like that. In this year up until now 51 people are reported to fall victim to the hard winter because they were unable to pay their heating bills.
http://nol.hu/lap/mo/lap-20090103-20090103_2-13 (This is a Hungarian article which was published in the biggest Hungarian newspaper.) The victims the article dealt in details were 73, 66, 63 and 48 years old.
Sad, but no surprise. The glowing television screen in the squalid apartment adds a nice Orwellian touch.
Hello Neil,
"We have historical examples of gas shortages in the past being handled by rationing, conservation, substitution without large numbers of elderly freezing to death."
Can you give some examples of that? UK govt policy is currently to let everyone use as much gas as they want, then if demand looks like outstripping supply, cutting off gas supplies to industry, which would cut gas usage by bit less than 10%, and probably eliminate a substantial sector of our industry dependent on natural gas (apparently about 300,000 jobs in total).
Rationing is exactly what the govt's policy is, as described above, but if we, the UK, get into the situation where we are cutting off gas supplies to industry, and I suspect this is a matter of if not when, then this I would have thought will also be accompanied by high swings in gas prices, and the less well off's ability to pay for gas.
Doug
Although the situation in North American natural gas is tricky at best one can assume that the US will potentially be a sporadic large importer of LNG in the future.
I think the European NG situation is ok when you look at it in and isolated context but the important isssue is if a large import demand will develop in other countries esp for LNG.
I can readily see the US becoming a respectable LNG customer in the coming year with as I said chances for spike in demand. This is assuming that UNG plays become problematic.
I think if you include the potential for rising LNG demand from North America and potentially South America that the global LNG situation will become tight if you will over the next several years.
What Europe face is what I call the LNG inflection point what this means is the point at which LNG importers are willing to pay to differential to compete with pipeline gas.
The problem is this difference is fairly fixed and is the cost of liquidification its finite. Once this is crossed we are now in a new world for NG where remote and local customers are on a level playing field. Thus for Europe the issue is when is this boundary crossed ?
From the excellent article as far as I can tell this is about 10% of European NG usage.
We can surmise that a robust LNG market would put and additional 10-20% of the current pipeline NG market in competition with the world LNG market that up to 30% of the external NG sources are in danger of becoming highly competitive. This is in my opinion more that sufficient to ensure that Europe will be forced to compete with the world for NG in the fairly near future.
Thanks for a very informative post Euan.
Have you investigated the potential for Coal Seam Methane (CSM) production within the UK or Europe?
In just a few years (two ?) Coal Seam Methane exploration in Australia has approximately tripled our nat gas reserves.
Here is a link to one Australian Company which believes it has the potential for 670 BCM of CSM in South Wales. (PDF warning)
http://www.edenenergy.com.au/pdfs/ASX_Announcement%2020080901%20SW%20CSM...
Thanks TT, well worth a mention. Coal seam methane (CSM) is not currently on my radar. If CSM has tripled nat gas reserves in Australia, are you able to say what % of nat gas production is from this source. I think CSM is significant in USA and Canada - but not something I know much about.
Dear Euan and others.
Coal Bed Methane (CBM) has mileage in The US and Australia , but is fraught with problems in the UK. Starting with permissions to drill, environmental impact reports,fighting city hall then thin coal seams in highly faulted areas. I seriously doubt the economics in the UK, how long an econimic life span at the well head for each well. Drilling and Service costs can also kill the economics.
It is attempted periodically often in the midland vally of Scotland, and other parts of the North of England. But it will not ever have more than a local impact which will probably be short lived.
Happy New Year btw.
Dropstone
Sorry for my misleading statement. That "tripling of nat gas" reserves refers to the likely long term results of exploration. However new discoveries and uprates of previous exploration makes paints a picture of a very rapidly developing industry.
This is being driven by the world LNG market which prices gas at over twice the price of Australian East Coast natural gas and the push to reduce Greenhouse Gas emissions where Nat Gas has a big advantage over coal.
Here is an article from March 2008, which projects long term reserves in the range of 15000 - 30000 PJ. (400 - 800 BCM)
http://www.oilvoice.com/n/Booming_Coal_Seam_Gas_Sector_Set_For_Further_G...
According to this article
http://www.sydneygas.com/who_we_are/our_achievements/coal_seam_natural_g...
CSM production was 20 PJ in 2003, 75 PJ in 2006 and 110 PJ in 2007. (0.5 BCM, 2 BCM and 3 BCM)
According to this OilDrum post by BigGav,
http://anz.theoildrum.com/node/4094
Australian production of Nat Gas is around 2000 PJ per annum but that is growing rapidly too. ( 52 BCM)
The 110 PJ in 2007 represents around 5% of Australian production. There appears to have been considerable expansion of CSM in 2008 but it is too soon to piece together a coherent number for the whole industry.
However all these numbers are small compared to a projected European demand of ~400 BCM / annum.
Re the comment from Dropstone, I had wondered about the faulting of UK coal seams. For the non-geologists, faults are sub-vertical dislocations that offset strata (e.g. coal seams) in layered sedimentary rocks. In "stable" continental environments like Australia, coal seams may extend unbroken for miles, allowing them to be drilled with long horizontal wells from which coal bed methane may be produced.
The UK has in the bast been subject to multiple tectonic episodes that has broken up our Carboniferous strata. So if you try to drill coal beds horizontally, things may go well for a few hundred meters then you cross a fault and drill into mudrock. This was and still is a major problem for deep mining.
I'd be skepitical about coal bed methane ever making a major contribution in the UK - whilst it may be a good source of non-conventional gas in other areas. ERoEI and maintaining flow from expensive wells is likely to be a major problem though.
Net Export Rate Versus Remaining Cumulative Net Exports
This is a theme I have been exploring lately regarding net oil exports, and we would see the same dynamics regarding natural gas exports. Consider Indonesia, a founding member of OPEC. It appears that 1996 was the final oil production peak for Indonesia. Here are the net export numbers per day, by year for Indonesia, along with remaining post-1996 cumulative net exports (EIA):
1996: 780,000 bpd & 100%
1997: 665,000 & 78%
1998: 710,000 & 56%
1999: 605,000 & 37%
2000: 493,000 & 21%
2001: 356,000 & 10%
2002: 214,000 & 3%
2003: 102,000 & 0%
2004: Net Oil Importer
Here are the net export numbers expressed as a percentage of 1996 net exports (left) and remaining post-1996 cumulative net exports (right):
1996: 100% & 100%
1997: 85% & 78%
1998: 91% & 56%
1999: 78% & 37%
2000: 63% & 21%
2001: 46% & 10%
2002: 27% & 3%
2003: 13% & 0%
2004: Net Oil Importer
Note the illusion of the 1998 increase in net exports (happy days are here again!). The reality was that Indonesia’s remaining cumulative net exports fell from 78% to 56% in one year (22 percentage points, one fifth of their remaining net export capacity in only one year)--when their net export rate went up year over year.
This is an absolutely key point: At the end of 1998, when their annual net exports were down by only 9% from the 1996 rate, they had already shipped close to 50% of their post-1996 cumulative net oil exports. And by the time that their net export rate was down by about 50%, in 2001, they had shipped 90% of their post-1996 cumulative net oil exports.
Fig. 7 above is yet another real world example of the ELM in action ... with gas this time!
Following current trends, by 2020 the UK will be almost totally dependent on the net exports of others for food, fertiliser, oil, gas, coal, uranium, cars, aeroplanes, computers etc etc ... I wonder what we can possibly sell to pay for all those essential things?
Financial services?
Possible but not probable IMO ... seeing as how the Banks can't afford to lend enough to meet domestic demand.
I suspect that our friend Euan was being a wee bit sarcastic.
Oh! I suspected that ... but persuading people to have faith in our financial wizardry and lend us loads of money is how we have survived our energy decline so far, we are living beyond our current means ... if the highly profitable financials aren't there any more, IMO we in the UK are in trouble.
Clearly, the bankers have no idea what they are doing or we wouldn't have the current mess.
Our financial sector looks suspiciously like it was a bubble (or boil maybe?) waiting to burst, just like the one in Iceland ... time will tell.
If we don't have anything to sell to buy what we need the the only alternatives are borrow or do without ... IMO only people earning a good income are loaned money.
Euan,
dont forget BritArt, BritPop, BritFashions and whoever follows on from Harry Potter.
Seriously, I think our problems will start a lot earlier than 2020. The aging coal fired power stations were supposed to be used intermittently as base load support as they only have 20 000 hours of permitted use. The law of unintended consequences kicked in and the stations are being run more often than not. In other words, the owners are 'sweating the assets'. This means they will run out of licences to generate power as early as 2013.
I would suggest, if gas is not freely available from neighbors; and if these stations shut down earlier; and if Gas Storage drilling doesnt happen; and if we have nothing of value to barter for LNG: then we face serious, chronic brown-outs and acute blackouts easily by 2012 -2015.
Of course, on the plus side, we will meet all of our carbon emission targets which of course will be a delightful pronouncement as we continue in our new cooling phase.
Rgds Dropstone
I'd forgotten that "Take That" had reformed and that Robbie wants to rejoin the band. If nothing else that should get lager sales moving again.
Our coal-fired power stations will of course be permitted to march on amid a cloud of inert rhetoric.
And I've already heard Gordie pronounce that oil will be banned by 2050 - emissions targets assured.
Here's to a prosperous 2009,
Euan
The US fallback plan is to dismantle and export McTulips, I mean McMansions.
Looking at this it seems like the U.K could have realy trouble meeting peak electricity demand in coming years, perhaps many buildings will have diesel engines fitted as some combination of CHP and backup power. I know there are many households (I am currently renting one) which have no gas connection and rely on overnight electric water heating with night storage heaters to keep them warm. We are currently using about 20+kWhs a day, if the building was better insualated (working on it) and an air source heat pump and / or wood burning stove installed I think the electricity demand would drop by as much as 50%.
The UK does seem ideally suited to short range electric vehicles, since the average commute is less than 10 miles and due to traffic congestion and the train service can take much longer than it should.
I think UK energy policy should focus on a couple of areas.
Electricity generation, move towards new nuclear power, expansion of onshore wind power and roll out of CHP in appropriate areas. A roll out of IGCC units with the ability to co-fire natural gas could be a good compromise between energy security and emissions.
Retrofit of older housing making use of higher insulation standards, heat pumps along the lines of http://www.zedfactory.com/
More flexible worktimes, reducing peak commuting rates and total commute miles driven by increasing working from home (we might be leading to a repeat of the 70's with three / four day weeks)
Expansion and electrification of the existing train network, possibly making use of battery electric hybrid locomotives http://ge.ecomagination.com/site/products/hybr.html there is plenty of manufacturing capacity avaiable with the economic slowdown. I proposed adding stations close to motorways and creating transport hubs where liftshares can be arranged, and park and ride style car parking can offer quick transfer to city centres (ideally to become light rail in the future)
A push towards manufacture of airsource heat pumps, electric bikes / motorbikes and the above hybrid locomotives as well as wind turbines, marine current turbines and Salters long forgotten duck.
Fitting frequency response to non essential loads, especially domestic/ industrial refrigeration and commercial space heating.
A gradual move to make most packaging either compostable or burnable with an aim to use gassification of waste streams to generate electricity and provide space heating.
I think there will be a huge market for small, light 10-15kW generator units which can be used as range extenders for EV's or CHP ideally running on natural gas or diesel fuels.
As gas exports decline, meeting the winter peak can be done with a series of wedges namely more wind, better insulation and deferable loads, also adding more off peak electricity demand from electric vehicles could help more wind and nuclear power into the mix.
The real problem of course is how we are going to be able to do anything if we are bankrupt :(
Europe began prospecting for shale gas:
http://www.iht.com/articles/2008/08/22/business/eurogas.php
I recall reading about a passive energy house that might be heated with the amount of electricity required to operate a hair dryer. There are massive gains to be had in conservation/insulation efforts. A group of Alaskan Eskimos used to live in igloos heated by seal fat lamps. Recently northern Alaskan heating bills were higher than mortgage payments.
Assuming that the UK can knock down and replace all the houses or indeed retrofit them to passivhaus standards is IMO completely absurd ... people can't afford to buy the current houses let alone destroy them and build even more expensive ones. Energy is but one of a cluster of problems that we face.
You just make me realise the difference between good and bad goverment policy.
Lol - the inuit who lived in igloos wore clothing heavier than many of us wear outside in deep winter. I think what was more evident was acceptance that winter is cold and adjusting their behavior accordingly. (didn't most people in the middle ages wear hats all the time - even inside?)
I think the solution lies somewhere inbetween. Add insulation and efficiencies to homes in cold/hot climates but also take a hard look at how you dress in those homes (panty hose or t-shirts in january?)
Somewhere along the line as we super-insulate and dress more appropriately we might be able to arrive at a workable compromise.
My opinion
Al
WTF - its a good list. But I just don't see major evidence for much of this happening on the scale or urgency required. The government still prefers to hand out energy subsidies to the old - heat goes straight to atmosphere and money straight to Norway.
In Aberdeen we started building about 8 new schools last year - these have super high spec and will replace old drafty buildings. Snag is this was being funded by debt provided from Iceland - that bastion of global capitalism - and the work has been halted on 4 of these schools. The UK is already bankrupt - financially and morally. Blair's lies are coming home to roost.
Euan, a timely rerun of your earlier posts.
Changes in the nat gas supplies for EU (or OECD Europe) is happening at a breathtaking pace and it really requires good time to keep oneself updated.
The diagram above shows actual consumption (solid colors) of nat gas within EU (plus Norway) for the years 2001 - 2007 split on production within EU + Norway (blue color), pipelined imports (red color) and imports of LNG (Liquefied Natural Gas) (yellow color).
EU + Norway’s nat gas production “peaked” in 2004 at approximately 290 Gcm (Bcm) and was down by 25 Gcm(Bcm)/a by 2007 and continues to fall. The increase in Norwegian gas production does not offset the declines in production within EU.
In the diagram is also shown a forecast, developed by me, towards 2020 (transparent colors) for the supplies as shown with solid colors. For 2008 Norway’s production is expected to be lower than what I forecast last summer, EU’s production is expected to continue to decline, and I have forecast Norwegian nat gas production to peak 2010 - 2012.
In the forecast towards 2020 I have expected pipelined imports and LNG imports to EU to grow based upon available data from sources like Gazprom for Russia and other studies showing growth in LNG imports and growth from North Africa.
The solid black line in the diagram shows expected growth in consumption/demand for EU + Norway towards 2020 based upon IEA World Energy Outlook 2007.
The diagram, showing my forecasts, suggests that the European nat gas market is now starting to tighten and will continue to do so in the future and my forecast shows a potential gap between my forecast supplies and IEA forecast demand close to 200 Gcm (Bcm)/a by 2020, and now I find it hard to comprehend how this emerging gap will be filled.
The diagram above shows the split of EU’s imports of nat gas split on LNG and pipelined imports slit on countries. (As a basis for the diagram, I have assumed that Norway is grouped with EU.)
That nat gas imports may show some variations over time should come as no surprise. However note in the diagram that EU’s imports from Russia has been in a gentle decline since 2004, while imports from other Eurasian countries has grown to offset the decline from Russia.
The two diagrams also illustrates that Russia has provided for approximately 25 % of EU’s nat gas supplies in the recent years.
Several analysts have forecast that Russian nat gas production will decline in the near future. I think the Russian will continue to, as they have always done, honor their contractual obligations towards EU nat gas customers.
The developments in places like Turkmenistan and Uzbekistan where Gazprom is buying huge quantities of nat gas may suggest that this is also done to ensure supplies for Gazprom export commitments.
Does the above comment answer the question used for heading of this post?
I have in the making a post on the developments in the European nat gas market together with an analysis of the forecasts from IEA World Energy Outlooks (2005 - 2008).
Question: How much can weather impact this equation? Assuming industrial demand stays on trend (which is down), how would a 3 standard deviation cold winter impact NG supplies? A 3 standard deviation warm winter? Eg. what is the supply elasticity of degree heating days required for any individual heating season?
Nate,
Temperatures have a huge effect on nat gas demand (also in Europe). This has been observed from data from National Grid, as temperatures drop, demands grows and data from EIA shows the same on US nat gas demand.
Actual data from National Grid for UK shows that demand for October and November 2008 was up more than 10 % than forecast by National Grid earlier in 2008 for the same months.
National Grid has in recent years tended to forecast higher temperatures than actual temperatures, thus underestimating demand.
To find more exact how this deviations play out the (UK) data needs to be adjusted for nat gas used for UK electricity generation that still shows strong growth.
Anyone else seen data for European countries that better can answer Nate’s question?
Rune, do you have plans to update your charts about the UK NG situation? It would be nice to know how the story develops.
tommy,
I will update the charts and presently I plan to revisit my story of 18th. December 2008 in late this January. So far as I can tell from the data the picture very much remains, with the exceptions that the forecast dates for emptying storage have moved a few days into the future much thanks to warmer weather than normal in the days leading up to Christmas allowing for some reinjection of nat gas.
Nate, virtually the whole of N and W Europe is sub-zero today - but hey its winter, nothing unusual in that. My feeling about these Russian nat gas spats is that when they cannot supply the European system, they pick a fight and cut supplies to low or non-payers. The dispute is spreading and if our cold winter continues (it doesn't normally get going properly until February) then we could see an acute supply crisis developing.
http://www.upstreamonline.com/live/article168978.ece
Rune will keep us updated I'm sure.
Hi Euan,
If I had something that people were lining up to buy at twice the price (400 vs 179) someone else was not even paying for on time despite the cut-price and moreover who vociferously castigated me, wanted to join a military club that opposed me, supported other regimes opposed to me, then do you think I would be remotely interested in selling it to them now that the contract has expired? Would you, if so why? It's no wonder that Russia wants to build a pipeline direct to Germany bypassing other countries.
Ukraine have said the transit contract no longer applies, i.e. IMHO this means they basically want to steal the gas because they can't afford to pay the current going market price - maybe they are hoping the price will be lower soon. If I was Russia right now at very least I would cut off all gas to Ukraine and tell them to come back when they have paid what is owing and agree to pay the market price in return for a market price for the transit. Since this has been foreseeable for some time I would also have already been on a PR exercise to my EU paying customers explaining we cannot continue to see our gas stolen by Ukraine and they should put pressure on Ukraine or make up the difference.
Note the above does not even take into account Russia's geopolitical needs for a sphere of influence. Does the EU/Nato want a flaky country that steals gas from its neighbours?
Hello Euan,
Outstanding detail & analysis, Kudos!
[From your keypost above]:According to BP, 1 BCM is equivalent to: 36.0 trillion British Thermal Units (BTU).
Since it takes approx 33-35 million BTUs to make a single ton of ammonia using the Haber-Bosch Process [to keep the math simple I will use 36]:
36 trillion/36 million = one million tons of ammonia
[From your Figure 1 chart]: 2009 OECD natgas production approx 300 Bcm
Therefore, future OECD generations are being deprived of indigenous 'potential' ammonia & urea for making I-NPK at a burn rate of 300 million tons/year, then postPeak decreasing thereafter as natgas becomes ever more scarce. Global N-production in 2007 was 100 million tons [source: IFA], therefore a 3:1 burn ratio for the OECD alone. Globally, we might be looking at a 'potential' ammonia burn ratio of 30:1 if all natgas, not used for H-B, is considered. A well-insulated house can save enough energy to generate a lot of food if the 'saved' natgas goes towards ammonia & urea.
Thus, ever more reasons to ramp O-NPK recycling and boost SCT's proposals for a new ammonia infrastructure to keep the foodstuffs coming. It is the usual heat & lights vs eat argument: "Daddy, I could care less about having outside Xmas lights, I want to sit in the dark so I can continue to eat food!"
[19-page Potash PDF Warning, but lots of graphs and charts]:
http://www.potashcorp.com/media/pdf/customer_service/market_analysis_rep...
---------------------------------------------------
Q4 Market Analysis Reports November 20, 2008
[page 5]:Higher Global Gas Prices Expected to Support Nitrogen Market
Higher global oil prices have directly impacted Western European natural gas prices, and therefore the cost of producing nitrogen there, as approximately 60 percent of the region’s nitrogen production is based on oil-linked contract pricing for natural gas. The weighted average price of gas for Western European nitrogen producers is projected to average $13/MMBtu for 2008.
[page 6]: In 2008, Western Europe became the high-cost global ammonia producer.
Despite the recent fall in oil prices, natural gas prices in this region are expected to increase to $16/MMBtu in the fourth quarter. High gas prices have forced the temporary curtailment and shutdown of ammonia capacity there, increasing Europe’s demand for ammonia sourced from other regional suppliers. Ukraine’s gas price increased substantially again in 2008, which raised the international floor price for nitrogen exports.
--------------------
You can only defer I/O-NPK inputs to topsoil for just so long before harvest yields start plummeting as a Liebig Minimum asserts itself. We need to be globally enriching the soil towards a Liebscher Optimum, and then keeping it there. The farming world could have easily used 200 million tons of ammonia in 2007 but the flowrate and affordability just wasn't there.
What are the postPeak prospects for vastly increased H-B Nitrogen, plus much more P & K in 2015, 2030, and beyond as global pop. is still increasing? I would say it doesn't look very good from where I sit unless a strategic, global paradigm shift occurs. Have you hugged your bag of NPK today?
Bob Shaw in Phx,Az Are Humans Smarter than Yeast?
Hello TODers,
My 30:1 SWAG of the annual rate we are foreclosing the BAU H-B ammonia future was remarkably close to the actual:
Using BP statistics from Energy Review 2008:
http://www.bp.com/liveassets/bp_internet/globalbp/globalbp_uk_english/re...
----------------------
Total World Natgas Production 2007 = 2,940 BCM
----------------------
2,940/100 BCM, or 100 million tons of ammonia in 2007 = 29.4:1, or roughly 3% of natgas went to growing food in 2007
ftp://ftp.fao.org/agl/agll/docs/globalfertdemand.pdf
-----------------------
UN FAO Global Fertilizer Demand [2015,2030]
..global forecast of 187.7 million Mt in 2015 and 223.1 million Mt in 2030.
-----------------------
*IF*, by 2030 we need 223 million tons of H-B ammonia or 223 BCM for growing food, and *IF* natgas production has declined by approx. half by 2030, then:
1500/223 BCM = 6.7:1 ratio, or 15% of natgas will have to go to growing food in 2030. I think a bag of I-NPK will only be affordable to the very rich long before then as I don't even see us reaching the 2015 N-forecast of 187 BCM in the next six years, or 187 million tons by 2015 with the ongoing credit crunch and production curtailment of I-NPK.
Feel free to elaborate or dispute this analysis of mine as I am not an expert.
EDIT: OOPS! my quote above was for total I-NPK, not for N-Only. From Figure #3 of FAO PDF: 2015 & 2030 are forecast to be 115.4 & 137.4 respectively, but that is still implies very aggressive H-B infrastructure growth to reach these benchmarks if global natgas production starts declining. Recall from the study's conclusion:
---------------------
While the model does not include the soil nutrients from animal manure or the N fixed by legumes, it provides a preliminary global perspective on the relationship of fertilizer demand and soil fertility maintenance.
The fertilizer demand forecasts indicate that the fertilizer industry can expect a substantial global increase and some changes in fertilizer used. Demand may be even larger if biofuels expansion continues and economic growth in developing countries (particularly India and China) continues. The increase is expected in all regions.
------------------------
Daddy, will there be food at Christmas?
Bob, I suspect we have already reached the point where the answer will be no for many families who are burdened with debts and who have just lost their jobs. Untangling the market causes here is impossible, but the UK finds itself in a position where indigenous energy production will fall year on year and it has become very quickly bankrupt having entered the bad times with massive debts.
So I see the social situation deteriorating rapidly - and this of course will cut demand for energy and food.
The wisdom of offshoring fertilizer production is of course highly questionable but I seem to recall that fertilizer accounted for just 5% of global nat gas consumption - and we need to assume this will get some priority. Though its not unlikely that it will get very expensive and this will cut demand and reduce food production in line with the squalor that is likely to spread.
Euan,
I think we're chatted before about the UK's commitment to the EU with respect to phasing out its coal-fired generation. Now, with the Russian intrigue, I wonder if other members of the EU will be reconsidering their commitments to the same. Any chatter over there re: this possibility?
I mean it only half in jest.
We Brits should beg Gazpom to build own and operate 30 GW of new gas-fired power plants in UK to replace the 30 GW of non-LCPD-compliant coal stations that must close by 1st January 2016. The new Russian-owned fleet would be supplied by a dedicated pipeline all the way through the Baltic, across Denmark, to the UK East Coast.
We had better do this quickly before they realise that we also will never be able to pay for these, when built. Let's hope no one in Gazprom reads TOD!!
Hugh, there are many a true word said in jest (or half jest perhaps!). You could extend your hypothesis (however it's spelt) to EDF regarding nuclear build (it could be unclear I suppose).
As Xeroid has spelt out above, we have conned the world for long enough with our "mythical" financial prowess and got away with it. Our days may be up. Fortunately I have never had any faith in the something for nothing wizzardary of the financial sector and have always believed it would end in tears. The result is I am not rich, my house is not large, but my mortgage is paid, I can afford to heat my home and my kids have a reasonable (though cramped) life. I said years ago (to my wife) when she kept saying we could do with a larger house "Energy prices will go up and all these people buying large houses will have to be able to afford to heat them".
I have been an energy pessimist ever since I worked in the UK coal industry (1985-1989) and saw the vast amount of the stuff ploughed out of the ground and the energy that went into actually operating the mine. One pit in the north east of England had a booster fan that was 1 MW alone! I used to ask people then how much energy it took to mine the coal and no one really knew. I was unaware at the time that I was actually asking about EROEI!
Thxs for the reply.
Euan and Rune,
This is all excellent stuff.
Any price forecasts? The UK Committee on Climate Change has been using a 'high high' price of 90p/therm in some of their calculations.
What are your price projections for 2020 and 2030?
[edit]---Euan, you seem to have answered this further up the page with 200p/therm while I was writing this---thanks
BobE
sorry meant to open a new window
Thank you for the excellent post. This certainly points up why BP has been happy to warehouse the gas they have leased in the massive fields under Alaska's north slope. Not likely any of that gas will escape the colonies, we seem to have developed a voracious appetite for it.
It is interesting, however, that BP is one of the strongest opponents of piping our north slope gas to ice free tide water and pumping it into the LNG market. It would seem their opposition would not be in Britain's best interest, but then big tankers can't get to Chicago and a pipeline can. Maybe the Midwest town, far from seaports, will be forced to pay premium prices. Kind of fitting stranded gas to a stranded city.
Totoniela -2 points
1. I wrote Wednesday, June 20, 2007 US swapping oil security for fertiliser insecurity and higher farm and food costs which is self explanatory
http://tinyurl.com/2o73ro"So US (and Canada) reliance on foreign oil, through a huge switch to ethanol now relies heavily on the Middle East for nitrogen fertiliser, a low cost commodity which costs a great deal to ship and haul - to feed the nation."
2. Ukraine , once the breadbasket of Russia has had huge floods this spring which has had a major impact on the grain harvest see Friday, August 15, 2008
Georgia - the dress rehearsal for Ukraine ..already suffering from once in a century floods and a very nasty gas bill shock due at New Year....
http://tinyurl.com/9eo2m9"The floods , mainly from the Prut, Dniestr (15 metres above its normal level) and Seret rivers have submerged 40,600 homes and over 84,000 acres, (34,000 hectares) of farmland in western areas - some reports claim over 100,000 acres."
To which was added this PPS (this was August)
PPS : January 2009 Ukraine is committed to begin paying Russia’s Gazprom in the range of US$400 per 1,000 cubic meters for natural gas or US$22 billion per year. Presently the country pays US$179 per 1,000 cubic meters, or US $9.9 billion per year.
Viktor Yanukovych, is the leader of the opposition pro-Russian Party of the Regions - who have kept quiet about the price increase - Gazprom and the Kremlin might be tempted to play the “gas card” in order to see Yanukovych elected and to gain control—if not direct ownership—of the Ukrainian trunk gas pipeline, a long-time objective of Russian policy meant to give Gazprom the ultimate say over the largest supply route of Russian gas to Europe.
With a possible debt of over US$10 billion by late 2009, the new Ukrainian government could be forced to sell the pipeline to Gazprom by writing off most of the accumulated debt — as well as a substantial part of its industrial base, maintain the Russian Black Sea Fleet in Sevastopol and renounce its intention to join NATO.
... if it is cold in December ...
Did hopefull add "I you see Sid (or Gordon or Hilary of the Boy David )..tell 'em." hoping that this might foprwarn our political masters of the problems looming.
Judging by the hapless Energy Minister Mr O'Brien on BBC2 Newsnight last night the message didn't get through ... and still hasn't.
He limply said wind energy provides "in the low percentages of UK electricity production" ... well try 1% and half of that at night when it is neither needed or wanted.
Apparently we have also been energetic in building LNG import facilities but was silent on the ownership , source and cost of such wonderful stuff and any related political problems.
As we only take 2% of our gas from Russia Ukraine development won't affect us ! Oh yes it will Mr O'Brien when Germany asks the Norwegians with their capped production to up deliveries.
He was also remarkably optimistic about the ability to design, plan, build nuclear plants - overlooking the much reduced output experienced over the last 2 years - which will gracefully decline on best guess but dramatically if we have more plant breakdowns... hwen we meet what Chris Vernon calls the , chillingly , but correctlt calls the "nuclear cliff."