| DrumBeat: November 24, 2008 | The Oil Drum | A Resilient Suburbia? 3: Weighing the Potential for Self-Sufficiency |
| The 2008 IEA WEO - Production Decline Rates | The Oil Drum: Europe | The IEA WEO 2008: Will coal usage be phased out? |
Oilwatch Monthly - November 2008
Posted by Rembrandt on November 24, 2008 - 9:40am in The Oil Drum: Europe
The November 2008 edition of Oilwatch Monthly can be downloaded at this weblink (PDF, 1.55 MB, 24 pp).
The Oilwatch Monthly is a newsletter that is available free of charge with the latest data on oil supply, demand, oil stocks, spare capacity and exports. Readers who want to receive the Oilwatch Monthly in their e-mail box each month can subscribe at this weblink, by filling in their first name, last name, email adress and selecting the oilwatch monthly in the mailing list box. To finalize your subscription push the 'inschrijven' button below the form.
A summary and latest graphics below the fold.
Latest Developments:
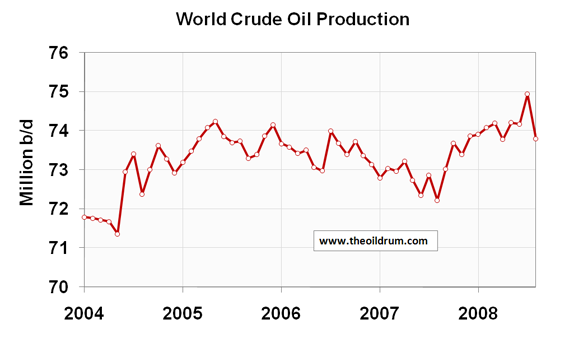
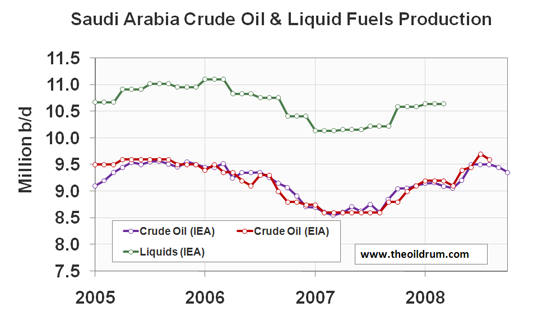
1) Conventional crude production - Latest available figures from the Energy Information Administration (EIA) show that crude oil production including lease condensates decreased by 1.14 million b/d from July to August, resulting in a total production of crude oil including lease condensates of 73.80 million barrels per day. The all time high production record of crude oil now stands at 74.94 million b/d reached in July 2008.
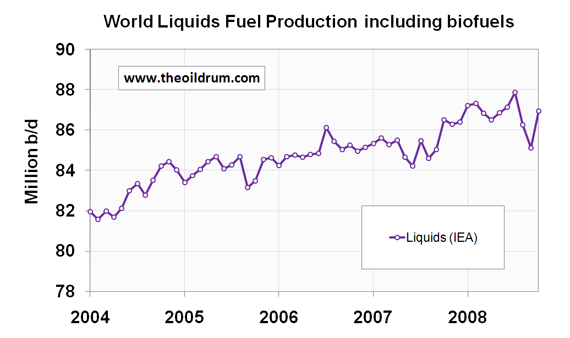
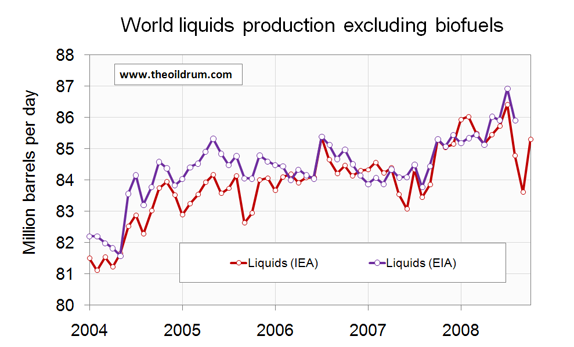
2) Total liquids production - In October world production of total liquids increased by 1.81 million barrels per day from September according to the latest figures of the International Energy Agency (IEA), resulting in total world liquids production of 86.94 million b/d. Average global production in 2007 was 85.41 million b/d according to the IEA. In 2008 an average of 86.82 million b/d has been produced from January to October. The US Energy Information Administration (EIA) in their International Petroleum Monthly puts average global 2007 production at 84.40 million b/d and average liquids production from January to August 2008 at 85.73 million b/d.
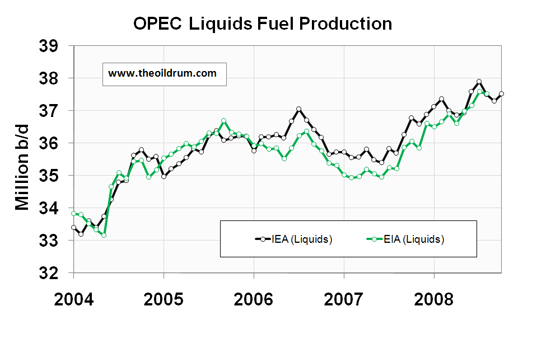
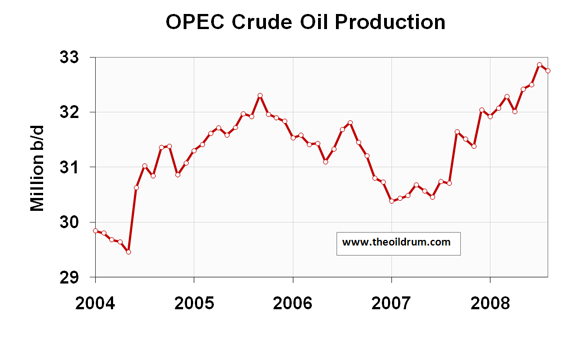
3) OPEC Production - Total crude oil production including lease condensates of the OPEC cartel decreased by 10,000 b/d to a level of 32.15 million b/d, from September to October, according to the latest available estimate of the IEA. Natural Gas Liquids production increased by 240,000 b/d to a level of 5.37 million b/d from September to October. Average total liquids production in OPEC countries in 2008 from January to October was 37.33 million b/d, versus 35.96 million b/d in 2007 and 35.71 million b/d in 2006.
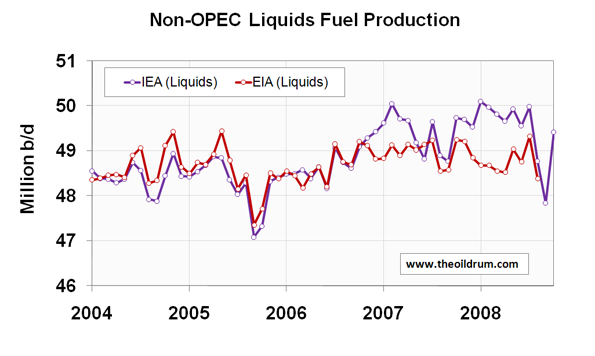
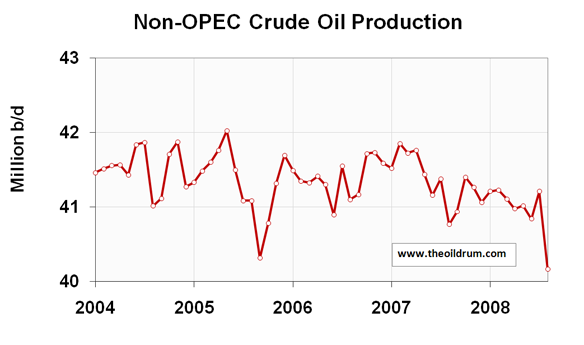
4) Non-OPEC Production - Total crude oil production including lease condensates of non-OPEC decreased by 1,0 million b/d from July to August to a level of 40.16 million b/d, according to the latest available estimate of the EIA. Average crude oil production of Non-OPEC from January to August 2008 was 40.97 million b/d, versus 41.35 million b/d in 2007 and 41.41 million b/d in 2006. Total non-OPEC liquids production increased by 1.58 million b/d to a level of 49.42 million b/d from September to October, according to the latest figures of the IEA. Average total liquids production of non-OPEC in 2008 from January to October was 49.50 million b/d, versus 49.45 million b/d in 2007 and 48.75 million b/d in 2006.
5) OECD liquids demand - OECD liquids consumption in September 2008 was 45.46 million b/d, a decline of 1.85 million b/d year on year. Average consumption from January to September 2008 was 46.34 million b/d, which is 1.11 million b/d lower than consumption in the same period in 2007. The decline is mainly a result of a decrease in oil consumption in the United States. Consumption is 951,000 b/d lower on average in the US from January to September 2008 then in the same period last year. In comparison, Mexican and Canadian consumption are almost flat relative to 2007 consumption.
6) Chinese & Indian liquids demand - Chinese liquids consumption averaged 7.28 million b/d from January to September 2008 according to the JODI database, an increase of only 50,000 b/d versus average 2007 January to September consumption of 7.23 million b/d. In 2005 China consumed on average 6.27 million b/d, growing to 6.78 million b/d in 2006 and 7.29 million b/d in 2007. But growth has also been impacted here since July. Liquids consumption in September was 1.04 million b/d lower than in July. Consumption in India was 2.62 million b/d from January to September 2008, versus an average of 2.43 million b/d in 2007 and 2.29 million b/d in 2006.
7) World Liquids exports - The exports database, which uses the methodology outlined in the oilwatch monthly, shows that annual worldwide exports are roughly in the order of 46.3 million b/d, 47.5 million b/d, 47.4 and 47.3 million b/d in 2004, 2005, 2006 and 2007 respectively. From January to September 2008 the estimate suggests average world exports amounted to 47.56 million b/d. From January to September 2008 average non-OPEC exports were estimated to be 17.15 million b/d. A decline of 0.74 million b/d from the 2007 proxy estimate of 17.89 million b/d. A proxy estimate of exports for OPEC 13 (including Iraq and Indonesia) for 2004 gives a figure of 28.37 million b/d, increasing to 29.60 million b/d in 2005, 29.76 million b/d in 2006 and declining to 29.46 million b/d in 2007. From January to September 2008 OPEC exports amounted to an average level of 30.41 million b/d.
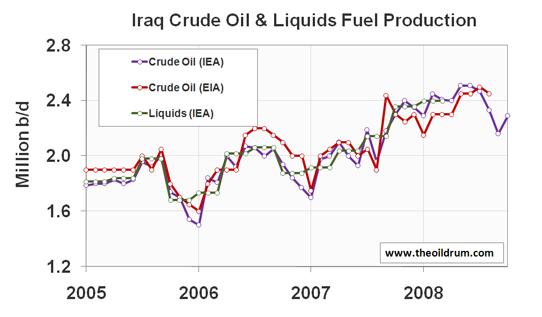
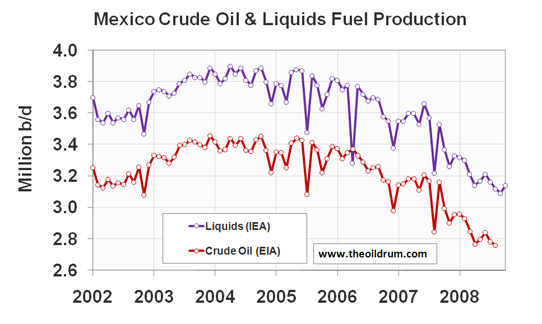
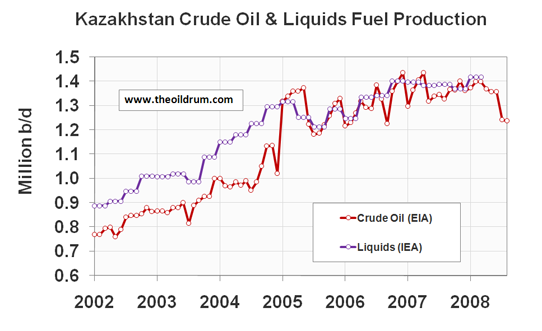
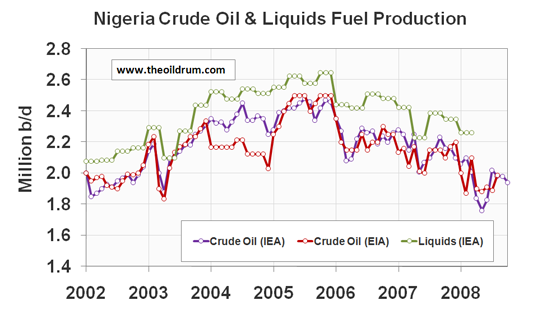
A selection of charts from this edition:
Personnel
Editors
Contributors
Peak Oil Primers
Archives
- November 2010 (3)
- October 2010 (6)
- September 2010 (4)
- August 2010 (7)
- July 2010 (6)
- June 2010 (7)
- May 2010 (2)
- April 2010 (8)
- March 2010 (4)
- February 2010 (6)
- January 2010 (3)
- December 2009 (5)
- November 2009 (8)
- October 2009 (12)
- September 2009 (6)
- August 2009 (5)
- July 2009 (11)
- June 2009 (8)
- May 2009 (16)
- April 2009 (10)
- March 2009 (7)
- February 2009 (10)
- January 2009 (15)
- December 2008 (9)
- November 2008 (9)
- October 2008 (9)
- September 2008 (13)
- August 2008 (10)
- July 2008 (14)
- June 2008 (23)
- May 2008 (16)
- April 2008 (12)
- March 2008 (16)
- February 2008 (9)
- January 2008 (13)
- December 2007 (13)
- November 2007 (16)
- October 2007 (22)
- September 2007 (8)
- August 2007 (9)
- July 2007 (16)
- June 2007 (8)
- May 2007 (7)
- April 2007 (7)
- March 2007 (10)
- February 2007 (10)
- January 2007 (12)
- December 2006 (9)
- November 2006 (15)
- October 2006 (4)
- September 2006 (5)
- August 2006 (5)
- July 2006 (9)
- June 2006 (5)
- May 2006 (10)
- April 2006 (9)
- March 2006 (13)
Vital Trivia
License

This work is licensed under a Creative Commons Attribution-Share Alike 3.0 United States License.
Fig. 1 says high demand to me. Low price must stimulate demand beyond the production curve, and with OPEC cuts - there must be a whipsaw in price some time soon - mustn't there?
Or maybe we are working our way back down the demand destruction price curve - demand creation among the less wealthy leading to lower prices. In essence, high paying Americans now being frozen out of the market?
To determine that you would need data on oil imports into the major consuming nations. It's likely that oil imports to the US have dropped off significantly since the financial crisis, as well as Europe and China.
That means that imports would have increased in poorer nations, whose consumers can now afford more gasoline etc.
Also, I think Somalia's crude imports recently increased by a significant amount. ;)
Euan
Demand is dropping, but at a decreasing rate (in US).
Here are last 4 weeks of Mastercard data for YoY gasoline demand:
10/24/2008 -8.0%
10/31/2008 -6.6%
11/7/2008 -5.3%
11/14/2008 -4.3%
If shippers start to ship again, we will get boost in demand even in recession/depression. At least here, gasoline is probably the MOST affordable item there is. (well, SPAM is pretty cheap too but gasoline has more joules and uses)
RE: SPAM
Yes and gasoline is probably more nutritional.
RE: SPAM
As a musubi afficianado I resent that remark. Nothing like processed meat. Burger King sells two different specials with spam in Hawaii.
True, but it it still less affordable than a year ago and that is the point - in order to continue world economic growth the oil has to become ever more affordable so we use more of it, and for the last 9 years or so it has mostly got ever less affordable.
Even at $50 the oil has risen ~400% in those 9 years, way above wage inflation, the only reason US gasoline demand holds up is because your day to day lifestyles depend on its use and it takes a long time to change. First you will give up discretionary things that use oil, like air flights to go on vacation.
Næt - can you explain please.
And do yo have data on the energy density of Spam? Or is this an unsubstantiated claim? And beyond powering vehicles and other motorised tools what else is gasoline used for;-?
spam has 176 Calories per 2-ounce serving, so 5891000 Joules per pound. So it takes ~22 pounds of spam to get the same amount of energy as in a gallon of gasoline.
This is kind of silly though.
I agree, the benchmark energy content foodstuff in the peak oil community is Cap'n Crunch.
Hi Folks,
More importantly, what is the EROEI of this 'fuel'? The real context is that 'spam' and all similar processed foods have huge hidden energy inputs - it might be useful to do an analysis on the energy input into producing these 'foods' - a life-cycle analysis - from farm to sewage plant - so to speak...
L,
Sid.
My impression from around NYC area is that auto demand has gone back close to pre-ramp levels. I am expecting very heavy holiday traffic heading to new England Wed.
It is also really cold! Oil trucks are all over the place.
Matt
the price may not jump back so readily due to deflationary effects.
The drop in world crude production looks like the biggest single month drop on the chart. Is it the biggest single month drop ever? Does anyone else find that ominous? Non-OPEC seems to be heading into a particularly sharp decline rate.
With prices this low, how likely is it that any of the mega projects we've been hearing so much about will come on line?
Is this a good thing--less production now means more available later?
Or is is a bad thing--fast crash will prohibit any substantial investments toward a viable transition?
@dohboi
Most of the megaprojects generate sufficient returns at oil prices below 40 dollars per barrel. So most of them will come on-stream.
Do you have a source for that? Others (I think rockdoc was one) have claimed that some megaprojects are not economic below $50.
A bigger question is where all the new liquids are coming from. World crude is down by over a million, yet total liquids are up by nearly 2. That means there are some three million in some kind of liquids that make up the gap. According to figure 2, it's not from biofuels. So is it all LNG?
@Dohboi
My claim and that of others are aligned. I didn't say all, only that most projects will be economic below 40 dollars per barrel. Some megrapojects are indeed not economic below 50 dollars, for example new deep-sea developments in Brazil and Angola. My information comes from various proprietary sources.
- Most of additional liquids in EIA data is LNG (0.5 million b/d since beginning 2005) and unconventional oil (tar sands/extra heavy).
Thanks, Rembrandt. Yes, I believe rockdoc was specifically talking about the deep sea projects. So current low prices should put a bit of a damper on recent projections of production coming from those sources.
The megaprojects struck me as the last reasonable prospect for a bump up or at least an extension of the plateau for a few more years. If prices stay near or below $50, and if that price cuts into even some of the megaprojects, it seems to me even more likely that we are about to start the slide down the other side of the curve. And of course as the recession worsens, we could yet slip below $40.
Thanks for the confirmation of my suspicion about LNG. Won't tar sands become uneconomical to produce at these prices too?
@dohboi
Yep, new tar sand projects are also uneconomical at these prices.
shouldn't all these discussions about X is only viably at $Y oil take into account that the $US hasn't exactly been steady over the last few months, with a large-ish increae in value as "a few" american $ return home?
Also, with less than 1/4 of world oil being sold to america i would think that the weight of the other 75% of the oil use would have a significant effect.
Is that rockdoc123 from the peakoil.com site? Does he ever make it to TOD to post?
Sorry. I meant rockman who posts regularly here. I haven't heard much from rockdoc of late.
A sharp OPEC production drop during this winter can be attributed to the financial crisis. There is a shortage of paying customers and it takes time for the world to rethink and retool for what will be in demand during the next round of growth.
Big problem is most people think financial crisis is the beginning and the end of it all. When the money panic is over and confidence restored, happy days will be here again!
If you go over to economics forums (forae? fori?) such as economics alltop and read comments:
http://economics.alltop.com/
... you almost never see resource or peak oil mentioned.
I guess it's gonna kinda sneak up them, eh?
High prices encourage alternatives, too. While that is true, we shouldn't wait for high prices again to pursue alternatives. But that will happen if we simply rely on the market. Given the volatility of this market, that is just insane. Everything is cheaper at the bottom, so now is the time to invest, not when a subtantial amount of capital is devoted to taking care of prices for oil. Sure, we are in a recession, but we are also spending billions less now on oil and gas than we were just a few months ago.
We should be doing everything we can to get off oil, anyway, so why all the concern that the oil industry and the oil countries will cut back on investment. If we use this opportunity to invest in alternatives, including transportation alternatives, we will not have to be concerned with shortages of oil in the future. For years now, the meme on this site is that we are at or near peak oil and virtually no amount of investment will change that. The prescription for that problem is the same, regardless of any short term changes in oil prices.
If the oil industry is foregoing megaprojects because of lower prices, that is being very short sighted. Let that be their problem, not ours.
It sounds like Obama gets it that now is the time to invest billions in alternatives, especially because of, not regardless of the recession. With the current deflation,we should be able to get more btus for the buck.
Er, remind me again: what are the alternatives to oil and the other hydrocarbons -- the ones that scale up to the amounts needed to continue consumption on anything like the present scale? (By alternatives, do you mean alternative sources of energy, or do you mean alternatives to its consumption -- like transporation as you say?)
I can't say about Europe and Japan, but here in the US, there is absolutely no alternative that can give you the bang for the buck that conservation and restructuring can give, at least until a lot of that waste is squeezed out.
In any case, I don't think it's just oil we have to get off of, it's energy in the amounts we use -- no renewable source can supply that amount.
Either solar or wind can provide far more energy than the world currently uses, so raw amounts of energy aren't a problem.
The actual problem, at least as I understand it, is two-fold:
There's really no question that these changes are theoretically possible - the wind power capacity needed to power 800M EVs amounts to literally a few months of world manufacturing capacity. That capacity won't (and can't) be 100% devoted to wind turbines, however, which makes the question of "how much, how quickly" very complex.
Dave, you said, "Er, remind me again: what are the alternatives to oil and the other hydrocarbons -- the ones that scale up to the amounts needed to continue consumption on anything like the present scale?...(By alternatives, do you mean alternative sources of energy, or do you mean alternatives to its consumption -- like transporation as you say?)" The implication being that we were stuck for transportation fuels.
There have been any number of threads on TOD over the past 2-3 years about using wood gas/charcoal/home generated methane as transportation fuels. Do a search. Many even include pictures.
Does this allow the continuance of BAU? No. But at the same time it won't be the end of the world for some people.
Todd
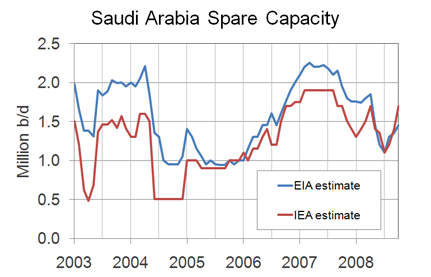
@dohboi - It is also interesting to see that the spare capacity has gone down significantly. When 'spares' are used up, is it accounted as production?
Check out Figure 7 in the story (chart 12 in the .pdf report).
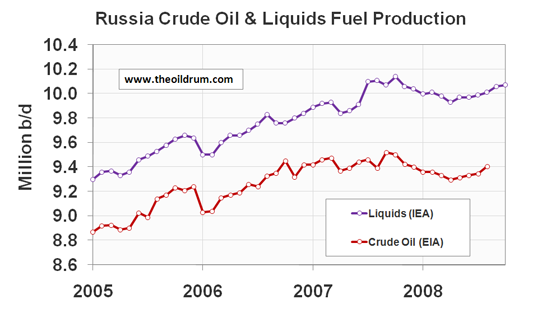
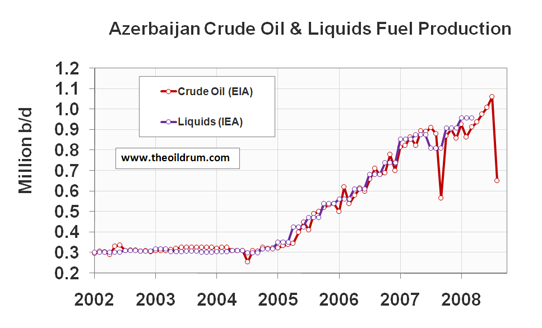
Non-opec crude oil production doesn't look too good. That steep decline is likely related to the drop in crude prices, as expensive sources of oil are having the plug pulled on them. Could the current low oil price mark that beginning of the slide for non-opec production? Will a sharp rebound in oil prices allow non-opec producers to pare those declines?
Is it significant that the number is now below the low in 2005?
@freeyourmind
The drop of crude oil in figure 7 is mainly a result of an Azerbaijan crude oil production drop of approximately 400,000 b/d in one month, according to EIA figures (see chart 75 of the report). Probably either a statistical issue, or a 'political' type of even that will only last for a month.
This doesn't change the trend that is becoming apparent in Non-OPEC crude oil production though. A trend of declining production in conventional Non-OPEC crude that will continue in the future. In the best case scenario overall Non-OPEC production can remain flat (as the IEA suggests). But I consider that best case.
Thanks for pointing me in the right direction. A quick search on google news suggests there may be pipeline disruptions, and pleasantly surprised me by having the Oilwatch come up as the 5th result (though it was a pretty specific search).
Wonder what the charts will look like post-Gustav. Production shut-in only began Aug 27th. Latest STEO though is forecasting a slight increase for the Lower 48 next year, courtesy Thunder Horse and Tahiti. The hurricanes barely register:
It is likely the steep drop in crude oil production in non-OPEC countries in August 2008 was caused by the fire in BTC pipeline in Turkey and the Russian invasion of Georgia.
Peak Oil is now.
Until late 2004, crude oil production was increasing steadily. Since then, crude oil production has been on a plateau.
Given the very high oil prices during this time, all producers were producing at their maximum possible output. Much the same can be said for world liquid fuels production.
While there was some economic slow down in the US and Europe over last summer, there was increased global demand for oil during this time.
The world can no longer increased oil production.
We are in a new era. Peak Oil is here now.
Terminal oil production decline is beginning now, or within in the next two a most, according to most independent studies.
The Energy Watch Group (funded by the German Parliament) concludes in a current report titled: “Peak Oil Could Trigger Meltdown of Society:”
"By 2020, and even more by 2030, global oil supply will be dramatically lower. This will create a supply gap which can hardly be closed by growing contributions from other fossil, nuclear or alternative energy sources in this time frame."
http://www.globaliamagazine.com/?id=482
It is time to prepare for Peak Oil impacts.
Actually the Energy Watch Group is a network of independent scientists and was founded by a parliamentarian of the green party.
But I got a better one:
The BGR (Bundesanstalt für Geowissenschaften und Rohstoffe) a agency of the ministry of economics and technology just published a press release about Energy commodities and they see Peak oil in the very near future. It’s available in German only:
http://www.bgr.bund.de/cln_092/nn_323902/DE/Gemeinsames/Oeffentlichkeits...
Headline: Amber light for crude oil …
Found the English one as well... :-)
http://www.bgr.bund.de/cln_092/nn_335074/EN/Themen/Energie/Produkte/ener...
Your English version is from '06.
From a brief perusal of the German article (with my very rusty and never fluent German), I gleened that they think peak has arrived for light, sweet crude, but not necessarily for all oil. Am I close?
Sorry for the old English version, I hope the 2007 version will come soon.
From the summary (P. 21)
-For conventional oil there’s a potential for a moderate rise in production for a few years. Afterwards there will be a gap as peak oil is reached and production will decline. This gap has to be filled with unconventional oil and other energy sources (gas, CTL, biomass...)
-Market share for unconventional oil will rise, but make only 5%-10% of total volume by 2020
-Uncertainties about the projections are: possible downward revision of OPEC reserves, unknown potential for reserve growth
-It can be expected that in the near future crude oil will not be available in enough quantities to meet demand. Therefore it is essential to search for alternatives as migrations in the energy sector are long-dated
The news is that the BGR now sees a peak within the next years. In the 2006 report the stated that peak oil will be reached in about 10-15 years.
Flip wrote: "Sorry for the old English version"
My Old English is actually a bit better than my German, so that would have been ok ;-)
Thanks for the summary. Do their estimates of production increase in the next few years depend on deep sea megaprojects and tar sands? If so, they may need to revise those estimates with oil below $50.
I only found some older paper about the oil classification of the BGR: everything below 20 API is non-conventional. So AFAIK deep-sea will contribute to the expected moderate rise, but not any tar sands or Venezuelan heavy oil.
Here is the link to the babelfish translation of the press release. Not easy to read but serviceable.
I think Mr Hirsch's argument is pretty sound that 'we now need to prepare' starting in 1984.
This would fit in well with the recommendations of "Limits to Growth,"
So we're almost on schedule, right?
I had figured that worldwide if there is actual spare capacity beyond what KSA can surge its on the order of 500 kbd to at most 1mbd. Tending towards 500kbd. If you look at oil production out of KSA this year we had two large surges which fit in their definition of spare capacity.
As usual with KSA they ended to soon to detect if this was sustainable production levels. Given everything we know about KSA its fair to assume that they can readily surge production for 30-60 days on the order of 1-2 mbd. They have always claimed that they produced their fields conservatively and well rotation is fairly well documented and also its documented that you can get some very nice short term increases in production from "rested" water driven wells.
Given the data here I think I'm fairly close. Whats interesting is if OPEC actually cuts we are probably in a tight supply situation. I mentioned KSA's surge capacity since its short term and would mean that they are certain to institute the initial round of cuts because they have to not because the y want to. Thus of OPEC and esp KSA it would be cuts beyond 1.5 mbd that would be instructive. One would also think that the rest of the OPEC countries where also pushing their fields and would welcome a slight slowdown.
And last but not least I have claimed that most of this demand destruction is from the death of the housing industry so we should see US demand begin to level off over the coming months. My best guess is we end up 2% lower in terms of VMT vs 2007 and flatline there on the demand side.
I don't like the credit card data because CC defaults have soared and you don't buy gasoline on maxed out credit cards.
Some thoughts on Nates Post.
The latest MasterCard report had demand down 2.8% from last year.
http://www.reuters.com/article/rbssFinancialServicesAndRealEstateNews/id...
Its hard to get information on cash transactions however.
http://www.cuna.org/newsnow/08/system111308-5.html
The strong increase in the use of debit cards vs credit cards hints strongly that cash transactions are up vs credit card transactions. Its not clear if the MasterCard data is combined credit and debit transactions if so it should be less distorted. However we probably still have a significant amount of gasoline transactions moving back to cash.
In fact.
http://www.timesargus.com/article/20081116/NEWS01/811160369/1002/NEWS01
This says bankruptcies have increased by 8% thus we can conclude that this precentage increase is fairly representative of the increase in the number of Americans who have no or little revolving credit. Thus assuming that say 1-2% of the decline in purchases for gasoline is credit/cash related even if the master card data includes debit transactions.
Bottom line is real oversupply of oil on the market vs demand is well within the error ranges of the number although almost certainly real. If the current oversupply is real and also from unsustainable Saudi surges we can expect that the supply and demand equation will return to one of supply unable to meet demand in a matter of weeks or months at most.
As expectations of the next Armageddon begin to leave the markets in general we should see the markets begin to look at current conditions and not a potentially dire future. In general overall I see flat demand and falling production and the price will be determined primarily if supply is low enough to force the wealthy nations into competition for oil despite the slowing economies.
memmel - good points re Mastercard - but my analyst friends still tell me it is more reliable than DOE/EIA numbers...
I don't disagree its reliable just that most economic indicators have problems when the economic climate changes Credit Card transaction data would tend to inflate the decline rate during a recession. It would also tend to underestimate the recovery when you pull out of a recession as people are still prudent with credit card use and it takes time for them to reestablish credit.
This is true for a wide range of economic data actually a lot of the problems that are supposedly happening right now actually happened back this summer.
And last but not least you have to correct for the hurricanes temporary economic effect.
http://www.latimes.com/news/nationworld/nation/la-na-ikecon16-2008sep16,...
They certainly had and effect and for some reason they don't get explicitly factored in.
Put it this way there is a very good reason why the Saudi's are not cutting more than 1.5 mbd regardless of its just a pullback from surges. They don't want to send the world into a major shortage condition and if you look at all the data it becomes fairly clear at least to me that any deeper cuts could force a serious spike.
They want prices back up of course but they don't want to spike them via unintentional shortages.
I think they also realize that the supply demand imbalance is not all that out of wack and they wish to see if they can tune it if needed.
This may sound crazy but I think me and the Suadi's are in very good agreement on the nature of the current supply and demand equation :)
They rejected additional cuts on Nov 29 not because they are happy with 50 dollar oil but because they don't want to see prices spike back over 100 literally overnight.
One more thing on the price of gasoline vs demand regardless of the actual precentages what we have seen once the hurricanes are factored in is that demand for the most part remained down vs 2007 despite the changes in price for gasoline. This fits very well with my assertion that the primary drive was and has been the effective destruction of the house building industry not the price of oil directly. Now you can claim if you wish that at first it was high prices then economic decline but if you look the economy has been in steep decline for most of the year.
And last but not least if it was housing and not price then its a one shot decline other industries don't offer near the opportunity for a sharp contraction in demand. This means of course that any future demand destruction will probably happen in and environment where prices are high enough to influence demand. One of the big reasons that Housing is special is its responsible for a lot of demand growth and usage and housing construction is financed with short term loans. Its one of the few large industries that can wind down rapidly over a few years as new loans are not made to finance new construction. And of course with the housing oversupply you simply don't need the houses. I've not yet found another large industry capable of declining like the housing industry its stand unique. Even commercial real estate works on much longer funding cycles and has less of a overall effect on gasoline usage.
I propose that this high priced demand destruction scenario has not happened yet and that we will only discover what the price points are when it does happen. Next given the above its fairly safe to assume that its somewhere over 150 a barrel that leads to a real high price/demand destruction scenario in the US.
When do you think we will see $150/barrel again?
You were predicting $160/barrel by the end of the year. That now looks impossible.
Improbable maybe impossible I don't think so. Thats based on and assumption that the two surges from KSA consisted of a lot of stored light sweet crude. If I'm correct then the last of this surge is arriving in the US. Next with the current prices you can be pretty sure that KSA will be reluctant to sell light sweet and furthermore they need to rebuild storage over the next six months or so.
Demand is increasing supplies are falling and the oil supply should become distinctly heavy sour.
Next on a per BTU bases the spread between oil and NG is at the lowest I have ever seen it making using extra NG to process heavy sour crudes distinctly uneconomical.
We still stand a good chance of seeing oil shoot up dramatically in price over the next few weeks.
As I said I'm in perfect agreement with OPEC on waiting for further cuts they don't plan on announcing any cuts on Nov 29. I still see 160 is being very possible by the end of the year. It all depends on the dynamics of the situation. I think they will wait till Dec to make a decision.
I do find it a bit ironic that I'm probably one of the few that feel like prices can go screaming up in this case faster then they went down. We could easily see oil add 20-30 dollars or more a week to price if what I'm suggesting results in a serious shortage of light sweet and makes heavy sour refining unprofitable.
On the demand side if I'm correct and the primary cause was the housing industry which is very seasonal then demand should also rapidly return to close to the month on month values in agreement with last winter since the contribution from housing construction is much smaller in the winter.
But in general exactly what happens really depends on if I'm right and the prices where smashed with a flood of stored light sweet crude if so once this flood ends then we should see a rapid change in prices.
Well, not all that oil is on its way here. Last I heard, 2 million barrels destined for US was spending the Fall off the Somalian Riviera.
a price jump of $110 in a month!
If you have ever been to and auction and seen a bidding war start between deep pocketed bidder then you understand the potential volatility thats in or system.
You also of course have just as much volatility on the downside if no bidders show up. Thats our current situation.
Either we have enough oil or we don't if we don't then you need to figure out how high prices would have to go to cause serious demand destruction in the wealthy countries 200 a barrel is a very reasonable assumption.
Fundamentals as far as I can tell don't have a strong signal either way at the moment we are not swimming in oil and neither are we horribly short at the moment thus they are agnostic. Until recently sentiment was the next great depression and end of the world as we know it was at the door. This tends to put a damper on future oil prices.
And last but not least oil is actually at one of its fundamental price points. Its a very stable point and as I said the next stable point is 200 there are no real stable points for oil prices between 50 and 200. 50 represents the well supplied world 200 represents a world with demand destruction amongst wealthy countries.
The big gulf between the two levels is what drives the instability in oil prices at the moment.
Given peak oil once prices rise over 200 they will begin to stabilize and go up at a steady rate.
I don't know for sure where the next stable point is but I think its at around 500 then the next at 800. At 500 oil is no longer used for stupid purposes at 800 its used where no substitutes are available. These prices are based on the fact that substitutes are both expensive and provide a much lower volume so to get substitution for oil its practically all a case of reducing the market size or demand destruction it has little to do with the substitutes themselves its simply a case that given the substitution possible for oil the entire market needs to eventually be ten times smaller.
I will add that although people mention the volatility in prices post peak generally using the whale oil example I've not seen anyone else really try to explain why they are volatile whats the mechanics. What I see is this huge gulf between the preception of a well supplied market and one thats post peak. Crossing this gulf is difficult.
I like to think of it like a multi-level laser with population inversion it needs a tremendous perception change to make the jump but on the opposite side if the change does happen it makes the jump. Right now the systems not even being driven we are in the ground state once the laser is "turned on" again then we should make the jump.
I should add that obviously the opposite argument is also viable that 50 is fine and the market is well supplied economic contraction will keep demand low and it will be several years before demand starts growing again to cause supply problems the problem still exists but its moved out almost two years or more in this scenario. The market will deal with it when it gets there since we would need to know the exact supply at that point its too far in the future. This is basically the working argument for low prices at the moment I don't believe it.
If I'm wrong then we set at 50 for the next two years. However we should know the truth in the next several weeks months at most trying to gauge when this spike should occur is really hard. It depends on how low US oil stocks go what demand is what the light sweet crude price is what the price of NG is etc etc. And last but not least when market perception changes thats not exactly easy to predict.
by wrong do you mean your view that we are witnessing stored surges of saudi light sweet pulsing into the market is incorrect?
or wrong for some economic reason concerning the nature of volatility?
ie if your wrong do you stand by your NG light sweet effect just that it hasn't occurred?
Sorry yes to be clear by wrong I mean that surges of stored Saudi light sweet crude played a critical role in collapsing prices. On that note if you look you will find that Saudi Arabia also developed significant end production storage facilities for internal use. These would also have been drained to supply the local market and free up oil for export. I post a few times that Saudi Asphalt was in short supply one reason could be declines another is that the refineries where not being run and instead stored product was drained down.
As far as economic volatility as far as I can tell you generally end up with stagnant demand unless we see some sort of massive depression. The example I like to use for this is someone making 90k a year and someone making 30k a year used about the same amount of oil. So you can see a substantial economic drop before you actually see significant declines in oil usage. This is outside of course of the collapse of a particular industry such as housing which stands as a unique case.
If I'm wrong about the reasons underlying the price collapse then we probably have plenty of oil for a stagnant economy. A lot of people attribute the price collapse to economic factors they certainly played a large role no doubt about it but oil is a consumable product and I simply can't see oil able to drop on economic games alone supply had to exist and in particular ample quantities of light sweet. Given that I've not heard of a new Nigeria then the oil had to come from somewhere else.
On the economic front the fact that gold prices are starting to move I take as a indicator of the end of unwinding by hedge funds. This dumping played a role for sure in the price movements along with oil supply so now the economic pressure seems to be ending and thus we will find out if the market is well supplied which means it was not a Saudi dump.
I think that part of what happened in 2008 was a misunderstanding by the Saudi and the Administration of the role high oil prices where playing in the world economy. I think they felt they where the cause of increasing economic problems along of course with the belief that "speculators" where to be blamed. Thus the decision by KSA to dump light sweet on the market.
This of course played a big role in blowing out the hedge funds that where long oil and short the dollar fueling the financial collapse. One part of the vicious cycle the world found itself in.
In reality as long as the Saudis where recycling their petro dollars buying treasuries it really did not matter.
However rising oil prices not high oil prices played a role in the real collapse back in 2005 since the combination of spiraling housing costs and higher living expenses via more expensive gasoline and food not the actual change in costs insured that people had less to spend on housing. If you housing costs are increasing and your disposable income is decreasing then your buyer market simply could not keep up. A change in disposable income of a few hundred dollars was all that was needed to force people to look for slightly cheaper houses as prices where way beyond sustainability. This slight increase in frugality was sufficient in my opinion to pop the bubble. But understand that all happened several years ago. By 2008 the party was over and fuel prices no longer played a role they had done there job. For that matter if I'm right about the economics I don't expect increasing fuel prices or decreasing for that matter to have a big economic impact of the short term. Only if we hit 200 dollar oil and it makes exsurbia less desirable than the cities will we see oil prices play a role.
Housing costs will simply continue to fall matching the real disposable income but other economic factors such as job loss, job security or lower wages would play a much larger role than nominal fuel costs. This high fuel costs would only serve to make geographic issues important for those that can afford housing they do nothing really to encourage people who are unstable to commit most of there salary to a long term loan.
I think that as times get harder the return of households to a effective single income as households regardless of composition deal with one member unemployed are under employed will be the issue.
This gets into longer term debt aka housing prices.
But the point is KSA messed up and I suspect by now the realize they made a mistake and I seriously doubt they will flood the markets with light sweet again this was a one shot deal.
Or as I said I'm wrong and demand really contracted and we really have plenty of oil if so then peak oil is a non-event.
cheers
Well with the exception of Mendelbrot :)
Generally everything I say you can assume he said better.
But yes your correct price elasticity declines sharply as you try to force demand destruction on the wealthier fraction of the population. Also in general they can lose 50% or more of there wealth before they reach a point that price becomes a issue.
And example is that demand is very inelastic for gasoline in the 200k-100k salary range. People that make 200k could lose 75% of their salary before gasoline prices became a issue. 50% for the 100k range. While someone making 50k that dropped to say 30k would become sensitive to gasoline prices.
http://en.wikipedia.org/wiki/Household_income_in_the_United_States
Median household income in the US is 50k a decline back to 30k is a 40% decline in income this is the level that 5 dollar a gallon gasoline would become a serious issue.
http://www.eia.doe.gov/kids/energyfacts/saving/efficiency/savingenergy.html
This give gasoline usage at 500 gallons a year lets multiply by 2 for a household so 1000 gallons or 5,000 dollars at 5 dollars a gallon which is equivalent to oil at over 200 a barrel.
I generally use 15% of income as the point at which fuel prices become a very serious issue. This works out to 17% of 30k
The bottom 20% earn about 20k and these people would be at 25% of income if they used 1000 gallons a year obviously they would have to conserve. However
even this group would need only half its oil usage easily doable although potentially disruptive. This would take it to the 12% or survivable threshold.
Thus something near 5 dollar a gallon for gasoline is needed to cause a 50% reduction to 20% of the us population or a overall 10% reduction.
Thats about 2.5 mbpd of reduced demand that could happen at 5 dollars a gallon. I suspect that this is probably and overestimate the reason being even at 3 dollars a gallon these people would be filling the pinch so I suspect the poorest people don't actually consume 500 gallons of gasoline per capita.
Even at 2 dollars a gallon your at 10% of income which is well within the pain threshold for this group.
So better to assume lets say that the lowest 20% probably use more like 500 gallons per household and that at best they can cut say 50% this is a 5% reduction at five dollars a gallon and thus about 1.25 mbpd and we have another 1.25mbpd of discretionary driving that could be trimmed.
On the high side you could even make a good argument for 15% reduction or about 3.75mbd but its not clear that you would get that steep a reduction at 5 dollar a gallon for gasoline. In general we would not have to cut that much.
In any case its fairly obvious that to get significant decreases in gasoline usage we would have to hit the 3-5 dollar range a gallon just to effect the bottom 20% of households in the US. Based on price alone.
However we have to wonder how poor a lot of these poor people are.
http://mjperry.blogspot.com/2008/11/how-poor-are-americas-poor.html
Although it fairly easy to figure that gasoline what have to hit five dollars a gallon to elicit any serious demand destruction its interesting that it become very difficult to estimate the magnitude of such destruction.
Its somewhere between 2% to 15% of our current consumption.
Demand suppression is a bit different from demand destruction and would include conservation amongst most of the income groups driving smaller cars carpooling etc. This is choosing to spend money on somethings besides gasoline not that you can't afford the gas. This would of course bounce back fast the moment gasoline prices lowered so its not a good indicator in general of overall changes. Even if you bought a fuel efficient car if gasoline prices dropped you would take longer trips for example.
The destruction of a entire industry like the loss of the housing industry is a quite different form of demand destruction and does result in a fairly permanent drop however over time I assume that the people formerly working in housing will find other jobs and the demand will slowly rebound. My best longer term guess for the absolute drop in demand from the death of house construction is quit low on the order of 1%-2%. Or like 250kbd to 500kbd or so. As we head into December the seasonal housing industry is not becoming a factor and we seem to be heading towards a YoY monthly change approaching 2% right now. I think we get something like this for every 2-3% increase in general unemployment.
But again the real question is how much gasoline do the poorest segments of society use and how inelastic is the demand in this group ?
Given their actual relative wealth its hard to say. They can't quit driving to work but they can carpool or potentially buy a more fuel efficient car.
A better link to the full report on America poor.
http://www.heritage.org/research/welfare/bg2064.cfm
Just reading it suggest that if gasoline usage is primarily for work many could adjust other parts of their lives if needed to get pay for gasoline.
Like I said its really tough to figure but 5 dollar a gallon gasoline seems to be a good benchmark.
Using this although not sure its right.
http://answers.yahoo.com/question/index?qid=20080909134754AAc3D9N
5 dollars a gallon translates to about 208 a barrel.
Also it implies the potential for anywhere from 500kb to about 3mbd change in demand weighted towards the low end. But whats interesting is if demand did drop most of the change is still demand suppression like car pooling that could return quickly if the oil prices dropped. Car pools disbanded drive the car more etc.
So what really interesting is assuming that the world could produce enough oil to intially meet the demand at five dollars a gallon and this caused demand to drop by 1mpd or so and say prices to drop to 150 a barrel then demand would pick right back up. You get some interesting price bounces at this point as you cross back and forth across the pain threshold.
You could easily see price bounce between 150-250 at this point. Thats a lot of volatility still in the system. However using the above if prices rose to 8
dollars a gallon or about 330 a barrel then we would be in true demand destruction range. My 400 as the next big point pretty much comes out of this with gasoline at 10 dollars a gallon a household making 50k a year and using 1000 gallons would be paying 10,000 a year for gasoline or 20% of their income. At this point your finally seeing some serious lifestyle changes.
People would have no choice but to conserve and a real 10% drop in gasoline usage at this point is certain if not more so 2.5-5mbd drop assuming usage is now down to 20mbd or so.
Now it can and will go higher but the remaining households that can afford more expensive gas is also matched with real conservation this is why I put a high point of about 15 a gallon at this point daily gasoline usage would probably drop to 5-10mbpd and substitution becomes very viable.
Needless to say as you cross over 8 dollars a gallon and into this range Americans can and will seek other means of transport. But note the 100k a year crowd is just getting into the 15% danger zone at 15 dollars a gallon.
http://en.wikipedia.org/wiki/Personal_income_in_the_United_States#Income...
You can play around with it but its pretty clear that remaining demand and viable substitution works at about 15 dollars a gallon. You can even double the efficiency of use and support more people on less oil etc.
Whats even more interesting is this gets per capita oil usage down near that of other wealthy countries. Not surprising since the 8-15 dollar range matches well with fuel costs in Europe. They also imply a real sustained reduction in oil production of at least 2-3mbd globally probably a bit higher say 5-10mbd drop from our present production levels. Sorry for the long ranges but its hard to gauge how inelastic demand will be in other countries. Europe for example probably will roll back its fuel taxes as oil prices increase eventually having no taxes. Extensive subsidies are also highly probable
in many areas keeping demand robust in the face of rising prices. Its not
clear at what price points these moves will break down. The US probably would
for example would probably increase the minimum wage to 10 dollars and hour or
more under these conditions.
I could easily see a lot of scheme to effectively subsidize oil usage for the poor that simply make matters worse and spike the price higher by delaying demand destruction.
Back to the economic side you will probably see a lot more people in the higher income brackets move to the lower as the economy declines so this would
also help decrease demand.
In any case as we cross 300 a barrel we finally start seeing the point that supply and demand begin to become fairly balanced exactly how this plays out is tough to figure but 800 a barrel is 20 dollars a gallon and you can bet at that point demand for oil will be very low and just about any conceivable alternative is viable. The key point is not really price but the price point at which usage drops to a level that viable substitutes are possible.
And last but not least this is using today dollars its becoming pretty obvious that we will see our governments inflate the fiat currencies a lot in and attempt to keep deflation at bay. This probably won't translate into salaries rising anywhere close to whats needed to stay level with inflation but oil prices will be very sensitive to monetary printing. This could easily lead to a sort of price shock as the inflation attempts simply drive up the price of oil. So we could see prices rise in this range well before underlying supply was inadequate. This of course makes life even more interesting since it would then act to cause oil prices to decline as demand declined from the artificial
increase in prices even though supply was adequate forcing down the price of oil and causing a real loss to oil producers as they fail to keep up with inflation.
I suspect that simply leads to them curtailing production but in any case regardless the real post peak fireworks start as we pass 200 dollars a barrel
thats when thing get serious.
Maybe this is a bit OT, but as KSA and OPEC was mentioned perhaps someone can tell me something about this graph of the WEO (page 227):
This is the text referring to the graph:
To me this looks as if these fields had N0 decline at all, although the chapter summary says " Decline rates... average 3.4% for super-giant fields, 6.5% for giant fields ..."
And then there is this graph:
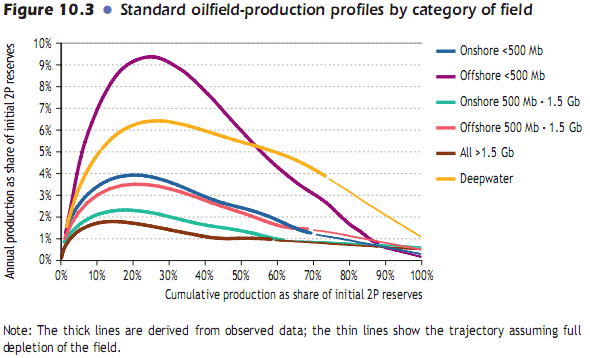
Any explanation???
I think the explanation on the long plateaus is partly infill drilling, to keep them going. If there were no infill drilling, they would perhaps decline at the rates shown.
I think another issue is the use of horizontal wells. If vertical wells were used, you would see the drop in production of, say 4% a year, as the thickness of the oil layer decreased year after year with extrction. With horizontal wells, the pipe lies in a layer that is hopefully still full of oil. Once the water level rises to the level of the horizontal well, it is all over for the well. The use of horizontal wells is one reason that decline rates may suddenly accelerate very rapidly. Pumping only the top of the layer of oil gives the illusion that there is no decline. Once the water rises to that level, it is suddenly close to all over. Deep sea wells use a lot of horizontal wells, and look at their decline rates.
In Figure 10.3, I suspect part of the difference is that the wells with high annual percentage depletions use more horizontal drilling. These would be especially recently drilled offshore wells. Vertical wells allow for low depletion over a long period. When wells are drilled offshore, the cost of maintaining the platform is expensive, so production occurs is done as quickly as possible (with horizontal wells). Most of the onshore well were drilled years ago, before horizontals were in widespread use.
Question on Mexican oil production.
PEMEX claims that it can restore production back to more than 3 million barrels per day, "Oil and Gas Journal" reported recently.
http://www.ogj.com/display_article/344636/7/ONART/none/DriPr/1/Pemex-can...
What do you all think about this?
PEMEX is underestimating the difficulty and expense of developing harder to get oil. The article reads like an optimistic story meant to reassure a worried public.
Blue's right about the time line. But most operators underestimate trouble time. But PEMEX has even bigger hurdles. The ability to better manage contracts just refers to service providers and not joint ventures. The president tried to pass amendments which would allow foreign capital to invest and earn in Mexico but it failed. There is certainly potential in their Deep Water side of the Gulf. Shell et al have leased and are developing fields right along the Mexican line. But it takes a great deal of time and capital. Perhaps the most significant part of the statement probably went unnoticed by many: PEMEX would have more control over their budget. For decades PEMEX has begged the gov’t to let it retain more of its revenue and reinvest it in new projects. With the rejection of outside capital sources PEMEX has to come up with the budget themselves.
As far as their 3 mm bopd target that’s more then a little bold. They do have 2 or 3 drill ships under construction but I think the earliest won’t arrive until late ’09 or ‘10. A good Deep Water Field can come on at 300,000 bopd. So they’re talking about the equivalent of 10 new Deep Water fields developed in a very short time at a WAG of $5 or $6 BIILLION total. So at a time when 40% of the gov’t revenue is rapidly declining they’ll have to take more money out of the system? That’s going to be a tough budget to pass. The Left just barely lost the last presidential election. The upcoming problems would definitely be a boost for their next effort. I suspect that when the SHTF big time they might let outside operators in but that process would take at least 10 years to bring any significant production on. All in all I think Mexico has run out of time. If they had started 10 years ago with this plan they might have been able to get it together.
A bit offtopic but...
Interesting article about the between war and resource depletion and population growth. A bit long but a very interesting read.
http://blog.wired.com/wiredscience/2008/11/sex-and-war-exc.html
I am very skeptical about the kick up in the world liquids production graph. Its not being reflected in world tanker rates. As with all data if you cannot cross reference it then there is doubt. Downward revision very likely IMHO.