| Electrical Supply: Time, Scale, and the Need for Decision in Planning Future Power Plants | The Oil Drum | DrumBeat: November 18, 2008 |
| The EU Strategic Energy Review: maybe not so depressing after all | The Oil Drum: Europe | Oilwatch Monthly - November 2008 |
The 2008 IEA WEO - Production Decline Rates
Posted by Euan Mearns on November 17, 2008 - 3:06pm in The Oil Drum: Europe
Report authors: Euan Mearns, Samuel Foucher and Rembrandt Koppelaar
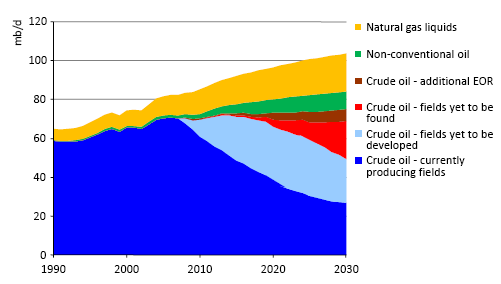
This chart is from a section of the IEA publications called key graphs and appears in Chapter 11, p250 as Figure 11.1.
Chapter 10, p 243 of IEA WEO 2008 says this:
On this basis, we estimate that the average observed decline rate worldwide is 6.7%. Were that rate applied to 2007 crude oil production the annual loss of output would be 4.7mmbpd.
So it seems reasonable to expect the decline rate on currently producing fields shown above should be 6.7%. Not so. The decline rate in the chart above seems to be much closer to 4%. So what's going on here? There's more below the fold.
Chapter 10 of IEA WEO 2008 provides a detailed overview of oil field decline rates based on 798 oil fields, but mainly based upon the IHS data base. It is written by an industry expert and provides much insight as to how decline varies between different classes of oil field. However, when you are working on forecasting global fossil fuel supplies, in the first instance you really want to know just one number. Namely, what is the decline rate that should be applied to current producing fields? Sadly, amongst all the complex detail this vital statistic seems to be missing. Worse than that, several conflicting and ambiguous statements are made. The press reported before IEA WEO 2008 was released, that global decline rates were higher than previously believed, priming readers for a sensational surprise.
The views of many on oil field decline rates are formed by the CERA private report published last year called: Finding the Critical Numbers. I had a long chat with Peter Jackson (report author) last year about this report where the key findings were related to me. In simple terms, CERA divide global production into three main components:
1. Fields in build up phase
2. Fields on production plateau
3. Fields in decline phase
What CERA found was that only 41% of production comes from fields in the decline phase, the remaining 59% from fields in build up and on plateau. A significant proportion of plateau production comes from OPEC super giants. In the decline phase, rates vary from 6% for onshore fields to 18% for deep water offshore fields. CERA concluded that the aggregate global decline rate was 4.5% - and this is the magic number we are looking for in IEA WEO 2008.
Conflicting statements
Here are some of the summary statements made in IEA WEO 2008 on decline rates:
Executive summary, page 43:
We estimate that the average production-weighted observed decline rate worldwide is currently 6.7% for fields that have passed their production peak. In our Reference Scenario, this rate increases to 8.6% in 2030.
This statement clearly applies to post-peak fields, which following the IEA terminology includes fields on plateau (like Ghawar) and those in decline. But what about fields in build up?
Chapter 10, page 243
On this basis, we estimate that the average observed decline rate worldwide is 6.7%. Were this rate to be applied to 2007 crude oil production, the annual loss of output would be 4.7 mb/d.
This statement is more ambiguous, applying 6.7% to the whole stack of current production.
And then in Chapter 11, page 255 we have this:
The overall average annual fall in output at existing fields is proportionately much smaller in OPEC countries, at 3.3%, than in non-OPEC countries, where it is 4.7%, reflecting the fact that most OPEC fields are onshore.
Surprisingly, and very frustratingly the average for OPEC and non-OPEC "average annual fall" is not given. However, weighting these figures for 2007 production (OPEC = 31.1 mmbpd and non-OPEC = 39.1 mmbpd, Table 11.1 page 251) gives an aggregate "average annual fall" = 4.08%. Is this the magic number we are looking for? If it is then it is lower and not higher than the CERA figure.
Chart analysis
Using Mac OSX Preview grab, we inserted the IEA production model into an XL chart, extracted the data by hand from which this clone is made.
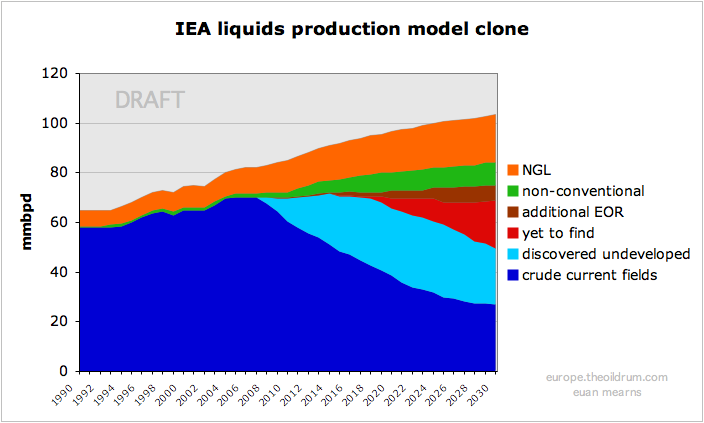
Exponential decline rates were then variably applied to the "current producing" stack to try and replicate the IEA chart. It was not possible to get a perfect fit, but the best approximation was for an exponential decline rate of 4.05%, which is essentially the same as the 4.08% figure discussed above.
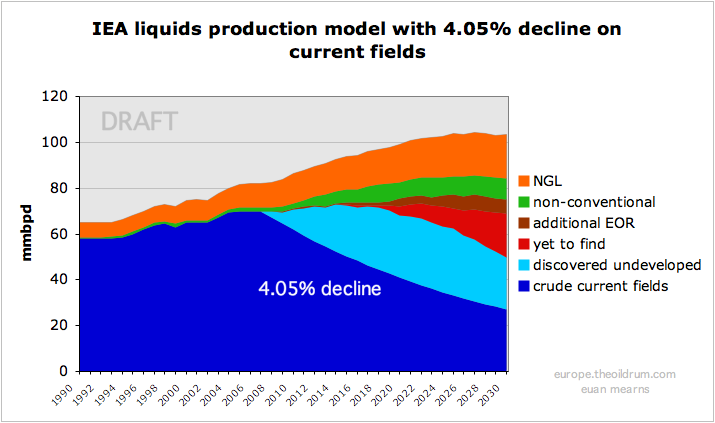
Using a decline rate of 6.7% provides a much more sobering picture of future liquid fuel supplies, especially considering that the natural gas liquid, discovered undeveloped and yet to find components all appear to be rather optimistic.

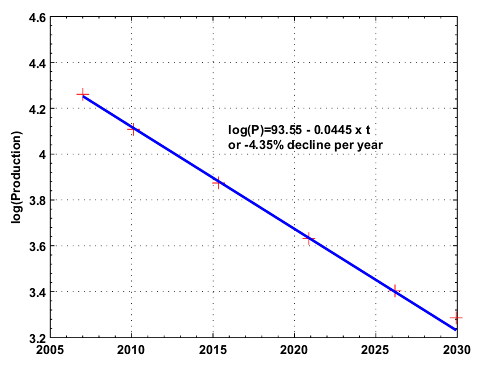
A least squares fit of the IEA decline data extracted from their chart suggests that a decline rate value of 4.35% may in fact have been used. In which case their analysis has reached the exact same conclusion as CERA.
Conclusion
The IEA are to be applauded for conducting and reporting a detailed analysis of global oil field decline rates. This is truly vital data for understanding and predicting the future course of global energy supplies upon which the future of Mankind is based. No doubt the mainstream media, international policy makers and politicians will be suitably impressed by the rigor and detail contained in this report, that they do not understand.
As far as we can establish, the IEA analysis shows that global decline rates are actually lower or the same as those reported by CERA last year. We have sent two emails to Dr Birol requesting clarification on the points raised in this report and are awaiting his reply.
The key information required is this:
What % of current production comes from fields in production build up phase and what decline rate (presumably negative decline) is applicable to that production increment?
What % of current production comes from fields in the post peak / plateau / decline phase and what is the weighted average decline rate applicable to that production increment?
How have these variables evolved in the past, and how are they set to evolve in future?
[Editor's note added around midday, Monday GMT]
Full credit to GaryP who in this comment spotted this:
On page 221, the IEA says this:
Our reference scenario projections imply a one percentage-point increase in the global avearge natural decline rate to over 10% per year by 2030 as all regions experience a drop in average fields size and most see a shift in production to offshore fields.
Note that natural decline is the decline rate without field investments and most of this discussion here has centered upon observed decline rates which include field investments and are therefore lower than the natural decline figure. But the point is the IEA are forecasting decline to increase by 1% point forward to 2030, whilst their chart has a very substantial drop in decline rate, within currently producing oil fields, embedded in it. This is why it was not possible to replicate their chart using a single decline figure.
Personnel
Editors
Contributors
Peak Oil Primers
Archives
- November 2010 (3)
- October 2010 (6)
- September 2010 (4)
- August 2010 (7)
- July 2010 (6)
- June 2010 (7)
- May 2010 (2)
- April 2010 (8)
- March 2010 (4)
- February 2010 (6)
- January 2010 (3)
- December 2009 (5)
- November 2009 (8)
- October 2009 (12)
- September 2009 (6)
- August 2009 (5)
- July 2009 (11)
- June 2009 (8)
- May 2009 (16)
- April 2009 (10)
- March 2009 (7)
- February 2009 (10)
- January 2009 (15)
- December 2008 (9)
- November 2008 (9)
- October 2008 (9)
- September 2008 (13)
- August 2008 (10)
- July 2008 (14)
- June 2008 (23)
- May 2008 (16)
- April 2008 (12)
- March 2008 (16)
- February 2008 (9)
- January 2008 (13)
- December 2007 (13)
- November 2007 (16)
- October 2007 (22)
- September 2007 (8)
- August 2007 (9)
- July 2007 (16)
- June 2007 (8)
- May 2007 (7)
- April 2007 (7)
- March 2007 (10)
- February 2007 (10)
- January 2007 (12)
- December 2006 (9)
- November 2006 (15)
- October 2006 (4)
- September 2006 (5)
- August 2006 (5)
- July 2006 (9)
- June 2006 (5)
- May 2006 (10)
- April 2006 (9)
- March 2006 (13)
Vital Trivia
License

This work is licensed under a Creative Commons Attribution-Share Alike 3.0 United States License.
Good analysis, however, one more piece of data is needed. Does the 4.5% decline rate apply to TOTAL liquids production or to just the crude oil, excluding NGLs?
Since NGLs are increasing this could make a difference to the aggregate decline rate.
This analysis applies only to the crude oil + condensate (C+C) from fields already on production in 2007 (the dark blue field).
The evolution of NGLs will be the subject of separate report later this week by Rune Likvern that will amongst other things examine liquid : gas ratio evolution as well as gas production forecasts.
Euan,
Very good points and related questions!
As I understand, the IEA decline rates apply to conventional crude and condensate (C&C), for which 2007 production was about 70 mbd. Unconventional crude production from oil sands would be excluded, as the IEA would probably assume oil sands production rates would not decline.
The least squares fit of the IEA decline data suggests a 4.5% decline rate for existing fields in production (FIP), which agrees with CERA's number. However, the IEA average observed decline rate for post peak fields is 6.7% which is about 10% higher than CERA's estimate of 6.1% (Table 1 CERA report Oct 2007). This should imply that the IEA's decline rate for FIP should be about 5%, higher than the year old CERA figure of 4.5%, but it's not.
The IEA WEO 2008, released in Nov 2008, uses 4.5% FIP decline rate whereas the IEA MTOMR 2008, released in July 2008, used a higher decline rate on slide 23 of this presentation by ex IEA executive, Lawrence Eagles.
www.iea.org/textbase/speech/2008/eagles_mtomr2008.pdf
The suggested translation of Mr Eagles statement "just to stand still" is "just to remain on peak plateau".
My cynical view of the 2030 IEA 105 mbd liquids forecast is that it had to meet two key criteria to satisfy political objectives. First, the forecast had to be at least 100 mbd in 2030. Forecast production below 100 mbd would be seen as too pessimistic, although more realistic. Second, no peak in the production could be shown. Both these criteria were met by the IEA's forecast.
In order for the IEA to meet both of the above criteria, they had to be overoptimistic not just on production increases from NGL, non conventional, EOR and yet to find, but also had to use an artificially low FIP decline rate of only 4.5%.
In my opinion, the world average FIP decline rate is somewhere between 5% and 7%, applied to conventional C&C of 70 mbd. As more countries enter decline, the FIP decline rate should increase. For example, Russia is now in decline, after ending its C&C plateau in 2007.
A key reason for increasing FIP decline rates is the recent oil production from offshore basins such as the North Sea and Gulf of Mexico, both of which are in decline now. Deepwater oil decline rates can be very high. Deepwater C&C production started about fifteen years ago. Many of those mature deepwater fields are now declining at rates of around 20%.
The IEA also agrees that deepwater FIP decline rate are high but uses different rates for different reports. Table 10.8 of the WEO 2008 report shows deepwater post peak FIP decline rates to about 12% on average. In contrast, the IEA OMR March 2008 report stated the following in relation to offshore oil on page 23
The chart on page 23 showed decline rates for UK at over 20%.
Deepwater oil FIP decline rates are high and this explains why Brazil is struggling to increase production. Brazil has added about 500 kbd new deepwater capacity in late 2007.
http://en.wikipedia.org/wiki/Oil_megaprojects_(2007)
Unfortunately, Brazil's C&C production only increased from 1.75 mbd in 2007 to 1.80 mbd in 2008 (YTD avg Aug 08).
http://www.eia.doe.gov/ipm/supply.html
Assuming that Brazil's non deepwater oil is about 0.3 mbd, this implies that Brazil's deepwater oil FIP decline rate could be as high as 30%.
Due to high decline rates in deepwater oil, I am forecasting that world deepwater oil production is now a peak plateau of about 7 mbd shown by the red line in the chart below. Colin Campbell, has overestimated deepwater oil production due potentially to underestimating decline rates. In Apr 2007, Colin Campbell forecast a 12.4 mbd peak and just last month revised the peak downwards by almost 4 mbd to 8.6 mbd. For the reasons given in red on the chart, I believe that deepwater oil is on a peak 7 mbd plateau now.
Deepwater oil production to 2030 - click to enlarge
source of unmodified chart http://www.aspo-ireland.org/index.cfm/page/newsletter
The IEA WEO's use of a world average decline for FIP of 4.5% is too low. It's even lower than the 5% number used in the IEA MTOMR July 2008. The IEA is overoptimistic and has probably not taken into full consideration the impact of very high deepwater oil FIP decline rates. I believe that a more appropriate world average FIP decline rate is between 5% and 7%, but probably closer to 7%.
Ace - thanks for much additional insight. I'll try and answer the main points:
Everyone needs to be wary of comparing segments of IEA with CERA. They use the same terminology as each other, but apply different definitions to that terminology. CERA Figure 5 shows their definition of "build up" - zero to 80% of peak, and plateau - 80% of peak either side. CERA Table 1 is for Post Plateau - so that is all fields that have already declined beyond 80% of peak. The IEA definition is given in Box 10.3, page 235. Their definition of plateau is 85% of peak. But they start to measure decline from peak - Decline phase 1 is form peak to 85% of peak. CERA decline phase 1 is from 80 to 50% of peak.
But this doesn't explain your observation since the IEA definition is more conservative and should be lower than CERA - but as you point out, its not. From memory, CERA Table 2 provides an excellent summary of their findings that is lacking in the IEA report. The latter contains so many different definitions, for me it is near impossible to follow.
On the same theme, the IEA say this, page 221.
On the same page they note that the post-peak decline rate is 5.1% for their data set, and so they are adjusting this upwards by 1.6% to account for higher decline rates in the myriad smaller fields not included in their data base. This seems a very reasonable thing to do. I don't believe that CERA made such adjustment, and so on this basis one may expect the IEA decline figure to be higher than CERA - but its not.
IMO it is a pretty straight forward exercise to calculate decline rates from this data set of 800 fields and to then apply the results consistently. I'd estimate its 1 to 4 weeks work and the results could be summarised in a 2 page report. So I understand your cynicism born out of reading hundreds of pages of technically detailed prose that do not stand up to scrutiny and cross examination.
In deep water:
Table 10.8 p 238
Post-plateau average estimate for deep water from the IEA is 11.2%. CERA table 2 quote 17.9% decline for deep water fields. The IEA post-plateau figure should be broadly equivalent to the CERA decline figure.
Last time I looked at UK North Sea decline rates (Nov 2006) the underlying decline rate was 13% moderated to an observed decline rate of 7.6% by new field developments. The underlying decline rate incorporates operating activities like in fill drilling and EOR, thus the natural decline rate will be somewhat higher than 13%. But for the purpose of production forecasting it is a figure close to 8% that should be applied.
http://www.theoildrum.com/story/2006/11/19/135819/75
One big problem I have with these decline numbers is that the returns on in field drilling are expected to be constant. And in field drilling itself is expected to occur at a constant rate.
It makes more sense to assume in field drilling is influenced by price and the field decline.
Higher prices accelerate in field drilling and declines accelerate in field drilling.
Also in field drilling by definition is finite and can only expand until the field is fully drilled.
Your ability to expand and maintain your infield drilling campaign is limited to the size of the
field.
Given the above we would expect that over the last several years in field drilling campaigns have been steeped up and at some point will result in steeper decline rates as they have increased the depletion
rate.
You saw a similar pattern when the US peaked except without the technical advances that keep production higher to greater depletion levels.
Whats really needed to understand our future oil supply given that discovery is well in the past is a understanding of the infield drilling campaigns and their effect at the field level.
Given that most infield drilling campaigns implicitly work to keep production at its peak design level and generally don't exceed it by to much. One would expect that producers of existing fields will do whatever they can to keep production close to peak but the pressure to increase production in existing fields is low simply because of constraints on the above ground oil gathering infrastructure. You can have production decline and deal with that fairly easily but expanding production is exponentially more expensive then maintaining the current production rate.
The overall effect is you have an unknown change in the depletion rate driving a constant production rate.
However one thing is for sure if production remains constant then the depletion rate is increasing in developed fields.
Next we know for a fact that our technology is capable of extracting oil at high depletion rates 20-25% is not unknown and in some fields even higher. Thus our ability to deplete a oil field with modern technology is probably close to physical limits increasing depletion rates beyond 20% or so becomes limited by EROEI issues.
This can be seen in the steady decline in field lifetimes over the last few decades generally blamed on finding smaller fields but we know from WHT's work that discovery does not follow field size so this is a incorrect assumption. Instead given everything we know we should expect that field depletion rates have been climbing on average for decades. And further more we know that the maximum depletion rates possible are high.
Now the way around this situation is to increase URR and thus decrease the calculated depletion rate
the easiest way to increase URR in existing fields is to type a new entry into a computer database.
Problem solved.
Memmel, this is similar to what I thought: The IEA numbers only distinguish natural decline and observed decline. But for a forecast (or scenario) both are only theoretical numbers, which provide an orientation:
Natural decline only happens if there is zero additional investment. But in reality this rarely happens as long as the field isn't hopelessly depleted - except for serious above-ground problems like in Iraq.
Also the "observed decline" only gives an orientation from the historical development, as the future decline doesn't simply depend on *if* investments will be made but also *which* and *how many* investments are made. For example future decline may depend on if the remaining reserve of a region will be tackled by vertical or horizontal wells. Much of this will depend on the future oil price, which may determine if more expensive methods will pay off - or also if sufficient capital, equipment, personnel etc. are available. In their scenarios this is partly addressed by the the IEA as they distinguish between conventional crude and "EOR" reserves.
So I don't think that the IEA's decline numbers can only be used as a rough orientation but not as a forecast as future production depends on many more parameters.
NGL’s (Natural Gas Liquids)
I am now anticipating a future post on IEA WEO 2008, which will be about…… NGL’s.
NGL’s are mainly proceeds from Natural Gas production. IEA combines NGL’s and condensates in their projections.
NGL’s normally have a volumetric energy/heat content in the range of 70 - 75 % of crude oil.
To describe the “wetness” or “dryness” of Nat Gas from a reservoir, it is common within the industry to describe this through a parameter that shows the development of the ratio between NGL’s and Nat Gas with time. The “wetter” a Nat Gas is, the higher this ratio is, and vice versa.
It has been observed for fields, areas and regions that the Nat Gas normally becomes “drier” with time, i.e. yields fewer liquids per unit of Nat Gas produced. If this is plotted onto a diagram, it shows that the ratio of NGL’s (liquids) on Nat Gas over time has a downward slope.
Click on the diagrams for larger versions.
The above diagram shows IEA WEO projections on NGL’s production. The blue area shows the projection from IEA WEO 2008, the yellow line the projection from IEA WEO 2006.
It is worthwhile noticing that the IEA in their most recent WEO projects a stronger growth in NGL’s towards 2030, while they simultaneously have lowered their projections on growth in Nat Gas production from WEO 2006 to WEO 2008. This suggests that IEA in WEO 2008 projects higher liquids (NGL’s) to Nat Gas ratio than in WEO 2006.
The diagram above shows the parameter of NGL’s to Nat Gas ratio with time. The red line is derived from IEA WEO 2008, the grey line derived from IEA WEO 2006, and the blue line has been derived from BP Statistical Review 2008 (Nat Gas production) and form EIA International Petroleum Monthly Table 4.3 which only lists NGL’s that is without Condensate.
Here it is worthwhile to notice that IEA now projects a higher world NGL to Nat Gas ratio towards 2030. In IEA WEO 2008 there have been found no explanation for this.
Actual figures, though only on world’s NGL’ suggests that this ratio has been running flat through the recent years.
The diagram above shows OPEC’s NGL production (light blue area) stacked on OPEC’s Condensate production (darker blue area) based upon EIA IPM tables 4.1, 4.3 and 4.4 for the years 1980 to 2008YTD (YTD; as of August 2008, from EIA IPM Nov. 2008) plotted against the primary y- axis.
In the same diagram is OPEC Nat Gas production from BP Statistical Review 2008 (for the years 1980 - 2007) shown as a red line plotted against the secondary y-axis. BP SR does not yet list Nat Gas production for Angola, Ecuador and Iraq, and judging from BP data the contribution from these 3 is estimated to be around 2 % of present total OPEC Nat Gas production. Angola and Ecuador are presently listed as having relatively small Nat Gas reserves.
In the diagram note how Nat Gas production for OPEC is growing faster than NGL’s and Condensate’s production. This suggests that the Nat Gas within OPEC is becoming “drier” with time.
Again, IEA defines NGL’s as NGL + Condensate.
As NGL’s and Condensate’s are not part of the OPEC quota system, OPEC members has an incentive to produce these as it generates additional revenues.
It is also worth to take note of that OPEC NGL’s and Condensates continued to grow during the period of the mid 80’s that by some has been referred to as the “quota wars” within OPEC. OPEC lost market shares (both relatively and absolutely) for crude oil to growing production from Alaska, the North Sea and Western Siberia during these years.
The above diagram shows the actual development in liquids (NGL + Condensate) to Nat Gas ratio for OPEC based upon data from EIA and BP (and derived from the tables listed further above in this comment) as white circles connected with a black line.
The actual NGL to Nat Gas ratio for OPEC is based upon actual data from presently two of the world’s present most acknowledged and respected data sources.
The light green circles connected with a black dotted line shows the NGL to Nat Gas ratio derived from IEA WEO 2008.
NOTE: The diagram of the actual NGL to Nat Gas ratio for OPEC shows a downward slope over time, i.e. the Nat Gas becomes drier. This is in accordance with what has been observed as “normal” for fields, areas and regions, and OPEC as a group does not, as of now, represent any exemption.
(More on this in an upcoming post about NGL’s and IEA WEO 2008 on The Oil Drum.)
What is interesting is what has made IEA in their WEO 2008 assume that Nat Gas within OPEC will become 30 - 50 % “richer”/”wetter” towards 2015?
IEA have in their reference scenario forecast a strong growth in Nat Gas production from OPEC (inclusive Middle East) towards 2030, but they have come short of explaining why OPEC Nat Gas grows “richer”/”wetter” in their projections.
This is important as IEA have balanced their liquids supplies towards 2030 in WEO 2008 with an increase in NGL’s supplies, while crude oil supplies has been revised down relative to earlier editions of the WEO’s.
Perhaps some of the readers can help out in explaining this?
I don't know the answer to the question of "wetness" vs. "dryness" of OPEC oil/gas as it relates to NGL, but I am looking forward to any upcoming posts on NGL production. Does anyone know what the "wetness" of the NGL is in the various Saudi megaprojects, or does the IEA claim to know things we don't about the laundry list of Saudi megaprojects? And what of the two new refinery additions that KSA is working on? Will KSA simply keep more of their production at home and sell the finished product of natural gas abroad (natural gas being difficult to move in gas form)?
http://www.hydrocarbons-technology.com/projects/khurais/
http://www.bloomberg.com/apps/news?pid=20601072&sid=a.558dKzK2NY&refer=e...
http://www.gasandoil.com/goc/company/cnm54378.htm
http://www.energybulletin.net/node/4785
Either way, I have become more interested in the ways in which NGL and natural gas product can be used in transportation, through propane, compressed natural gas and even methanol.
The market seems to be assuming enough supply of raw product to satisfy the markets of the world (at least in the near term) given the current price of petroleum products across the board (nat gas, propane, crude oil, gasoline, even methanol) all down by huge amounts and still falling as of today, (only a few dollars above the $50 flat mark for crude oil), and if KSA were to actually be able to deliver the 12.5 million barrels per day that they had earlier said they could do, and actually delivered, at this time of economic
contraction we would be awash in oil and NGL.
Should I just go ahead and buy that discounted Mercedes S-Class? Hmmmm....:-)
RC
Rune - Good work on the "wetness" question. My sense of the report is not that IEA did detailed and defensible calcs to come up with their projection for growth in NGLs (or EOR, or other new supply), but rather that they attempted to kick the question of additional supply into areas where the data is fuzzier and projections are harder to prove or disprove than regular conventional crude. I'd be willing to bet that they had no such explanation for increasing wetness of produced gas. But that's just a gut level guess.
ChrisN, thank you.
I think you are on to something when you refer to possible more “fuzziness” surrounding NGL’s.
From what I have seen of documentation on NGL’s (and there is little available in the public domain) it should be expected that Nat Gas will become drier with time.
The other factor affecting NGL production (extraction) is volume of Nat Gas produced. Towards 2030 IEA projects a big increase in Nat Gas production from Middle East (and other OPEC members). This could happen, the reserves are there, but Nat Gas in the Middle East is increasingly sour (H2S and CO2) which requires treatment before it enters the market (either by pipeline or LNG).
This suggests heavier investments in the production of Nat Gas, and with the ongoing credit crunch in mind, it might also be that the capital will not be there at the pace desired.
Here are three comments from Oil company CEOs from recent conference calls, giving some support to the higher decline rate theme:
"depletion rates for oil and gas production have surged in the past decade. Because of faster resource recovery drilling methods and lower overall quality prospects, annual oil depletion rates have grown from 4% annually to about 7% today. We need to find and produce an additional 6 million barrels of oil per day worldwide just to compensate for this depletion. The natural depletion story is even more compelling. This is why rig count reductions shouldn't last long."
Doug Rock
Chairman and CEO, Smith International
“… we see overwhelming empirical evidence that suggests the present level of drilling and production enhancement commitments are not sufficient to arrest accelerating decline rates in oil, let alone secure the targeted one plus million barrels a day capacity increase per annum the industry plans on”
Bernard Duroc-Danner
Chairman and CEO, Weatherford International
"I would say that overall we are probably slightly more pessimistic, in other words we think the client rates are slightly worse than we would have thought two our three years ago."
Andrew Gould
Chairman and CEO, Schlumberger
Nate, I imagine all these statements apply to parts of the global production stack that matter most to those who made the statements.
It is not possible to make coherent sense out of Chapter 10 of this report because it is incoherent.
Two things though that bother me:
1. IEA make an allowance for higher decline rates in the 69,200 fields not included in their data base and this seems a reasonable thing to do that sets them apart I believe from CERA. Its just that this allowance of +0.9% disappears in their final analysis (Chapter 11) and in their charts.
2. IEA are forecasting decline to accelerate going forward by 1% (on part of the stack) while CERA concluded that decline was constant.
So my best guess right now is that 4.5+0.9 = 5.4% may be a good figure to use right now and that this may increase to 6.4% by 2030. I think it unlikely that the current observed global average is much higher than 5.4% or it would not have been possible to have grown production this year.
What is the Liebigs Law of the minimum for accurate oil supply forecasts?
Is it data, or politics?
I'm very curious about the 30m bpd (more or less) of crude yet to be found plus the crude oil fields yet be be developed. in light of the statements of the companies that are charged with the development of these fields, the amounts seem extremely optomistic.
Since any 'great finds' are likely to be offshore in very deep water or in arctic regions, I don't see how the 2030 production targets could be met with less investment.]
So ... my question is ...
what are these dudes smoking?
What really strikes me is that light blue "yet to be developed" area.
How much of these are difficult/expensive to develop fields like Tupi? How many are likely to have been mothballed due to the global financial crisis and plummetting oil price? In other words, what feasible proportion of that light blue area is likely to actually undergo development?
Take that light blue away (or significantly reduce it) and we're looking at an imminent slide down the dark-blue hill...
... "Yet to be developed".
Access to reserves and uninterrupted access of crude to the production chain are big question marks and are basically non- calculable.
- There are reserve and discovery areas that are inaccessible because of political/treaty disputes such as areas of the Arctic, the Antarctic, 'borderland' areas surrounding Russia, Taiwan Strait and the oceans surrounding the Falkland Islands.
http://www.worldpoliticsreview.com/Article.aspx?id=1019
http://www.articlearchives.com/environment-natural-resources/ecology-env...
http://www.pinr.com/report.php?ac=view_printable&report_id=439&language_...
- There is supply that cannot be delivered efficiently because of interception risks, or where (substantial) risks are added to costs such as increasing piracy and militancy within and offshore Nigeria, offshore Somalia and Kenya, West Africa, and Indonesia. Piracy seems to be increasing worldwide demanding increased resources from developed countries to combat it. There is another discussion regarding piracy here on TOD;
http://www.theoildrum.com/node/4778#comments_top
- There are attacks on pipelines and other petroleum installations by militant groups; in Turkey, within the Caucausus region, Central Asia, in Iraq and occasionally within Saudi Arabia, itself.
http://www.twq.com/08spring/docs/08spring_riedel.pdf
- There are reserve areas that are questionably accessible because of climate; besides the polar reqions, the Gulf of Mexico and offshore South East Asia have been swept by increasingly powerful storms. There was a cyclone in the Arabian Sea last year, the most iontense ever recorded in the Arabian Sea, which cost significant loss of life and property in Oman and Iran.
http://en.wikipedia.org/wiki/Gonu
All of these non- geological forces work to leverage the physical extraction, refining and delivery process. Costs are costs and have to paid from somewhere, including less funding available for exploration, or exploration/development is postponed until an area is pacified.
Euan,
The WEO08 report has a table, 10.9, on regional decline rates that looks very interesting. For all regions, bar the OPEC Middle East one, giant fields have larger decline rates than super giants, and large fields even higher rates than giant ones. BUT, for the OPEC Middle East, the large fields are given a decline rate of just 4.4%pa, compared to 2.2% for supers, and 6.3% for giant fields. This line in the table is the only one (out of 12) showing this relationship- any idea why?
Table 9, p239
IEA definitions, all 2P initial reserves:
Super-giant >5 billion bbls
Giant - 500 million to 5 billion
Large - 100 million to 500 million
The rule of thumb is that decline is higher in smaller fields, and so I cannot explain why ME OPEC Giant fields are declining faster than ME OPEC Large fields. Other factors such as onshore - offshore also impact data, so perhaps this is just one of those statistical outliers. ME OPEC production is of course impacted by political field management that clouds the decline story.
More important is a concern I have about forecasting decline in the ME OPEC super giants. The way these fields are developed, they are held on a suppressed plateau for a long time since only parts of these huge fields get drilled and produced at any one time. However, once they run out of new dry oil areas to drill then the fields will fall off plateau and will decline like other fields. This accelerated future decline may not be captured by the historic production data.
For what it's worth, I have a very simple model for calculating and projecting this decline rate. (And I've done it with ZERO real-environment measurments... ;-) )My model is purely theoretical in nature, and it tracks the aggregate decline with all the EOR involved. It is indeed simple, but I’m sure it works to an extent – I’ve been using it for predicting supply and the results it has provided were in good agreement with the data.
Bearing in mind that the present credit crisis and (supposed[?]) demand issues have altered the validity of [some but not all of] the numbers as far as projecting the future goes, I’ll hereby guide you guys through the main assumptions and projections of the model – if for no other reason than for the sake of you telling me what’s wrong with this.
It gives us decline rates with EOR and a possible maximum of C&C production. So here it goes.
Legend
Using the above acronyms, we can state the following:
Y1 + M – D = Y2
D = (Y1-Y2) + M
DR = ((Y2-Y1) / Y1) X 100
Creating a sheet we arrive at these numbers for 2003-2007:
And we can create the corresponding graph:
Now let’s plot the decline rates of the different years, and on the same graph let’s also calculate a moving (rolling) average, shall we?
(Not so) surprisingly, the decline rate and both the rolling averages point to 5.5% in 2008. (In fact the number is 5.7% with H1 2008 data included.) What are we to do next?
Let’s assume we can project the decline rate in the coming years. It has to increase, due to the fact of more and more deepwater fields, less and less giant fields, and lack of EOR (not included yet in the charts). Once coupled with the megaprojects data for the following years...
...we can create a new set of numbers in our next sheet (for 2008-2015)
And we can make this fun graph:
And another graph:
It comes down to a C&C production of 60 mbpd as a maximum in 2015. Should I include lack of investment in new fields and EOR in the coming years, it will most certainly be well below that. (Including lack of investment will lower the number coming from megaprojects and increase the decline rate as there is less EOR.)
So what I basically say is this:
What do you guys think? (I could give you some more numbers and details, but enough is enough….)
(Note #1 I've found EIA data to be more reliable, so the graphs contain EIA data, not IEA data. Note #2 The negative decline rate in 2004 is the result of two things: EOR must have been pronounced that year being the first of the two. The second is that megaprojects come in increments whereas the decline is a never-sleeping process. Once you do a month by month table, negative decline disappears. I'm not going to post that fairly big table now, but it inded disappears, trust me...)
Eastender, I think you need to give some thought to two variables which I'm not convinced are handled correctly in your analysis:
OPEC spare capacity
Global Total Liquids production and oil price, January 2002 to present. Production data from the IEA, data files supplied by Rembrandt Koppelaar. Monthly average WTI oil prices from Economagic.
Global spare production capacity from this presentation by Lawrence Eagles of the IEA (link lost). Note how 8mmbpd spare capacity in 2002 had all but disappeared by 2004. It has since then grown slightly but is once again in decline.
Bringing spare capacity on has the effect of lowering observed decline rate and vice versa. If you could incorporate ± spare capacity into your analysis it would likely provide a better picture - I think.
http://www.theoildrum.com/node/4007
Megaprojects planning horizon
The fall off in mega projects post-2012 is almost certainly influenced by a 5 year planning horizon.
Project slippage is also very important and results in over-estimation of new capacity in the near term.
Euan,
you got the spare capacity part (partially) right. I didn't include it in the model and I'm sure you have a point: I should have. However, to my understanding most of this spare capacity Saudi Arabia has is heavy sour crude and we didn't have the refineries to be able to buy it. Jamnagar in India and the new Chinese faclities being built right now address (a part of) this issue though. I'll try to find a way to include spare capacity in the model, thanks.
On the other hand, I did think about the megaprojects addition profile, as indicated by this graph:
The additions I used in the tables above are represented by the black line, not the original columns. As you can see, the black line gives a lower value in the near term (slippage) but a higher one later on.
I'd like to note another thing: as far as I know something not even planned for cannot be done soones than 6-7 years, especially the big projects. So AFAIK a project not in the pipeline NOW will not come on-line before 2015.
Is this interpretation false?
Euan,
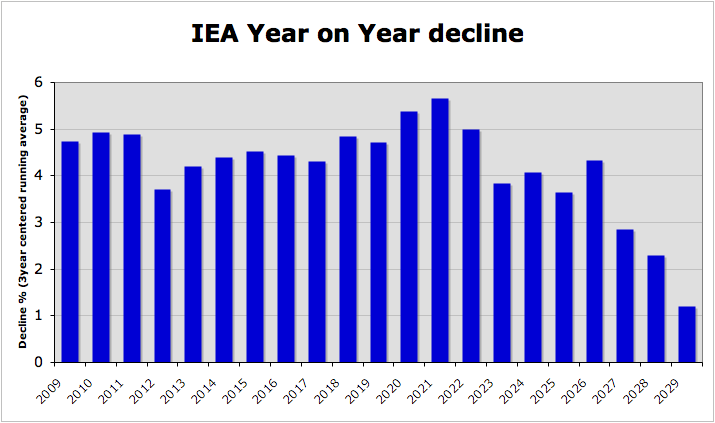
I did something very similar to your analysis when the public graphs were released. As I pointed out in Nate's previous article, the graph you refer to at the top of the page has been edited by hand.
It's there just above the 2020 point if you look closely. There maybe other edits that were more accurately done. Certainly when you read back the figures and calculate the YoY decline rate, its all over the place.
My feeling was that most of what you see corresponds to a semi-back-of-the-envelope type calculation rather than anything bottom up. Increases in new developments and new finds follows simple curves, etc. rather than anything more realistic and fractal.
In short, unless the IEA makes available their base data, I don't think this should be given too much credence. Its a political document, not a scientific one.
You're not suggesting that the IEA liquids production model upon which multi-billion $ investment decisions will be made is little better than a hand drawn sketch, are you?
Perish the thought.
However there are very few ways in which a vector cut'n'paste from Excel could end up with that kind of tweak in the line by accident. You would have to load it into a vector editing package and 'edit the points' to make it do that - then re-export to the main report and PDF.
If you take the data derived from the graph and plot the YoY decline rates of the currently producing fields, you get a graph something like:
Noisy data from image I'm afraid.
None of which either makes sense, or ties in with the statements made. Decline rates dropping post-2020 isn't physically possible is it?
I think the IEA needs to make their base data available, since their analysis leaves much to be desired.
Gary - first class observation. I made my own chart from the data I extracted and see the same thing - I used a 3 point centered moving average to smooth the noise:
I've added an editors note at the foot of the article. It begins to smack of scandal that IEA put out a report that says decline is accelerating - yikes - and then stick out a chart with decline decelerating beyond 2021.
If you continue the 2008-2020 trend you find a discrepancy of about 5Mbpd by 2030. That's enough to pull everything up to and including new EOR onto a post-peak decline, even given the overly optimistic views taken on new field developments, etc.
Also, note those little bumps in the line about every 3-4 years? Look closely and they don't continue through to the non-conventional or NGL lines as they should, AND they correspond to yet more edits in the vector data.
In short, I think the graph isn't constructed from calculated data, stacked in Excel. Something else is happening (I think they started from the top line and worked down) and the graph has then been edited after creation to make it 'better'.
Gary - Rembrandt pointed that Figure 11.1, page 250 in the report lacks some of the aberrations present in the Key Graphs version. Lets say the Key Graph is a work of art which in Figure 11.1 has been restored. Click on chart for a larger version, I made it as big as I could.
I overlaid the the insets from the 2 versions of this chart and made the top one 60% transparent. Picasso's handy work is there for all to see.
Just what I've been doing, but looking at the 'difference' instead.
As far as I can see there is the big difference you have highlighted. Plus there are lumps and bumps differences in the top of the 'discovered' area (~1-2Mbpd); differences in the non-conventional in history (~1Mbpd) and some very small differences in total magnitude of NGL (~1Mbpd).
However the nonreadthrough of the bumps highlighted above remains.
My guess is this is a slightly earlier/later variant of the same graph, but still with major questionable elements. Either way, I don't feel its safe to treat this as reliable data - too many questions. I'd want to see the working that gets to this before either could be considered anything other than 'artistic'.
Edit: Just realised that the Fig 11.1 graph is later - they went in a fixed the obvious graph errors. How do I know? Well the new bit of line on the 'current' wedge is dead flat over about a decade, no curve to it.
OK, you are going to love this.
The key graphs PDF is totally unprotected. Therefore you can load it up in a full PDF editor and pull it apart. In particular you can find that the presentation was put together in Powerpoint and then converted to PDF in Illustrator I think (the vector package in question) on the 3rd November (after the leak to the FT). You can also find that the reason the graph shows signs of so many edits is that it was. However the little edits are still there in the file and with a little use of the "TouchUp Object" tool you can find and remove the additions to yield:
Its obvious why it was edited, the curves don't look tidy or right with strange zero decline bits and changes in rates for no apparent reason. Note all this proves is that what you saw was 'artistically' modified from what was input to Powerpoint from Excel/model. It doesn't say that other fixes, fiddles and political modifications weren't done before that stage, and indeed the lack of the small peaks in the non-conventional & NGL remains to suggest all is not well.
Pawel Olejarnik its time to come on down...
Nice discovery GaryP, I checked it out and there are indeed three strange triangles (one blue, one light blue). Used to make the chart look nicer.
Beautiful piece of detective work.
what i don't understand is... if one was faking it why not just increase the red "yet to be found wedge" inside excel and press graph?
or if you did that the red wedge would be too obscene?
Boris
London
I believe GaryP had pointed this glitch out in comments to a previous post.
Weird stuff can be caused by graphic arts departments, where after all they are artistically rendering data.
Could not data discepancies also be caused by different team members working on the same report? It is difficult to maintain consistency in that type of environment.
If you look very closely at the PDF you can see that the graph you are seeing is vector data, and that the points 'go back on themselves'. No copy of Excel, etc. is going to do that, and neither is a whole graph edit that might be caused by translation, team member communication. You have to go in the edit the points to get that to occur.
One possibility, if you are being kind, is that the base data was created by hand and then someone traced it in for this graph - but then why would that happen if its complex model output?
Whatever, its not going to be trustworthy unless traceability through from model to graph is demonstrated.
Edit: See above
Euan - thanks for all this sleuthing. I am not an energy expert and don't know the history of the IEA. Perhaps someone at TOD should accompany this series with an explanation of who the IEA is and what is the impact of their reports on corporations, governments etc?
I do however have a business background. Who audits these IEA reports? If this was business and what you say is true, it would be fraudulent. But perhaps the IEA is 'too big to fail'?
Thanks again.
J
Hello Jones, welcome to TOD,
This is a great idea. I'll suggest someone does this. It would be really interesting to know how many people work there and what their annual budget is. In the UK we have a freedom of information law that would make all this information publicly available - I'm not sure if that stretches to an organisation we pay for that is located in Paris though.
I suspect in the past no one did. But from now on we'll be keeping and eye on what they publish.
I've been looking at the decline rates briefly myself, but haven't had the time to read the whole WEO yet.
My take was that their decline rate average was based on historical trend (it has been accelerating) and that their forward looking decline rate curve is what it is : a model based on data now available, e.g. an estimate.
These do not need to be contradictory, because they are different. One historical, another one future estimate (and bound to turn into an accelerating rate, mind you).
And yet you are 100% correct that the wording or verbal phrasing of the decline rate part in the documents could have used more accurate wording.
Then again, I could be wrong as well, I'd really need to wade through the whole document to be even remotely certain. However, that's how I just assumed the difference myself.
Howdy SamuM!
Care to revisit our discussion of "fundamentals" vs "speculation" of 60-70 dollars ago?
Sure looks like a bursting speculative bubble. But hey... wat do I know? :)
Is this a speculative bubble then?
DJIA

It's certainly a boom/bust cycle exacerbated by speculation (in both directions)... but a "bubble"? Hardly.
If it had run from 10,000 to 35,000 in three years and then lost most/all of that gain in a year or so... THEN it would clearly be a "bubble" (as with the NASDAQ collapse).
Not all price increases are bubble and not all price declines (even sharp ones) are bursting bubbles. A bubble is characterized by uncommonly dramatic (seemingly unsupportable) price increases followed by the loss of substantially all of that gain. There's nothing uncharacteristic about a 40% stock move over three years... that happens all the time.
cmon - get serious. this IS a speculative bubble, but not in oil - open interest since oil was $90 has all but dried up other than day traders and hedgers. The 'bubble' is financial assets, not oil. Due to all the rule changes scores of large players have left the playing field, leading to forced margin calls and crazy volatility- the entire unwind is based on financing in Yen and dollars -the correlation between virtually all world equity indicies and commodities have been over .85 with Euro/yen since July. If this was a bubble in oil, it would be down more than everything else, and stocks would be rallying. This is something else. The volatility due to lack of market participants is amazing.
Got this from an analyst friend of mine today. I completely concur:
This is not an oil bubble, but a once in an era (species?) deleveraging that has yet to run its course. The oil 'bubble' part was from maybe $120 to $145. IF the world economy recovers, oil (and gas first with cold winter) will outperform all other commodities (with possible exception of grains). Deflationary depression with oil stabilizing at $80-$90 is my best guess for 2009 - but give me 6 more weeks of datapoints. The deeper the chasm now, the worse oil will be in future and higher likelihood of nationalization of oil sector and demise of futures trading in oil..
In my opinion futures markets are poor indicators of price when the price is falling.
The liquidity is provided by consumers hedging against rising prices. Producers trying to lock
in profits have a very tough sell in a falling market.
When consumers finally become interested in hedging against prices then we will again see the futures markets actually perform price discovery.
I think this is intrinsic in any futures market that they overshoot heavily when you seen a decent fall in prices.
Why would any consumer lock in prices now given everyone so far thinks they are falling.
This is about expectations not bubbles and expectations can change rapidly.
You can get the same sort of overshoot on the upside but when prices are increasing I suspect you see the consumers hedge up earlier on and thus for a pure futures market you tend to lose momentum on the upside this overshoot is more limited going up then going down.
The futures markets are intrinsically designed to hedge against price swings on both sides except in my opinion they are weighted towards working better when prices are increasing. Thus they work fairly well in allowing both producers and consumers to lock in know profits or costs in a generally rising price situation.
Think of it like buying a home now why would you unless you had to your not going to "lock in" a home price thus no reason to take a bet on homes futures work in a similar fashion and sellers are forced to take what ever price the spot market offers.
Unlike housing where we know how many houses are out there the supply and demand equation for oil is murky to say the least. The moment producers begin rejecting low offers is them moment the futures market heats up.
For example
http://www.commodityonline.com/news/OPEC-basket-price-falls-below-$-48-12796-3-1.html
Spot prices are still falling the moment they stop falling is when the futures market starts to heat up you don't have to watch these for the most part since a lot of people do.
But I bring them up because Saudi Arabia sets the price of the crude they sell at a premium or discount vs NYMEX prices this they can unilaterally increase the price of the crude and don't have to cut. If the prince increase sticks then we are off to the races.
Or try to lower it.
http://www.energybulletin.net/node/45483
Yes, I can revisit the discussion.
I've been trying to read some new stuff that has come to light since the fall of oil price. Haven't had enough time due to other commitments.
With that said, my current understanding, not a hard stance is as follows:
1. Yes there was *probably* some financial speculation that somehow affected the price rise of oil from Fall of 2007 to Summer of 2008. How about price manipulation? I'm not so sure about that.
2. I still don't have any believable data on who, how and using what mechanisms was this achieved, which is quite unnerving for me, but not a proof it didn't happen. I'd be willing to get any pointers to data on this if anybody has such. To me correlation is still not causation. Call me thick, but I'm taught that way.
3. As for the all in price of oil since July, several factors may have contributed:
3.1 Strengthening of dollar (22% rise in USDX)
EDIT: Borrowing from cryptogon.
And yes, there is a causation not just correlation. Ask ME finance and oil ministers.
3.2. Rapid fall of economic activity, esp in Sept/Oct as almost all of OECD officially entered recession and China/India/Russia slowed down considerably.
3.3. Somewhat related: a crash in worldwide shipping activity and closing of dozens of thousands factories in China alone (major users of local electricity produced with mid-distillates, which were particularly squeezed this year)
3.3. Changes in commercial hedging in the futures market due to rapid fall in spot price and negative differential compared to earlier long hedging positions (i.e. these had to be compensated)
How much did each of these affect the price? I don't have enough data and probably not statistical skill to deduce this.
Summa summarum: Was it all a financial speculative bubble from c. $50 level upwards? Possible, but highly unlikely. How about from $70 level? A bit more likely, but I don't think it still explains all. From $100 upwards, much more likely, in fact quite so but exacerbated by other financial (USD) and commercial (hedging) activities as well.
What was the final nominal USD size of the financial speculative bubble on top of a fundamental/base-financial price?
I'm afraid we'll never know, unless some traders come clean after 20 years, but I remain in belief will get more of the same - regardless of the causes - in years to come, when we finally come out of the coming global [r|d]epression.
That is, the increasing yo-yo-price effect in oil has now been activated, possibly for the final run until the peak and beyond.
That's my stance now and as always I retain the right to change my opinion if new corroborated evidence surfaces.
In the meanwhile, let's get back to IEA numbers, shall we.
I commend you for being open to revisiting your assumptions when facts change.
I caution you against drawing conclusions from that graph. You've heard the old "lies, d@mn lies, and statistics" no doubt? Playing fast and loose with the Y-axis falls into that third category. That's an incredibly dishonest graph. You can't graph a 22% increase up against a movement three times as great in that way. The correlation is only partial and, if anything, the causation is likely to be in the other direction (lower oil prices improve the US balance of trade which in turn strengthens the dollar)
That isn't necessary... I'd suggest just looking at the last time energy/opec/whatever did this. OPEC's stranglehold on production caused spiking crude prices which simultaneously encourages non-OPEC nations to ramp up discovery/production and drove economies into the wastebin (restraining demand). OPEC couldn't enforce discipline as members outproduced their lower quotas (needing more funds as their existing production was worth less each day) which caused a relative glut and collapsing prices.
The mistake too many make is to assume that it's "different this time" because there simply isn't any oil left to pump... so prices would continue higher despite demand destruction.
Hmm as far as the 22% change in dollar strength leading to a larger reduction in price.
And example at the peak of the bubble housing prices went up their standard 10% just like every other year since the bubble started but resulted in a fall in price of right now about 40% and still falling.
Your wrong to equate a certain relative change in price with the overall move of a market.
It does not matter if its a strengthening dollar asset valuation what ever.
Prices are set on the margin in the case of oil if two things hold the dollar strengthened devaluing the hedge contracts and supply exceeded demand then you set the conditions up to pull the rug out from under the price. If a speculative bubble exists on top of this then the price fall could be even more dramatic esp if external market forces are putting pressure on the speculators to sell liquid assets to raise cash. This is true even if the speculation has valid underlying fundamental reasons if the fundamentals change then the speculators are hosed. The fact that a number of airlines where heavily hedged agianst rising oil prices indicates that actual commercial consumers did not feel the price was a pure speculative bubble.
As far as looking at last time well to some extent history can and will repeat itself but on both the oil front and the economic front we are entering a different era. A lot of people can see a depression is probably on the horizon but few think it will be exactly like the 1930's.
But I don't want to debate you on the subject I just hate to see people use this flawed form of logic both of your statements esp when put together result in a flawed conclusion that has no merit.
Worse both are technically wrong. A small change in one variable can lead to a large change in another we have this concept call non-linear behavior mathematics beyond strait lines exists and is alive and well. Next although history serves as a guide a perfect repeat of history is the least likely event to occur thus you assert the one situation that has the lowest probability.
This is a general problem I've seen with a lot of ant-doomer arguments what you find is that the proponents have not done a very good job of building up a complete argument. The method of attack is fragmented "truths" coupled with potentially erroneous conclusions.
Personally I'm tired of seeing this approach it get old quickly and drowns out people that actually make really good points. Off topic but a good example is Wind Power which has some great and real support behind it.
The sad thing is that if oil prices rise quickly and begin to approach 200 starting in the next few months like I predict then people like you will just disappear you won't stand up for your argument.
If I'm wrong then I'll admit figure out why I was wrong and continue to try and understand the problem.
And obvious problem is your assumption that non-OPEC nations can ramp up production I think the possibility of that is low given all the work thats been done on the oildrum and elsewhere. I could go on and on but your offhand comment falls apart with even a small amount of scrutiny. And guess what I've actually looked at what happened then and whats happing now to see if we will get a similar situation.
Garyp & Euan,
I appreciate your observation but:
"You would have to load it into a vector editing package and 'edit the points' to make it do that"This is not true. This pattern can result from normal Excel spreadsheet data. Of course they are not a natural sequence but rather bad data, but they don't need manual editing. Try yourself this series and plot a graph of connected dots:
80 6
70 8
60 10
0 18
40 14
30 16
20 18
10 20
If you are plotting a stacked area graph in Excel you are not plotting 2D points. You are plotting an ordered list of data against a list of labels. Thus it doesn't matter what your list label is, just where it is in order. Try it.
In short, nope, you don't get the opportunity to go backwards in x value.
Anyway, as is above demonstrated, its proved that they added little triangles to the graph to attempt to smooth things out. By taking it apart in a PDF editor you can not only delete these, you can tell what package was used to put them in ("Illustrator" it appears).
Correct, you cannot do this with a stacked area graph in Excel.
Now I've checked the pdf myself and found the 3 triangles they added.
The next step is to wonder why they did it, as it doesn't change much the entire picture.
One explanation could be that the wanted to have the graph looking nicer - literally. In also had worked for people who wanted graphs for things like a powerpoint presentation and they didn't like the ugly zigzag I had but wanted something that looked nicer (literally). This happened rather with high-level executives who wanted to have a nice presentation, but not with other scientists. This is probably not a major issue if such a presentation only gives a general idea to other executives.
But of course it may be a major issue if the concept of making scientific results look 'nice' goes down to the scientific work itself. If the scientific data, methods or results themselves were manipulated by design (for whatever reason) the entire scientific work may be devaluated.
You can also plot a circle going back to the origin:
0 0
10 0
20 0
30 0
40 0
40 1
40 2
40 3
40 4
30 4
20 4
10 4
0 4
0 3
0 2
0 1
0 0
No, the IEA are not to be applauded for any decline rates, 'business as usual' scenarios, forecasts or projections, since they do more harm than good and are inherently of limited use in the first place. Basically, the IEA partially acknowledges the literature on peak oil, and then suddently flushes most of it down the toilet via a large number of assumptions.
They are to be applauded for their excellent data and statistics, and some policy analysis etc. That's the good stuff. The 'business as usual' scenario contains some pretty darn unusual assertions!
This shouldn't surprise anyone. Whenever the IEA starts making assumptions, the marginal usefulness of their analysis becomes negative.
I am still curious where that red piece of the pie is coming from.
and the yet to be developed fields, how do they manage to ramp up so quick then sustain for so long.
sounds like finance, they just keep rubbing the figures until it fits.
I was waiting for someone else to open that can of worms, since it smacked me square in the eye, and yet all the pros are chewing over analysis of minute discrepancies in what looks like unreliable data. Not being from the oil patch, I feel like my job is to read and be quiet -- but you opened the box.
The "red" area is almost 5.5MBD by 2030, and its slope almost exactly mirrors the decline of "conventional" crude. The sum of Crude, currently producing, Crude, yet to be developed, Crude, fields yet to be found and most mysteriously Crude, additional EOR maintains an absolutely flat slope from its peak of 2005!
Is that pure fantasy, or is there some hopeful expectation that the recent signing of the "Status of Forces" agreement with Iraq will finally allow a great deal of crude to be "found" in Iraq?
I went to a play about the life of Buckminster Fuller last night -- I think there is a lot of reason to be hopeful about the world and its people, but I don't derive any hope from CERA, IEA, or their client organizations. But then, I'm not an oil specialist, and I really should just keep my head down.
We're going to have a post every day this week and next dealing with some aspect of WEO 2008. This post is about decline rates. A post later on will deal with the discovered undeveloped, yet to find and NGL slices.
Thank you in advance, Euan. I will keep silent until the end of the series.
Fine. Don't forget the EROI of the unconventional resources.
It's about 20Mb/d; onscreen, at least, it's roughly the distance between 40 and 60Mb/d.
To-be-found oil seems to increase from roughly 4Mb/d in 2020 to 20Mb/d in 2030, or an addition of 1-2Mb/d per year. Considering that megaprojects amounting to 4-5Mb/d are currently added on a yearly basis, finding the to-be-found oil is likely to be a bigger challenge than producing it. (All things being equal, of course, which they're not; the to-be-found oil is likely to be more expensive to produce than current oil. Still, the scope of the projects that to-be-found curve entails is not unreasonably large relative to the current scope.)
In terms of finding this to-be-found oil, a production plateau of 3% of URR (roughly what the US North Slope saw) would suggest ~200GB of URR would need to be found and brought into production between now and 2030. Assuming all back-dated oil discovery is taken into account under the "currently producing" and "yet to be developed" categories, ASPO estimates that this "to-be-found" oil will fall short by about 80GB, or about 8Mb/d by 2030.
One explanation for that is simply that oil will be found and developed as needed.
If the total production represents estimated demand (conditioned on price estimates), and if NGL/unconventional/EOR are all price-insensitive, and if sufficient to-be-found oil exists, then we would expect to see exactly this pattern, where new oil is found to replace old oil that goes away. We would not expect to see more to-be-found oil added, as there's no demand for it.
I'm not saying I agree with this model, as there are significant questions about the quantity and flow rate of to-be-found oil, but I do suspect that's the basic underlying idea.
I've been out of the loop for a while, but it occurs to me that it might be interesting to calculate the decline rate for several large oil fields that have peaked, where we have reasonable data, e.g., Prudhoe Bay, North Sea Fields, some large Russian fields, etc.
Also, it would be interesting to look at what Simmons calls net decline rates (declines from existing production plus the effect of workovers, enhanced recovery, plus new fields, etc.) for discrete regions, e.g., Texas, Alaska, North Sea, Indonesia, Mexico, overall US Lower 48, etc.
Hi Westexas,
PEMEX says that Mexico can get production back up to 3 million barrels per day.
http://www.canada.com/calgaryherald/news/calgarybusiness/story.html?id=e...
What do you think?
Cliff Wirth
I have frequently mentioned a comment made by the Texas State Geologist in 2005 at an industry conference, in response to a question from me, after he presented the "Undulating Plateau" theory of world oil production (I pointed out that discrete regions like Texas, the overall Lower 48, and the North Sea had not shown undulating long term plateau patterns).
In any case, he said that while Texas may not be able to match its 1972 peak production rate, it could, with the use of improved technology, significantly increase its production. So, delusional thinking is common regarding post-peak regions.
That's probably the same sort of people who keep thinking we can colonize other planets as soon as this one is exploited.
One of these things is not like the other.
TROLL DECLINE RATES
Troll production Jan. 1999 - Sep. 2008.
Development in Troll decline rate.
Like the above?
Some of this can be calculated easily enough from the EIA data. Most of the series start at 1981, so since then net decline rates have been:
Using the EIA's international total oil supply data and from each country's most recent peak year through 2007 gives:
For those who prefer to exclude certain parts of the oil supply, note that looking at BTU-valued C+C production gives quite similar results:
"net decline rates"
This should be the same as what the IEA calls "observed decline", isn't it?
I think that the various deline parameters and its values could be clearer.
I'd wish very much to see a table like this (template with random numbers):
+ perhaps a column with the overall decline from all fields.
Thank you for a fine deconstruction of the report.
After the IEA have been allowed a suitable time to respond to the points you make, may I suggest that you send a brief article showing what appear to be the contradictions in their report leading to an over-optimistic projection to Bloomsberg and to the Economist?
Bloomsberg as they have recently shown that they are no respecters of persons in their challenge to the Fed to specify how they are spending money, and legal action - in fact behaving remarkably like proper journalists - and The Economist as they seem to have recently come to suspect that all is not well in the garden of oil supply projections whereby demand always calls forth supply, judging by their recent respectful treatment of Simmons.
One or the other might introduce to a wider audience that this report seems to be grossly over-optimistic.
Davemart,
do you mean the article "Cold black gold" in the Economist? If not, could you send me (or post here) the weblink to the article you mean? Thanks a lot!
Here is the article on Simmons I referred to:
http://www.economist.com/people/displaystory.cfm?story_id=11702995
Cheers!
Hi I am a Danish communications student currently doing research about the reputation of Exxon Mobil in the eyes of the American public. I need your help filling out out a short survey in order to complete my research. the questionaire has 13 questions and will take only five minutes of your time. The link to the survey is this: http://aln.asb.dk/StudSurvey/survey.aspx?surveyid=xf5v53980gbo2m3
Thank you very much.
Readers of this site are probably not a very representative sample of the American public.
Do not discourage students. You do not know what other groups or sites that he/she has posted on - Daily KOS, Moveon.org, etc.
{redundant comment deleted)
Euan,
How do we know that the decline rates for OPEC are accurate?
It seems very surprising that OPEC would share that data
Can we put as much faith in their stated decline rates as in their published reserve estimates?
also,
How does the analysis above square with Slumberger's comment that decline rates are about 8%?
finally, can we say that with ELM, on average on a global basis, we just add 2% to the final number? or is that too simplistic?
thanks
polytropos:
We don't. Even IEA admits this to a certain degree. See more details e.g. at
Fuzzy Focus on Saudi Arabia
I don't now the right number but I think yes.
See also the most recent posting on ELM in TOD.
Does anyone know if these production declines assume that OPEC reserves, for example, are taken at published values, or if there are factors applied to provide a more realistic assessment of remaining resources?
Euan,
First, a question regarding your statement that “The IEA is to be applauded for conducting and reporting a detailed analysis of global oil field decline rates”. I have only read the summery and have not seen the section on methodology so please correct me if I’ve interpreted the summery incorrectly. Accepting, for the moment, that the IEA’s decline rate model is correct, do they not apply this decline model to recoverable reserves amounts that are supplied by the producers? In other words, the IEA has not made an independent study of the proven remaining reserves in any of the fields they’ve modeled. They ‘ve modeled their decline assumptions based upon unverified proven reserve values.
Secondly, I’ll offer a rather brash statement that any effort to offer a “decline rate” on any of these fields based on each field’s historic decline rate is rather futile for the most part. I do not condemn the effort to make such generalizations as it’s the only approach available since the producers (especially the KSA) won’t provide the necessary data. Above all else, there is no such number as a single decline rate for any water drive reservoir. Many of the largest oil fields, such as Ghawar, in the world fall into this category. Just for the moment, let’s ignore water injections methods and look at the typical decline rates of such fields. First, there is no such thing as a typical FIELD decline rate. Let’s look at a typical WELL decline rate. Initially, little decline is seen in fields with strong water drives. As the oil is produced the oil/water interface rises and thus maintains a fairly consistent flow rate. But eventually the interface approaches the perforations in the particular well bore. At this point declines rates of 10% to 30% are not uncommon. The total volume of produced FLUID might change little, but the production stream now contains an increasing percentage of formation water. A well originally may be producing 5000 bopd but some time after the water hits the perfs it may still be flowing 5000 bbls of fluid a day but only 2500 bopd since it is now producing a 50% “water cut”. In very efficient water drive reservoirs the well may go from 0% water cut to a 90%+ w/c in just a couple of years.
But even two fields with identical water drive characters, reservoir characteristics and ultimate recoverable reserves may have drastically different FIELD decline rate PROFILES even though the all the wells in both fields have IDENTICAL decline rates. In Field A all the wells have perforations approximately the same height above the oil/water interface. In this situation, the field decline rate would increase very rapidly. In Field B the wells are a different height above the interface and thus individual wells begin the rapid declines in a staggered order. Thus this FIELD’s decline rate would be combination of wells ranging from high decline rates to little or no decline at any one point in time. Field A may enter a decline rate of 35% while Field B may never exceed 10%. Yet the fields are identical except for the locations of the perforations in all the wells.
But there is also a third decline phase in such reservoirs. Once the water cut has reached a high level (75%+) the oil production decline rate will drop to perhaps 1% t0 3% for decades. I work with fields today which were first produced 60 years ago which are still commercial even though 98%+ of the production steam is water. For the last 20 years many have shown decline rates under 2%. And even thought the net oil production is relatively low, many fields have produced the majority of their ultimate recover at water cuts above 70%.
Hang in there if I haven’t sent you into a comma already. This lesson in reservoir engineering is critical to appreciating a POTENTIAL huge underestimate of future maximum global oil production rates the IEA has offered.
Back to Ghawar. This field has not been allowed to develop a natural decline profile thanks to the massive effort by the KSA to inject water into the fields reservoirs (I’m not an expert on this field but I do know it is actually made up of several different “pools” which, though connected, exhibit different flow characters). The water injection program has allowed the high flow rates we’ve seen for decades. It has also greatly increased the ultimate recover of the field. But there is one very critical aspect that this water injection has not changed: the very high decline rate every individual well experiences when the water hits the perfs. In fact, the water injection often results in even higher decline rates then would have been seen under a natural production profile. This is an irrefutable law of petroleum reservoir engineering: at some point in time each well in Ghawar will go into a high decline rate profile. An individual well may jump from a 3% decline to a 30%+ decline in as little as a year. The only technique which can lessen this impact is to reduce that wells total flow rate. Though this would allow an improved ultimate recovery, it obviously reduces the net oil production. Regardless, each well in Ghawar Field, as well as in every other major water drive oil field in the world, will slip into a high decline rate profile. How quickly the ENTIRE Ghawar Field decline rate falls will be a function of how quickly the water interface reaches the various wells in the field. Given the complexity of the multiple pool aspects of the field as well as the very high original oil column, it would be a difficult model if we had all the detailed data the KSA has. And we don’t have it. But that lack of detail doesn’t change the fact that each individual well in Ghawar Filed will enter a high decline rate phase at some point in time. How this fact will affect over all field decline will be a function of how quickly X number of wells reach this point.
Though we can’t verify the fact but let’s assume Ghawar Field is experiencing a decline rate of 3%. This decline rate CANNOT be used to predict the field’s future production rate profile once the water/oil interface begins reaching the perforations in the different wells. It should also be noted that there is a relatively small number of Ghawar for a field its size. This greatly enhances the impact on the FIELD production rate as water reaches more of the wells. But I will repeat myself because it’s that important: there is no such thing as “decline rate” for any water drive oil reservoir in the world. There are at least three distinct decline phases in each field’s life. If one had access to all the data as well as a great deal of man power, one could generate a “production rate profile” for future oil production across the globe. This would require production rate profiles for each major field which would then be combined. But again, there is no such thing as a CONSTANT decline rate which can be applied to today’s rates which would predict future oil production rates at any one point in time. But given the averaging effect we might come close. But that could only be done by generation a complete production profile for each major field over its ENTIRE life. Every water drive reservoir produced be man has generated three unique decline phases: a low initial decline followed by a significantly higher decline followed again by a relatively low decline rate.
I know this is long winded but be patient…here comes a really interesting part. Cantarell Filed in Mexico represents the other major category of reservoir drive mechanisms: pressure depletion, Very simply it’s like shaking up a warm bottle of Coke and popping the cap off quickly. The dissolved CO2 expands quickly and pushes the Coke out of the bottle. Same mechanism in some oil reservoirs: natural gas dissolved in the oil expands when the pressure is reduced when production begins and pushes the oil out of the reservoir. But just like with the Coke bottle the gas escapes quickly and none is left to push the remaining liquid out. Pressure depletion reservoirs typically have low ultimate recoveries…in some case as low as 10%. But there is one very nice aspect of this system. As the field declines the production rate can be plotted on a log-normal graph and typically a very straight line can be drawn to predict the production rate at any future time. To prevent this decline pattern, long ago PEMEX began injecting nitrogen into the TOP of the Cantarell Field to prevent the normal pressure drop. This was done with the largest N2 recovery/injection plant on the globe. As long as the N2 injection volume matches the loss of pressure associated with the oil flow the field would produce at a nearly constant rate…perhaps just a few % decline. This is the opposite of a water drive system which pushes oil up towards the perfs in the wells. Here the N2 forms a gas cap above the oil and pushes the oil DOWN towards the perfs as the gas cap expands. But just as in the water drive reservoirs, eventually the N2/oil interface will begin reaching the perorations in the producing wells. Again, it takes a great deal of detailed data to predict this future production rate profile for the FIELD. But the future production rate profile for each well is very certain: it will be producing 100% oil until the N2/oil interface approaches. At that point the production stream for that WELL may swing from 100% oil to 100% nitrogen in as little as a year. It’s obvious that the interface has begun reaching numerous wells in the last year or so. Last reports from PEMEX I’ve seen indicate a 30%+ FIELD decline rate. But 6 months from today they may be reporting a 5% decline rate. There may be a period of time where the N2/oil interface doesn’t reach any of the remaining wells. But then 18 only from today the interface might reach all the reaming wells over a very short period of time and they could be reporting an 80%+ decline rate at that time. Cantarell Field, though a mega field, represents a small percentage of global production. But it a very critical portion of US refinery source of sweet crude. The decline to date is already impacting our supply chain although that’s been masked somewhat by demand destruction.
Again, I’m not discounting the effort. But consider how very wrong the projection may be should the water level suddenly reach a large number of Ghawar wells in the next few years. This possibility is no more far fetched then if I had made the same statement regarding Cantarell Field 2 years ago. And look where it is today.
Typo? Presumably that s/be overestimate, not underestimate?
I want to make sure I have understood you correctly!
Thank you Dave...sloppy proofing on my part.
Please don't edit TOO carefully!
I particularly liked your idea of sending your readers into a comma, although I had thought that the practise had been brought to a stop!
;-)
Comma:
3. the minute, virtually unheard difference in pitch between two enharmonic tones, as G♯ and A♭.
4. any of several nymphalid butterflies, as Polygonia comma
But in all seriousness, Rockman rocks....
From your link:
This seems very harsh of Rockman, to send his reader's there!
Dave,
Just more proof that I actually am one of those spelling-challeged geologists out here. And a two-fingered typist at that.
Just as well you are a geologist then, not a speleologist, if you can't spel!
Hell...it to me long enough to learn how to spell "geologist". I doubt I could ever master "spincterologist' or whatever that was you said.
Off topic but since we joking around a bit: for those whos still think the oil industry has the gov't wrapped around it's little finger - over the weekend we ran an ROV to check the sea floor in the Gulf of Mexico before spotting a semi-submersible drilling rig. We're in 5000' of water. Turns out the ROV spotted a colony of worm tubes at the location. We had to suspend operations to request an exemption from the gov't. We might have to move a couple of hundred feet...maybe not. Either way we have to wait for the Feds to decide. BTW, it's costing us a little over $900,000 per 24 hours as we wait.
Hell...it's only money. I'll just run out and up the price of gasoline on the sign a ferw pennies.
Without things like worms, there'd be no oil. A little respect for your worm overlords!
If possible, I would have rated 1 003 +!
This goes straight to the core of the matter.
IEA has provided the terms for this discussion by their way of focusing on decline rates.
This allows for extensive "curve fittings" to obtain a desired result.
Decline rates are important, but the physical behaviour of the individual reservoirs/wells is what matters like fractional flow, drive mechanisms etc..
It will of course be an immense task to run through the data of the worlds most important fields, but neglecting the physical characteristics of reservoirs and pureley generalizing decline rates (even IEA does not handle this consistently themselves in their report) suggests that the IEA study leaves more questions open and provides excellent "food" for a more informed debate.
So -IEA uses field decline rates to estimate overall decline rate? Wouldn't overall decline rate incorporate issues like: best-first, receding horizons, lower EROI, 'maximum power', etc. and other fundamental drivers of the general shape of the logistic function? IOW, we really have no ex ante method for doing this globally, at this stage of the game. And given everything else in oil industry (and society) I would bet we err on the downside (higher decline) than upside.
I agree Nate. In fact, depending on what stage an individual field may be, it can be impossible to do even on such a small scale situation. I've done hundreds of reserves studies and the most difficult were those with statistically unpredictable decline profiles. We're left with doing the analysis based on volumetrics. With all the assumptions and errors doing so, little confidence in the numbers develop.
Rockman - I started to prepare a general post on decline and decline rates to accompany this one, but alas my time, like oil, is finite. Thanks for doing the job for me.
Yes the IEA are to be commended for conducting a extensive survey on decline rates, but I agree that it is a great pity they have not done a better job of reporting the results.
More to follow .. I hear wailing in the background ..
IHS data base, reserves and decline
I'm assuming the decline statistics are compiled from annual production data on all the fields in the IHS data base and not on reserves figures.
Physics of decline
I the first instance, most fields will decline via pressure depletion, that's certainly the case in the North Sea. Pressure will then get supported by water injection and then with advance of the water front, the water cut will rise and decline will accelerate.
The next point you make about decline then decreasing is a very good one. The IEA say that there are 70,000 fields in production globally, and many of those I imagine will come into the 98% water cut category where decline rates are likely very low - we are essentially into stripper wells.
One point not discussed by the IEA or else where on this thread is then decommissioning of off shore infrastructure. In the UK North Sea we have seen decommissioning delayed by high prices where companies have kept vast platforms running on 5000 bpd - very mature fields - that now may be decommissioned. This I think will be one of the big differences between onshore and off shore - in the latter case, fields will get shut down as the platforms fall to pieces and water cuts get too high.
The flattening of decline in mature fields is perhaps visible here:
Is it worthwhile / possible?
In order to do any form of global production forecasting it is vital to have some form of handle on the global average decline rate - so I think we gotta try - whilst being aware of all the limitations.
I think a lot of the field specific limitations will come out in the wash if the sample used is large enough and is representative. The IHS / IEA sample is large in terms of the production it represents but is small in field number terms.
And now thinking out loud - they extrapolate to higher decline rates in the 69,200 fields they haven't studied - and following what you say about late field decline rates falling - this may not be valid.
Following your advice now I'm going to take a brief literary paws to go fill my glass:-)
Ghawar
A vast number of the wells on Ghawar have already watered out. The mitigation strategy here is to drive up the road and drill some new wells in areas of dry oil. Closing down wells with high water cut and opening new wells with dry oil allows the Saudis to maintain water cut at about 30%.
But the general points you make are good ones. It is impossible to assign a sensible decline rate to Ghawar owing to:
a) OPEC production quota management
b) the field management strategy described above
One day (very soon?) they will run out of dry oil areas to drill in N Ghawar and decline will suddenly accelerate as shown by this production model:
I think the iEA are quite a long way from getting around to this level of detail - but as you point out it is vitally important. At the moment they are using a production weighted value of 0.3%, which could suddenly jump to 5% any year now. If you find time you shoudl check out these stories on Ghawar:
by Stuart Staniford
The Status of North Ghawar
Further Saudi Arabia Discussions
Water in the Gas Tank
A Nosedive Toward the Desert
Saudi Arabian oil declines 8% in 2006
by Euan Mearns
http://www.theoildrum.com/node/2494
GHAWAR: an estimate of remaining oil reserves and production decline (Part 1 - background and methodology)
Saudi production laid bare
Saudi Arabia and that $1000 bet
by Heading Out
Simple mathematics - The Saudi reserves, GOSPs and water injection
Of Oil Supply trains and a thought on Ain Dar
by Ace
Saudi Arabia's Reserve "Depletion Rates" provide Strong Evidence to Support Total Reserves of 175 Gb with only 65 Gb Remaining
Further Evidence of Saudi Arabia's Oil Production Decline
And also some more recent work by JoulesBurn
Three distinct decline phases
Both CERA and IEA describe three phases of decline but the application of the terminology varies between the two.
I think the IEA have at least tried to go into some of this detail, but to be honest I haven't read it that closely since their overall analysis fell down so badly at the first hurdle.
In Summary
Some of the issues you describe will result in over-estimation and others, under-estimation.
I'd agree that each super giant likely needs its own field specific forecast, but I very much doubt that will ever get done.
I know what you mean Euan. I had to pass on a coffee and potty break to get that out this morning. I know you, the editors, and some others understand the dynamics of reservoir engineering. I didn't want to get so technical but so many folks are hanging on the words of the IEA and other groups. The MSM will never take the time to explain it clearly. I hope the non-technical folks here bear with the discussion. And don't hesitate to ask questions. I've lived and breathed this stuff for 33 years and it's easy to forget the great majority of folks don't even understand our insider lingo.
As a funny example, years ago I was listening to a really smart fellow explaining why he thought the Strat. Petrol. Reserve was a bad idea. He said that eventually many of those millions of barrels of oil buried under ground would rust and the oil would leak out. He really was a smart guy. But we're so use to using barrel as a volume measure I didn’t get his point right away. Like Freud said: sometime a cigar is just a cigar. And some times a barrel is just a metal can.
Since this is far down the comment chain, could the material you just covered above become an article in the very near future? Of course, as this is prime TOD subject matter anyway, it may have been the plan, so I look forward to its top shelf exposure on TOD.
Euan -- the Ghawar base case production model is quit a sight. It obviously shows the sudden ramp up in decline rate I was offering as a possibility. I'll have to wait till lunch to digest the background work in all the links. But bottom line for right now: how accurate do you feel the time line is for the acceleration of decline?
IMO, the most interesting comment made at ASPO-USA was by the IHS guy who casually mentioned that he thought that North Ghawar would be effectively watered out within two years.
BTW, a couple of Woodbine Sand examples. Last number I heard for the East Texas Field was that it was producing about 1.2 mbpd of water, with a 1% oil cut. Regarding a much smaller field, the Bryan (Woodbine) Field, I heard stories of leases that were producing 100% oil on January 1st of a given year, that were producing 99% water on December 31st of the same year (as the rising oil/water contact watered out producing wells in a water drive reservoir).
This is why I don't like average declines we have three distinctive groups of fields those producing at high water cut and those that are not. A similar situation holds with gas injection. And finally we have the fields still producing under natural drive.
Average water cut is like talking about the average ice cover in Wisconsin its a meaningless concept.
If average water cut has no meaning then average decline rates have no meaning.
Average declines has no meaning because a field quickly transitions from low to high water cut and by definition fields with high water cut are eventually taken out of production. And once they hit the high water cut state the decline rate in production slows considerably. Averaging a field producing at a 1% oil cut with a decline rate of 0.1% a year in with one thats not hit water yet tells you nothing.
We make the distinction between conventional and unconventional oil but fail to distinguish this even more important situation which is how many fields are close to reaching water break through ?
And next I've never seen one person add in the fact that infield drilling can't by definition last forever. Everyone continues to assume we can drill new wells in existing fields forever and slow the decline rate.
This was is my point about Ghawar they have been doing infield drilling forever at some point the well density and age of the field results in infield drilling having little effect. It works exactly the same as the dispersive discovery model in field wells are dispersed through the field over time and eventually you can't add any more.
I'd suggest we probably reached peak infield drilling over the last several years to keep us on plateau. This means that going forward the world decline rate will approach the natural decline rate. And for the super giants the infield drilling eventually converts the decline profile to one thats similar to those of smaller fields as the well density climbs to be similar. The fact that the field is large is not relevant its the swept oil volume per well. Once these get close then you no longer have large field dynamics.
Or short term i.e next five year production profile will be based on these concepts minus new production. I suspect that right now we have a lot of fields that are crossing this water cut barrier simply because our production plateau was maintained by aggressively producing our existing fields this has a side effect of synchronizing the declines in a lot of fields.
Outside of the decline of fields producing at high water cut we are also moving a large population of our fields effectively as a group to water breakthrough.
This is group that will determine how our overall oil production changes and its these members of the "fast oil" group that need to be understood along of course with the new fields or fields that just started water or gas injection.
But in my opinion to even begin to understand how oil production will evolve over the short term you have to split the oils fields into these three groups. Once you do you can assess how much oil is being produced above the population of water out fields. These watered out fields actually provide a fairly stable base.
In any case my estimates are about 50% of the worlds production comes from watered out fields about 25% from fairly new fields and about 25% from fields on the verge of rapid decline.
Average decline rates completely miss this potential for a sharp increase in the global decline rate poised by the large population of fields that are themselves nearing the end of their peak production levels.
And finally horizontal wells are esp bad from the synchronization view point they cause the dynamics of different fields to become similar and determined by the ability to drain a thin oil column at about the same rate regardless of the underlying geology. Horizontal well depletion rates become very similar. You do have dispersion in time but it may not overcome they synchronizing effect of using horizontals. And the decline rates of horizontal wells when the water hits are spectacular.
We need to triage our oil supply like I've outlined I've done enough WAG's and back of the envelope projects to become very concerned about or situation.
And last but not least the future of our society totally depends on when we reach the point that oil supply is 4-6mbpd less than demand from that point forward we are in a high priced oil regime no amount of demand destruction can ever result in low oil prices outside of and outright collapse.
And slightly off topic but relevant one of my theories is that oil will approach 200 dollars a barrel when the advanced economies begin competing with each other for oil. This happened this year one thing I did not think about was these economies are tightly interwoven and when they do begin to compete the competition will pop and growth bubbles these economies are trying to accomplish since it simply leads to a spiral of competition.
The US is growing so it needs more oil and more goods from China. China is growing to supply the US so it needs more oil they both compete for oil.
You have a brief respite when this causes unneeded growth to slow but we will soon get back in the spiral. This time for real as its not about growth but about preventing collapse.
Good question, very hard to give an honest answer, but lets say ±5 years. One main uncertainty is the date attributed to the Linux supercluster map - if you've never seen that before then you're in for a surprise / shock. There are also multiple problems associated with our analysis, amongst other things map scaling problems and decisions on recovery factors, Suffice to say that Stuart and I worked independently and reached pretty much the same conclusions.
One of the main things about Ghawar is the vast area of swept reservoir that is not currently being produced. Water handling is everything, 1 mmbpd oil at 90% water cut needs 9 mmbpd water handling - and right now they have more like 1.5 mmbpd water handling on Ghawar.
This comment deserves a guest post in itself.
Thank you
All I can say is: WOW.
Oh great story telling !
thx Mr Rockman, for making difficult stuffs interestingly presented in an easily understandable way for rookies like myself.
And/So obviously if these are possible outfalls for some of the giant fields this IEA report is ....... (fill in the blanks). Furthermore, and as someone upthread mentioned ... where does all them convieniently appearing colored wedges come from? ( Crude Oil "Just in time appearance" ?)
Rockman, thank you for taking the time to post that.
Euan, that 'summary' reminds me of the soothing U.S. corporate media, which keeps Americans in a deep slumber by showering them with so-called 'balanced' language. ;)
Very informative, thanks!
Just a few remarks:
At "As the oil is produced the oil/water interface rises and thus maintains a fairly consistent flow rate." you probably mean consistent --> constant
and
comma --> coma ;-)
"Though we can’t verify the fact but let’s assume Ghawar Field is experiencing a decline rate of 3%."
The WEO 08 has: "The observed post-peak decline rate is, thus, a mere 0.3% per year. Ghawar is still at the plateau phase of production on our definition"
Their definition is: "Plateau production is when annual production is more than 85% of peak production." and "Peak production is the highest level of production recorded over a single year
at a given field."
I think it's far simpler than you're making it out to be. The error is in "so it seems reasonable to expect".
I'd say that the correct way to read their statement is that the decline rate worldwide of those fields that are in decline is in the 6.7% range. Other fields that aren't in decline somewhat offset that.
I disagree.
It's a simple birth-death analogy;
present production x exp((birth rate - death rate) x tyears)=future production
Once born you can only die. That death rate is 6.7%.
The birth rate, 'new production from existing fields' is megaprojects numbers plus some kind of factor for non-megaprojects.
Megaprojects for the last few years has averaged at 3 mbpd additional.
The megaprojects projections for 2008,2009 and 2010 is around 5 mbpd.
A 5mbpd 'birthrate'is about 7% --5mbpd/72mbpd=6.95% so oil production should grow by ~200000 bpd each year initially.
Over half of that increase rate comes from OPEC which has no incentive to increase production under low oil prices.
If the birthrate retreats to 3.5 mbpd/72mbpd or 4.9% then
there will be a net growth of -1.8% per year or initially decline about 1.2 mbpd each year.
In 45 years the world will be at an annual decline of .58 mbpd/yr(29 mbpd total)
The oil industry is dying.
No point in throwing good money after bad.
OTH, ethanol production currently at .7 boepd is curently increasing at 42000 boepd increase/yr(6%).
In 45 years ethanol(14 mboepd-390 billion gallons per year-4 billion tons of biomass) will be increasing at .62 mboepd and the rise in ethanol production will cancel the annual decline in oil.
http://www.marketresearchanalyst.com/2008/01/26/world-ethanol-production...
Look for more ethanol investment around the world.
Another fun 'fact'.
By calculus we 'know' how much oil will be extracted
Int( exp(-.02xt), x=0..infinity)= 50 times the current world annual production rate of 30 billion barrels per year or 1.5 trillion barrels left.
I think Campbell gives 1.2 trillion but silly CERA gives something like 4 trillion.
Now you know.
Oil is FINITE.
Hey!!! Watch it majorian. I have good uses for all that "good money" gone bad.
Sorry... that's a faulty analogy. "Die" isn't the only thing an oil field can do. They generally ramp up production over years and then plateau before beginning to decline. The 6.7% is the rate of decline for those fields that are IN decline. Not all are.
That ignores history and assumes that "OPEC" is a single entity with homogeneous priorities. They had a bear of a time enforcing production discipline the last time this happened. What makes you think it's different this time around?
OPEC is made up of countries that can't produce even their current quota (and would love to restrict production so that those fewer barrels are worth more) and countries that could pump more if they wanted to. When prices were high and everyone could pump all they wanted - that was an easy balance to keep. As prices fall, competing priorities will cause tension. There's no incentive for "opec" (as a fictional unified entity) to pump more... but there could easily be reasons for some nations within OPEC to do so.
Yeah, but the Smarts are probably looking at Biodiesel.
Your Word is Not True. There will be a Rebirth!
The "Bible of World Energy" (Fatih Birol) says:
So do Not worry and let your Mind rest in Peace!
In case that ugly doubts encroach upon you I can tell you:
You cannot understand The Bible. You can only believe in it.
Positive,
And this is where the conversation gets fuzzy. All producing fields are in decline. The decline rate for a new field may be almost zero but it is in decline. But the decline rate for that field will change over time. One of the producing fields may be declining at exactly 6.7%. But no field has ever declined at a constant rate. The hypothetical field I just mentioned may go into a 25% decline rate 2 years from now. If so, how far off would it's projected contribution to global production might this generate? This field might be in a late stage water drive depletion state and the decline rate could drop to 3% in a few years and thus generate an underestimate of its future contribution. There is one constant in the law of petroleum engineering: decline rates for water drive reservoirs are not constant.
This was the point of my long winded discourse above: there is no such thing as an unchanging decline rate in a water drive reservoir. They always change. And such reservoirs make up the majority of the major oil fields in the world. What ever the decline rate at Ghawar field is today, it is an absolute certainty that it will be significantly different at some point in the future. Even if by some fluke the 6.7% decline stated were correct for all the producing fields in the world, the history of all oil production history shows that rate will not stay constant. To predict the production rate of the currently existing oil fields in the world requires a prediction of the changes in decline rates. As I said, if the 6.7% is correct then we know how much oil will be producing from these fields in 12 months or so. But you can't take that rate forward 15 years: it will change.
Something else to ponder: when they say all current fields are declining at rate of 6.7% Does that mean producing CAPABILITY has decline that much in the last 12 months or does that mean the CAPABILITY has declined that since they first started producing? It will be interesting to see how many take the statement one way or the other. It’s also worth considering that historical production levels do not indicate production capability. Oil production rates dropped dramatically in the 80’s do to demand destruction. One can’t take those lower rates as a measure of depletion. Also, at times of high oil prices, operators have techniques that allow them to produce wells above a natural decline rate. During such times you might see little decline and, perhaps, even a growth in production capability. Unfortunately such efforts are relatively short-lived and tend to decrease ultimate recovery. For more then a decade I’ve heard stories from expats working for the KSA that excessive production rates at Ghawar were significantly shortening the field’s life.
I didn’t really want to post that long statement on reservoir engineering. But with few exceptions most statically analysis of historic oil production immediately violates one of the most important assumptions in such analysis: the past profile dictates the future. If this were true then all water drive reservoirs like Ghawar would never deplete: they have little or no decline early in their life. If one were to plot the production from Ghawar for the first 20 years the projected decline would predict many TRILLONS of barrels of future production. Obviously this would be true. The rate changes over time. The only way to predict the future decline rate of such a field is through a volumetric analysis of the reserves. Even if we had this data the analysis is less then perfect and needs to be adjusted over time as the actual production profile is generated.
ROCKMAN,
The past is prolog.
It is not irrelevant.
Peak Oil is a demand based assessment.
This is the problem with resevoir analysis. Reserves based on a pig-in-a-poke is not important in the long run.
If people don't invest because yields are falling can you blame them?
Can you point to an example where less investment has lead to higher production? That would bolster your argument that we can't tell what reserves will be.
It's not rocket science.
The future of oil based on human behavior is ~1.5 trillion tons and human behavior is harder to change than geology.
Sorry majorian...I'm missing your point. Try to use as many one sylable words as possible. I didn't get your "investment" question.
But I do agree about human behavior though. So sad but so true.
A lot of peak oil is about human behavior not geology.
The goal of the energy business is to meet the immediate energy needs of the market. If they can't (if the additional annual production cannot keep up with depletion) then they won't invest because there is NO HOPE(quantity declines).
Take the economist's supply demand chart.
In order to increase supply, which you continually must do because of depletion you must shift the demand curve to the right along the existing supply curve, raising price and quantity.
If your investment reduces
the price per marginal barrel aka shifting to a new supply curve to the right, then the market is happy and you have your profit(PxQ=proft). (Win-win)
If the new oil costs more per marginal barrel actually shifting to a new more costly S-curve to the left. The market knows this is costing them more and so demand retreats along the old supply curve.
Bottom line--if the oil industry cannot reduce its marginal cost per barrel AND it cannot maintain production
so new supplies at least equal depletion, then there will be demand destruction and more rapid decline in production.
You know all this, RIGHT?
I get you now majorian...thanks. And you give the oil patch too much credit. We don't give a damn about "meet(ing) the immediate energy needs of the market." It's all about rate of return and increasing the reserve base y-o-y. It's just conincidence that this approach occasionally helps the market.
I guess that depends on how you define decline (and I suppose "field"). If by "decline" you mean "partial depletion", then that's correct. Every drop you remove reduces the total. But if you mean production... that can't be true. After all, you can't tap the entire field and begin full production on day one.
Of course... but that doesn't mean there is no current rate of decline for currently declining fields.
It isn't as if this hasn't happened before. The rate of decline last year (and many years before) included wells/fields that had turned the corner on rapid decline. You can't go into the debate assuming that they don't know this and include it in their predictions.
And I thought it was (largely) excellent. But how does that bear on the discussion? The question was how they could discuss a 6.7% decline rate and then put up a graph implying a different rate. My answer was simple... they aren't the same rate.
Of course not. But it will be far more homogeneous than individual fields could ever be. Even a monster like Gwahar hitting a bad year wouldn't impact global decline rates that significantly.
Exactly correct. But many here would have in the same scenario. There's a difference between what can be produced and what is produced in a given year.
Rockman - I agree entirely here. How to model decline in fields in build up is conceptually hard. I am really tired and need to sign off - but maybe we can pick this up at a later stage.
Thanks for your input here.
Rockman et al.,
just to make this sure:
It is possible that there will be a more or less regular decline rate as plotted in the WEO IF the periods of rapid decline due to the water level reaching the perforation zones happens at different times all over the world, which compensate individual decline rates (e.g. (2%+2%+10)/3 = 4,7%)).
Of course when many wells reach this level at once this should be noticeable as a sudden drop in global production.
This could also provide an explanation for the manual editing of the global production graph: The OECD governments might not like to see sudden drops of the production of cheap oil, which might lead to turbulences. So they pressed the Don't Panic Gloss button.
To properly assess whether the IEA's projections are anywhere near realistic lets look at each wedge of the master projection in turn.
Wedge one - existing production. This looks relatively likely though there are several problems as has been mentioned which include the fact that decline rates should not be applied to fields in ramp up mode. Also, for supergiants decline rates are not very helpful as one area my be experiencing high decline rates which is offset by ramp up or production in other areas. The use of maximum contact wells will also mean low decline rates followed by catastrophic watering out as feared by Simmons. All in all though a range of 4.5-7 should be expected for the average global decline rate now - this however will accelerate and it doesn't look like this acceleration has been taken into account.
Wedge two - Fields yet to be brought on stream. This is highly suspect, firstly because it assumes that the Middle East reserve numbers are accurate. Secondly, it seems to assume that everyone is going to try and produce their oil as quickly as possible. Why would OPEC max out their offshore production by 2015. Would Brazil max out by 2020?
Wedge three - by far the dodgiest of them all. The IEA obviously could not bring themselves to admit peak so they have come up with a fudge factor like their 2005 development of new discoveries wedge (see resources to reserves report)
The problem however is that they are using USGS numbers for undiscovered and in the report cast doubt on these numbers themselves.
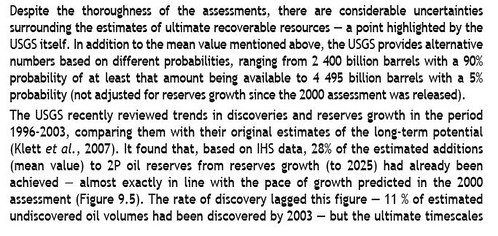
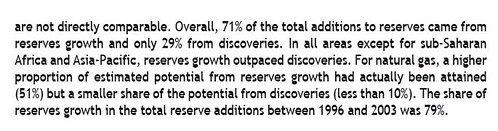
Er... So actually the USGS numbers for undiscovered are out by a factor of more than 3! If so, why have they assumed these numbers to be correct and our saviour from 2018 onwards (considering the very optimistic wedge 2 to be correct).. Fudgorama...
Wedge 4 - EOR. Though not a massive contributor, the only evidence they give that this is going to be a much help is Weyburn.
Those are projections.... They couldn't come up with some actual real data. I'd love to see some real data that gives me hope that the Weyburn projections are realistic (someone must have some for Texas?)
The accompanying text to EOR goes on about reserves growth. But lets face it most of this should have been included in wedges 2&3.
Wedge 5 - Unconventional oil. Once again optimistic, but possible as long as Canada decided not to limit expansion of the tar sands and Venezuela opens up to investment, both of which may not happen.
Wedge 6 - NGLs. This may be reasonable. Then again the growth we've seen recently in NGLs may be the gas caps off all the depleted fields that are coming to the end of their lives.
All in all the IEA could not bring themselves to come up with a realistic projection. The one they have published is a best case scenario if everything goes right and we discover a very unlikely amount of oil. As far as a second report - maybe there is one with the even higher decline rates detailed in the FT leak. Maybe one day we will find out.
That would only be a true statement if you assume that their 2000 prediction was for discoveries through 2003 and that isn't the case. The image you posted clearly says that the prediction is through 2025.
IOW, some of the numbers significantly outperformed their prediction.
No. The undiscovered number is 11% for 8 years of the 30 year prediction period. It should be 27% if it were a linear trend (ie it is out by 2.5 times) however discovery is non-linear - therefore out by more than a factor of 3.
Sorry... that doesn't appear correct. You're comparing a prediction of 2000 to 2025 to results from 96-03. That's not "eight years of the prediction". You also ignore that not only is discovery not "linear", but it isn't random either. They find more when they look more... and prices were much higher after 2003 than in the earlier period.
Simply put, you don't have nearly enough data to make a comparison.
You also seem to be focusing on the "discoveries" when the change in reserves relatively outperformed. It doesn't matter whether a barrel is in a new discovery or in an old one that turns out to be larger than expected. The long and the short of it is that their 2000 prediction gives no reason to claim that they don't know what they're talking about so we can ignore current predictions.
You can be an apologist for the USGS's ridiculously optimistic projections if you please however you still are not correct and I would suggest you go back to the original paper by Klett. They are comparing a prediction from 96-2025 with results from 96-03. If you can't extrapolate a third of the results into a trend then you may as well give up predicting all together. The thing is that if you look at the 30 years before 96 you would see that the discovered oil in 96-03 is actually in line with the previous trends we would expect less than 10 Gb/y. What the USGS predicted was an enormous break from the trend. Now with 22 years left they have to discover more than 500 billion barrels to be correct, about 23 billion a year, we haven't found that much per year since the late 70's.

Furthermore drilling more, ie looking more, does not make much difference.

As you can see, despite increased drilling, production still exceeded discovery in the US.
Ah! The old "you must be a paid shill of the oil industry" ad hominem ... it never gets old.
And it's soooo much more effective when you follow it up with the insistence that I read a report and then demonstrate that you haven't yourself.
If you had done so, you would find that they conclude that the predictions were very accurate to low on reserve growth (the only number that matters) and tell you why discovery numbers came in low. To make it even funnier, their reason is exactly the same one I gave you which caused you to insiste that I read the report. IOW... incredibly low crude oil prices during the time in question restrained exploration expenditures. Reserve growth in existing fields in much cheaper than wildcat exploration.
If your claim had an ounce of substance there would have been a significant increase in discovery in the last four years. In the real world, the discovery is not a function of oil price. Every year that goes by increases the confidence level in the discovery decline pattern established over the last 40 years. Talking about costs, why would any company risk billions on tar sands development if there was all of this yet to be found conventional oil in the ground? Exploration drilling has been going on full tilt in all the promising domains such as the Caspian. The Caspian has turned out to be a dud and no Middle East replacement as was hoped for.
We have run out of real estate to explore. Subsea reserves are confined to continental shelves for fundamental geological reasons and are biased towards natural gas. There will not be any Saudi Arabia replacements discovered in this final frontier for conventional oil on this planet.
There certainly has been an increase, but why would you assume that? The oil companies made clear that they believe that the business is cyclical and they weren't going to make plans assuming $150/bbl++ oil was here to stay. It's really just over the last year or so that many people even assumed they could count on $80/bbl long-term... and it takes much longer than that to see significant results.
I wasn't accusing you of being "a paid shill of the oil industry" but now I have my doubts. I read the Klett report when it came out. Yes the reserve growth numbers are accurate but suffer from the problems mentioned by Memmel below. Wedge three however is entirely dependent on new discoveries - not reserve growth. History has shown time and time again that high prices do not lead to more oil being found...
Please note Rembrant's point below that the IEA have actually ignored the USGS's numbers and only put in 114 billion barrels for undiscovered.
From your image, emphasis added:
"The rate of discovery lagged this figure - 11% of estimated undiscovered oil volumes had been discovered by 2003 - but the ultimate timescales are not directly comparable."
As the timescales are different, and as the P2 increases were a by-2025 projection, that 11% clearly cannot be relative to any by-2025 discovery projection. It appears to be 11% of the total undiscovered amount, not 11% of an amount which was predicted to be discovered within a set timeframe.
No.. It is 11% of the predicted amount from 96-2003 vs 96-2025. For further discussion look here http://www.davidstrahan.com/blog/?p=69
Here is the abstract of the paper: http://aapgbull.geoscienceworld.org/cgi/content/abstract/89/8/1033
The timeframes are comparable..
This study compares the additions to conventional crude oil and natural gas reserves as reported from January 1996 to December 2003 with the estimated undiscovered and reserve-growth volumes assessed in the U.S. Geological Survey World Petroleum Assessment 2000, which used data current through 1995. Approximately 28% of the estimated additions to oil reserves by reserve growth and approximately 11% of the estimated undiscovered oil volumes were realized in the 8 yr since the assessment (27% of the time frame for the assessment)(. Slightly more than half of the estimated additions to gas reserves by reserve growth and approximately 10% of the estimated undiscovered gas volumes were realized. Between 1995 and 2003, growth of oil reserves in previously discovered fields exceeded new-field discoveries as a source of global additions to reserves of conventional oil by a ratio of 3:1. The greatest amount of reserve growth for crude oil occurred in the Middle East and North Africa, whereas the greatest contribution from new-field discoveries occurred in sub-Saharan Africa. The greatest amount of reserve growth for natural gas occurred in the Middle East and North Africa, whereas the greatest contribution from new-field discoveries occurred in the Asia Pacific region. On an energy-equivalent basis, volumes of new gas-field discoveries exceeded new oil-field discoveries.
I'm afraid the IEA are in denial and cannot go public that the USGS are badly wrong.
I've very very suspicious of reserve growth in existing fields.
Mainly because I feel that real depletion rates are woefully underestimated because technical progress has allowed us to maintain production rates. It very easy to assume and increase in URR when you assume a constant depletion rate for new technologies. I.e assume you have increase recovery.
You won't know your wrong till the field reaches its last years of production ROCKMAN's excellent post shows how this works.
Also what Rockman is describing is really a sharp acceleration in depletion rates as a field approaches its decline phase. Thus underlying depletion rates are highly variable generally climbing to a maximum right before field production begins to decline then declining to a low level for water drive reservoirs as they enter the high water cut phase. But of course production rates are quite low at that point.
As and example lets assume you have a field and its depleting at 10% per annum but you make a bogus URR estimate and calculate its depleting at 5% per annum.
The production profile fits both estimates until say year 7 when your bogus estimate prediction about 7 more years of steady production yet the field goes into steep decline.
Incorrect URR and thus depletion estimate are not uncovered for years its a mistake that can set like a waiting time bomb. In my opinion the oil industry has made exactly this mistake and we are just now starting to reach the point where we will begin to understand the magnitude of the error.
Worse as I have said depletion rates are not constant and this makes the mistake even easier its fairly easy to start with the right answer that depletion is 5% per annum and upgrade the extraction technology and incorrectly assume that maintaining production means the depletion rate has not changed but the URR has increased.
Thats the mistake that I believe is widespread and also large.
Slowly increasing production rates and or plateaus in production are signs and signals that the depletion rate is changing and not the URR.
Eventually of course this means we will see sharp drops in production.
In fact the final URR may not be all that far off from the inflated estimate its just that as Rockman mentioned 70% of the remaining oil will be recovered at very low production rates.
I'm more focused on the depletion rates before decline since the final real URR is heavily influenced by cost of extraction using various EOR methods and these low production slow decline fields only cause overall production to have a sort of baseline or long tail production level but its a lot lower than todays production levels and probably not enough to support our economy.
So understand that the estimates can be technically correct its just that they are heavily weighted to a long tail in production which makes them effectively incorrect since they are presented with the implict assumption that the production profile will remain strong. In my example the expectation is 14 years of high production vs 7 with 13 years of production at a much lower level.
Underlying all of this is the simple problem that the last 50% of the oil remaining will be much harder to extract and it will be produced at a production rate much lower than todays. If technology has actually allowed us to increase production past 50% URR then it will be even lower and the drop steeper.
The amount of "fast" oil left that can be produced at high production rates is in my opinion much smaller than most people have estimated and the truth will become obvious over time.
I don't think anyone really knows where we are on the curve because real depletion rates are difficult to obtain but they can result in big mistakes about future production.
I was interested in Peter Wells' estimates for the fall-off in production, as it is the one used by Toyota and is certainly peak oil aware but looks at a rather later peak date than many here think, of 2018 for oil.
This difference of 10 years or so could make a large difference in the ability to adapt, as many technologies such as battery technology and China's nuclear program will have matured, and in addition some aspects of the present financial crisis may have played out.
here is the link:
http://www.evworld.com/article.cfm?storyid=1535
http://www.evworld.com/library/DrPeterWells_PeakOil.pdf
Evaluations would be welcome and very useful.
Well all I can say is Peters work fits into the broad range of outcomes that have been predicted.
Its on the high end but still well within the envelope.
But this highlights the problem production data is not a good estimate for future production if the depletion rates have changed overtime.
The error is in estimates of depletion rates not production rates. The depletion rate error
is closely related to potentially large errors in URR esp URR of oil recoverable at high
production rates.
Nobody not on the oildrum or anyhwere I've seen has presented good information about depletion rates.
With the exception of Simmons and maybe a few others. And what has been presented is disturbing.
Ignoring production rates the overall URR's that have been presented are probably not all that far off
but whats missing is how much of this URR will be recovered in a long tail and how much will be produced close to our current rate.
This uncertainty is what causes people to take similar data and get a large variance in both the timing of peak oil and the shape of the curve.
Small changes in depletion rates can have large effects. Going from 4% to 5% for example cuts production down by 5 years. The field produces for only 20 years instead of 25.
That amount of change is well within the errors of even good estimates of depletion rates and you can see how it can result in a significant shift in time.
Given that depletion rates are probably all over the map from 2% to say 10% or so you have a huge error that gives rise to a lot of the variability in peak oil estimates from different sources.
This high end estimate may be influenced by the input from Toyota.
In common with most of the people who are in a position to do something about things, they have a, to my mind wholly understandable and necessary, bias.
I read it from a guy who was a Lieutenant in the German panzers in the Second World War, and was simply that the most inexpert way of meeting danger is to expect the worst.
The thing is, if this admittedly possible outcome occurs, there is little that can be done to positively influence the outcome.
In that case, it makes sense to assume that events will offer some possibility of a positive input if the correct action is undertaken.
If the person who has assumed the worst is confronted with something less than that, his sense of ineluctable doom is likely to lead to inadequate preparations to cope, and is also perhaps statistically unlikely, as extreme events, such as overwhelming force confronting him, is less likely than a lesser event.
In those circumstances the correct play is to assume that although events may be serious, they are possible to deal with, even though there is a finite chance that they are not.
Around ten years is the minimum time Toyota can make sensible plans to substitute extensively for the use of oil, anything much less and they are in a day-to-day survival mode, doing what they have to do rather than planning what they ought to do.
The present financial collapse puts them close to that situation anyway, but at least they have a clear strategic vision, something sadly lacking in the big 3 in Detroit.
Memmel
Wasn't this article and Rockmans post on 'decline' rate not 'depletion' rates?
Neven
They are directly related a horizontal well six months from being hit with a water front is depleting at 190% per annum. In the sense of being a high flow rate well.
This is the instantaneous depletion rate not the average of the life of the well. The average is anything from 2%-20%.
Its a lot easier to see viewing it from the depletion angle vs production since lets say the horizontal well had flat production for 5 years then declined 90% in the last year as it was hit by water. What really was happening with the instantaneous depletion rate was declining the entire time.
As you start dealing with older fields nearing the end of their life i.e like Rockman described the production rate going forward is heavily influenced by the real depletion rate the field has experienced.
I have never read anything in the oil production literature about a field starting decline as expected every single reference to a field decline I've read says X field began to unexpectedly decline.
This means to me the oil industry does not have a good handle on real depletion rates and further more generally underestimates them by a wide margin. And thus probably does not have a good estimate of final URR. Understand I make the distinction between producing a field at low water cut vs high water cut. Production from fields with high water cut is at a low depletion rate but low production rate.
For water driven fields the reason is simple how and where the water front moves is very complex and it changes over time. Its something you can watch but not predict. Given that fractures cause most of the problems and they are hard to detect its a hard problem. Recovery rates etc are hard to determine.
Now with that said I don't agree with the concept that large fields decline slower than small fields. By this I mean the same extraction technology is used in both large and small fields for the most part. The extraction rates per well are about the same and the well spacings are about the same. The difference between declines in small fields vs large fields is simply because they are smaller and thus deplete faster and reach their decline period faster leading to a distortion in the production decline rates.
Look at Rockmans post it applies regardless of the field size the only difference is simply in the larger fields you have more oil to extract and they where developed slower. However eventually they reach the same extraction and thus final depletion rates we see in smaller fields.
Thus once the large fields are fully developed the decline exactly the same as the small fields.
It just the development phase is much slower over decades vs years.
The fact it took you thirty years to get the well density to remaining oil column to match that which can be achieved in a small field in a few years does not change the final decline profile.
Look at Cantrell its decline just like any other gas injection field. Ghawar will exhibit the same decline profile as any other carbonate water drive reservoir with the small exception of the the use of peripheral water drive which is uncommon. If anything this approach will make its collapse faster.
So translating Rockmans production view to instantaneous depletion rates makes it clear what the real problem is. And also why its so hard to get good numbers for.
Let me give and example of the problem.
Lets say a field is developed initially with horizontal wells and has a average depletion rate of 5%
then as water become a problem its redeveloped with horizontal wells and the average depletion rate climbs to 20% during this entire time the production rate remains constant.
Using horizontal technology the field would have lasted about 15 years at a high but slowly declining production rate and lets say 10 years as stripper wells starting say year 18.
With the redevelopment at say year 7 it only lasts another 5 years or 12 years then strait to stripper well. You lost 3 years of slow decline.
Now lets say this field is a lot bigger and its name is Ghawar. If you had kept extraction rate constant the field would have lasted say 150 years. However by going with technologies that keep production up you shave decades off the life of the field. You effectively convert a super giant field into one having the same decline profiles as much smaller fields since you achieve the same well density to remaining oil column.
In both cases because you have kept production rate up you decide that depletion rates have not changed thus you have magically increased URR.
Given the data its almost impossible to know for sure whats happened in my small field example we find out after five years that oops you just extracted faster and increased the depletion rate.
Rockmans post did not go into changing technologies to maintain production rate per se but you can see that in field drilling water front movements etc all influence depletion rates while production rates don't change a whole lot. Its only after decline of the field is well established that you get a good handle on what the real depletion rate was as the field enters stripper well status.
Hopefully looking at it as instantaneous depletion rate at a per well level makes it clearer.
It does for me and this is what determines future overall field production rates.
This problem extends from the well level all the way through the industry. Its easy to understand production rate of a water driven field thats not reached 90% water cut. Its easy to understand production in a field thats at 90% water cut. Its almost impossible to determine the production profile and time when a field moves from not producing any water to becoming a high water cut field.
This was the the focus of Rockmans post and its spot on.
The implication is that URR estimates especially reserve additions to mature fields are incredibly suspect because of the very nature of oil extraction. Even more suspect is the actual production profile and timing of decline.
We have bet the world on a bunch of old fields which we know we are extracting at a faster and faster rate with technical advances and which we know we cannot easily predict the timing or steepness of decline.
We do know that smaller fields developed with exactly the same technology are showing surprisingly steep declines.
Well surprising to some people but not me.
Actually in the oil patch, despite what you might read in a reservoir engineering book, we don't have much use for the concept of a field "decline rate" or "depletion rate". Since all economic analysis adjusts for the time factor we use a production profile over time in our models. Field A produces so much oil/month as a continuous curve through out the field's remaining life. Thus two fields with the same URR and the same number of productive years can have significantly different "net present value". This is why the rapid declines but rapid payouts of the Deep Water plays are attractive: long lived reserve life is grossly undervalued by the process.
It's the rate of return...always has been...always will be.
In a country like the UK, understanding basin decline rates has been fundamentally important. The DTI / BERR / DECC have consistently overestimated production based on returns provided by the oil cos. This has now been converted to £ billions shortfall in the national accounts.
So what you say is telling. Companies and individuals working in the microcosm of wells and fields often fail to see the big picture - especially when the price is high. Its been hard telling folks in Aberdeen that the oil industry here is in terminal decline. The politicians are only just beginning to get it though they have not yet worked out the link between importing energy and the plunging £.
Memmel, you write
Are you sure?
If this is so: Are the geologists and reserve engineers also surprised? (If they are then this must be very different from comparable cases of oil and water transport in near-surface hydrogeology, where such processes in most cases can be predicted very well.)
Or is this rather a problem of "information transfer"? This sounds as if in the oil industry all geological and reserve engineering information is under strict embargo and the technical experts are locked away from the management and only allowed to speak if it is unavoidable.
Or the third possibility is that in fact no one is surprised, but geology is only used as an excuse. Just like one of these megabuilding projects, which "surprisingly" turn out to cost double the amount than anticipated, and with a stunning regularity "unexpected geological problems" are blamed for it.
Great post memmel. I particularly like the "fast oil" phrase you've coined. We actually don't have a comparable term in the oil patch that I recall. We just talk about the higher production rates "before the water hits". I think we should use the fast oil terminology. It's a good short hand and instinctively descriptive. You should apply for your copyright ASAP
You appear to be confused about what the USGS is predicting. They are not predicting that X number of barrels will be found by 2025; they are predicting that X number of barrels are currently undiscovered.
See the assessment for yourself if you're not willing to take my word for it, in particular the chapter AM on their methodology for estimating undiscovered oil:
"Undiscovered resources are those resources postulated from geologic knowledge and theory to exist outside of known fields....Note that [this estimate] does not attempt to predict volumes of conventional resources that will actually be discovered in a given assessment time frame."
Emphasis mine. The timescales are, as the IEA said, different.
You are in no position to be chastizing the IEA, considering that the USGS assessment says exactly the opposite of what you were claiming it said.
You are demonstrably allowing your beliefs to blind you to facts (namely, what the USGS assessment is actually talking about), which makes one wonder what other beliefs might be crowding out facts. This might be a good time to develop a habit of digging down to and citing the original sources when making arguments.
@Aceditor
Thanks for this insightful comment. Have you looked at how the reserve/resources analysis is tied in to the production analysis? As far as I can analyse it at this point the USGS study this time is only used as a theoretical basis to make the outlook look more positive, it is not used in the production analysis at all. I base this judgement on the following statement (page 259, page 66 of the pdf):
"Conventional oil production from yet-to-be found fields is projected to reach 19 mb/d in 2030, based upon the projected discovery of 114 billion barrels worldwide over the projection period."
The 114 billion barrels are a far cry from the 939 billion barrels the USGS wrote down in their 2000 study.
Yes, I take back my comment about the IEA. They have only put 114 billion barrels into the yet to be discovered, with about 50 billion of these being produced in the time 2010-2030.. Well spotted!!! The USGS wrote down 649 billion of conventional crude to be discovered by 2025.
The question we have to ask now is how realistic is 50 billion to be produced by then? For that to occur, if we assumed then it took eight years to bring each discovery on stream and a Hubbert production distribution, then we would need to find 100 billion by 2022! That's 7.1 billion barrels a year.. That is a possibility.
Looking at the report. If we really are not going to peak by 2030, then we have to go all out producing the fields already in production such that their production has dropped by 70%, we have to go all out to produce the fields that have already been discovered but not produced such that they peak in around 12 years time (they seem to show a low post peak decline rate for some reason) and we need to ramp exploration (mostly in OPEC and Brazil/GOM) and try and bring that all on stream as quickly as possible. There won't be much left in 2030 if we do all that - will OPEC do it and go back to being bedouin soon after 2030?
Correct me if I'm wrong, but Wedge 3 "yet to find" I take to be the supply gap, back calulacated from projected demand. Otherwise, "yet to find" oil would decrease with time.
aceditor,
I can offer that the scale of production rate improvement at Weyburn Field may be realistic. I’m not familiar with this field’s specifics but looking at the production curve it may be a combination water-drive with some pressure depletion support. Water flooding fields is old technology. Most big west Texas fields have been on water injection for over 40 years. Gas injection, such as N2 or Co2, has been around a while too. Again, I can only make a generalization, but re-pressuring a reservoir can generate flow rates comparable to its initial high rate in the best of circumstances. These projects are very cost sensitive. Injection is a costly process. Also, the injected gas has to be purchased or generated on site. Both costly. But the pay off can be huge especially in re-establishing high flow rates.
But I would caution accepting any across the board estimate of how much production could any secondary recovery method yield from older fields in the future. If an old field is a candidate for such an effort today it was probably so many years ago and the process had begun back then. But for technical reasons to complex to go into here, not all reservoirs lend themselves to secondary recovery regardless of oil prices. I’ve seen many secondary recovery efforts fail both mechanically as well as economically. It is very dangerous (and likely incorrect) to assume that very many older fields which haven’t undergone secondary recovery efforts will actually respond very positively by future efforts. There has been a large and active segment of the oil patch that has sought out and bought such opportunities for at least the last 30 years. If there is an old field with a few hundred millions bbls of residual left in it and no one is conducting secondary recovery operations in it today there’s a good reason: it probably doesn’t work well in that particular field. And it probably wouldn’t work well at $150/bbl and definitely will fail at $50/bbl.
I would love to see some production graphs of CO2 injection and recovery rates. If they really are that good then why have they used projections and not facts... What are the types of field and their production histories that work and don't work.. Any further references would be appreciated.
aceditor,
To answer your question I can only offer some generalizations. I have access to a data base with such graphs but it’s copy write protected and can’t share. If you Google “pressure depletion oil production” you’ll probably turn up some interesting published data.
The most likely reason they use projections is two fold. First, the injection efforts haven’t begun yet. How effective would such an effort be? Depends on the physical character of the rock: porosity but more importantly how it’s distributed. Many reservoirs have very irregular porosity distributions. This is especially true in carbonate reservoirs like the Arab D. In those cases the CO2 can “channel” very quickly from the injector well to the producer and thus bypass much of the oil. This is also common problem in water injection programs. Another problem is “over topping”. If the structure is very peaked then the gas accumulates nicely at the top and effectively pushes the oil down to the producers. The same is true for water floods where the injected water pushes the oil equally well up towards the producers. But if the structure is relatively flat the injected fluid (gas or water) will slip more directly towards the producers. This is aided by the fact that production techniques often generate low pressure areas around the producing wells. This will also cause the injected fluid to preferentially move towards the producers and bypass much of the oil. I have heard stories that such pressure “sinks” generated by excessive production rates have impacted both Ghawar and Cantarell Fields.
Secondly, even in effective injection programs the pressure maintenance takes away one of the most accurate reserve predicting tools: pressure decline curve projection. In most pressure depletion reservoirs you can plot the decline curve on a log-normal and generate an almost perfect straight line. You can thus easily integrate the area under the curve to generate ultimate recovery. But if you inject gas into the reservoir you loose this relationship. At this point you have to estimate recovery via a combination of volumetrics and some very tricky assumptions. Even reasonable variations in these assumptions can result in 50%+/- results. This is also true in water injection projects but to a lesser extent. But in either case you're left with the most inaccurate method of projecting production rates and ultimate recovery: volumetrics.
I don’t want to appear to be just bashing the IEA report for the fun of it. Their goal, though laudable, was unobtainable to a significant degree of accuracy for the start IMHO. I’ve watched very skilled and unbiased tech staffs argue tooth and nail over similar analysis for a single small field in which they had every bit of the critical data needed. The only aspects that lends any sense of credibility to the report is that the large number of fields utilized might provide a good average: the numbers for each field is wrong but miss equally both high an low. A very dangerous assumption for sure given a potential bias to achieve a predetermined answer.
For what it is worth, this is what the ASPO-USA analysis of the IEA report says on decline rates. The report came out this morning.
Clarification: While this was published in today's ASPO-USA newsletter, there are italics saying
(Note: Commentaries do not necessarily represent ASPO-USA’s positions; they are personal statements and observations by informed commentators.)
There is now an ASPO-USA press release out. It is more general, without many detail. It starts out:
International Energy Agency Acknowledges “Patently Unsustainable” Trends in Global Energy Supply and Consumption
World Energy Outlook 2008 report details significant challenges in petroleum production, agreeing with ASPO-USA’s long-held position
Gail, those who wrote this need to read and understand the CERA and the IEA reports carefully - assuming they are referring to CERA here. They would then see that the two organisations have reached what appear to be virtually identical conclusions founded on more or less the same data sets.
Great post Gail but it only makes me hunger for more detail. For instance, the decline rates stated: how is decline in production capability distinguished from production curtailed by demand destruction. Even today, if OPEC cuts production what number will we compare production of a year ago? If the KSA produces 10% less oil in 2009 should we take it to mean their production capability declined 10%? Of course not. In my 33 years I’ve rarely seen an operator reduce production rates below the maximum sustainable even in low pricing periods. In the case of Ghawar Field, if the KSA were to reduce pumping for a year or so and then quickly went back to a maximum sustainable rate, they would likely show an increase in production capability over the last period of max sustained rate. This commonly happens in water drive reservoirs that are shut in for a while. You get a bump up in natural rate. Sort of a “catch up” phenomenon. It won’t last for long but if you time your measurements right you can rightly say the field has stopped declining and actually showed an increase in delivery ability. It’s just one of several ways in the oil patch to support a misrepresentation with truthful facts.
When Matt Simmons spoke at the ASPO-USA meeting in Sacramento in September, he mentioned that a few months before, he had performed a spot poll at a Baker Hughes' meeting. He asked a room of about 120 or so of their top field managers from around the world what their decline rates were? If I remember properly (fee free to correct me here) he used less than 4%, 4-6% and 6-8%. He said none of the hands went up for 4% and under, 20-30% for 4-6%%, and about 60% voted for 6-8%, with the rest being above 8%. Obviously, there’s a bias due to their field portfolio, but he felt it was telling that no one raised their hand for <= 4%.
Matt’s pointed out many times that only 5% of the proven reserves and production data has been audited, so if CERA, IEA and EIA were actually using scientific data analysis, the error values on all of their graphs would be larger in both magnitude (oil volume or y-axis) and timing (date or x-axis) than the differences that we are discussing: 87 MBD vs. 100+ MBD for production and 2005 vs. 2030 plus for peak oil. To give an example of how the devil is in the details that no one may be able to see, the MMS uses an average UTRR rate of 60% for the 120 billion barrels they estimate can be recovered from the U.S. outer continental shelf. This is probably high by a factor of 2. I also question the IEA's new production capital cost gestimates. EIA’s data showed both on and off shore production costs have been rising faster than IEA’s model. They also ignored Resource Nationalism, which will come into play as exporting countries production approaches their internal consumption.
An interesting counter point to the IEA report was Peter Well’s presentation also at the ASPO-USA Sacramento meeting. He purchased the IHS data for about $100k and augmented it with proprietary data from KSA. He felt that peak crude would occur in 2018 with crude + condensates in 2020. I would put far more stock in his work because they actually checked their predictive models against existing depleted fields (~95% match) and showed the uncertainty in their future projections.
Setting aside for the moment exactly how they got this data and drew it up, some interesting questions arise from the graph,
- Fields "yet to be developed" ignores the basic principles of net energy gain. Our total Mbbl/day may go up, but the actual oil available for things other than fossil fuel extraction may decline. Many of those "yet to be developed" fields are undeveloped for this very reason.
- Fields "yet to be found" is nothing but a statement of faith, it's pure speculation.
- existing fields "additional EOR" also seems like a statement of faith - we'd have to see the full report to know for sure, but I get a whiff of Science! in there, the distant sound of "new technology will give us additional recover -" which is just prayer.
These three are important, because together they make up for the decline in existing fields' production, and give us a slightly rising or at least plateaued oil production to 2030. Take them out, and we have a halving of oil production by 2030.
- "Non-conventional oil" at first glance seems like a fair projection, but we'd again have to address the question of net energy. What would more tar sands or shale oil do to our natural gas peak dates?
I assume that some of their "non-conventional oil" will include coal to liquids - what will that do to our coal peak dates?
- "Natural gas liquids" - again, we'd have to see the full report, but surely a doubling of NGL requires a doubling of NG?
These last two are important because even if possible, in putting off peak oil they bring our natural gas and coal peaks closer. So that instead of three small crises we end up with one huge one. Which is perhaps not ideal.
So of their five sources of oil apart from plain old conventional crude, the five they rely on to not only avoid a peak but give an increase, it appears that three of them are simply statements of faith, and the other two while effective at putting off peak oil will also bring peak gas and coal closer.
A combination of blind faith and foolishness. Perhaps a realistic scenario, but not a pleasant one.
To be fair to them it goes without saying that some new fields are going to be discovered and developed and that EOR is going to be a factor. I don't think that's blind faith. The issue to be resolved in policy terms should be whether the rates they predict for that are reasonable based on trends over the last couple of decades or whether they are using it as a fudge factor in a wildly optimistic manner to get the politically required prediction (at least for public consumption) of continuing growth.
I agree Scot. Future field development will be greatly aided by new drilling, completion and production management protocols. My concern isn't with how effectively we’ll deplete those new discoveries but how much new oil we’ll find. I review exploratory projects for a living and have repeated seen targets missed entirely. And this is with millions of $’s of prospect specific data and thousand of very smart man hours behind the project. There will always be one more spot to drill a wild cat but all the major plays are known and the great majority have been exploited for decades. Any new significant reserves to be found will likely be in new plays such as the recent Deep Water Brazil pre-salt play. I’ve seen the seismic data across the play and it couldn’t be simpler. The success rate testifies to that fact: 16 exploratory wells have been drilled to data and all found oil. The reason such a simple play wasn’t developed earlier is the water depth. Even today it’s right at the limit of our technology. Even with all the detailed data available it’s very difficult to estimate how much oil will be proven in the next 20 years. More importantly, when will this new oil reach the market in any meaningful volume? Even before the latest oil price collapse and credit meltdown the economics of the pre-salt looked less then solid.
Any prediction of significant new oil reserve will depend on finding new plays…not just fields. And there are probably a few left out there. But they’ll be unique and surprising events and, as such, defy predicting the timing of such discoveries with any great certainty. I’m still digging into the report to understand their methodology for estimating the “unknown”.
The IEA's report would be cognitively much improved by adding explicit sensitivity analysis on all assumptions.
Of course, that would also mean that not a lot of conclusive points can be made, and that the IEA could not express their 'message'.
The IEA graph shows that this organization is not interested in facts. It is claiming that 45 million barrels per day will be produced in 2030 from existing undeveloped and newly discovered. As noted on numerous occasions above this is a contrivance to keep the world production of conventional oil flat for the next 22 years. Do they seriously expect people to believe that there is 2/3 of OPEC production sitting in reserve around the globe? They obviously believe Saudi claims about 12 million barrels per day of production capacity and apply it to the rest of the producers. Only the Saudis make such claims, so the IEA has no basis to extrapolate in such a stupid manner even if the Saudi claims are true.
Given the decline in discovery, which is statistically significant and not some transient induced by oil prices or above ground factors, the light blue zone is what the yet to be found production should look like and not like the rapidly expanding red zone. Since there is no evidence that the reserve production capacity is anywhere as large as claimed by the Saudis, the light blue zone should be much thinner.
The natural gas liquids zone is also a contrivance since it is monotonically increasing when in the real world all the major gas basins are not growing and many are in decline (North America and the North Sea for example, Russian gas will be in decline by 2020). Total oil and liquids production in 2030 will not be 100 but probably less than 70 million barrels per day in 2030 assuming no catastrophic declines occur such as Saudi fields going the way of Yemen's Yibal.
I agree. Given the quality of the 'business as usual' scenarios and projections, it is a pity that the IEA is such an influential organization.
I would probably get fired if I wrote a report like this. Yet the IEA keeps getting away with it. Perhaps I should go work for the IEA. I could be as presumptious as I would like and still keep my job!
The nominal/real price graph on page 69 of the WEO 2008 shows an unrealistic real price of 75 real dollars for the 1980 peak. If you look at the the same data series from of the BP Statistical Review of World Energy 2008 you see a price of 93 real US$.
Any idea for that change?
Ciao
Shortly after the great tsunami hit, I was reading Gibbon’s “Decline and Fall . . . ” and I came upon a wonderful description of a similar event in antiquity. Whilst on the plane back from Berlin today I had a similar experience whilst reading Tacitus’ “The Annals of Imperial Rome” A wonderful description of a credit crunch, complete with property slump and government bail-out. From the reign of Tiberius:
Then Tiberius came to the rescue. He distributed a hundred million sesterces among specially established banks, for interest-free three year state loans, against security of double the value in landed property. Credit was thus restored; and gradually private lenders, too, reappeared. However, land transactions failed to adhere to the provisions of the senatorial decree. As usual, the beginning was strict, the sequel slack.
http://rustle.blogsome.com/2008/11/18/credit-crunch-in-ancient-rome-3/
Any explanation of political collapse carries lessons not just for the study of ancient societies, but for the members of all complex societies in both the present and future. Dr Tainter describes nearly two dozen cases of collapse and reviews more than 2000 years of explanations. He then develops a new and far-reaching theory that accounts for collapse among diverse kinds of societies, evaluating his model and clarifying the processes of disintegration by detailed studies of the Roman, Mayan and Chacoan collapses.
http://www.adlibris.com/se/product.aspx?isbn=052138673X
Joseph A. Tainter (December 8, 1949) is a U.S. anthropologist and historian. He studied anthropology at the University of California and Northwestern University, where he received his Ph.D. in 1975. He currently is the Head of the Department of Environment and Society at Utah State University. His previous positions include Project Leader of Cultural Heritage Research, Rocky Mountain Forest and Range Experiment Station, Albuquerque, New Mexico and professor of anthropology at the University of New Mexico. Dr. Tainter is also the author or editor of many articles and monographs. His best-known work is The Collapse of Complex Societies. This 1988 book examines the collapse of Maya and Chacoan civilizations, and the Roman Empire, in terms of network theory, energy economics and complexity theory. Tainter argues that societies collapse when their investments in social complexity reach a point of diminishing marginal returns.
According to Tainter, societies become more complex as they try to solve problems. Social complexity can include differentiated social and economic roles, reliance on symbolic and abstract communication, and the existence of a class of information producers and analysts who are not involved in primary resource production. Such complexity requires a substantial "energy" subsidy (meaning resources, or other forms of wealth). When a society confronts a "problem," such as a shortage of or difficulty in gaining access to energy, it tends to create new layers of bureaucracy, infrastructure, or social class to address the challenge.
For example, as Roman agricultural output slowly declined and population increased, per-capita energy availability dropped. The Romans "solved" this problem by conquering their neighbours to appropriate their energy surpluses (metals, grain, slaves, etc). However, as the Empire grew, the cost of maintaining communications, garrisons, civil government, etc. grew with it. Eventually, this cost grew so great that any new challenges such as invasions and crop failures could not be solved by the acquisition of more territory. At that point, the empire fragmented into smaller units.
We often assume that the collapse of the Roman Empire was a catastrophe for everyone involved. Tainter points out that it can be seen as a very rational preference of individuals at the time, many of whom were actually better off (all but the elite, presumably). Archeological evidence from human bones indicates that average nutrition actually improved after the collapse in many parts of the former Roman Empire. Average individuals may have benefited because they no longer had to invest in the burdensome complexity of empire.
In Tainter's view, while invasions, crop failures, disease or environmental degradation may be the apparent causes of societal collapse, the ultimate cause is diminishing returns on investments in social complexity (in contrast, Jared Diamond's 2004 book, Collapse: How Societies Choose to Fail or Succeed, focuses on environmental mismanagement as a cause of collapse). Finally, Tainter musters modern statistics to show that marginal returns on investments in energy, education and technological innovation are diminishing today. The globalised modern world is subject to many of the same stresses that brought older societies to ruin.
However, Tainter is not entirely apocalyptic: "When some new input to an economic system is brought on line, whether a technical innovation or an energy subsidy, it will often have the potential at least temporarily to raise marginal productivity" (p. 124). Thus, barring continual conquest of your neighbors (which is always subject to diminishing returns), innovation that increases productivity is -- in the long run -- the only way out of the dismal science dilemma of declining marginal returns on added investments in complexity.
http://en.wikipedia.org/wiki/Joseph_Tainter
Tacitus is always good for a laugh because humans never change.
The following entertaining vignette reminds me of those politicans and JoeSixPacks dreaming of gigabarrels of oil and trillions of cubic feet of gas in the USA.
Annals--Book XVI
Fortune soon afterwards made a dupe of Nero through his own credulity and the promises of Caesellius Bassus, a Carthaginian by birth and a man of a crazed imagination, who wrested a vision seen in the slumber of night into a confident expectation. He sailed to Rome, and having purchased admission to the emperor, he explained how he had discovered on his land a cave of immense depth, which contained a vast quantity of gold, not in the form of coin, but in the shapeless and ponderous masses of ancient days. In fact, he said, ingots of great weight lay there, with bars standing near them in another part of the cave, a treasure hidden for so many ages to increase the wealth of the present. Phoenician Dido, as he sought to show by inference, after fleeing from Tyre and founding Carthage, had concealed these riches in the fear that a new people might be demoralised by a superabundance of money, or that the Numidian kings, already for other reasons hostile, might by lust of gold be provoked to war.
Nero upon this, without sufficiently examining the credibility of the author of the story, or of the matter itself, or sending persons through whom he might ascertain whether the intelligence was true, himself actually encouraged the report and despatched men to bring the spoil, as if it were already acquired. They had [ships] assigned them and crews specially selected to promote speed. Nothing else at the time was the subject of the credulous gossip of the people, and of the very different conversation of thinking persons. It happened, too, that the quinquennial games were being celebrated for the second time, and the orators took from this same incident their chief materials for eulogies on the emperor. "Not only," they said, "were there the usual harvests, and the gold of the mine with its alloy, but the earth now teemed with a new abundance, and wealth was thrust on them by the bounty of the gods." These and other servile flatteries they invented, with consummate eloquence and equal sycophancy, confidently counting on the facility of his belief.
Extravagance meanwhile increased, on the strength of a chimerical hope, and ancient wealth was wasted, as apparently the emperor had lighted on treasures he might squander for many a year. He even gave away profusely from this source, and the expectation of riches was one of the causes of the poverty of the State. Bassus indeed dug up his land and extensive plains in the neighbourhood, while he persisted that this or that was the place of the promised cave, and was followed not only by our soldiers but by the rustic population who were engaged to execute the work, till at last he threw off his infatuation, and expressing wonder that his dreams had never before been false, and that now for the first time he had been deluded, he escaped disgrace and danger by a voluntary death. Some have said that he was imprisoned and soon released, his property having been taken from him as a substitute for the royal treasure.
Good one. marjoram!
Paulson's $500 million should help a little, although my vote is for the arena.