| Making the case for wind, again | The Oil Drum: Europe | The Permanent Oil Crisis Conference in Amsterdam, January 21 & 22, 2009 |
Oilwatch Monthly - October 2008
Posted by Rembrandt on October 23, 2008 - 9:50am in The Oil Drum: Europe
The October 2008 edition of Oilwatch Monthly can be downloaded at this weblink (PDF, 1.42 MB, 24 pp).
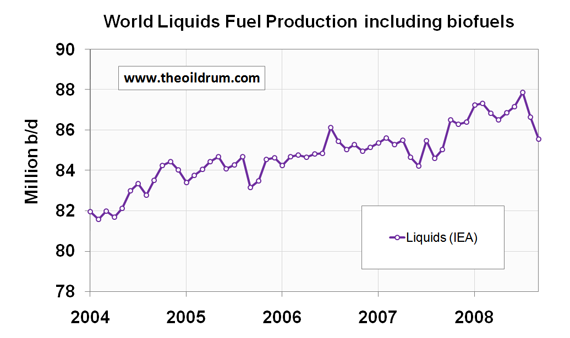
Figure 1 - World Liquids production from January 2004 to September 2008.
A summary and latest graphics below the fold.
Latest Developments:
1) Conventional crude production - Latest available figures from the Energy Information Administration (EIA) show that crude oil production including lease condensates increased by 840,000 b/d from June to July, resulting in a new historical total world crude oil production record of 75.10 million b/d.
2) Total liquids production - In September world production of total liquids decreased by 1.09 million barrels per day from August according to the latest figures of the International Energy Agency (IEA), resulting in total world liquids production of 85.56 million b/d. Average global production in 2007 was 85.41 million b/d according to the IEA. In 2008 an average of 86.89 million b/d has been produced from January to September. The US Energy Information Administration (EIA) in their International Petroleum Monthly puts average global 2007 production at 84.41 million b/d and average production in the first seven months of 2008 at 85.77 million b/d.
3) OECD liquids demand - OECD consumption in August 2008 was 45.85 million b/d, which compared to August 2008 is 1.71 million b/d lower. Average consumption in the first eight months of 2008 was 46.45 million b/d, which is 1.02 million b/d lower then consumption in the same period in 2007. The decline is mainly a result of a decrease in oil consumption in the United States. Consumption is 876,000 b/d lower on average in the US from January to August 2008 then in the same period last year. In comparison, Mexican and Canadian consumption are almost flat relative to 2007 consumption.
A selection of charts from this edition:
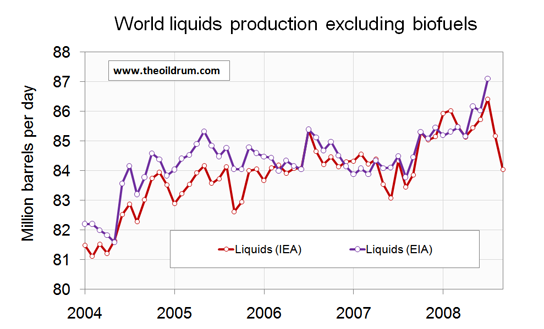
Figure 2 - World Liquids production excluding biofuels from January 2004 to September 2008.
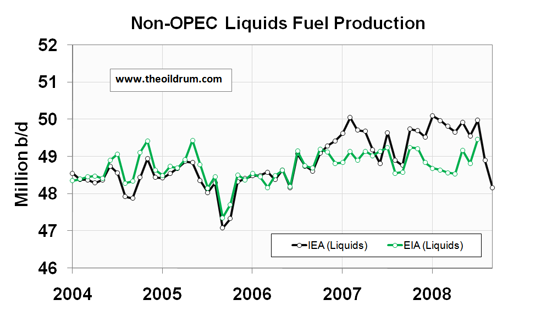
Figure 3 - Non-OPEC liquids production from January 2004 to September 2008.
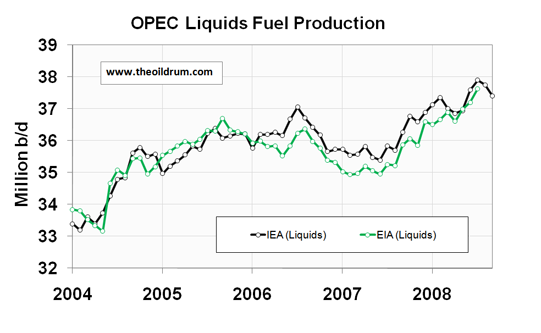
Figure 4 - OPEC liquids production from January 2004 to September 2008.
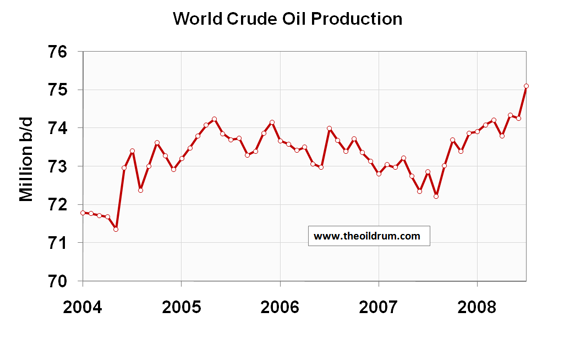
Figure 5 - World crude oil production from January 2004 to July 2008.
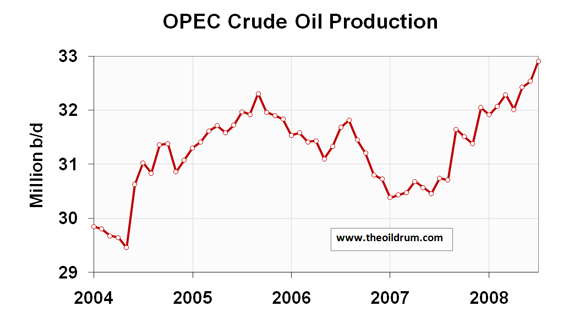
Figure 6 - OPEC crude oil production from January 2004 to July 2008.
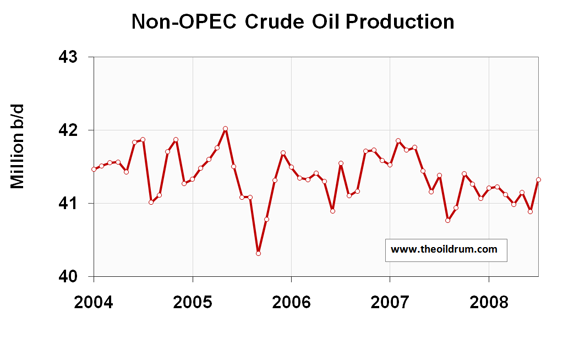
Figure 7 - Non-OPEC crude oil production from January 2004 to July 2008.
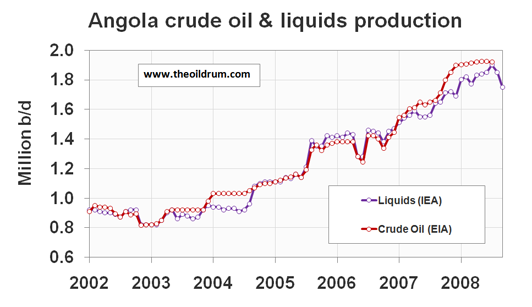
Figure 8 - Angola liquids & crude oil production from January 2002 to September 2008.
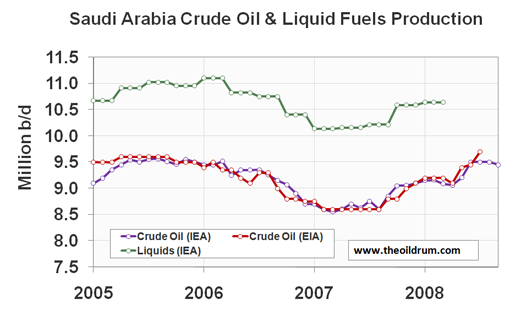
Figure 9 - Saudi Arabia crude oil & liquids production from January 2005 to September 2008.
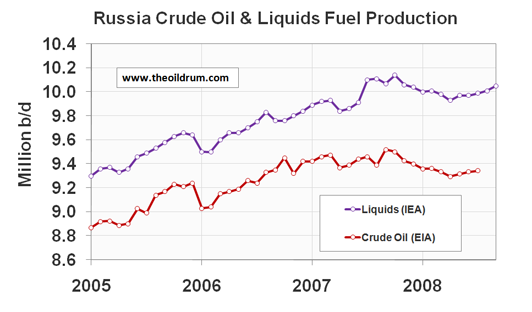
Figure 10 - Russia crude oil & liquids production from January 2005 to September 2008.
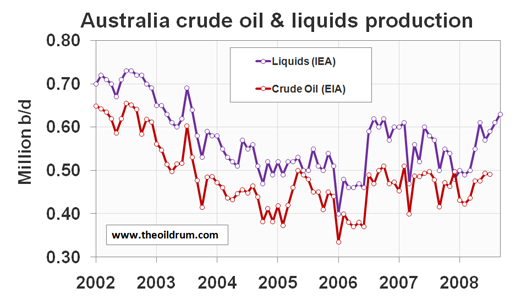
Figure 11 - Australia crude oil & liquids production from January 2002 to September 2008.
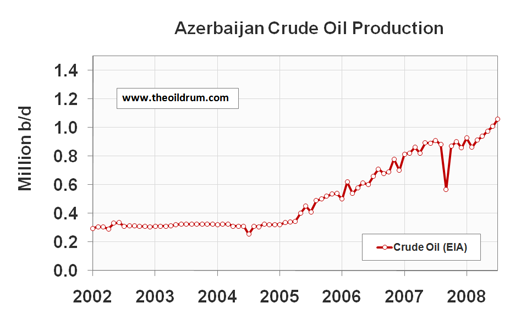
Figure 12 - Azerbaijan crude oil production from January 2002 to July 2008.
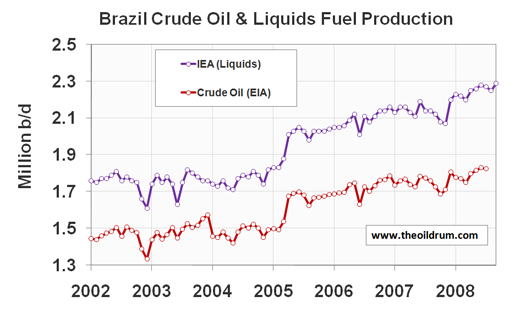
Figure 13 - Brazil crude oil & liquids production from January 2002 to September 2008.
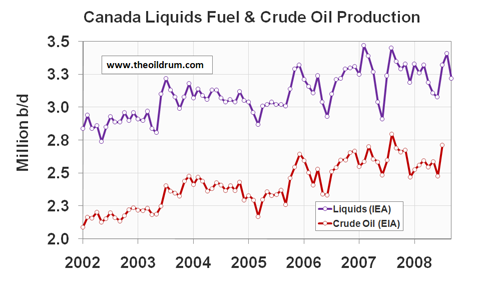
Figure 14 - Canada liquids production from January 2002 to September 2008.
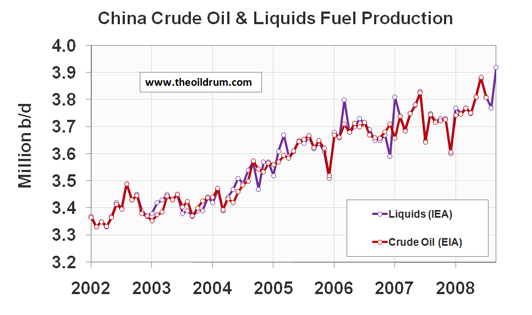
Figure 15 - China liquids & crude oil production from January 2002 to September 2008.
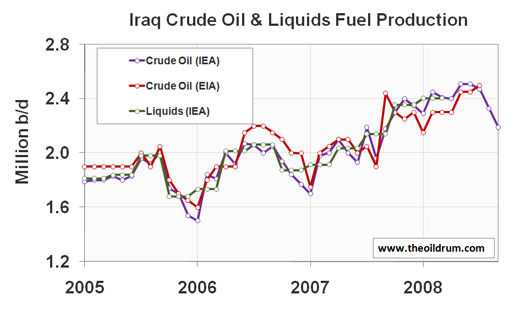
Figure 16 - Iraq liquids & crude oil production from January 2005 to September 2008.
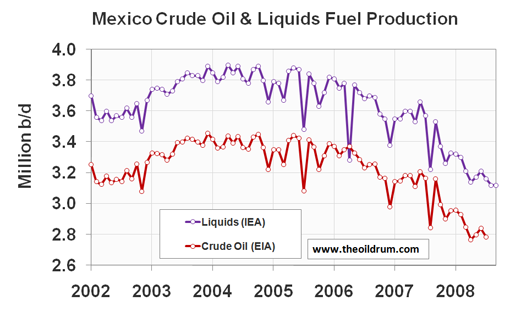
Figure 17 - Mexico liquids & crude oil production from January 2002 to September 2008
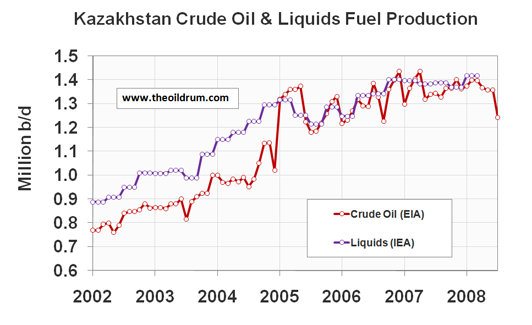
Figure 18 - Kazakhstan Crude oil & Liquids producrion from January 2002 to July 2008.
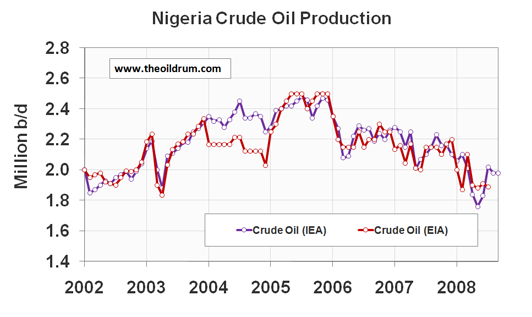
Figure 19 - Nigeria liquids & crude oil production from January 2002 to September 2008
Personnel
Editors
Contributors
Peak Oil Primers
Archives
- November 2010 (3)
- October 2010 (6)
- September 2010 (4)
- August 2010 (7)
- July 2010 (6)
- June 2010 (7)
- May 2010 (2)
- April 2010 (8)
- March 2010 (4)
- February 2010 (6)
- January 2010 (3)
- December 2009 (5)
- November 2009 (8)
- October 2009 (12)
- September 2009 (6)
- August 2009 (5)
- July 2009 (11)
- June 2009 (8)
- May 2009 (16)
- April 2009 (10)
- March 2009 (7)
- February 2009 (10)
- January 2009 (15)
- December 2008 (9)
- November 2008 (9)
- October 2008 (9)
- September 2008 (13)
- August 2008 (10)
- July 2008 (14)
- June 2008 (23)
- May 2008 (16)
- April 2008 (12)
- March 2008 (16)
- February 2008 (9)
- January 2008 (13)
- December 2007 (13)
- November 2007 (16)
- October 2007 (22)
- September 2007 (8)
- August 2007 (9)
- July 2007 (16)
- June 2007 (8)
- May 2007 (7)
- April 2007 (7)
- March 2007 (10)
- February 2007 (10)
- January 2007 (12)
- December 2006 (9)
- November 2006 (15)
- October 2006 (4)
- September 2006 (5)
- August 2006 (5)
- July 2006 (9)
- June 2006 (5)
- May 2006 (10)
- April 2006 (9)
- March 2006 (13)
Vital Trivia
License

This work is licensed under a Creative Commons Attribution-Share Alike 3.0 United States License.
Conclusion:
Production problems or consumtion problems?
Oh, the enigma of peak oil!
Cheers, Dom
Wow, the combination of total liquids data from the EIA and IEA is just poetic. The US energy department reports total liquids reaches an unquestionable new peak (just ignore the other line showing crashing production created by the man behind the curtain). World wide demand must be crashing. I now must side with those predicting declining oil prices for the next year and probably two. With production capacity up over that period and demand falling, the inelastic nature of the demand curve should take over unless the Saudi’s cut production millions of barrels a day. Peak oil is unquestionable here as existing field depletion continues in an environment of inadequate investment.
Well, don't forget that they're results are two months apart..
I understood that. Its dramatic and significant because of the difference 2 months makes.
So much for Peak Oil taking place in 2005. Clearly peak is still a way off.
Or then again, maybe it's tomorrow. Just because it hasn't happened yet doesn't mean it's not going to happen for a while. This month could have the highest production of all time. We just don't know until after it's happened.
Here is one piece of the puzzle:
http://www.bloomberg.com/apps/news?pid=newsarchive&sid=aRq4OnoWiNx0
Oct. 22 (Bloomberg) -- Petroleo Brasileiro SA, Brazil's state-controlled oil company, may extend investments in the pre- salt oil area over a longer period of time because of the financial crisis, Folha de Sao Paulo reported, citing Chief Executive Officer Jose Sergio Gabrielli.
Investments planned for between 2009 and 2013 may now be extended to a date closer to 2020, Gabrielli said, the Brazilian newspaper reported today.
"Clearly peak is still a way off."
"Or then again, maybe it's tomorrow."
"It may be a way off if you feel the July 2008 records will be surpassed in the future."
Clearly, we know nothing.
Clearly, this shouldn't cheer us.
It may be a way off if you feel the July 2008 records will be surpassed in the future. We now have new records in the rear view mirror. Time will tell if they stand. The global "recession" or whatever you want to call it will likely hold down demand for a while, perhaps allowing the July record to stand for some time to come. How long? Who knows...
I'm betting forever. This decline is not temporary. It is likely to be up to a decade long. Certainly full recovery will take that long. In that ten years we'll use up up to 25% of existing crude reserves. that will put us at 62.5% depletion globally.
New highs at 62% depletion? No way in hell.
Peak is here and gone, friend. Whether '05 or '08 could not be less relevant.
Cheers
This decline is not temporary. It is likely to be up to a decade long. Certainly full recovery will take that long.
Hm -- it's hard for me to believe that the global economy will go for a decade without demand bumping up against production again (and again). You're going by the 30s I presume. But as Nixon said, we're all Keynesians now. I'm inclined to think that there will be repeated collisions between production and demand on the depletion down slope.
Aside from that, the shape of the down slope won't just be geologically driven. I read that rising costs are already removing or are about to remove fields from coming online.
The best way to look at this economy is to try and discern the hardest road to recovery ... that will be the only road.
Like the Great Depression, this crisis began several years before the 'official start date'. That Depression's start date was October 1929; it really began with the Great Panic of 1921. Our current crisis began with the 'Dot Com Bust' of 2001. During the interval in both instances there were historically low interest rates and flat (nominal) or declining wages. In both instances wages were depressed by official policies that favored business owners over labor as well as large scale immigration, both internal and external. Agricultural workers in their millions left for industrial labor in cities in the 1920's. There was an influx of more millions from Eastern Europe. Today, jobs are outsourced to lower wage-rate countries and government policy accepts large- scale immigration from Latin America, both documented or otherwise. In both instances, labor demands are suppressed; the stagnant wage component then and now is vitally important to the unwinding of both economies. The small claim wages made on the GDP expansions both in the 1920's and currently's was and is manifested as reduced purchasing power, masked in both instances by increases in consumer credit. Low central bank money rates substituted debt in place of savings as capital for investment purposes. During both run-up intervals there were historically large asset and credit bubbles. Cheap loans pursued reckless speculation which would have never been financed with more expensive forms of capital. There were spikes in stocks and real estate both in 1920's and the 2000's.
Both recessions were international with markets and trade collapsing. Banks failed world- wide. Unemployment both in the US and abroad exceeded 20%. During the active recession periods governments responded by implememting public spending initiatives, lowering money rates, lending to troubled banks, purchasing stocks and devaluing currencies. None of these steps had any real effect, unfortunately.
There are big differences between the two periods:
-- The world's major currencies in the 1920's were gold- backed hard currencies.
-- The level of indebtedness of the US in the 1920's was much less than today.
-- The US savings rate was +10% in the 1920's, even without government security programs, this was a 'do it yourself' safety net of sorts, plus a pool of investment capital that could be tapped.
-- Today, the primary source of capital in the entire world is debt.
-- Our US safety net is either unfunded or supported by debt.
-- The US debt is largely in the hands of overseas ministries that are - in general - far less robust than the US's financial system.
-- Developing nations in the 1920's and 30's made a much smaller claim on resources than they do today.
-- There were no nuclear weapons in 1920- 1944.
In order for the economy to 'right itself', wages will have to catch up relative to higher income earners. In the earlier period, this took place over 9 years and required legislation recognizing and supporting organized labor. The Keynesian doctrines as applied during the New Deal were not particularly relevant to this effort. The war mobiliztion of industry beginning in 1938 raised the wages of many workers in industries that were notorious for low pay. After 1945, wages remained high and the difference between high income earners and the low income earners was compressed.
This compression must be done in our period. Higher wages increase spending power and allow a fraction to be set aside as savings which in turn bcomes capital for new investments. Regardless of whatever eco-economic context exists over the next decade, there must be increased spending power and aggregated savings from which investments can be capitalized.
Catching up wages is almost impossible when companies are laying off large percentages of workers. Nevertheless it must be done.
Encouraging savings requires a return on money. The depressed rates of return on money - discount rates close to zero percent - are designed to stimulate demand, particularly consumer spending. This first assumes all participants in the economy are borrowers. This leaves out the needs of lenders and thwarts the ability of the market to direct capital most effectively and to do so by price rather than by (government) fiat. Because any demand for new credit requires its substitution for existing debt the stimulus effect is small or non-existant.
Consumers must first pay off or liquidate existing debts, then accumulate some savings; only THEN they will able to consume. This is again almost impossible, nevertheless it must also be done.
Currencies today are credit based, they require trust to function as means of exchange. Governments must answer the trust issue FOREMOST before the attempt is made to use monetary policy tools. The instinct of government is to borrow first then deal with consequences later, however default hangs like a guillotine over all the major currencies. A run on any of them - Euro, Pound Sterling, Yen, Won, Dollar - would quickly become a chaotic run on all of them, one and then another. Such a run is an article in Bloomberg away.
Unfortunately, reining in borrowed 'liquiodity' is almost impossible to do when the begger-of-the-moment has national prestige or is a campaign contributor ... nevertheless it must be done.
Until all these are done, there will be no recovery, just a sickening slide into greater and greater calamity, until the currencies are repudiated and governments declare emergencies and institute ration cards and command economies.
More parallels: command economies were installed world-wide in 1939-1945, so that road will also likely be followed.
In my opinion, the oil crunch will hit when Mexican production drops another 20%. That is ... if the country doesn't default, first.
Steve, that is the most cogent exposition of our current situation that I have seen. Many thanks.
I wonder if you would share any thoughts on how some of the 'impossibilities' you mention in your post can be attempted?
Got to agree with you, Dave. Excellent post, Steve, enjoyed it very much. Spot on as well, IMO.
I know what a run on the bank is, but you got me with this concept of a run on a currency. What is it?
If you said there would be a run on one currency, I would have assumed it meant people massively selling the currency and converting cash assets into some other currency. But you talk about a run on all currencies at once. Where would the cash go?
This is a good, hard question to answer! Such a phenomenon hasn't happened before! In this instance, the cash - the paper - would remain, values would sharply diminish. Post-modern credit- based 'Money' only exists insofar as it is useful in credit transactions. If it is useless there, it's utility elsewhere is negligible.
I can only honestly answer that any sovereign default by any of the major industrialized nations would not leave 'survivor' currencies, that is any currencies having much 'wealth value' at all. Since all the major currencies are more or less identical and are all debt based and all require acceptance of value as a matter of faith, the collapse of one could hardly fail to cast fatal doubt upon the rest. This is not so much a matter of disavowing one particular creed in favor of another, it is more a matter of dismissing all creeds together, then dismissing the entire creed concept.
This kind of fratricide - the war of all against all - is happening right now in the other markets, where different services - stocks, bonds, commodities, swaps, interbank lending, options, real estate - are subject to runs in turn with the markets all declining in chaotic fachion. The complexity and volatility of the unwinding transactions transmits the instability of the markets themselves against the values of all participants.
In a default scenario, a creditor nation would race to recover as much currency (of their choice) as they could for what bonds they hold, however denominated ... for any reason at all. This could be a Korean government trying to obtain local currency for Yen bonds or Saudi government 'dumping' Treasuries for Euros. At this, government creditors would then hesitate to make any more loans or accept any more of a particular currency as repayment for outstanding debt - as is happening in the interbank lending sector. With the commingling of currencies, if one is unacceptable, all would eventually be unacceptable as well. The 'laundering process' of trading one currency for another and another and so forth ... would be the visible run. The actual damage would be don by the freeze in lending, amplified by the 'noise' in the currency and related swaps markets. In a short time the damage would be done. Without the flow of funds and credit the actual value of the money so engaged in the credit transactions would soon be zero.
Thanks for your answer. It seems that my intuition about what a run on the currency is was right.
Call me dense if you want but I still don't get this idea of a run on all currencies at once. Here are a few areas that don't add up in my mind.
If paper remains and credit disappears, isn't this the very definition of deflation? In such a scenario money gains value and a hoarding mentality installs. This would be the opposite of a run on a currency.
This dismissing of the creed concept is beyond my ability to imagine. Every economic actor depends on having a monetary system to execute transactions. They all need a monetary system to assign a value to assets and pay taxes. There is no substitute to money to perform any of these functions. This is obvious to everyone. If people stop believing in the creed of fiat money, they may as well slit their own throat. Things have to be extremely dire for a long time before the creed in fiat money goes away.
Belief systems are very sturdy. We have seen in the case of peak oil how people can deny the existence of problems in spite of mountains of evidence. Wont' this same psychological mechanism support the creed of fiat money? I can see how the collapse of one currency may cast doubts on others, but I don't see how the doubts can be fatal. People will just do a risk analysis and put their trust in what they perceive to be the less bad option.
Isn't the credit market already frozen?
Timing is everything; just as our conversation got underway, aeldric's topic appeared on TOD Australia! "The Failure of Networked Systems: The Repercussions of Systematic Risk"
You are far from being dense, this is a very valid discussion. The currency issues have not been resolved by economists including the central bank chairmen as well as many other thinkers and traders I personally admire. It is part of the big 'Inflation vs. Deflation' argument. The inflationists suggest there is no danger to running large deficits denominated in dollars bacause the resulting overseas fraction of our debts can be paid for with printing press money; inflated out of existance. The deflationists suggest that the shrinkage of money generally available would make a default less and less likely, as the dollar would maintain inherent value. This would be true even with the large increases in money at the institutional level resulting from the various stimulus and rescue attempts by central banks. This is an ongoing mental puzzle for many thinkers, this includes you, me, and a lot of others here on TOD. I certainly don't have all the answers; the biggest issue to to figure a way out of this mess.
I personally don't think the inflation scenario is possible. In order for this to work, our creditors would have to accspt the printing press dollars knowing full well these dollars are being devalued by the process of their acceptance. In other words, the only way the dollar can maintain value in an inflationary context is for dollar buyers not to accept them. So far, our creditors are accepting dollars, and lending them back to us as well, so the level of inflation-of-the- moment is considered acceptably small.
Meanwhile, the credit swap and bond markets are reflecting concern about the worthiness of the US as a debtor; this is despite or because of the ongoing deflation.
We have a multi- polar situation with many contradictions.
Partly because of deflation the default scenario seems structurally unlikely to most economists that I follow. Unfortunately, in our ironic universe, the least- likely appearing event is what actually most likely to happen.
This is of course true, but there are two things happening because of stratification of the money system. Goods are declining in value relative to currency to most of us in the real world - and credit is shrinking - which is deflation. Meanwhile, back at the ranch, there are trillions of loose fiat dollars floating around the banking system worldwide looking for something to destroy. The supply and demend situation at this level makes dollars tremendously cheap relative to goods, which is inflationary. For good or ill, all these dollars are held as if by gravity within the circle of high finance, taking the place of monies that have vanished into bad loan rat-holes.
In my opinion, what matters most to creditors is not so much the goods/dollar relationship of the moment, rather the absolute ability of the US to pay its debts. Relative value here is an indicator of ability to pay, or willingness. If inflation appeared to start leaking out of the tight circle of high finance it would instantly signal our creditors the US is trying to inflate its debts out of existance.
At that point, our creditors would refuse to accept our dollars, or would demand higher interest rates for loans. These rates would become onerous for the US to pay due to the size of our borrowings. Either would precipitate a race to unload the unwanted dollars or dollar- denominated securities for whatever else of value could be had; gold, commodities or polyester leisure suits from the 1970's.
This run would be by central banks or international finance companies. Unfortunately, the run would not likely be limited to one or two currencies, since international finance is a complex, interconnected and overloaded system. The end would be a general breakdown similar to the network malfunction described by aeldric. You can insert your own scenario, but a likely one would have the other fiat currencies considered as proxies for the now- unloved and unwanted dollar ... currencies bought and paid for in dollars for the sole purpose of being traded in its place. These currencies would soon enough be unmasked and dumped in their turn ...
Eventually, the US would run out of currencies to buy; since we borrow so much and consume so much overseas goods, any secondary currency - even yen - would have to be massively printed ... a 'run on all currencies'.
Ultimately ... the idea of fiat money itself could be judged along with floating exchange rates, computerized over the counter capital flows, hedging with swaps, having no centralized money disciple or treaty structure and having no 'lender of last resort' to answer demands for some, any or all currency in times of stress.
What would happen afterward, besides throat- cutting and window sill jumping is anyone's guess.
The credit markets are frozen to the degree that most transactions require a (much) higher rate of return. It is unlikely that more expensive money will remain confined to the banking and credit markets. Higher rates by themselves could precipitate a run on the dollar as higher rates could be interpreted as a pricing of increased repayment risk ... even if repayment was not an issue.
Great post.
The only thing I think thats missing is time. There is a huge difference between loaning the US x amount for 1 month and thirty years.
They way out of this dilemma is to loan money over ever shorter periods for ever higher interest rates. Its the loan shark approach and it works regardless of how depressed or messed up the economy or in this case the borrower is.
If your loaning money at 300% annual rates then its all good.
Seriously though when things get this messed up you simply fall back to traditional loan shark approaches. You don't really car what they do if your loan duration is short enough and your interest rate high enough you can extract money from the most worthless of borrowers.
I concur that this is a great post.
It is funny that you point out aeldric's article. I have two decades of professional experience with computer networks and cascading failures. I did troubleshoot them, I fixed them, analyzed them after the fact and designed networks to make sure the impacts of failures were mitigated or contained and critical functions kept working. To someone with my background, aeldric's article is amusingly simplistic. But this article fulfills the purpose if was written for and I saw no point in raining on the parade. I didn't replied to aeldric's article.
But for purpose of this discussion, there is an important detail that needs to be fleshed out. When cascading failures occur, it is normal and usual to have to identical devices such as routers or switches that are connected next to each other in the network and one of them is part of the cascade of failure where the other keeps running just fine. The reasons are that although the devices are identical to the point of being of the same make and brand, their interconnections with the rest of the world are totally different.
Lessons to be learned: it is not because two components of a network are connected and identical that they will behave the same. The specifics of the interconnections are of paramount importance.
I think this applies to this discussion of the currencies. They are structured the same and are connected. But they have different relationships with the various national economies and national governmental debt. My expectation is they will behave differently unless there is something in the specifics of their interconnections that will cause them to behave the same.
This is part of why I have such a hard time imagining a run on all currencies at once. I look for a specific cause and find only general principles that I think are unconvincing.
The data here is all total liquids. When people talk about a peak in 2005, the data they're usually using is conventional crude oil plus condensate. That said, even that peak was busted slightly this year.
Remember the graphs above don't have vertical axes starting at zero. There's not a lot of difference between 74 and 75, especially in the context of increasing producer nation demand. Maybe peak globally traded crude was 2005?
You may want to check again figures 5, 6 and 7. They are crude oil data, not total liquids. Figure 5 is relevant to the peak and shows clearly the 2005 levels were exceeded. But IIRC there is an history of downward revisions of such numbers. We need to wait a little to form a definitive opinion.
Oops, thanks for that! Yeah, as someone pointed out below, these might be revised downward.
It remains to be seen whether the "peak" of July 2008 remains standing from the perspective of C+C production. There were other "peaks" that came and fell after May 2005. The following chart is from the latest Monthly Energy Review (EIA) which, like the IPM product, periodically gets readjusted with new data. Some of the earlier months that beat May 2005 have subsequently been reigned back, so we will just have to wait and see what the future holds and whether the values for May and July 2008 remain higher than the peak of 2005.
It's possible that, in the grand scheme of things, July 2008 is just a final spike in the struggle for ever increasing production (notice the average oil aquisition cost for the month also spiked) before the prices brought the struggle to an end with the ensuing cascade of issues.
It is also worth noting that the US $ has gained dramatically in the past several months compared to the €. On the basis of the €, the cost rise has not been as dramatic, though the same type of trend is visible.
Link to the larger version of this image: http://farm4.static.flickr.com/3275/2966690637_67a86ec0e4_o_d.jpg
Just remember, it's not over, 'til it's over (and then it may go on for several years beyond that).
The Starship Trooper

Beechcraft (Raytheon) Starship 2000
That graph is rather interesting. From quickly scanning it, several things jump out at me overall:
1) From '79 to '87 production and price appear to be negatively correlated. This implies to me that a shortage of supply is causing the price increase. And yes, this was during the Oil shocks of the 70s and 80s, so this makes sense.
2) However, from '87 onwards, production and price appear to be positively correlated. I could be wrong here, but this implies to me that cost was driving production. If oil production had peaked, then you would expect 1) to occur. As this is primarily from the '80s to the present day, this makes sense.
3) As you get closer to the present day, the gradient of the price curve increases relative to the gradient of the production curve. This implies to me that, as oil becomes more scarce, the gradients of these lines (note that I am using the averages here, not the actual data) will become more and more perpendicular to each other, and once we pass peak oil, then the angle between them will pass 90 degrees, as no amount of money will increase oil production.
This leads me to conclude the following:
1) Price and production are positively correlated before the peak.
2) Price and production are negatively correlated after the peak (or when the oil supply is constrained for other reasons)
3) The angle between the line for production and the line for price will steadily increase, and once it passes 90 degrees (for a great enough averaged line), we have passed peak oil.
I apologise if this appears to be stating the obvious to some of you.
Here is a curve I love as it approximates the relationship of oil cost (composite aquisition cost) to global production. As the scatter curve suggests: it gets harder and more expensive to push beyond the 75 million barrels per day mark.
The Starship Trooper

Beechcraft Starship 2000
Production elasticity in action. The graph tells evrything. Lets see how he will behave in the next few months.
@starship trooper
Were did you get the composite acquisition cost data from, and what does it represent?
The data is from the EIA.
The data can be found here: http://tonto.eia.doe.gov/dnav/pet/pet_pri_rac2_dcu_nus_m.htm
Just to clarify the definitions,
Composite : The weighted average of domestic and imported crude oil costs. ( EIA definitions )
The cost of crude oil includes transportation and other fees paid by the refiner but the refiner acquisition cost does not include the cost of crude oil purchased for the Strategic Petroleum Reserve (SPR). ( EIA definitions )
Very revealing plot, by the way.
Thanks
It's interesting that figures 1 and 2 show declining liquids production, while figure 5 shows increasing crude production. Just a wile ago we had the oposite situation, with liquified gas was making the difference.
What does that mean? Peak natural gas?
Figures 1 and 2 are based on September data and Figure 5 is based on July data.
When September data is released, figure 5 will be down too.
With the World economy sliding down the canyon, peak oil has already occurred.
Now there will not be enough investment to drive up production any higher.
By the time the economy recovers, we will be on the downward cliff for oil production.
Without sufficent increase in future supply, growth will not go up again.
Thanks for you and Rembrandt for pointing that. I didn't notice that.
There are new investment projects in the pipeline, contracts signed, waiting for completion. Brazil has leased a fleet of rigs for years. Total recently leased a rig for Angola work. September was hurricane month. Just a short term drop in U.S. production. OPEC cuts might do little more than make up for hurricane shut-in production coming back. More than 40 million barrels of total liquids exports available recently, many nations cutting back spending on fuel. Dropping prices might eventually stimulate demand, in the mean time people are not topping off their tanks.
Were dreams of a fast approaching peak in oil production delusions of grandeur?
@marcosdumay
Figure 1 and 2 are until September 2008, figure 5 is until July 2008, that explains the difference.
Great charts-I was surprised to see that Canadian production is back to 2003 levels.
So world production for C+C reached a new record in July thanks to an increase from OPEC. There is a drop in total liquids for August and September according to the IEA, is it coming from OPEC? Iraq is down also, what is the reason? quotas? OPEC is supposed to meet tomorrow. There is also a drop in NON-OPEC production for August and September around 2 mbpd despite Russia bouncing back.
From mamba's statement that PO is "way off" I suppose we're back to defining what PO actually means to each of us. It seems to fall into two general categories: 1) Maximum sustained production rate beyond which decline is inevitable. 2) That point in time when maximum production rate cannot meet global demand. At the moment (or even since 2005) if the oil producers of the world could not increase production rate beyond a certain level regardless of demand then definition 1 would apply. Global demand destruction, either from the price spike or the current financial meltdown, has delayed the negative impact of PO as defined by definition 2.
I don't think the two definitions are entirely incompatible. Producers may not have been able to significantly increase production beyond levels established in 2005 and were thus about to go into a somewhat steady decline (or an undulating plateau for a while). OTOH, take an extreme scenario where the world goes into a prolonged recession where demand remains below an ever decreasing production capability for the next 30 years. Thus definition 2 would apply and PO (or more precisely its negative effects) would arrive sometime beyond 2040 or so. But if using definition 1 PO arrived, perhaps, several years ago. In fact, one could argue that a decline in demand would hasten the arrival of PO: decreased demand = decreased price = decreased exploration = decreased development of whatever reserves are remaining untapped. Regardless of how much or how little crude oil the world demands, producing fields will continue to decline. Perhaps at a slower rate but does not increase their ultimate recovery or their maximum flow rates.
Maybe that’s a distinction worth discussing: the point in time when the negative effects of PO are felt. In fact, if global demand were always below maximum production capacity, the physical limits of production capacity would be of little relevance. Of course, that’s not where the world is going in the long term. There is also an additional caveat which can confuse the issue: the negative effect of PO arriving before the physical PO arrives. Depending upon the discipline of the OPEC members we may shortly see what could be called an “artificial PO”. Should OPEC voluntarily reduce production rates to a level below world demand we would see increasing prices and negative global reactions just as if the exporters had maxed out their production rates.
Economics 101: Supply is always equal to demand at current price.
Greenspan has this morning renounced Economics 101. (He is shocked, shocked that the fundamentals are not what he thought they were.)
Wisdom from Pakistan,
Say you have an isolated community that takes its water from a pond and it's priced at 1$/10liters.
Apply cheeringly your definition of supply and demand. The lake is poisoned by a rare bacteria and all of it becomes unsafe to drink. There is no water purification devices at hand, the fastest aid will arrive in 4 days and so Supply=0. Does demand =0? I think It's that kind of demand they are talking about: The demand from certain needs (and wants). If you are talking about "wants" in a liquid informed market (does that animal even exist?), then Economics 101 applies. But demand in this context refers to a combination of needs/wants that cannot always be priced (like water in that scenario).
I agree with you ROCKMAN. From where I sit, it looks like that there are a few things that people have done to increase production in response to increased demand (the cornucopian/economist model) but what can physically be done is limited (the peak oil/geologist model) so that demand is not getting fully met. This latter point is evidenced by the fact that that oil today is still only at the price from about a year and a half ago, and a far cry from the price during the earlier part of this decade or the 1990s. Some people expect it to go back to that, but to me the current price crash looks more like a bubble than the run up in price did, it's certainly dropping at a fast rate.
I have no idea if if the eventual sustained decline (#1) is coming soon and the Hubbert linearization just misses it by 3+ years, but it might be a moot point if as you say demand is going to fall for the next couple of decades due to an economic recession, it doesn't matter what the geologic constraints are on oil production are because demand won't rise that high.
I can remember a lot of discussions here on TOD about "How high can the price of oil go before the economy collapses" and a lot of people agreed that it couldn't go beyond ~$250-300ish (IIRC) because we'd be spending sizable fractions of our GDP just on fuel. I don't know, maybe $147/barrel is just what the economy could take before it melted down.
Another thought that crosses my mind is that in his book Matthew Simmons posits that the Saudi Arabians trying to go against OPEC in the 1980s by limiting their production wasn't due to some political or economic concerns, but because they were overproducing their wells during the late 70s. How much overproduction has there been in the past year? Has there been damage to reservoirs due to them doing this? How is that going to affect future production and oil price? It may be that the recent sword rattling about OPEC about reducing production is also because they were overproducing the last year, but I don't know how we'd know that.
*edit* For those who don't know: often there is a specific rate at which you can produce from a well while achieving your maximum total production over the lifetime of the well. Overproduction is when you produce oil from a reservoir faster than it can easily go so that you bypass pockets of oil, thus lessening the total production over the lifetime of the well. It's a lot like when you get to the bottom of the milkshake with your straw, your straw starts pulling in air instead of shake. When this happens, sometimes you can let the reservoir rest by not producing as much from it and it regains something more like its normal behavior. But I don't know, maybe with today's horizontal multiple well bores this isn't as much of a concern because you can target specific pockets. Maybe someone in the oil patch knows?
Gwydion,
Since the early 90's I've heard anecdotal evidence from expats who worked with ARAMCO. Typically they said that Ghawar was being produced at too high a rate and thus cutting back ult recovery. But I do know a major horizontal drilling phase was conducted in the field in the late 90's. As you imply, this drilling might have been done to recapture those lost reserves. It would also allow them to ramp up production for a while. But producing horizontal wells at an excessive rate also has a similar effect in reducing overall recovery. But since the KSA never releases details of these ops all we can do is speculate.
From the biophysical economy model of Charles Hall deadline is around 20% of GDP or an EROI of 20%. Beyound that you cannot even maintain the infrastructure.
@khebab,
The decline from August to September is caused by mainly:
(in kb/d)
Iraq -140
Angola - 100
Iran - 130
US - 1240
Rembrandt
Rembrandt
It's good to see the European Oildrum staying ABREAST with new posts and info. Please keep it up.
You plethora of graphs speak for itself and explains why our price levels have been so low in oil. (Not that i'm complaining!... I drive an SUV that drinks gas)
We've seen a rapid spike in production, in a period where businesses are closing, and consumers are being more conscious of spending.
Now we are seeing the oh so great OPEC convene to discuss collusion to bump up prices. Why do you think the S&P/TSX has been performing so well today... in addition to alot of oil companies? Investors are betting that the OPEC meeting tomorrow will result in an increase in oil prices... thus benefiting these companies...
I've found that their are numerous undervalued companies in oil,gas, and mining.. especially in Canada.. kirk kerkorian billionaire investor disclosed that 10% of his portfolio is based out of Canada, when Canada only accounts for 2% of the world's stock wealth. Therefore he's investing 5X as much as the average investor. This speaks volumes! I suggest Europeans consider his investment decisions and examine his track record for identifying opportunistic markets. You may want to experience the Canadian portal if this may be of interest to you.
http://www.stockresearchportal.com
Just to emphasize how manic and undervalued their market is. Today PetroCanada announced an increase of revenues by 61% !! and the stock has only moved 6 points.
Just eyeballing the charts it looks like Non-OPEC oil production took about a 1.75 mbpd hit from July to Sept. That's a heck of a drop. I wonder if the traders are taking that into consideration, yet? How much of that was U.S.?
@kdolliso
1.24 mb/d was due to US from August to September
Thanks, Rembrandt. Do you know how U.S. production is doing this month?
Hurricane Gustav/Hurricane Ike Activity Statistics Update – October 23, 2008
The caption on Figure 15 says it is China, but the title on the graphic says Canada. (The data matches the Canada data on figure 14 too.)
@bikerboyOR
Thanks, switched figure 15 to the proper Graph of China.
Welcome back, Rembrandt. I have been waiting and waiting for the Oilwatch Monthly for September 2008 and was worried the October edition would not arrive too. I appreciate your efforts to organize all of the confusing data. Thank-you.
With world crude oil production (figure 5) up by ~1 Mb/d in July 2008 over the peak in 2005, it may be just high enough to rise out of the noise and retain its place as the new peak surviving future revisions. However, one slightly higher spike is not enough to remove the world from an extended peak. I think it is more akin to a last gasp. Supply appears to have exceeded demand at the same time demand began crashing and the U.S. dollar began strengthening due to banks hoarding dollars to increase their loan loss reserves.
…THE IMPENDING OIL CRISIS… PEAK OIL…? EVERYTHING ISN’T SO BAD.
Undiscovered world hydrocarbon reserves are too far from depletion. For example, the world’s second largest discovery in the past 20 years occurred at Brazil's Tupi field, in November, 2007. Estimated recoverable reserves could reach eight billion barrels. Some early was discovered Sugar Loaf field (25-40 billion barrels).
Swiss-based Manas Petroleum stated that a resource evaluation in north-western Albania had assigned 2.987 billion barrels of oil with 3.014 trillion cubic feet of associated gas.
Oil contents of the US Outer Continental Shelf estimates as about 19 billion barrels and so on.
There are many large undiscovered oil fields (perhaps 40-50%).
Problem is in low success rate in exploration wells.
According to industry figures the rate for the North Sea now are approximately 25%. In other words only one well is successful in four drilled. Dry wells are a fee society has to pay for conservatism of the oil industry leaders. It significantly brakes industry growing.
Indeed, many oil exploration projects have been frozen because of the scarcity of drill-ships and rigs. Around the world huge orders on these ships are pending. (For example, 16 new drill-ships are scheduled to be delivered to oil companies already this year - more than double the number delivered over the last six years combined. In fact, 75 ultra-deep-water ships should be delivered between 2008 and 2011, according to ODS-Petrodata. Demand is so high that shipbuilders, the biggest of which are in Asia, have raised prices since last year by as much as $100 million per vessel, to about half a billion dollars. Shipyards from South Korea to Norway are working overtime to meet a huge influx of orders.)
Thus, the leaders of the oil industry see the way out of the current situation in the increase of the extent of drilling (the number of exploration wells). However, if one takes into account that at the current exploration success rate only one quarter of the drilled wells is successful, the active drill-ships and those about to be put into operation will drill mostly (three out of four) dry wells, which will be permanently plugged and abandoned after the drilling. Drilling costs for some of the newest deep-water ships in the Gulf of Mexico, for example, have reached about $600,000 a day ($150,000 a day in 2002) and such drilling is carried out mostly (75%) for nothing due to conventional methods of drill site predictions.
“With exploration wells in the Gulf of Mexico costing up to $100 m and a deepwater exploration success rate of 11 percent in 2006, minimization of exploration risk is critical”, writes Philip Christie, Vice President of the European Association of Geoscientists and Engineers (EAGE), New Generation Oil&Gas, issue 3, 2007.
However there is a Binary Seismo-Electromagnetic (BSE) technology which uses new physical mechanism for creation the direct response from hydrocarbon deposits. It can significantly mitigate statistic data cited above because BSE success rate is more then 75% for wildcats with discovering commercial pays. Or to put it another way, failure rate is 25% only (one well in four drilled). So, new method is at least in three (3) times more effective then conventional methods. The BSE survey can find and outline at list 75% of all reserves in any region before any drilling is done or it can add 25-30% reserves in old provinces. www.binaryseismoem.weebly.com
As was explained on TOD many times, the problem is not the size of reserves. Therefore the availability of reserves is a poor metric for peak oil monitoring purposes.
According to the Hubbert logistics curve, peak of conventional oil production occurs when the recoverable reserves, both known and unknown, are somewhere around 50% depleted. Therefore the peak occurs when the other half of the recoverable reserves is still in the ground. This is a lot of oil remaining in place, including a large quantity that is still to be discovered.
The problem is the flow rate. There is a three way race between the depletion rate of aging fields, the discovery end development of new fields, and the growth of oil demand resulting from global economic growth. The combined effect of new developments and depletion of existing fields is a flow of oil extracted from the ground. The target for this flow is to achieve a rate that is sufficient to match the demand. Finding the point in time where there is permanent failure to do that is a big part of what peak oil study is about.
The economics of oil are such that the easy fields are put in production first and the hard ones come next. As the depletion of the easy fields progresses and demand continues to grow, it is harder and harder to put new fields in production at a satisfactory pace. In other words keeping ahead in the race is getting tougher every year.
The question is when will the oil industry permanently fall behind in the race. This is asking when the difficulty of new oil fields development becomes so great that the industry turns permanently unable to grow production fast enough to meet the cumulative pace of depletion and growth in demand. When this happens, the negative impacts of the peak are felt in full force. This is why peakists put much more efforts in monitoring the flow of production than in monitoring reserves. This is a much better indicator of the peak.
So you are correct to point out that there are large and not so large oil fields yet to be found but this is not the question. The question is how long can we maintain a flow rate that meet demand? When we dig into the details this is a much more complex question than "is there still oil in the ground?" although the latter is part of it. And the answer we got so far is we have been unable to grow production significantly since 2005 but in 2008 we still managed to keep ahead because demand has been declining.
Technologies can be brought in to help keep up with the race. BSE could be one of them but I don't have the expertise to offer an opinion. Technologies do what they are meant to do but they don't change the fundamentals of the three way race I mentioned above. At best the industry can keep growing production a few more years and reach a higher peak before the terminal decline starts. But this also means there is less oil in the ground when the peak is reached while demand had some extra time to grow higher. Therefore there is a faster and steeper descent after the peak has been reached. This is not a good thing. Extending the time before the peak with new technologies is not the best strategy. It is much better to invest in post-peak mitigation.
However there is a Binary Seismo-Electromagnetic (BSE) technology which uses new physical mechanism for creation the direct response from hydrocarbon deposits. It can significantly mitigate statistic data cited above because BSE success rate is more then 75% for wildcats with discovering commercial pays. Or to put it another way, failure rate is 25% only (one well in four drilled). So, new method is at least in three (3) times more effective then conventional methods. The BSE survey can find and outline at list 75% of all reserves in any region before any drilling is done or it can add 25-30% reserves in old provinces. www.binaryseismoem.weebly.com
hahahaha, another geophysical majic bullet. Sorry to burst your bubble, but this is classic snake oil salesmanship.
I think that there are very few regions of the world where exploration is economic at $65/bbl--at least with current drilling costs.
Let me know if my math is wrong here....
If:
Average daily crude production for 2005: 73.8 mbpd
Average daily crude production for 2006: 73.4 mbpd
Average daily crude production for 2007: 73.1 mbpd
Average daily crude production for Q1-Q3 2008: 74.3 mbpd
Then the average daily production for 2006, 2007, and Q1-Q3 2008:
(73.4*4 + 73.1*4 + 74.3*3) / 11 = 73.54
That's over a quarter million barrels a day less than 2005, on average, since 2005 ended.
Appears oil consumption was limited by price speculation not production, these past few years.
Cornhole? It appears exactly the opposite to me. Rapidly rising prices were the result of the need to eliminate demand, As evidenced by the some thirty or more countries which had resource riots or upheavals in the last couple of years. When the price finally got high enough to limit demand in the worlds biggest demander, economic turmoil created enough demand destruction that prices finally started back down again.The turmoil continues. While there were many other issues relating to the economic crash, it seems amazingly coincidental that it was exactly that type of maelstrom which finally got the price down about 1 month after it hit $147.
US oil production down by 1.24 mb/d, is that solely because of this seasons hurricanes or is there any other factor?
Assuming that production is now coming back on stream has that been a contributory reason for the fall in oil price in the last three weeks?
Hmm generally with Nigeria I attribute production changes to internal strife.
However looking at the graphic it looks like that may have really peaked ?
My opinion is that the internal strife is the main cause of declining oil production. Couple of years ago I made a long comment on Nigeria in which I opined that things were very bad there and likely to get worse. They did get worse. Is there any shred of evidence to suggest that conditions in Nigeria will get better? None that I know of; hence, I think that if Nigeria's production continues to fall it will be due to worsening social and political disorder and increasing violence rather than a geological peak.
When I count my blessings, I include the fact that I do not live in Nigeria.
Be careful interpreting Figure 1, World Liquids Production Including Biofuels. Since it takes about as much energy to produce biofuels as is recovered by burning them, they do not result in a net increase in available energy. But the energy is counted twice, once as the oil extracted from the ground and again as the biofuel (ethanol and biodiesel) produced from that oil. To give an extreme example, suppose that all of the world's oil production were devoted to biofuel production. The net amount of energy available to the world's economies would remain about the same as if no biofuel were produced, but the statistics would show a doubling of fuel production, 1 unit of biofuel for each unit of fossil fuel. In practice it isn't that extreme, because some of the fuel used in producing biofuels is coal and natural gas, but the distortion in statistics is still there. The net effect is that as biofuel production rises, the apparent total production rises with it, but the actual amount of available energy does not.
I apologize if this appears to be stating the obvious to some of you.
Actually, Bruce, there's very little diesel connected with the production of ethanol. The farmer will use about one gallon of diesel for every one hundred gallons of ethanol, and you'll use, maybe, two gallons of diesel in the transportation of same one hundred gallons.
Most of the fossil fuels used are from nat gas. It won't be very many years, though, that most of the process energy will come from gassified biomass.