| Lord Oxburgh Warns Oil Demand To Outstrip Supply | The Oil Drum: Europe | ASPO 6: Have we reached the tipping point? |
Oilwatch Monthly - September 2007
Posted by Rembrandt on September 17, 2007 - 7:02pm in The Oil Drum: Europe
The September edition of Oilwatch Monthly can be downloaded at this weblink (PDF, 1.50 MB, 19 pp).
Latest developments:
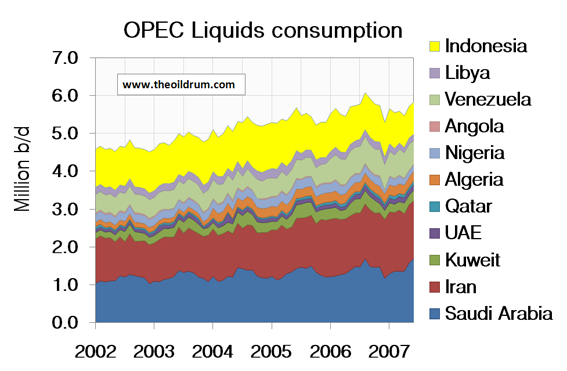
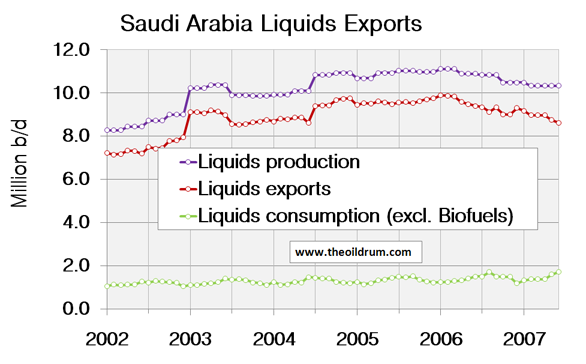
1) OPEC Demand - In 2002 OPEC-11 (excluding Iraq) consumed 4.63 million b/d according to the JODI database. Since then, demand has increased by 1.1 million b/d to 5.69 million b/d in 2006. The increase was mainly caused by higher consumption in Iran and Saudi Arabia, which increased by 234,000 and 418,000 b/d between 2002 and 2006 respectively. 2007 shows an acceleration of this trend in both countries. In Saudi Arabia, liquids consumption in the first half of 2007 reached 1.46 million b/d. An increase of 128,000 b/d compared to the consumption level of 1.33 million b/d in the first half of 2006. In Iran consumption increased by 100,000 b/d to 1.57 million b/d in the first half of 2007, compared to 1.47 million b/d in the first half of 2006.
2) Crude oil - As of the time of writing the latest numbers from the EIA's International Petroleum Monthly were not yet available.
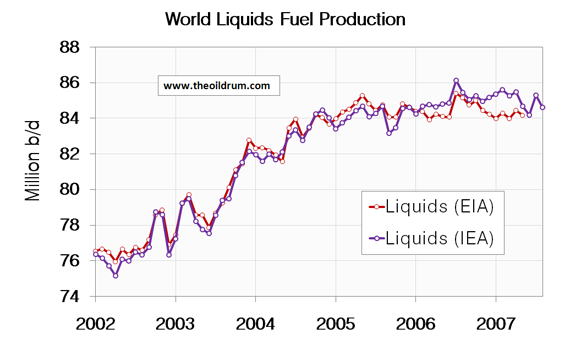
3) Total Liquids - In August world production of total liquids decreased by 430,000 barrels per day from July according to the latest figures of the International Energy Agency (IEA). Resulting in total world liquids production of 84.60 million b/d, which is 854,000 b/d lower year on year from August 2006 to August 2007 and 1.53 million b/d lower than all time maximum liquids production of 86.13 million b/d reached in July 2006. The average production in 2007 up to August has been 85.05 million b/d, comparable to the average 2006 production of 85.00 million b/d.
4) OPEC - Total crude oil production of the OPEC cartel decreased by 80,000 b/d to a level of 30.16 million b/d, from July to August, according to the latest estimates of the IEA. Natural Gas Liquids production increased with 20.000 b/d to 4.82 million b/d, from June to July, according to the IEA. The average total liquids production in 2007 up to August has been 35.12 million b/d, which is 593,000 b/d lower than average 2006 production of 35.71 million b/d.
A selection of charts from this edition:
Personnel
Editors
Contributors
Peak Oil Primers
Archives
- November 2010 (3)
- October 2010 (6)
- September 2010 (4)
- August 2010 (7)
- July 2010 (6)
- June 2010 (7)
- May 2010 (2)
- April 2010 (8)
- March 2010 (4)
- February 2010 (6)
- January 2010 (3)
- December 2009 (5)
- November 2009 (8)
- October 2009 (12)
- September 2009 (6)
- August 2009 (5)
- July 2009 (11)
- June 2009 (8)
- May 2009 (16)
- April 2009 (10)
- March 2009 (7)
- February 2009 (10)
- January 2009 (15)
- December 2008 (9)
- November 2008 (9)
- October 2008 (9)
- September 2008 (13)
- August 2008 (10)
- July 2008 (14)
- June 2008 (23)
- May 2008 (16)
- April 2008 (12)
- March 2008 (16)
- February 2008 (9)
- January 2008 (13)
- December 2007 (13)
- November 2007 (16)
- October 2007 (22)
- September 2007 (8)
- August 2007 (9)
- July 2007 (16)
- June 2007 (8)
- May 2007 (7)
- April 2007 (7)
- March 2007 (10)
- February 2007 (10)
- January 2007 (12)
- December 2006 (9)
- November 2006 (15)
- October 2006 (4)
- September 2006 (5)
- August 2006 (5)
- July 2006 (9)
- June 2006 (5)
- May 2006 (10)
- April 2006 (9)
- March 2006 (13)
Vital Trivia
License

This work is licensed under a Creative Commons Attribution-Share Alike 3.0 United States License.
"In 2002 OPEC-11 (excluding Iraq) consumed 4.63 million b/d according to the JODI database. Since then, demand has increased by 1.1 million b/d to 5.69 million b/d in 2006." That's an increase of just under 23% in 4 years, almost exactly 5% compound growth p.a. Easy to see why westexas is so worried about falling exports and why oil prices have touched all-time highs even as the US economy falters, with the UK possibly not far behind as PM Brown holds "crisis talks":
http://news.bbc.co.uk/1/hi/business/6998228.stm
If my math is correct, it looks like Saudi liquids consumption increased at 9.3% per year from the first half of 2006 to the first half of 2007.
If memory serves, Euan roundly criticized me for using a 2007 estimated rate of increase in consumption of 10% for Saudi Arabia.
This 10% estimate was partly based on a communication I had from a (non-Saudi) source in Saudi Arabia who told me that the Saudis were going to have to divert, over the next two years, 500,000 bpd of liquids production to domestic consumption, because of the ongoing shortfall in natural gas production--which is why the Saudis are talking about importing coal.
To be fair, my source also thought that most of the Saudi production decline was voluntary. To some extent, I suppose that a lot may turn on the definition of "voluntary." If the water cuts in some wells were getting horrific, perhaps part of the production decline was "voluntary."
WT: Your ELM would have been even stronger if the USA had not destroyed Iraq. Who knows how high domestic Iraqi consumption would be right now without the destruction of the Iraqi consumer? Conspiracy alert: another possible motive for the invasion/destruction- WT's ELM. Dead ahead: the Iranian consumer. Hopefully it will be a while until you guys get to the Canadian consumer.
I warned the Canadians a few days ago that they may become part of the "Axis of Evil."
Doesn't the Iraqi case indicate that this strategy will likely be unsuccessful as the cost of rebuilding and maintaining control over the infrastructure is too high? In the case of Iraq they may be consuming less, but their production and exports are way down too. If the undeveloped world has indicated anything it seems to be that infrastructure cannot be maintained in areas where residents have nothing to loose by destroying said infrastructure and have everything to gain by stealing either production or the infrastructure itself.
Curious as to groups thoughts here?
With the amount and quality of the oil in iraq, i think even starting over from scratch with infrastructure would be more profitable than many of the projects that are active these days.
And I think the people who are behind this crap don't care if the oil is accessable now, they just don't want a strong society in iraq that can control and god forbid use the oil themselves.
After another decade of war in the area, with a few hundred more tons of DU spread about, they might not have much of a problem with insurgents bombing oil infrastructure.
This is an excerpt from my recent Net Exports post (note that I am assuming some type of fourth quarter increase in Saudi production, which IMO, if it occurs will be temporary):
Westexas,
You said,
"If my math is correct, it looks like Saudi liquids consumption increased at 9.3% per year from the first half of 2006 to the first half of 2007."
Something I have been wondering....if the Saudi's extract crude oil, and then instead of shipping it out in bulk, use it in their own refineries and industries, and ship out the finished product, does that count toward "Saudi liquids consumption"?
I am not familair with how they count, or how we count them on that issue, any info will be appreciated....thanks....
RC
The EIA defines consumption as Total Liquids consumption, inclusive of refinery gains (although refinery gains don't yet appear to be a big factor in many exporting countries).
I've put it this way, ignoring refinery gains and transportation costs:
Assume that Export Land, EL, produced two mbpd, and shipped two mbpd to Import Land, IL, for refining. Each country consumed one mbpd. So, EL's net exports would be one mbpd and IL's net imports would be one mbpd.
If EL refined all of their oil, and exported one mbpd of product to IL, EL would still have net exports of one mbpd and IL would still have one mbpd of net imports.
WT, thanks for the clarification....I know that the U.S. has lately been importing gasoline stocks like crazy over and above the crude imports....it still amazes me that Europe for instance will export gasoline, as cheap as we sell it for at the pump! (?)
RC
Thanks for the monthly update! It is always a pleasure to read your beautiful and clear graphs. What do you use for graphing the data? Your selection of the aspect ratio is most exemplary.
Reading quickly from the graphs to get a general feel:
Iran consumption increase 2002->2006: 0.234 Mb/d
Iran production increase 2002->2006: c. 0.8 Mb/d
Estimate export data for Iran 2003->2005: -0.03 Mb/d
= Iran is hitting ELM export decline with current production capacity (may change in future with re-investments)?
Saudi Arabia consumption increase 2002->2006: 0.418 Mb/d
Saudi Arabia production increase 2002->2006: c.2.4 Mb/d
Saudi Arabia exports increase 2002->2006: c. 2Mb/d
= KSA is no anywhere near ELM declines now?
Mistakes in this reading? Sure, it is just one interpretation of many...
rgds,
Samu
Hi Samu,
I use the newest version of Microsoft Excel to create the graphs. You can do quite a lot with it in terms of graphical splendour. Im not near my computer with the data at the moment so can't check your figures. Staying in London for a few days after the Conference in Cork, meeting up with the guys from Powerswitch. Will have a look at them later
Does anyone have estimated worldwide GDP since May 05? Coming on 30 months ago.
Has it increased?? If so, how seeing that Crude and Condensate production peaked then?? WestTexas?
FF
Things are moving so fast, it's hard to keep up. But in regard to the longer term picture, the absolutely critical point to keep in mind is that the Export Land Model (ELM) and two real life case histories, indicate that when an exporting country's production starts declining, the net export decline will accelerate with time.
The ELM means the death of the consumer led economy.
We are on the fast track to an economy focused on meeting needs, instead of wants. Even to the extent that wealthier people can afford conspicuous consumption, I predict that conspicuous consumption will increasingly become socially unacceptable.
Of course, here in the US, we are the kings of conspicuous consumption, where consumption is celebrated as a virtue, but IMO, that is, and will be, changing fast: "Cheap is the new chic."
Very good question. Something doesn't match. Reality check ...
What is GDP ? Government spending+consumer spending+company spending on goods, services and some financial products perhaps ? Are these figures adjusted for inflation ? By how much will the increase of the price of oil and products inflate the GDP number ? How much of the increasing housing bubble has contributed to the increasing GDP (i.e how much of the the increasing GDP can be attibuted to the creation of money) ? I'm not an economist but as I understand it, GDP is a measure of economic activity, not a measure of the total value of goods. If the measure of GDP is correct however it should bear a relationship to the total value of goods but in some conditions this relationship could be broken ...
On the other side, of course, peak oil is related but not equivalent to peak energy. If there is still some real increase in the world's activity we would have to ponder a few things among :
- Some of the countries contributing to the increase in world GDP have the possibility to switch a significant part of their energy supply to coal, uranium and gas for the time beeing. This will still enable for some months or years to increase the energy input. For how long ?
- A thousand dollar question would be : is there a black market for oil ?
- How are the numbers for oil production obtained in the first place ? Is there an international agency which verifies the numbers declared by each country ? Are there any sanctions taken in case a country understates or overstates its production ?
GDP is the value of all goods produced or imported during the year. Of course, that value is measured by market price, so if some good doubles on price during the year a factory producing it contributes twice what it did at the previous year while producing the same.
The GDP is corrected by inflation, what reduces the problem of using market prices. But any correction is useless when your inflation statistics are fake. Even with real statistics, that still pose some problems.
Also, the GDP measures only what was produced, and during a single year. It doesn't measure depreciation, for example, what leads to the broken window falacy. It also can only price what is comercialized.
But keep in mind that I may be wrong on some details, since I also am not an economist. I just think it is interesting and study it a lot.
I like the broken window parable but in the case of oil its worse the original window cost 6 Francs but because of spiraling oil costs its now 20 Euros :)
No but seriously replacement costs for a lot of items will probably double at least over the coming years. In effect this means say in 10-15 years we will have less than 50% of the infrastructure we have in place today. This could easily be conservative. I expect the number of roads in good condition to be practically nonexistent in 20 years for example.
Whats interesting is its pretty easy to see that infrastructure will quickly decay to African levels whats hard is to understand how it goes. Africa decayed fairly rapidly after the end of WWII.
I think once you see local governments going bankrupt then state government the infrastructure will nose-dive.
This is commons infrastructure but this applies to any durable goods in general they won't be replaced but repaired then abandoned.
Whats fascinating is that our cookie-cutter style economy with tracts of houses strip malls etc is effectively like a mono-culture subject to a blight that can readily wipe out most of the "crop". The lack of diversity will ensure once maintaining a certain amount of infrastructure becomes untenable it will probably be abandoned quickly.
You often hear the phrase "to big to fail".
I think its really so big that when it fails it destroys everything.
See? The GDP will grow like a rocket!!!
Quite right. In 1998 the lowest spot price for brent crude was around 9.80$, today it stands at 77$. Not yet as steep as in Memmel's example but still very impressive.
IMO, based on current deterioration models for NE US roads, no roads in 'good' condition in 20 years would be associated with a scenario in which:
i. Current heavy truck volumes are maintained.
ii. Demand maintenance, preventive maintenance and capital investment almost cease.
Consider also that desired flexible pavement treatment cycles are approx. 12 years. Significantly longer for rigid pavements.
neuroil
Getting good figures on oil is very frustrating, as you'll here some of the dataheads complain. There's no auditing of reserves, and many producers consider reserves and the data used to calculate reserves as state secrets, the most prominent of whom is the Kingdom of Saudi Arabia, or KSA. Since they are the guys who are supposed to provide the increased production to meet the world's increasing demand over the next 20 years,you can see that this is a real problem. If you will look at the keyposts on Ghawar and KSA by some of the analysts here you can see the discrepancy. The mai analysts writing on that problem are Khebab, Stuart Stamiford, Ace and Euan Mearns from The Oil Drum Europe. The main European energy forecasts are made by the Energy Information Agency (EIA) and the American International Energy Agency (IEA) and are commonly refered to here by their initials.
National Oil Companies (NOC) like Aramco (the Saudis) or Pemex (the Mexicans) produce and sell 82% of the oil in the world. Sovereign nations are not obligated to report to anyone and are not audited. The other 18% of the oil is produced by all the other companies in the world. The US exchange companies have better reporting, so you can trust figures by producers like ExxonMobil or Royal Dutch Shell. BP puts out an annual statistical review which seems to have a very high degree of accuracy. These are used as a base by analysts such as Rembrandt whose work is the work above.
You asked if there is a black market for oil. The answer is yes. Currently Oscar Wyatt is defending himself from charges related to the UN Oil-for-food scandal. There's rumors of the rebels in Nigeria selling oil to tankers for weapons and cash, and evidence this also happens in Iraq now. The southern crude goes to Iran mostly, the Kurds is smuggled through Turkey, and I've heard rumors of oil going through Syria. There are also rumors that much of the Columbian crude has been diverted over the years by Columbian Guerillas. Who buys the crude, who profits from it are all pretty quiet. I'm sure some goes places like North Korea and Myamar with rogue regimes, likely some to refineries in small nations that are off the radar screen,
A caveat: Noeroil, this stuff isn't my area of expertise. I know a lot about onshore Texas production because that's what I do. I just answered your questions as a curtosey because you are obviously new around here. I'll happily take correction on anything I just stated by anybody that knows better Bob Ebersole
Thanks very much.
It is very important to get these things into perspective - always.
Just to set it right I'm not new here. Nevertheless your answer is very useful for those who are. In fact I tried to reply to FF in the form of questions since I think that his problem is an important one to adress. FF made a socratic argument directed at WT in anticipation that WT would use rembrandts numbers to confort his ELM theory. I tried to answer in a socratic manner (because my authority in the field is nothing compared to yours and that of FF). Knowing his official position about peak-oil on TOD and the way he provoked WT, I thought he would like a provocative discussion. What a better discussion than to question the numbers ?
My point is :
GDP is an estimation of the wealth of a country not by measuring the total value of things but by estimating by two methods : either total national expenditures and investiments or total income. The BEA explains the methodology very well. But is this really well correlated to the supply of a nation in terms of distribution of wealth, number of useful items ? Does an increasing GDP reflect a parallel increase in production ? I doubt it very much. For instance, an inside source told me (sorry no link) that military investiments increased a lot in France while the number of useful items (helicopters, ammuntion, arms) decreased or didn't increase in proportion. The investiments increased because of skyrocketing prices but the supply of goods decreases because the industry can't deliver fast enough. In fact the military industry can't increase production much because of the scarcity of metals and high prices. This is one example. Another is the everyday misery I can witness. People spend more and more on food, yet there a more and more people who don't eat their three meals a day. So GDP increases but does that mean that this is parallel to an increase in economic health ? Is production really up in proportion ? This is important because if there is a real increase in activity (production, shipping and so on), energy consumption should increase as Stuart Staniford has clearly shown about a year ago. But if there is a discrepancy then this should be discussed. I know that GDP numbers are corrected for inflation but the prices for food, metals, energy all increased more than the inflation showed. So is the inflation number a useful or truthfull one ?
On the other hand I don't discount the possibility that there is an increase in the energy consumption and even the oil consumption. If this would be the case then we have to conclude that EIA, IEA, API, IFP (institut français du pétrole), ..., numbers are wrong. We know they are. You've said it, these numbers are estimations based on voluntary declarations by the nations. There are other organisms providing numbers for oil productions by various other methods. One method I like is the spying method which estimates the exports of a country by cargo spotting calculating the approximate amount of oil shipped by the immersion of the vessel (alchimede's law). Others try to match import and export numbers declared by the nations and industries which can be purchased in journals or databases. Here some differences emerge. Hence the deduction that there is a black market for oil.
The black market is a huge one. You've provided a list of countries to which I would add Sudan. There is no secret that China, France, the USA and Russia are competing there for oil with all the ugly means of this competition. But what I don't know (but strongly suspect) is if Saudi Arabia has some oil on the black market. The increasing price of oil would be a powerful incentive to get some faithful customers.
In summary, GDP isn't a perfect number to measure economic activity (in the sense of production and exchange), the oil production numbers aren't a perfect measure of oil extraction and energy consumption. So I wouldn't discount WT's ELM model on the behalf of increasing world GDP. OTH the energy black market is certainly something to consider because that makes more energy available than anticipated by the ELM model. But that means also that the "economy" becomes more ruthless which in turn means that we cannot rely very much on rational behaviour to solve the beginning crisis induced by the apparent ongoing or comming peak oil.
Hi neuroil,
I really appreciate your reply, including your sharing what FF was getting at (assuming your version is fairly accurate). (For me, I just had a sense I didn't "get it", but answered anyway, and I value straightforward explanations, so thanks.) The "shadowstats" references are relevent, though, as perhaps the ones for coal would be (if I found them). The point of increasing coal use in China was covered in a NYT article some time ago.
Apart from inflation, how do you figure debt enters into the picture?
Hi Aniya,
Thanks for your kind reply and the links you provided. I like the daily reckoning site very much too.
As for debt, it is as complicated an issue as the rest. In a normal economy I would say that debt is proportionnal to the amount of confidence in the future, a sort of promise of growth. But since lending began I think that the situation took a lot of different faces. Private debt can lead to predation of wealth. State debt can lead to inflation or devaluation of money (which in fact is a more polite way to predate wealth). In recent year the debt became out of hand, completely disproportionate because people don't event know that they buy and own debt in their funds. So the banks and companies could lend as much as they would without thinking about the future nor the reality of the underlying wealth. Undoubtedly debt has contributed to the distortion of the GDP numbers. Debt is probably the achilles heal of modern economy.
But of course one day reality will take over once again ...
Edit : I swear I didn't know that gail the actuary had already written about debt while I wrote this. Anyway his post is really outstanding and should provide the new basis for this absolutely fundamental problem.
Hi neuroil,
Thanks and it's taken me a few days to get back here, so don't know if you'll see this.
re: "Private debt can lead to predation of wealth. State debt can lead to inflation or devaluation of money (which in fact is a more polite way to predate wealth)."
BTW, as far as I know, Gail is a "she". I also haven't gotten to her post yet, and look forward to it.
So, do you mean (I had to look it up) - "plundering or pillaging" - in other words, taking advantage, or even "destroying" - as opposed to making a profit (somehow) "fairly)" - ?
The odd thing about gov't. spending is - in some sense it allows the entire economic system to function, by funding a legal system (for one thing).
Yes, these are not direct money-makers (well, they are that, too, but to stay w. level one for a moment...), still they allow the market economy to function.
When it comes to energy, it seems to me the case for gov't spending for creating a climate that fosters solar and wind technologies is much stronger than any case for the roads, oil subsidies, etc. Why? Because these will be the only energy extractive/producing technologies we're left with - probably much sooner than we'd like.
Hi Aniya,
Thanks for correcting me about Gail. She is indeed going to elaborate on her analysis about debt.
Sorry for having forced you to look up words. I don't want to be difficult to understand, my language skills are a bit strained because I'm french, from dutch origin having lived in Germany a few years ... so sometimes, when I write fast, some word collisions happen in my mind which will make my text look a bit cryptic. I will try to pay a lot more attention.
But you understood me perfectly well.
Now back to the core. I do think that debt, if it is poorly managed because of false assumptions of the future can destroy wealth. In the case of private debt we witness a perfect example of how this works with the ongoing subprime crisis. People lend, they offer a warranty with their ownings. When they can't pay any more the people who lend them the money take their ownings which very often leads to a depreciation of the value of has been seized (as we can see with the plunging housing market).
In the case of government debt things are a bit more complicated. State debt, if increasing too fast and out of proportion of what can be covered by the growth of the GDP (which is happening now because of the inherent limits of the energy supply), will lead to different compensation strategies. The state must pay back what it borrows, otherwise confidence evaporates, bankruptcy and severe civil unrest will follow, war is almost certain or international sanctions will be enforced because foreign debt-holders want their money back. So everything will be done to pay back the dept. How ? By creating money or by devaluation. Both will almost always lead to inflation because creating money without creating more wealth to buy is inflationary and devaluation leads to inflation of imported goods - like essential items as oil. And inflation if it isn't met by increasing income is destruction of purchasing power, with all the negative, mostly destructive consequences.
So why does state debt increase so much ? No personal greed indeed but two things in which I agree completly with your analysis : 1) politicians have a short term incentive to get reelected and 2) they fear that too much restrictions on the budget will lead to a collapse of the well-fare state which in turn will set of an internal crisis (at least this is the line of reasoning among french politics). Now the central banks and national accountants should be the authority which should enforce limits about the increasing state debt but I fear that they are fairly ineffective. So how can we invent a system which could implement a new economy based on solar/wind as you suggest ? Well ... I don't know yet. Oil is so deeply interwoven in our current organisation that it seems almost impossible, not to say the resistance of social entropy. But I am trying to slowly spread the word among the politics in the little part of France where I live and I continue to try to sort things out.
At least this is how I understand these issues. I hope that you didn't waste your time trying to understand me, I however enjoy the exchange.
Hi Fractional,
In case you missed the references, here are a couple of sites people have referred to re: this question. My guess is there are more recent articles, but this might be a place to start.
http://www.shadowstats.com/cgi-bin/sgs/data
http://www.financialsense.com/editorials/daily/2006/0908d.html
There's also the idea (no ref. handy, sorry) about coal taking up the slack, esp. WRT manufacturing in China (for global consumers).
Very good question. I think that at least by conventional measures world GDP has increased by around 5% per year since 2005, but I can't find links to back this up.
My guess is that the world produces around 10% more goods and services for the same amount of liquid fuels as it did at the beginning of 2005.
Here is another interesting exercise:
I did an eye-ball fit to the liquid fuel consumption in the period 2002-2005. If growth had continued on that trajectory the world would be consuming around 7 MPD more than we currently do.
It appears that Global Liquid fuel consumption growth has decreased by 3.5 MPD per year since 2005.
It should be possible to model world oil price as a function of supply and economic growth, at least on average.
Average growth rate of oil production from 1985-2007.5 : 1.5%
Average growth rate of oil production from 2002-2007.5 (from above chart,includes flat period): 2.0%
At last I found a useful link.
It's from the International Monetary Fund
World economic growth in 2005: 4.5%, 2006: 5.5%, projected for 2007 5.2%.
No absolute numbers, but growth:
(source from 2006)
(source from Q1/2007)
http://science.reddit.com/info/2qdaf/comments
help us spread around Rembrandt's hard work here...
Folks, check out chart 12 of the Oilwatch Monthly, "World Liquids Exports January 2002 - June 2007. World liquids exports are the lowest since September of 2003 and appear to be going lower. They are currently almost 3.5 million barrels per day below their peak on January of 2006. If this is not a confirmation of the Export Land Model then I don't know what is.
Ron Patterson
Ron,
I posted a note on the Greenspan thread about Russian crude oil exports. I don't know about total liquids, but Q3 2007 Russian crude oil exports relative to Q3 2006 declined at a rate of 9.2% per year.
Both Saudi and Russian crude oil exports may be currently declining at rates of close to, or more than, 10% per year.
The HL plot for Russia suggests that the Russian net export decline will be similar to the UK net export decline--peak exports to net importer status in seven years.
WT: Just off the top of your head, what are your estimates for oil exports circa 2014 (top 5 exporters and amount exported)? Thanks-extreme accuracy is not expected-just a ballpark of what you are looking at.
Khebab is crunching numbers right now.
For now, the 5%/5% estimate is probaably a good rough (but probably optimistic) scenario.
In round numbers, in 2006 the top five (about half of world net exports) produced 30 mbpd, consumed 7.5 mbpd and exported about 23 mbpd (Total Liquids, EIA).
If we assume production down at 5% per year, and consumption up at 5% per year, top five net exports would be at about 9 mbpd in 2014. (Production at 20 mbpd, consumption at 11).
"Yikes!" : You really know how to make me moist -with fear! That's a very scary decline rate: think of the chaos it would cause in the ME and globally if the key exporters are unable to raise the cash to buy the food to feed their people...
Dr Michael R Smith over at EnergyFiles makes his prediction of a 'SupplyGap' by ~2014 timeframe but I don't think he has considered the ELM effect!!
http://www.energyfiles.com/oilsupplygap.html
I would make a suggestion to Khebab that he attempts a spread of inputs: low, mean(historic) and high %s for the production and consumption, OK, that gives 3 x 3=9 outcomes... This would give a nice spread of results. It will then be relatively easy to track actual NET decline and then be able to say we are on track for XYZ scenario...
[I also note that Venezuala and OPEC say they will raise production by 2012...]
Just a thought, Nick.
Khebab and westexas:
I'd like to thank you both personally for doing the grunt work on the export crisis, work which I'm incapable of doing because I never learned the math. My personal fear is that you have been much too conservative in your decline figures, that because of the increase in exporter nation refining capacity and the lack of independent oil operators to slow the decline in the exporting nations the trajectory down is going to be both quicker and harder than you are projecting.
I saw an article either Saturday or Sunday in Drumbeat that BP is shutting down its branded gasoline sales in 5 states, including Texas, because of lack of refineries nearby. It only registered this AM, but that means they are planning to close or sell the BP-Amoco refinery at Texas City, which is both old and outmoded. That's the refinery where they had the horrible explosion a couple of years ago and killed 23 people working on a construction project. The refinery has been open since the 1920's and is originally a Standard of Indiana plant. The only reason I can logicly come to is they don't expect to be able to purchase the oil to keep the refinery running.
I'm also wondering about the fate of the Lyondell-Citgo plant in Pasadena, Tx. According to today's Drumbeat Chavez has ordered PDVSA to get its funds diversified away from US dollar denominated assets-some $15 billion US. This is a bit more problematic in interpretation, but either its to prevent these assets from being frozen in a lawsuit with ConnocoPhillips et al over the heavy oil "nationalisation" or perhaps he's expecting to be added to the axis of evil. The Mexicans are trying to pin the pipeline explosions in the state of Veracruz on Venezuela, and they are worried that the funds might be frozen like the Iraqii funds were frozen during the US embargo and until last year
Without Venezuelan crude and possibly Mexican crude our import supply is very threatened in the US As I recall that's about 25% to 30% of our total imports.
And while the US may not have the military capability to occupy Venezuela and the Mexican states of Veracruz and Campeche, we certainly have enough Navy and Airforce to enforce a blockade.
Bob Ebersole
The thought of PDVSA pulling out their assets because of possibly being frozen is certainly plausible.
There is a another angle, though. The dollar his heading south, and it will probably accelerate in the next year or two regardless of what the Fed does. Warren Buffet started betting against the dollar a few years ago. Perhaps PDVSA is doing the same thing.
Hi Bob,
Just one small q, re: "blockade".
What is the strategy? i.e., how would this work (to do what?)
A few things among several that makes Export Land and optimistic model is that export of gasoline for sale will probably drop a lot faster than crude exports. We actually have a double export land crude exports then re-exports of finished gasoline and other oil products. This secondary export market will take the bulk for the drop in crude exports effectively disappearing with a few years. This is what will actually wipe out the US.
The other over optimistic assumption is that investment will either stay constant or increase in the oil industry and the oil industry itself will not face problems related to low oil supplies for its operations. We can expect that the oil industry will actually have serious problems as the oil supply becomes erratic. Since the oil industry is dependent on goods and services developed with oil on a global scale we can expect crippling shortages and supply problems to severely constrain oil production. Leading to lower production leading to..
In short Export Land is just the tip of the iceberg of self reinforcing conditions that will lower the overall oil supply esp exports and probably far more important exports of finished oil products.
Hi memmel,
Thanks, and
re: "We actually have a double export land crude exports then re-exports of finished gasoline and other oil products. This secondary export market will take the bulk for the drop in crude exports effectively disappearing with a few years. This is what will actually wipe out the US."
Any chance you could possibly (please) expand on your first sentence here?
I'm lacking enough general knowledge to get the picture. Could you perhaps expand this, and also perhaps include a specific example or two?
To have a *double* "ELM" - this seems like a red flag, and also something that could perhaps be quantified in some way. (?)
Eg. Could you explain more what you mean by "secondary export market"? and also "exports then re-exports of finished gasoline products"...do you mean by the same entities? Or by different entities?
the ELM under normal conditions shows that a slow decline in production produces an ever intreasing rate of export decline.
The 'Double ELM' mentioned above would be where the production of a production is dependent on the import of a non-renewable resource, which is undergoing a slow production decline.
So instead of the slow decline in production for the input for this good, there is the ELM imposed increasing decline rate of the imported good.
This, combined with another layer of increasing consumption leads to an extremely quick decline the availability of this good for export.
(memmel, have I understood this double ELM correctly? )
Andrew
--
slightly more worried about the state of the world than i was 6 months ago
Ron: Possibly those unable to accept that global oil supply is past peak (Euan, RR, Dave Cohen) will now accept that world exports have certainly passed peak levels. As WT states, the export number is actually the more important one for the USA.
Brian - there is a real danger is viewing this from a USA only perspective. If exports are lower 5 years hence, the impact on the USA (as a unit of polity) is probably not of much concern compared to other problems. The US remains a wealthy country and we will continue to buy as much oil as can be refined and sold as is demanded internally. Of much greater concern will be those individuals who can not afford oil products and products dependent on oil. Some of those people, no doubt, will live within the confines of the USA, but most will live elsewhere. The impact on the USA (again, as a unit of polity) will be in geopolitics, where we risk resource wars and diplomatic "issues" as the result of the US govt's attempts to assure access to oil for homegrown corporations.
Those of us who are working for a better future for people (not governments) would do best to stop thinking in nationalistic terms.
Editorial correction added
Well, to make matters worse, exporting nations are likely to be hoarding oil as well. That is, they are, or likely will be, deliberately producing less oil because they are saving it for themselves.
It's called hoarding!
Ron Patterson
Rembrandt-
Thank you for ypur hard work keeping track of all the data for us, I really appreciate your efforts.
It sure looks more and more certain that the world has passed the peak in crude+condensate production. I guess we can argue now about whether this is a geological peak or a peak caused by upstream above ground considerations-Robert Rapier's "peak lite".
Then there's my theory-the producers don't wish to pull their wells any harder for fear of harming the reservoirs and the mainstream media finds it more convenient to blame OPEC than acknowledge the truth because it will make prices overheat-I call it "peak ultra-light menthol" (sarcanol alert)
Bob Ebersole
Which of course really bites as menthol is really hard on the lungs...
One interesting thing to note is that demand in 2007 was down pretty substantially due to the mild winter. According to the IEA's OMRs, OECD demand through June was about 70mb less than the same period in 2006, whereas world production through that period was 60mb more. Those "extra" 130mb would have allowed non-OECD consumption to grow at about 2.1% without lowering their stocks. While the 5-year average non-OECD growth rate is about 3.7%, it's likely that the mild winter lowered their requirements, too.
In other words, it is not out of the question that the drop in production is largely demand-driven. Indeed, according to the IEA's August OMR (p.53), we see that total OECD stocks at the end of Jun07 were marginally higher than they were at the end of Jun06, which is not what we'd expect to see in a shortage situation.
Of course, that should hardly be surprising - oil (WTI) prices have been lower every month in 2007 than in the corresponding month in 2006. Indeed, the most recent IEA OMR notes that OECD stocks grew by 30mb in July (as compared to 22mb in July06), suggesting that there was not yet a shortage in the market as of the end of July.
It may be we're on the production downslope, but - with weather-related drops in demand in rich nations even while cumulative world production is up, and with higher and faster-growing stocks than last year - the available data is far from conclusive in that regard. Indeed, an alternative hypothesis that is entirely consistent with the data is simply that OPEC restricted supply to shore up prices, as they have done so often before. Unless we get another mild winter, though, production levels in the end of this year should allow us to differentiate between these two hypotheses.
Ace says production has steadily declined 1%/y since may 05. Do you disagree?
SA cuts began in spring 06 as oil was climbing rapidly. Not consistent with their stated objectives of the time (price too high).
80% of opec cuts were made by sa even tho they have only 30% of production, not consistent with previous actions. Cheaters produced enough that actual cut was around 500k/d... SA never objected. BTW, the 500k/d this nov is just the sa project previously announced for end 07... we'll see how long they can hold production near 9M/d.
Overall nymex price this year a little higher than last year, not lower. ANd, if you look at world prices, asian price up substantially over 06, not least because of ~10% reduced shipments from sa (contracts abrogated... now, why would they do that?)
US, asian consumption up while supply is down, price rising, IEA squawking must have more opec oil. IMO nearly every barrel that can be produced is, and not enough to hold price at year end 06 levels. I see supply problems, no doubt relieved by warm winters. Lets hope for more.
Most forecasters expected sharply more produciton this 07 thru 09. The missing barrels this year and next will help ameliorate the downslope.
Also recently, SA changed its pricing to favor the US and penalize Asia for some of it grades of crude. Is this a typical tactic among oil exporters?
http://www.arabianbusiness.com/499318-saudi-hikes-october-crude-prices (for Pitt the Elder to save me leg work later.)
I have no idea if it's typical, but it's quite possible it's sensible - Asia's economies and oil consumption is growing robustly enough that the price increase isn't likely to stifle demand. If you can get away with a higher price, why not do so?
Indeed, your article notes:
When a buyer calls a price increase "reasonable", there's less likelihood of ulterior motives at play.
Finally, it's not clear that the price decreases to the US are on the same oil grades as the price increases to Asia and Europe - the article doesn't say. If they're not the same grades, then different goods are priced differently - no big deal. If they are the same grades, one fairly obvious explanation is that Saudi Arabia is trying to avoid worsening demand destruction in the US caused by the housing-led slowdown. They've recently talked about that as a demand-side risk, and why would they want to risk injuring the goose that buys the golden eggs?
Almost none of what you're saying relates to my post.
I'm not saying oil production has not fallen.
I'm not saying Saudi Arabia has lots of spare capacity.
I'm not saying US and Asian demand is not up.
What I am saying is that cumulative production is up 0.5% for the first 6 months of 2007 as compared to the same period in 2006, and that that increase came despite a mild winter that caused rich country demand to fall 0.8% over that same period. (I'm also saying you're factually mistaken about oil prices - the link I gave goes directly to EIA's oil price table, and is easy enough to check.)
Since weather caused demand to be so low, there was no incentive to boost crude supply in the first half of this year. The big concern was refinery runs, and steadily-rising petroleum stocks suggest that the market did not have crude shortages during that time.
Of course, I'm not saying you need to believe this theory - it's also quite possible that the cuts to supply were involuntary. The fact is, though, that this demand-side theory fits the available data at least as well as your supply-side theory, and hence cannot (rationally) be dismissed out of hand simply because it gives the "wrong" conclusion.
If lower production in recent months has been due to supply constraints, then supply should remain low regardless of the winter weather. By contrast, winter would normally increase demand, and hence if production increases to match we'll know the demand-side theory was correct. The first indication of this is OPEC's quota increase for November, which is exactly what the demand-side theory would predict. By contrast, a supply-side theory with "nearly every barrel that can be produced" being produced would predict that OPEC will fail to increase production.
Why would they announce an increase that they couldn't provide, though?
Why would OPEC want to hold the price of oil at $50 when the world has shown it is more than capable of paying for oil at $70? Wasn't that exactly their stated reason for cutting production, to prevent the price of oil from holding at year end 06 levels?
Not all factors are below-ground.
Simple question.
How do you measure demand?
I look it up in IEA's monthly oil market reports. The Jun07 OECD data I used is from p.7 in the Aug07 report, for example.
Thanks for your response, I always enjoy reading your posts.
I looked at your link, I agree that it shows WTI $68.56 thru aug last year vs 64.45 this year. However, for much of this year WTI (cushing) has not reflected either world or even US prices because local refineries were down, causing a glut and full storage in OK tanks. The following link shows Louisiana sweet $4 over WTI for 3 months, sadly a six month comparison is not given. Other comparisons, especially asian, show even higher differentials; tapis shows nearly $8 higher than cushing for 3 months and $5.5 for a full year (cherry picking), no doubt due in part to sa reduced sales to asia (asia has no troops in persian gulf.)
http://www.upstreamonline.com/market_data/?id=markets_crude
However, even staying with the depressed wti comparison, if current 80 holds thru end year we will see avg this year at 69.63 vs 66.02 last year.
Regarding statements made of why produciton was cut, remember that sa said they began cutting in spring of 06 because there were no buyers, not because price was too low. World production did surge in jul/aug, but this data was not immediately available; sa continued cutting even as prices hit records in july/aug. IMO sa production has, and will continue, to follow below ground limits, including an increase late this year, supposedly in response to high price but note that they are scheduled to bring on new capacity end year, no reason to think they won't. As an aside, and correct me if I am wrong, SA cut 1Mb/d of 1.7Mb/d OPEC official cuts, overall opec is down only 500k/d, so we can say that sa cut while rest of opec boosted production; more evidence to me that everybody on the planet is pumping every barrel possible.
THere is no doubt demand in some places is being destroyed by $60+ prices. NEvertheless, demand growth in regions with higher gdp growth is, at the moment, swamping the sacrifices made in africa and elsewhere.
Thanks, although that's a bit of a surprise. I try to be accurate and informative with my posts, and I would have guessed I'm typically more acerbic than enjoyable. The content ain't gonna change, but I suspect I should work on my tone.
Absolutely. Brent would be a much better benchmark, as I understand it. Here is EIA's take on average world oil prices, but it's weekly, which makes for a lot of numbers to compare.
They have a spreadsheet version, though, and it turns out that cumulative prices over the first half of 2007 were $0.72 lower than in 2006 (all but March and June were lower), but that margin was declining all year, and 2007 has been cumulatively more expensive since the first week of August (an average of $0.19 more expensive through the end of August).
True - it's not at all clear that Saudi Arabia could have sustained 9.5mb/d even if they'd wanted to.
On the other hand, it's worth noting that the first cut was in March 2006, after the price of OPEC oil fell by 8% in February; prices then recovered to early-Feb level by the end of March. The next cut was in May; oil prices had increased about 8% in April, but fell 5% in May, so I imagine that cut forestalled a steeper decline. Production was raised - but not all the way to February levels - for July and August as price rose past and then fell back to early-May levels, and then was cut again in September and October as prices fell by over 20% between mid-August and mid-October. Prices finally stabilized in February, and Saudi production stopped falling at that point.
Looking at EIA's data on average OPEC oil price and supply together for the first time, the Saudi production cuts seem easy enough to explain by referring to the price data. Perhaps I'm simply fitting an after-the-fact explanation, but most of the production level changes seem pretty well-explained by price movements. The sign of a production change is almost always the same as the sign of the price movement since the last production change - i.e., producing less oil when it's gotten cheaper, more when it's gotten more expensive.
The only major deviation from that is the May production cut, since OPEC oil had increased in price by $10/bbl since the March cut. The cut turns out to have been reasonable, though - the price of OPEC oil fell for the next two months, only rising back to that level in June...when it was met with a production increase. So maybe Saudi Arabia simply has people who are better at predicting the movement of oil prices than I am, since even that cut makes sense in retrospect.
Obviously, this is just interpretation on my part; still, Saudi Arabia's production changes since Jan 2006 strike me as about what I would expect from someone trying to prevent prices from moving too far up or (especially) down. Occam's Razor suggests - to me, at least - that they're doing just what they claim to be doing, and just what they've done for the last 20 years. Unless we get another winter as mild as the last one, though, we'll probably learn one way or the other within the next 6 months.
Rembrandt,
What did you show for 2005 and 2006 net total liquids exports?
Also, do you have a June total net export estimate and a 2007 year to date average total net export number?
Thanks.
Just realized that it is in the PDF file.
Thanks for the update, very useful. I noticed that the Mexican production seems to have stabilized around 3.6 mbpd and is not declining anymore.
My understanding is that they started using horizontal wells on Canterell. So I think we can expect a Yibal style collapse out of Canterell and probably fairly quickly. In reading about the field it seemed that horizontal drilling would have only been useful at the very end of the fields life. The horizontal wells worked well as long as the oil column existed. Also they have added quite a bit of water handling capacity again this is from reading various sources.
The combination will slow production declines in the short term at the expense of steeper drops. Considering they waited this long to do horizontal drilling I have to think they don't expect it to work for long maybe a year or two. Otherwise they would have done it a while back to boost production.
Also it seems they are doing more sophisticated recovery methods in other fields so this should help. I don't have any exact figures but Pemex press release mention items like this in each release. The Mexican oil industry is criticized for not maximizing production but it may well have bought them a bit of time as they use them now.
Sorry for all the hearsay but its sentences here and there in multiple press releases I don't know of a single source that covers technology employed by Mexico each year.
However if we could find the information its would be a good way to look at technological effects on oil production in declining fields. And of course the decline rate post technical fixes.
Hello Rembrandt,
Thxs for the keypost and fascinating thread discussion. As mentioned by me many times before, and it may never happen, but IMO, the best way to blunt the ELM is:
-----------------------------------------
If an exporting country goes to full Peakoil Outreach, then only trades its FFs for biosolar goods, it will enjoy long run advantages. They can continue to profitably export on their Hubbert Downslope as their internal FF-consumption continually decreases.
--------------------------------------------
Of course, easier said than done because we are cultural FF-detritovores, but I believe Universal Peakoil Outreach is the best way to reform our behavioral choices. In an earlier keypost: Euan's photo of the FF-powered frozen ski-slope in the desert is exhibit A of our global madness.
How many PV panels and solar waterheaters for desert homes could have been bought instead of building and continually powering this monstrosity? How much money could have instead gone to educating their boys and girls on biosolar living and responsible zero-growth families? How much money could have been diverted to refilling the natural aquifers and oases so that when the FFs are gone: future generations might have a chance for desert survival and cameltrain trading routes?
If I was the Saudi King: every barrel exported would be offset by the importation of PV panels, bicycles, wheelbarrows, heirloom seeds, birth control pills, etc, etc.
Bob Shaw in Phx,Az Are Humans Smarter than Yeast?
WOW Yergin saying oil could hit $85, costs are up and projects being delayed. French rhetoric supporting U.S. action against Iran supporting prices. Still maintaining prices will decline when new supply hits next year but sounding more and more like he is less optimistic about supply.
Hello KansasCrude,
Do you have a link to Yergin's $85 price prediction? I would like to read the text section where Yergin gives full credit to all the ASPO/TODers' hard work! LOL!! =)
Bob Shaw in Phx,Az Are Humans Smarter than Yeast?
http://graphoilogy.blogspot.com/2007/09/daniel-yergin-on-greenspan-iraq-...
Thxs Khebab,
but I didn't see where he gave public credit to ASPO/TOD, nor where he publicly berated his staff at CERA for errors in analysis. My next guess is he will try to take the credit for yours & WT's ELM tagteam thunder next.
Bob Shaw in Phx,Az Are Humans Smarter than Yeast?
Is everybody in?
Yes, I am all in. And leveraged as well.
Meanwhile, at the margin, Rothman from ISI calling for 45 oil in today's Barron's made my heart soar. It was an eerie replay of the massive bearishness triggered when oil first crossed 40.00. It's enormously helpful however to see Rothman right here. At ISI he is advising very large institutions, and better yet, whole governments. Can you imagine how many important decision makers ISI is setting up, for "lower oil prices.?" 80.00 is really gonna open the floodgates for those calling for much lower oil. I have to pinch myself, at the thought of it!
I would also add that Yergin reiterated that there was no fundamental reason for oil to be at these levels, and only allowed oil could go to 85.00 in the near term, and for a short while. I love it. Oh how I love it. Gimme more.
In general, Yergin's appearance today on CNBC was like the appearance of of every authority figure from Greenspan to Bush, to Paulson, Bernanke and to other world leaders in the past many years. These people are not special, not talented, not insightful, and have no feeling for the future. In short, they have everything required to get ahead in our society, using the current model.
Delicious.
Gregor
For the record, I am out at the moment. I bought in big time with leverage last January when oil hit $50 and sold at $78. So I missed the last $3 of increase, I am happy with that. With prices at $81 now, the risk of a short term decline is very great:
1) normal profit taking
2) the Fed needs a good deflationary scare to keep cutting rates, encourages friends at GS to sell oil short
I plan to buy back in when oil goes back to support at $69
Smart move.
It would be nice to get SelfAgrandizedTrader's comments on the current Oil price. At about this time last year he was calling for $57 when we were all talking $90-$100.
If memory serves, he was also predicting $80 range prices for 2007.