| DrumBeat: August 14, 2007 | The Oil Drum | The Resurgence of Risk – A Primer on the Developing Credit Crunch |
Oilwatch Monthly - August 2007
Posted by Rembrandt on August 14, 2007 - 10:10am in The Oil Drum: Europe
The August edition of Oilwatch Monthly can be downloaded at this weblink (PDF, 1.40 MB, 19 pp). New are historical charts portraying production back to 1930, shown next to the production developments from 2002 - present.
Latest developments:
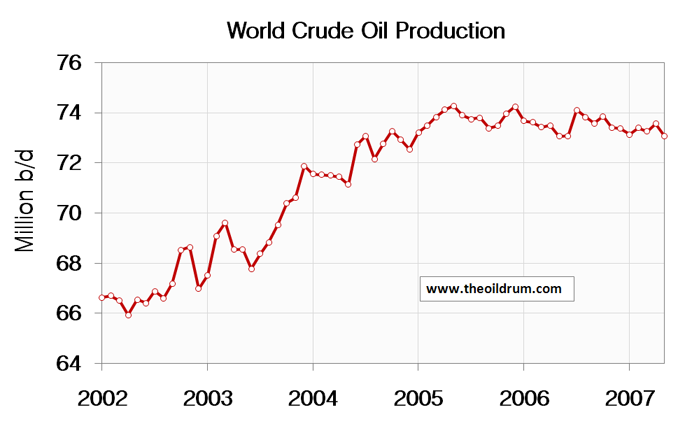
1) Crude oil - Production of crude oil decreased by 503,000 b/d from April to May. Total production in May was estimated at 73.06 million b/d by the Energy Information Administration (EIA), which is 1.21 million b/d lower than all time high crude oil production of 74.27 million b/d reached in May 2005.
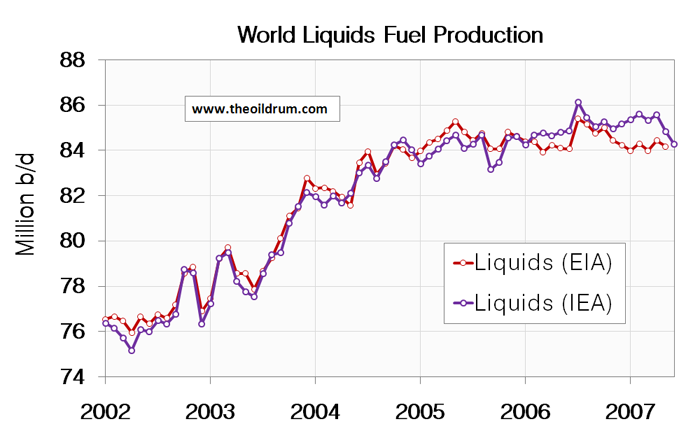
2) Total Liquids- Production of all Liquid fuels decreased by 550,000 barrels per day from May to June, according to the latest figures of the International Energy Agency (IEA). Resulting in total world liquids production of 84.28 million b/d, which is 564,000 b/d lower year on year from June 2006 to June 2007 and 1.85 million b/d lower than all time maximum liquids production of 86.13 million b/d reached in July 2006.
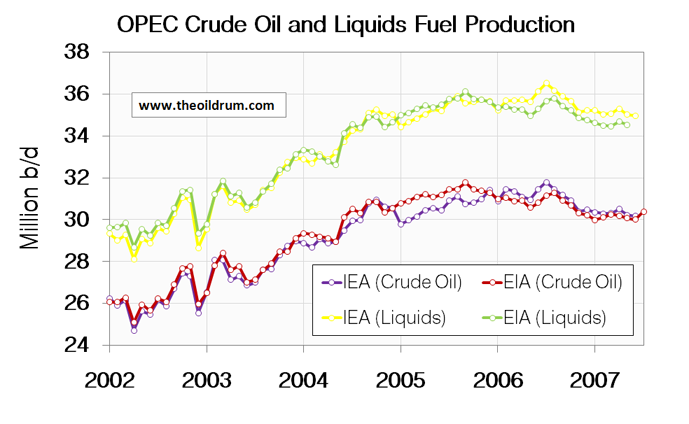
3) OPEC - Total crude oil production of the OPEC cartel decreased by 50,000 b/d to a level of 30.16 million b/d from May to June, according to the latest estimates of the IEA. Preliminary figures from the EIA show an increase of 370,000 b/d from June to July resulting in OPEC crude production of 30.37 million b/d.
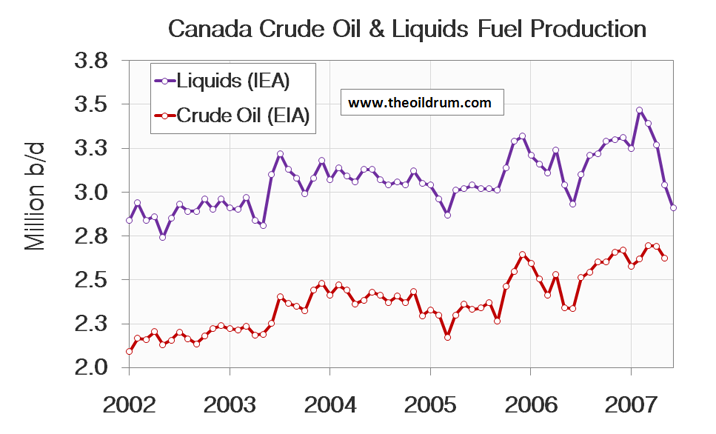
4) Non-OPEC - Total liquids production of non-OPEC decreased by 460,000 b/d from May to June, according to the latest figures of the IEA. Production has dropped from 50.57 million b/d in February to 49.31 million b/d in June. The overall production decrease in June resulted mainly from declining production in Canada (130,000 b/d), the United Kingdom (140,000 b/d) and Norway (370,000 b/d). Mexican production increased with 30,000 b/d in June.
A selection of charts from this edition:


Personnel
Editors
Contributors
Peak Oil Primers
Archives
- November 2010 (3)
- October 2010 (6)
- September 2010 (4)
- August 2010 (7)
- July 2010 (6)
- June 2010 (7)
- May 2010 (2)
- April 2010 (8)
- March 2010 (4)
- February 2010 (6)
- January 2010 (3)
- December 2009 (5)
- November 2009 (8)
- October 2009 (12)
- September 2009 (6)
- August 2009 (5)
- July 2009 (11)
- June 2009 (8)
- May 2009 (16)
- April 2009 (10)
- March 2009 (7)
- February 2009 (10)
- January 2009 (15)
- December 2008 (9)
- November 2008 (9)
- October 2008 (9)
- September 2008 (13)
- August 2008 (10)
- July 2008 (14)
- June 2008 (23)
- May 2008 (16)
- April 2008 (12)
- March 2008 (16)
- February 2008 (9)
- January 2008 (13)
- December 2007 (13)
- November 2007 (16)
- October 2007 (22)
- September 2007 (8)
- August 2007 (9)
- July 2007 (16)
- June 2007 (8)
- May 2007 (7)
- April 2007 (7)
- March 2007 (10)
- February 2007 (10)
- January 2007 (12)
- December 2006 (9)
- November 2006 (15)
- October 2006 (4)
- September 2006 (5)
- August 2006 (5)
- July 2006 (9)
- June 2006 (5)
- May 2006 (10)
- April 2006 (9)
- March 2006 (13)
Vital Trivia
License

This work is licensed under a Creative Commons Attribution-Share Alike 3.0 United States License.
http://science.reddit.com/info/2ey3i/comments
if you are so inclined...
Thanks for putting this together. Enlightening and scary.
The OPEC liquids trend is a joke considering the rate demand is increasing.
LADIES and GENTLEMEN,
let me draw your attention in the left-hand corner to the PROOF that the world, for all intents and purposes
HAS ALREADY PEAKED
Here we have the chart that shows
in an unequivical manner
that exports are off
OVER 5%.
This is of course, a subjective peak. But, like I said, this is the proof that we have reached an **effective** peak.
Verification will come with:
Year on year exports drop 5%.
Month to month crude production drops over 5%.
Month on month all liquids drops over 5%.
Year on year all liquids drops over 5%.
It will take n+1 years appr. to reach each of these verification steps.
2011 will be the year that there will be no possible doubt that 2005/6 was peak.
Just remember the Golden Years, all you who are at the top!
Cheers, Dom
Peak: Wow. Exports already back to 2003 levels. WT appears to be right on target.
Welcome to the Summit.
Enjoy the view.
From here, no matter which way you go, it's all downhill.
Interestingly, the recent drop in production is ocurring without any "above-ground" factors like a huricaine or an Iraq production decline.
The crude oil chart especially has had a number of attempts at breaking to new highs that have failed. This suggests that new projects can create temporary bumps but that it just isn't enough to increase overall production.
One thing that struck me is that the volatility in output for 2005-07 is low compared to 2002-04. To me that suggests that everyone is pumping at capacity without large increments of supply being taken out or added (compare Stuart S's analysis of Saudi output.) The bumpy plateau isn't very bumpy and one wonders whether the descent likewise will be gradual -- at least until a big field like Ain Dar waters out.
I think we will have to wait till late summer of 2008 to see how peak oil will play out. At that point potential demand should be excess of supply. Export Land seems to be running in full force and feed back loops or correlations caused by tight oil supply will begin to have more effect etc.
Right now we basically can't afford any sort of "event" hurricane etc by late next summer we should be having problems with events. Which means of course if we have a bad hurricane next year things will get interesting. On the semi-plus side the global economy should be really cooling down by then with the US in recession so we should see if this helps to slow oil consumption. In my opinion the years after 2008 will be similar to what happens in 2008. While 2007 is sort of the last year of relatively cheap oil.
I think the key will be when major shortages develop without outside events and I think summer 2008 is the earliest we could see these again with the caveat of no major events.
Whats amazing right now is we are probably one major world event away from really expensive oil even a cold winter would probably be sufficient. Its a bit strange that right now both our oil supply and monetary system are susceptible to a single calamity. Next year I think our global food supply will also be in the same boat with one bad harvest sufficient to cause a crisis.
So in 2008 we will have three key parts of our economy under threat or having problems oil money and food a hell of a trifecta.
"Its a bit strange that right now both our oil supply and monetary system are susceptible to a single calamity."
The idea that a massive credit cycle peak and Peak Oil could occur at roughly the same time is very scary. The credit cycle, no problem, we can get over it with a depression or recession, but could PO have come at a worse time?
Given the mood of the people, the denial is likely to last longer and the chances of a serious response to the problem are diminished.
You say a 2008 peak, but the chart of global liquid is not showing any upside momentum. I think we are at peak oil now. A strong month next month could change my mind, but as it looks at this moment, I think we passed it. Any significant leg down and price will react to the upside. Odds are we get a Carribean hurricaine or a cold winter that has an effect.
Just note I'm not saying a 2008 peak but it takes years after peak before the effects of decline begin to be felt. If we peaked in 2005 then 2008 is the first year when what I call post peak forces are really beginning to have effect. Once we have insufficient oil for potential demand then the condition is in place even less oil does not change the dynamics.
I think the critical factor is how much demand destruction is caused by a faltering global economy. I happen to think it will not be that much or more important lack of investment in the oil industry will drop oil supply faster than economic induced demand destruction. So if you include this effect I think that lower prices from demand destruction wont happen.
So you can see how in 2008 the factors the will influence oil prices for the next several years will be in place.
Right now we still are in effect living off our credit cards from the financial bubble so we won't know how a reasonable economy will respond until later in 2008.
"Its a bit strange that right now both our oil supply and monetary system are susceptible to a single calamity."
A global recession will cause demand to drop. Prices will drop and production will not increase. But the prices will not induce additional exploration and development.
I think eventually growing emerging markets will mop up the excess at low prices. For nations who are too deep in the credit crunch, they will see oil prices drop for a while and the prices rise as the productive nations mop up excess. The nations stuck in depression/recession will see inflation at the same time. What is a central banker to do in this situation?
I happen to doubt prices will drop that much if at all. What will drop is investment in the oil industry because of uncertainty about future prices plus OPEC will continue to pull back production especially KSA which would I'm sure be happy to have real reserve production if they have peaked.
We will see next year. But I'd be surprised if prices drop below 70 and expect them to stay in a 70-100 band between major events. The weakest post peak argument is that demand destruction will cause prices to drop. Since this means demand will drop under supply which does not make a lot of sense given a lot of pent up demand already exists for cheaper oil.
This is conventional wisdom but it assumes that a recession lowers production faster than production drops naturally. If production drops faster than consumption drops due to the recession, prices can actually increase during an economic downturn.
In short, you have limited yourself to thinking in terms of when oil was plentiful. It is less plentiful now and there may be consequences depending on if/when consumption intersects production declines.
"The greatest shortcoming of the human race is our inability to understand the exponential function." -- Dr. Albert Bartlett
Into the Grey Zone
Not strange at all. You may think they aren't related, but in fact they are. The credit crunch is partialy caused by peak oil and wouldn't happen otherwise.
Follow me... At the root of this credit crunch are the "twin debts" of the United States (external and internal debts). Those debts were what made americans poorer, and forced them into debt. Since the government didn't want a recession, it made cheap credit available to its people, that took advantage of it. Then, after cheap credit was not enough, because there was nobody to get it, it started to undervalue risks, so even people that didn't afford credit could get it, what leads directly to now.
Now, what was the cause of the twin debts? Expensive imports and a bad government. Ok, a bad government (responsible for the internal debt) isn't a fault of peak oil, but expensive imports (responsible for the external debit) are caused exactly by expensive oil.
Does anyone know how much extra money went into buying oil over the last 4 years say vs a price of 20 dollars a barrel and how this would effect the economy. TPTB claim its had no effect but they also claim a lot of things that simply are not true. I agree I think the effects have been masked by the huge amount of liquidity thats been pumped into the system. Once this stops I think we will find that 70 dollar oil did and does have a real effect on the economy.
One aspect that makes me think its had a big effect is even with the debt boom we have seen US car makers not do that well. This tells me that in general people have not been able to afford cars unless they used home equity loans for the purchase. It seemed from the outside that US car purchases where tightly tied to the HELOC craze and not any sort of general gain in income.
On the other side since buying and selling goods simply moves money around its seems that high priced oil causes capitol to be concentrated and slows the velocity of money for daily business. So it seems that in might be a big factor in the overall concentration of wealth. Since the ME countries tend to reinvest in big companies etc we have wealth flowing from the middle class through the Middle East and back out into the hands of the banks and other wealthy people for reinvestment for a fee.
The recent concentration of wealth is obvious but I don't think people have looked at the role that expensive oil plays in the process to me it seems to be a big drive in causing concentration of wealth.
The timing of current correction is in my mind worst case.
People start believing that the lower growth in GDP will reduce oil demand. - Oilprice will fall.
OPEC will at its september meeting use this now popular theory and keep quotas unchanged.
Now they got an excuse not to raise production, if oil was 85, and stocks low, they would have to raise quotas, and as many believe would have a hard time actually producing to quota. They would have been called on their bluff.
The more times we have high oilprices, that "always fall again" the harder it will be to pursuade people to change their way of living, once the rising cost of oil "Is for real"
If there is to be a recession before PO is accepted mainstream, the cushion (in the form of wasted oil) will be gone once the news about PO is accepted.
If people realized PO today, it would be much easier to saved 5 mbpd, and we would have much more time.
In two or three years (I expect a full blown recession would give us this time before the daily lack of oil would cause attention) people are living on basics, and we are no longer at the top of the peak with steady or -1% production.
We might be on the slope down with -2% annually!
I truly hope that the market will recieve soo much liquidity that it will survive.
Adding liquidity might be as temporary a fix as wetting you pants when cold, but once PO is fully understood I don't think these exstra billions in fictious money will make any difference.
Anything that will delay PO awareness is a BAD THING as it gives us less time to react.
Rune
check my posting below, canada dropped 500,000 barrels in 5-6 months with NO warning or news.
any insight into canadas liquids dropping like a rock?
That's interesting, I haven't heard anything about declines in Tar Sand Land.
i dont think it is purely tarsandland. canada crude is way past peak, but tarsandland may be soaking up all the investment... (but my hindbrain says no rational investor would ignore real benefits especially when the MR is above the ATC, so WTF?)
The largest 6 month loss in OECD supply is from canada, why is there NO NEWS ON THIS. I SEE NO information on this. Nothing in the news, or anything.
This is distressing for me, very distressing. No factors are mentioned at all. Canada lost pretty much 1/6th of its production.
Is this caused by oilsands scaling? (are inputs greater than output??)
EDIT when i get back to school i will talk to one of my profs, he worked for shell for 20 years, he may have some insight.
The data show the decline coming from non-conventional liquids, but then a closer look reveals that the liquids number is IEA and the crude number is EIA so perhaps these are not directly comparable. Maybe this is "noise" but one wonders. There are limiting factors in the oil sands including signficantly the diluent used to make the crude transportable by pipeline, so production would be subject to significant declines from time to time given the complexity of the operation up there.
More generally, there is a drop in IEA figures that makes them closer to EIA's one than before. They have splitted for almost one year, making the plateau being much more conspicuous in EIA's figures than in IEA's. I've never seen any explanation for that. IT seems that much of the recent decrease can be explained by the drop in non conventional Canadian oil alone. Was there something wrong in the way IEA counted tar sand production? (hope for them it's not just a silly extra zero in some excel table ;) ).
Regarding Figure 7 for Canada, I don't understand the big drop from February 2007. Below is the chart I get using the last EIA (up to May 2007) and NEB numbers (for Tar Sands and Crude Oil + condensates (C+C)):
NEB's projections do not indicate a big drop (unless it's coming from the NGPL category).
What's NGPL?
Natural Gas Pipeline Company of America (NGPL)???
Natural Gas Plant Liquids: Propane, butane etc...
Basically, NGL minus lease condensates:
(ref)
I've never looked at this closely before today. The Katrina signal comes loud and clear in the last third of 2005. I saw a recent article indicating our exposure grows by the hour - something like a hundred square miles a year of coastline are dissolving due to nutria clean cutting vegetation and wind/wave action. Pipelines that used to be in the middle of a marsh are now standing in 6' of water ... and not built to take a good sized surge, let alone the stuff a surge drags along with it.
We've got one rowdy storm in the Atlantic headed for our Gulf, an organized swirl of aircraft carriers making trouble in another Gulf, and suddenly my limited stock of fuel and extra food seems not nearly enough.
There is also Invest 91L that just materialized in the Gulf off Cuba.
http://www.wunderground.com/tropical/
Cheer up, the latest projections have it heading for the Atlantic coast instead, according to the best oil patch site www.therigzone.com .But we've got hot water in the Gulf, and plenty of time left in the hurricane season. I'd also like to note that these are computer models, not a storm track. With storms this big anything can happen, all the weathermen can give you is a projection based on past experience and observations over a 75 year period. There are just too many variables, no matter what anybody claims on TV.
Bob Ebersole
Forgive me for being so blunt, but what in the hell is there to 'cheer up about' when it comes to hurricane strikes? I swear, some people almost WANT a hurricane to strike the gulf coast again. But I suppose we should be GRATEFUL that this one is headed towards the Atlantic, where it might strike those on the eastern coast. Lives mean nothing if it punishes oil production it seems...
Oil Man Bob lives in the other major US city destroyed by a hurricane, Galveston.
Perhaps a bit of gallows humor lite ?
Best Hopes for High Sheer Winds,
Alan
PartyGuy,
I live in Galveston, but it seems that at least half of the hurricanes that go into the Atlantic end up not hitting land and disipating in cold northern waters. Any hurricane in the Gulf hits either the US, Mexico or Cuba. I'm sorry if you live on the East Coast.
And, frankly I resent your implication that I care more about oil production than people. That's a slur, and unnecesary.
Bob Ebersole
I read that the loss of land in the delta is the lack of silt deposits. The straight fast shipping channels don't allow silt build up the way a slow meandering stream does.
thomas deplume,
That's a definite factor, along with the levees that keep the silty flood waters out of the marsh. Also, dams on trbutaries up stream trap silt, and the Gulf of Mexico has been subsiding since the paleozoic. Sediments compact too.The canal dredging for the intercoastal and all the marsh wells causes salt water incursion, plus oil and gas production sometimes causes subsidence, and also fresh water wells for industry and cities.
Pointing fingers and arguing about who to blame isn't confined to any one American problem, in fact is it an American problem.
Bob Ebersole
Rembrandt,
This is excellent work. If I could recommend one thing at this point it would be to order your graphs from highest to lowest in production rather than by region, or organization(OPEC). The data is usually presented in the order I just described and sometimes it makes it hard to understand the totality of the numbers. This might be helpful in differentiating your presentation.
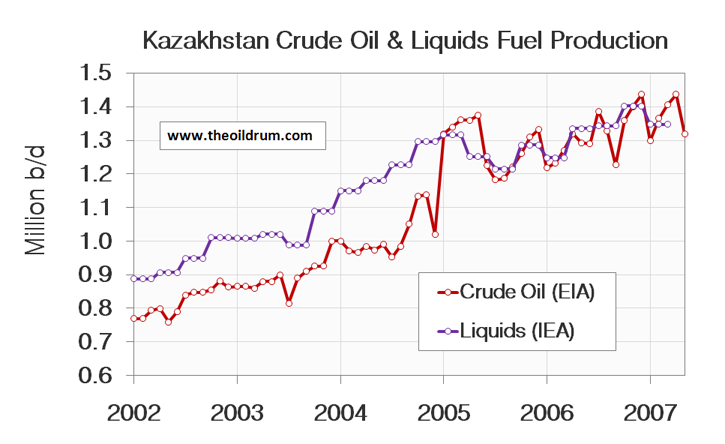
Also, where do you get your monthly IEA Kazakh and Azeri numbers? They seem to group these two under FSU "other." Wait, I know, you probably actually read the reports :) Nice work.
@Echelon
The IEA Kazakh and Azeri numbers are from the quarterly publication by the IEA for the OECD called oil, gas, coal and electricity.
Thanks Rembrandt!
Also there is this report of the UAE figures being overstated.
http://www.gulf-times.com/site/topics/article.asp?cu_no=2&item_no=165431...
I don't really understand this news article. The EIA data says UAE produced 2,515,000 bpd (2,525 thousand barrels).
All of the dow jones figures seem off by a factor of 10? Does anyone have further data on the UAE?
If the article really meant to say dropped to 800,000 that would still be major news. It would take the UAE out of the top 10 exporters.
Using the 2005 to 2006 data from the IEA there is a -3.8% change in the top 10. Which is very fast, and not at all predicted by Stuart Staniford's "hubbert is a slow squeeze" article.
http://www.eia.doe.gov/emeu/cabs/topworldtables1_2.htm
However, if we use the 800,000 value for the UAE then the drop was -8.4% for the top 10 exporters which makes Samsam Bakhtiari (5%) look like an optimist. And it begins to put us the dangerous line between difficult adaption and collapse outlines in Stuart's "4% or 11% who cares?" post.
Time for a closer look at the UAE.
Jon Freise
Analyze Not Fantasize -D. Meadows
Khabab did a linearization of the UAE, but stated it did not behave well. Looking at his work, it would seem production should have trended down to follow the curve. Maybe it really did?
http://static.flickr.com/76/230245715_74a7a33291_o.png
http://graphoilogy.blogspot.com/2006/09/hubbert-parabola.html
Is the UAE dependent on one major field for most of it's production? Could it be doing a Cantrell?
Jon Freise
Analyze Not Fantasize -D. Meadows
The post you linked is a guest post from Roberto Canogar.
Ah, how embarrassing. My apologies to Roberto.
@gTrout
Dubai is a part of total UAE production. Next to Bahrain, Sharjah and Abu Dhabi. The part that Dubai produces in total UAE production is 240,000 b/d according to the news article, or one tenth of total UAE production.
The largest chunk of UAE production comes from Abu Dhabi (2+ million b/d)
But OPEC's Market Indicator Reports still show UAE output at 2.541 mbpd for June, up from the 2.53, 2.5, 2.497, 2.474, and 2.5 production from May back to Jan this year. Do these UAE numbers reflect the 160kbpd loss in Dubai or are they based on the UAE government's official position of 240k for Dubai?
There are new projects planned for the UAE:
Sometime between 2010-2013 the UAE was supposed to peak and then go into decline -- no plateau. Months ago I posted some articles in TOD indicating this commentary from emirate sources that I can no longer find.
Dubai is in trouble, they are one of the emirates. It has long been known they were going to be out of oil someday.
Yesterday I commented about Russia's situation. I think I wrote that Western Siberia was in a production decline. I should have reported that it was expected to go into decline by the time the Eastern Siberian reserves are brought on full stream. That was the sense from the articles I read. I could not report I know for sure. The data is not available for public inspection ... it is from reading numerous internet articles from Russian sources and trying to get a sense of it from the stream of comments.
Look how tight Figure 6 is...

____________________
myspace
This report reminds me of what the guy said in the movie "Independance Day" as he was sitting in his car in NYC watching the flames roar thru the city; "Ohh, Crap".
I read the pdf link and eyeballed all the charts. I'm not an oil guy, but I can read a chart, and there is considerable pucker factor here from what I can see. The only question I have is: Is any of this dropoff since 2005 or so due to conservation, or alternative fuels growth supplanting the traditional fossil fuels?
Gene, over the last two years prices have gone up from the $40-$50 dollar range to around $70/bbl. Conservation and consumption figures don't indicate a drop in demand, although there's a lot of demand distruction in the poorest countries. Oh, Crap is very appropriate, read Stoneleighs Key Post too.
Bob Ebersole
Bob, I've been following Stoneleighs thread on the credit crunch if that's the one you're referring to. It's getting to the point where the daily flood of bad news is nearly overwhelming, and it's a chore just to try to make some kind of sense out of it. I retired from the corporate ratrace (aerospace) in 2000 and now pursue my long time desire to make stuff out of wood, but still don't like what I see happening in the world since then. Not much I can do about it tho, except keep on keepin' on. I don't reckon the wife and I will starve, but we have certainly cut back on entertainment and such.
I would like to know why the top lines are so much in step with the bottom lines.
The 703.06 mbd and 503k reduction is an annualised reduction of 4.1%, no?
But it's foolish to draw a line through only two points and make a measurement.
Lots of great charts!
One minor detail. They would be more readable for me if something like
width= "80%"
were added to the code used to display the graphs. As it is, the graphs run off the edge, unless I click on them to display them in another window.
in firefox i just use set my view to not use pagestyles then i full pagewidth glory. (with some stuff above/below the article)
Looking at many of the 'total' charts:
A Peakist would say "look here, there's a definate rounding of the production curve -if not a decline then this at least looks like a plataeu..."
An Economist would say "The market demand is still there at the recent high prices so why should any exporter raise production thus lowering the price they get for each unit of their product?"
A LATOC believer would say "stock up on corned beef now, the end is nigh" :o)
Seriously though -I would like to ask if there is or can be a definate 100% sign in the charts that something very serious was happening. Chartists have attempted to find hidden signals in historical charts of asset prices for years and have a variety of methods -Wedge formations, etc, etc. I'm not saying that any of these methods would be the slightest of use but if we have any chartists out there I would be interested to see their interpretation of these charts (pretending for a moment that they just represented an asset...)
Regards, Nick.
Why didn't the exporters tink about this earlier? The fact is that an independent exporter has no reason to not sell all it can, and the independent exporters did sell all what they could untill now. But a cartel can intentionaly restrict its production. So, that economist is saying that the non-OPEC production has already peaked.
That is a quite good explanation for the current situation, and there is no clear difference between a non-OPEC peak and a worldwide peak. We could expect a slower decline if OPEC has still some capacity left, but we have no idea on how fast the decline would be anyway.
Your economist argument is wrong. The picture is far more complex than that.
In any market you raise production not because you want less revenue but because you expect to get the same or more. It is only if supply exceeds demand at the current price that price falls.
Instead we have seen steadily increasing prices indicative of higher demand at the same production levels meaning that they could increase production by some amount and get the same or close to the same value possibly earning more revenue.
The problem is lots more complex than you assert and subject to the difference between demand at a given price and supply at that price versus demand at another price and supply at that other price. Do you really believe that if KSA produced 200K more bpd that the global price would collapse? I don't and KSA would be that much richer. This is why cheating always occurred in OPEC when they had the capacity to cheat. Now that many of them are in decline or at plateau they cannot cheat so easily.
"The greatest shortcoming of the human race is our inability to understand the exponential function." -- Dr. Albert Bartlett
Into the Grey Zone
But at the same time, they recognize (finally) that they have a finite resource and even if they could pump more now and maintain price and therefore make more money, the price will undoubtedly be higher if they pump it next year or next decade. So unless they absolutely need the revenue now, there is reason to wait. Considering the continuing falling value of the dollar, to pump now, convert that resource into today's dollars, and watch that asset devalue while the asset in the ground continues to increase in value would be foolish.
Remember "The market is well-supplied, and current prices do not reflect market fundamentals."
Thanks Rembrandt for this update.
Figure 1: the difference between the EIA and the IEA estimates for all liquid production has increased lately especially for 2007-Q1/Q2, do you know why? it seems to come from Non-OPEC production (Figure 4).
Saudi Arabia has been around 8.6 mbpd for 4 months now, seems that their production cut is voluntary after all.
How does it show that? They have had new projects come on-line in that time, while losing exports due to increasing internal consumption, ideally wouldn't they wish to increase production to maintain exports?
They may have chosen not to produce all of their new available capacity or perhaps they are using it to maintain their current production level with some buffering from storage to maintain the constant 8.6 mbpd. I can't see how it proves anything either way.
Mexico has also managed to keep production pretty steady so using this logic they are not in decline either.
Which raises an interesting question. From the chart above, it looks like the OPEC quotas are based on production, not exports, so countries with significant and rising internal demand are slowly squeezed on exports if quotas remain flat, like now. Is there any attempt to adjust quotas for internal consumption?
Why doesn't the quota get more weight in these discussions? The fact they have been precisely tracking their quota for the past year, and for the past several months as the quota has been flat, surely suggests it is likely voluntary.
Now if production were to actually dip below quota, that would seem like a far more significant indicator of real decline than anything that is happening now. Of course in that event the quota could be adjusted proactively to track the decline and so still make it look voluntary...
The fact is, these charts give the illusion of accuracy, but not true accuracy.
No one here or at the IEA or EIA or anywhere else outside of Saudi Arabia knows how much they've been producing. The whole point of not allowing independent verification is to be able to manipulate data.
The evidence put together by Staniford, Simmons, etc. is of far more value in figuring out the probabilities than any of these reports.
Governments have a huge interest in obscuring the reality of peak oil. Obscuring reality limits hoarding and panic price spikes.
@Moe_Gamble
Your picture on the oil market is incorrect. It is quite well known how much crude oil ships from Saudi Arabia. A tanker doesn't just get "lost" when it arrives in Asia, Europe or America. Little possibilities for manipulating data there.
There is ofcourse the possibility, as suggested by Simmons, that Saudi Arabia is drawing down their own stocks and shipping that oil to obscure production drops. The extent to which this can be done however is small, if it happens at all (I don't think it does).
Twilight in the Desert, p. 81:
"Some of the information streaming in to the data vacuum [caused by the Saudi veil of secrecy over its oil production data] came from a new class of energy consultants, 'Tanker Traffic Counters.' Emerging as the leader in this new field was a Geneva-based firm called Petrologistics, which still claims to have harbor spies at all major loading ports watching tanker liftings and guessing at the tankers' destinations. Reports from Petrologistics estimating export volumes became a first source of OPEC production volumes. As strange as this may sound to people outside the international oil industry, Petrologistics, as far as anyone has been able to discover, has one key employee, Conrad Gerber; he heads the firm, counts the tanker traffic, and feeds the data to various media sources."
If you think Gerber is a reliable source of data, we have very different ideas of what makes a reliable source.
Rembrandt, I've heard rumors of Iraqui crude being taken across the Turkish border to be shipped, plus tanker owners buying stolen Nigerian crude at a fence's price and taking it elsewhere. The whole market is murky
Bob Ebersole
Just in case that doesn't make it murky enought let's not forget the issue of there being a shortage of refineries to handle the nastiest thick sulphurous crude. So KSA may have excess capacity that no one wants. Yet.
Not really. Rembrandt is correct in my estimation.
The incidence of murkiness covers only a small fraction of the market.
The quote from Simmons that Moe_Gamble posted above has always been an interesting one. I've always been skeptical about it. For two reasons.
The first is that all Saudi oil(and most Gulf oil) is transported by tankers of two varieties through one narrow choke point which is both entry and exit for the tankers. My rough estimation is 16-18mpbd. Which then move via three basic main routes. Asia, Horn of Africa-US, Suez to either Europe or US. So one person in either Oman or UAE with a telescope could probably count the 10-15 tankers a day.
Plus the oil ends up in the same basic three or five places. Louisiana, Le Havre, Chiba. Some gets piped across Saudi to the Red Sea port, some gets offloaded south of suez and piped across Egypt to Sidi Barir. But the locations are few and there are too many opportunities for the stuff to be independently counted.
The second reason is that there are too many analysts tracking too many things who are coming to very similar conclusions independently about the tanker business for the situation to be as simple and as un-accounted as Simmons suggests. A quick glance at a few of the reports on the ship-broker websites should verify this. There are at least ten major ones. There are highly detailed numbers published on a weekly basis about what ships are where. How many are loading and how many are idle. I can't imagine Saudi or any of these Gulf States being able to hide much.
KSA has a pipeline to the red sea quite a bit of oil goes through that. Also a lot of finished products move through the gulf. It may be non trivial to determine if a tanker is carrying crude or say fuel oil. I don't know for sure but I've seen the tanker estimates revised. I doubt its as trivial as your making it out to be. And what about ships that come through at night or in a fog ?
On that note you would think sailing through the gulf would be fairly public so you should be able to get this information.
I'd think the spotters would be more to verify a tanker was on schedule.
These ships carry a lot of crude so +/- one tanker makes a difference.
Production did drop below quota on the way to 8.6 mmpd. The quota followed production down, in fact, the graph shows that in the period 2002-present, it is the first time that SA production has been at or below quota.
According to one set of numbers, but not the other. Please, lets not massage the data any more than necessary to prove a point, shall we?
The fact that OPEC has been lowering quotas of course means nothing. I'd not read to much into the quotas. The have in the past shipped well over quota and just recently under quota and at quota all the time changing the quota.
Now back to decline. Its a falsehood to state that because decline flattens or plateau's temporarily that KSA is not in decline. Since the main focus in KSA is a few large fields and some new production we can readily expect periods when they can keep production flat and even slight increases. But these are temporary and in general probably last less than hsix months or so before decline overwhelms efforts to offset it. Certainly not for a whole year. If KSA continues flat for at least six months I'd wager that they had some excess production that was brought online.
And finally for KSA they generally are fairly conservative with production simply pushing their fields can probably get the and extra 500kbd or so. I suspect this is whats happening right now until the US summer driving season is over afterwards I think they will be forced to rest their fields and you will see declines continue.
So my opinion is we may be seeing KSA producing flat out right now. If I'm right then you will see them drop production again by November at the latest probably by about 500kbd if not more. And further more you probably will see them go on a normal decline curve through the winter which sets them up for a small boost next summer again probably around 500kbd but probably from a base thats 1mbd lower then current production. I would be surprised now if we see any increase in production out of KSA until we get a token one next summer from a lot lower overall production level.
Their production cuts can be considered voluntary because it has not deviated from a set amount for the better part of a year now. This would be an impossible feat if they were truly declining, hence the fact there is less noise about the Saudi decline today...
I totally agree. However, something tells me that you are not going to convince a lot of these people here that the cuts are anything but a well-orchestrated conspiracy to hide the "true" nature of Saudi production.
The very simple explanation that Saudi Arabia has been producing almost exactly 8.6 mbpd for the 7 months now because this is their OPEC quota minus two targeted cuts seems to carry no weight. This amount is also exactly 32.5% of the total OPEC quota, which it has always been for at least the last 10 years.
The cuts were made for the express reason of lowering global production so as to maintain high prices. As OPEC leader, Saudi Arabia knew that it couldn't press cuts on the other OPEC members when it was itself overproducing by 500,000 bpd. So it lowered its production in 2006 to its quota level prior to orchestrating the targeted cuts of November and February.
Throughout 2006, KSA maintained that the market was fully supplied and that there was not the desired demand for its heavy crude. They continually stated this. They also voiced the opinion that the high price in 2006 was largely the result of geopolitical fear and factors and speculation. In retrospect looking at the severe price drop from July (following the Lebanese war) to January we know that this was in fact the case.
The Saudis stated what the situation was and acted accordingly with voluntary cuts. I don't think this scenario could be any more obvious. Nothing has to be proven except the notion that these "drops" are involuntary or the result of terminal geologic decline.
The speculative ruminations in such posts as that by memmel above are a bunch of nonsense based on nothing even remotely verifiable. And if one looks closely at the "facts" used in such arguments, one will see they are anything but.
We will see my speculation predicts more production declines from KSA fairly soon.
No nonsense about it. If you have read my previous posts I've mentioned a few times that I think they have some spare capacity they try to keep even as they decline in production.
I think its less than 1mbpd and the plateau can easily be explained by removing most of the spare capacity over the last few months. Since we don't know for sure how much they held in reserve its hard to tell when it will be "used up". But if they really are in decline I can't see them keep the current rate into the winter.
Say what you want but its wrong to assume that they did not try and keep a cushion even if they are in decline since they are desperate to maintain the image of being the swing producer. They had no reason to not drop production at the natural decline rate while maintaining a swing cushion.
This is a very sensible move on their part. Also its what I would do :)
Now a leveling in production implies they are slowly eating into this cushion. At some point they will hit a level that they believe does not give them credible short term swing production ability then they drop production again say by 500kbpd.
So for KSA you should see this stair step down with brief surges of a few months at best if we have a real emergency.
If KSA is in decline this seems to be the most reasonable approach they could make. The key is they periodically have to adjust production downward but as long as they have a cushion they can time when this occurs over a fairly broad range.
All I can say is this is what I would do if I where them.
So far they have dropped production significantly and managed to keep a lot of people believing they still can work miracles so you have to give them some credit they are not stupid. And the bullshit economic arguments are just that this is a political game making money is not at the top of the list and these guys are very good at it.
I don't understand what this means. Are you saying that we will understand what exactly you are speculating soon, or simply that your predictions will prove correct soon?
What size declines exactly? How soon?
No offense, but your "predictions" seem to cover just about anything statistically probable. No matter what happens you could come back and say that you are right. Please predict something in a way that can be tested and is verifiable.
I don't mean to be sarcastic here, but to me this is what your argument sounds like(paraphrasing) - "Saudi Arabia is definitely in decline and they almost definitely can't raise production, but if they do it's because they have some capacity that they've been hiding from us."
What is this? What is excess production? Do you mean the spare capacity that is quite clearly stated as existing by the EIA, IEA, and the Saudis? I understand the arguments here that this spare capacity is fiction and that one would be a fool to believe it exists, but seriously, if they were to use it, it wouldn't exactly come as a surprise, would it? I mean since they've been saying it is there all along and most of the world has been counting on it for the last 30 years.
Take a spreadsheet program. Make a matrix with it. Lay out barrels of oil per day across the top columns. In say, 2 mbpd increments from 7 mbpd to 10mbpd. Now lay the price of oil from $50 to $90 in $2 increments down the left hand side. Multiply everything out and tell me what you get for 9.6mbpd @ $50/barrel versus 8.6 mbpd @ $60/barrel or $70. You can explain to me why it is a "bullshit economic argument" after you explain why Saudi Arabia would want to pump more oil so they can make less money.
I'll need some commas to be sure, but in the meantime I would say that some might disagree, that money is in fact at the top of the list. And secondly, you suggest here that this is about politics and money. So geology has nothing to do with it? What are you saying? This seems to contradict the rest of your argument.
What is this "stair step"? As opposed to random wild swings in a production profile to acheive a certain level - the ones which are observable exacly nowhere in the oil-production world? Again, I have no idea what it is you refer to. production has been maintained at a steady 8.6 mbpd level since February, prior to that it was at a steady 9.5/9.6 mbpd level. In between production was lowered in a controlled manner by 1mbpd.
What is that? Does such a beast exist? Or more precisely what exactly would be normal to you in this case and when is this going to start? Do you mean 8% annually? If you are going to say "soon," at least be kind enough to say a couple of months or a couple of years.
This is simply ridiculous. First of all I'm not assuming much, I'm looking at observable data. It is also pure speculation and doesn't even make sense. You don't even know if there is a measurable natural decline rate. And if there was, they would have every reason to lower production according to a different rate. They had to get from 9.6 mbpd to 9.1(quota) to minus 380kbpd(first cut) to minus 150kbpd(second cut) by specific dates. Seems like reason enough to me to ignore nature. But again, this isn't speculation, this is what happened.
I am not making predictions or "believing" that Saudi is capable of this or that. I honestly don't know what the situation is. I am simply trying to make clear that what happened makes sense and it is what they said they were going to do before they did it.
We will see. As I post below I think that a few bucks one way or another now for a barrel is not high on KSA's agenda. If the world is post peak Oil will be well over 100 a barrel soon so it not a huge issue. Probably a bigger concern for them on the financial front is if the dollar can continue to retain its value over the next few years or the way things are going months.
On the political side I think they are deeply afraid of what will happen if their populace discovers they have peaked.
What this points to is managing their decline to ensure they maintain a cushion. Which leads to a step function on the way down.
The algorithm is actually used in computer science I don't remember its real name its often called HLWM but you have high water and low water marks say in a big region of allocated memory. On the high side you leave a pretty big buffer basically flood stage. But once the system crosses the high water mark you start actions to reduce usage until it drops below. On the low water side you reduce say the size of the memory pool for oil production this would be dropping production when a price goes low.
So all I'm saying is they are using this algorithm to manager their oil production since it meets all major factors that concern them.
On the outside since they have spare capacity and a understanding of the decline rates in production they have plenty of time to decide when to increase or decrease production with in the range. But if this is correct then they will have to make another cut at some point in the fairly near future to maintain the cushion. By the nature of the algorithm the exact time is variable thats the whole point it buys them time.
On the outside you would think they would have to cut again sometime this winter and the probably need to prepare for a token surge next summer. Given the way the economy is going I think they will probably cut once oil start heading down to 60 and the US finally admits its in a Recession. That is the most opportune time. For now they have to wait till at least after Hurricane season. Also they can make several cuts it need not be one large one.
Their public statements have repeatedly brought up low water cases price/supply etc etc etc. This is what made me think about the algorithm in the first place. Next it makes sense that if they really are in decline they would adopt a strategy that buys them as much time as possible.
This approach fits very well with all the data and my ordering of priorities. Production using this algorithm and assuming that the have to deal with a shrinking pool results in a stair step like production pattern bonded by the real maximum production rate. Lets say they have a 8% decline rate and they cut production from peak by say 16% this gives them a 8% cushion. If they could do that then they could hold production flat for a year then do another 16% cut.
They have cut production by about 10% and we have read statements that they have a decline rate of between 8% and 2% so they have a pretty decent cushion but no way will it last a year without another cut. At least 2% or more.
I wish I could be more precise but this algorithm is perfect for hiding this sort of information. And I'm assuming they are playing this very smart the key is they have to cut sometime next winter if we are reasonably close on our estimates and they will only increase production for a short time under dire emergencies.
Texas and the Lower 48 as a Model for Saudi Arabia and the World (Posted in May, 2006, using production data through 2005)
http://www.energybulletin.net/16459.html
http://graphoilogy.blogspot.com/2007/07/net-oil-exports-and-iron-triangl...
Net Oil Exports and the "Iron Triangle"
By Jeffrey J. Brown
Let me know when Saudi Arabia exceeds 9.6 mbpd (crude + condensate) for a calendar year. Meanwhile, the current flat production rate = lower crude oil exports, because of rapidly increasing domestic consumption. At their current rate of increase in consumption, Saudi Arabia will need, in about 14 years, another two mbpd of production, just to meet domestic demand.
One thing about KSA is selling oil for money is just part of the game they are playing and in general its not the import part.
I posted above what I think they are doing but its important to consider the parts of the game they are playing.
1.) Maintain the illusion of being a swing producer.
2.) Hide the true nature of their reserves.
3.) Manage public opinion especially internally.
4.) Wean their internal economy off oil.
5.) Manage investment in the oil infrastructure and downstream operations ( move away from selling crude)
6.) Keep the addicts hooked and paying and not moving off oil.
7.) Maximize profits given the above.
So in my opinion focusing on a simplistic economic model when you consider KSA is foolish it plays a small role in what they need to do over the next decade if they can get away with it.
And yes given the above I'd be shocked if we ever see even 9mbd out of KSA again.
@Khebab
One of the main factors is Canada, you can spot the others in the charts in the pdf (bit busy at the moment).
I wouldn';t be so sure about calling their production cut voluntarily or not. The decline profile of Ghawar is likely in phases, as suggested by Stuart and Euan.
"And in Baghdad, dozens of uniformed gunmen in 17 official vehicles stormed an Oil Ministry compound and abducted a deputy oil minister and three other officials, a ministry spokesman and police said."
Bring them on!
"And in Baghdad, dozens of uniformed gunmen in 17 official vehicles stormed an Oil Ministry compound and abducted a deputy oil minister and three other officials, a ministry spokesman and police said."
Bring them on!
.
See my above posts the key question is if KSA is in decline how will the manage it ? Thats the question that needs to be asked.